Sustainable subdivisions - Construction Innovation
Sustainable subdivisions - Construction Innovation
Sustainable subdivisions - Construction Innovation
- No tags were found...

Create successful ePaper yourself
Turn your PDF publications into a flip-book with our unique Google optimized e-Paper software.
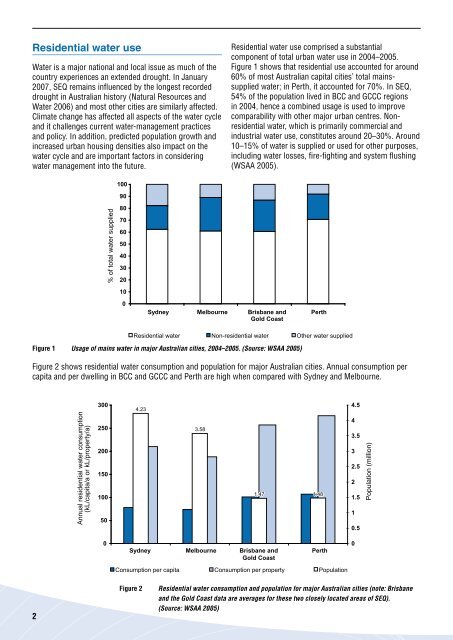
Residential water useWater is a major national and local issue as much of thecountry experiences an extended drought. In January2007, SEQ remains infl uenced by the longest recordeddrought in Australian history (Natural Resources andWater 2006) and most other cities are similarly affected.Climate change has affected all aspects of the water cycleand it challenges current water-management practicesand policy. In addition, predicted population growth andincreased urban housing densities also impact on thewater cycle and are important factors in consideringwater management into the future.Residential water use comprised a substantialcomponent of total urban water use in 2004–2005.Figure 1 shows that residential use accounted for around60% of most Australian capital cities’ total mainssuppliedwater; in Perth, it accounted for 70%. In SEQ,54% of the population lived in BCC and GCCC regionsin 2004, hence a combined usage is used to improvecomparability with other major urban centres. Nonresidentialwater, which is primarily commercial andindustrial water use, constitutes around 20–30%. Around10–15% of water is supplied or used for other purposes,including water losses, fi re-fi ghting and system fl ushing(WSAA 2005).10090% of total water supplied80706050403020100Sydney Melbourne Brisbane andGold CoastPerthResidential water Non-residential water Other water suppliedFigure 1 Usage of mains water in major Australian cities, 2004–2005. (Source: WSAA 2005)Figure 2 shows residential water consumption and population for major Australian cities. Annual consumption percapita and per dwelling in BCC and GCCC and Perth are high when compared with Sydney and Melbourne.3004.234.5Annual residential water consumption(kL/capita/a or kL/property/a)250200150100503.581.47 1.4843.532.521.510.5Population (million)0Sydney Melbourne Brisbane andGold CoastPerth0Consumption per capita Consumption per property Population2Figure 2Residential water consumption and population for major Australian cities (note: Brisbaneand the Gold Coast data are averages for these two closely located areas of SEQ).(Source: WSAA 2005)