Commercial Buildings - Center for Sustainable Systems - University ...
Commercial Buildings - Center for Sustainable Systems - University ...
Commercial Buildings - Center for Sustainable Systems - University ...

You also want an ePaper? Increase the reach of your titles
YUMPU automatically turns print PDFs into web optimized ePapers that Google loves.
<strong>Center</strong> <strong>for</strong> <strong>Sustainable</strong> <strong>Systems</strong><br />
<strong>Commercial</strong> <strong>Buildings</strong><br />
<strong>University</strong> of Michigan<br />
440 Church Street, Ann Arbor, MI 48109-1041<br />
phone: 734-764-1412 fax: 734-647-5841<br />
email: css.info@umich.edu<br />
http://css.snre.umich.edu<br />
<strong>Commercial</strong> buildings include, but are not limited to, stores, offices, schools, churches, gymnasiums, libraries, museums, hospitals, clinics,<br />
warehouses, and jails. The design, construction, operation, and demolition of commercial buildings impact natural resources,<br />
environmental quality, worker productivity and community well-being. Existing strategies offer tremendous opportunities <strong>for</strong> enhancing<br />
the overall sustainability of these structures.<br />
Patterns of Use<br />
� <strong>Commercial</strong> buildings consumed 19% of all energy in the U.S. in 2009. 1<br />
� 4.9 million commercial buildings in the U.S. covered 72 billion sq ft of floor<br />
space in 2003 – an increase of 28% in number of buildings and a 40%<br />
increase in floor space since 1979. 2<br />
� By 2035, commercial building floor space is expected to reach 109.8 billion<br />
sq ft – a 53% increase over 2003 levels. 3<br />
� Four activities dominate the commercial buildings sector – education,<br />
mercantile, office, and warehouse/storage – comprising 60% of total<br />
commercial floor space and 51% of buildings. 2<br />
Resource Consumption<br />
Energy Use<br />
� In 2008, the commercial sector consumed about 18.4 quadrillion BTUs of<br />
primary energy – a 74% increase over 1980 levels. 4<br />
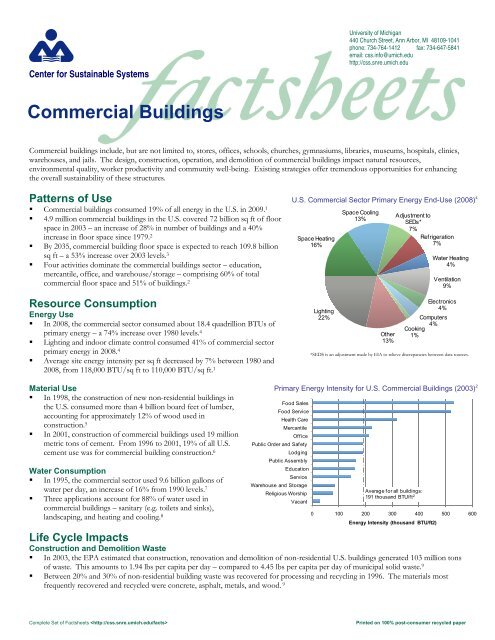
� Lighting and indoor climate control consumed 41% of commercial sector<br />
primary energy in 2008. 4<br />
� Average site energy intensity per sq ft decreased by 7% between 1980 and<br />
2008, from 118,000 BTU/sq ft to 110,000 BTU/sq ft. 1<br />
Material Use<br />
� In 1998, the construction of new non-residential buildings in<br />
the U.S. consumed more than 4 billion board feet of lumber,<br />
accounting <strong>for</strong> approximately 12% of wood used in<br />
construction. 5<br />
� In 2001, construction of commercial buildings used 19 million<br />
metric tons of cement. From 1996 to 2001, 19% of all U.S.<br />
cement use was <strong>for</strong> commercial building construction. 6<br />
Water Consumption<br />
� In 1995, the commercial sector used 9.6 billion gallons of<br />
water per day, an increase of 16% from 1990 levels. 7<br />
� Three applications account <strong>for</strong> 88% of water used in<br />
commercial buildings – sanitary (e.g. toilets and sinks),<br />
landscaping, and heating and cooling. 8<br />
Food Sales<br />
Food Service<br />
Health Care<br />
Mercantile<br />
Public Order and Safety<br />
Public Assembly<br />
Education<br />
Warehouse and Storage<br />
Religious Worship<br />
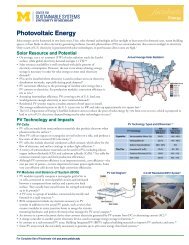
U.S. <strong>Commercial</strong> Sector Primary Energy End-Use (2008) 4<br />
Space Heating<br />
16%<br />
Primary Energy Intensity <strong>for</strong> U.S. <strong>Commercial</strong> <strong>Buildings</strong> (2003) 2<br />
0 100 200 300 400 500 600<br />
Complete Set of Factsheets Printed on 100% post-consumer recycled paper<br />
Office<br />
Lodging<br />
Service<br />
Vacant<br />
Average <strong>for</strong> all buildings:<br />
191 thousand BTU/ft 2<br />
Energy Intensity (thousand BTU/ft2)<br />
Life Cycle Impacts 9<br />
Construction and Demolition Waste<br />
� In 2003, the EPA estimated that construction, renovation and demolition of non-residential U.S. buildings generated 103 million tons<br />
of waste. This amounts to 1.94 lbs per capita per day – compared to 4.45 lbs per capita per day of municipal solid waste. 9<br />
� Between 20% and 30% of non-residential building waste was recovered <strong>for</strong> processing and recycling in 1996. The materials most<br />
frequently recovered and recycled were concrete, asphalt, metals, and wood. 9<br />
Lighting<br />
22%<br />
Space Cooling<br />
13%<br />
Other<br />
13%<br />
Adjustment to<br />
SEDs*<br />
7%<br />
Refrigeration<br />
7%<br />
Water Heating<br />
4%<br />
Ventilation<br />
9%<br />
Electronics<br />
4%<br />
Computers<br />
4%<br />
Cooking<br />
1%<br />
*SEDS is an adjustment made by EIA to relieve discrepancies between data sources.
Indoor Air Quality<br />
� Volatile Organic Compounds (VOCs) are found in concentrations 2 to 5 times greater indoors than naturally occurs in the<br />
environment. High exposure to VOCs can result in eye, nose, and throat irritation; headaches, loss of coordination, nausea, and<br />
extreme effects if concentrations are high enough, such as cancer or damage to the nervous system. VOCs are emitted into<br />
commercial buildings through carpet adhesive, paints, paint strippers, and other solvents; aerosol sprays; cleansers and disinfectants;<br />
and dry-cleaned clothing. 10<br />
Greenhouse Gas Emissions<br />
� The combustion of fossil fuels to supply energy to commercial buildings resulted in the emission of 1,018 million metric tons of<br />
carbon dioxide (CO2) in 2009. This represented nearly 19% of all U.S. CO2 emissions in that year. 3<br />
Solutions and <strong>Sustainable</strong> Alternatives<br />
Opportunities<br />
� Find ways to reduce environmental impacts and energy use during building operation – when a majority of building impacts occur.<br />
For example, in as little as 2.5 years of operation, commercial buildings may consume more energy than was required <strong>for</strong> material<br />
production and construction combined. 11 Consider workplace awareness initiatives on recycling, energy and water conservation.<br />
� Consider opportunities to purchase energy from renewable sources to reduce fossil fuel use and emissions. Additional strategies <strong>for</strong><br />
reducing building energy impacts include the use of passive solar heating and lighting, low emissivity windows, structural insulating<br />
panels, and energy efficient landscaping.<br />
� Utilize renewable materials to improve sustainability and indoor air quality while reducing environmental impact and maintenance<br />
costs. The use of porous materials <strong>for</strong> paved surfaces can reduce pollution and erosion caused by stormwater runoff.<br />
Design Guidelines and Rating <strong>Systems</strong><br />
� The Leadership in Energy and Environmental Design (LEED) 12rating<br />
system developed by the U.S. Green <strong>Buildings</strong> Council provides a<br />
system <strong>for</strong> evaluating overall building per<strong>for</strong>mance. The LEED system<br />
assigns points to buildings based on design attributes that reduce<br />
environmental or energy impacts. Additional in<strong>for</strong>mation and resources:<br />
http://www.usgbc.org/LEED<br />
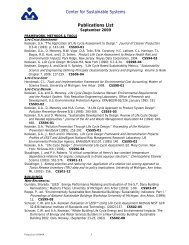
LEED Registered Green Building Projects* in the U.S:<br />
New Construction 12<br />
� The Net-Zero Energy <strong>Commercial</strong> Building Initiative, sponsored by the U.S.<br />
Department of Energy (DOE), is a government research program focused<br />
on improving the energy efficiency of commercial buildings in the United<br />
States. Additional in<strong>for</strong>mation and resources:<br />
http://www1.eere.energy.gov/buildings/commercial_initiative<br />
� The U.S. EPA Energy Star buildings program provides recognition and resources<br />
to assist organizations that have committed to continuous energy efficiency<br />
improvement. Additional in<strong>for</strong>mation and resources: http://www.energystar.gov<br />
Cite as: <strong>Center</strong> <strong>for</strong> <strong>Sustainable</strong> <strong>Systems</strong>, <strong>University</strong> of Michigan. 2011. “<strong>Commercial</strong> <strong>Buildings</strong> Factsheet.” Pub. No. CSS05-05. September 2011<br />
1-99<br />
100-199<br />
200-299<br />
300-399<br />
400+<br />
*30,116 <strong>Commercial</strong> Projects Were LEED Registered as of March 2011<br />
Case Studies<br />
� The Samuel Trask Dana Building, a 100 year-old structure located on the Ann Arbor campus of the <strong>University</strong> of Michigan, was<br />
recently renovated to improve energy and environmental per<strong>for</strong>mance. Added or enhanced building attributes include on-site<br />
photovoltaic electricity generation, natural lighting, radiant cooling, composting restrooms, selective materials use (cork, bamboo,<br />
linoleum, recycled glass, recycled plastics, biocomposites), and reclamation/reuse of original building materials. 13<br />
� The National Park Service recently renovated the visitor center at Zion National Park in Utah. The result was a 70% reduction in<br />
energy use achieved through the design and implementation of natural ventilation, efficient lighting, window glazing, insulation,<br />
passive cooling, Trombe walls, photovoltaics, energy-efficient landscaping, and digital energy management systems. 14<br />
� The American Institute of Architects recognized Twelve West in Portland, Oregon as one of the top ten green projects of 2010. This<br />
mixed-used commercial and residential structure received a LEED platinum rating and was designed to achieve the highest levels of<br />
urban sustainability. A large solar water heating system and wind turbines help to reduce fossil fuel use while efficient fixtures, low<br />
water roof plantings and rainwater recycling reduce water use. Simulations suggest an energy savings of over 45% above code and<br />
water savings of 47% compared to similar sized structures (complete top ten lists are available at http://www.aiatopten.org). 15<br />
1 U.S. DOE, Energy In<strong>for</strong>mation Administration (EIA) (2010) Annual Energy Review 2009.<br />
2 EIA (2006) 2003 <strong>Commercial</strong> <strong>Buildings</strong> Energy Consumption Survey.<br />
3 EIA (2011) Annual Energy Outlook 2011.<br />
4 U.S. DOE, Office of Energy Efficiency and Renewable Energy (2011) 2010 <strong>Buildings</strong> Energy Data Book..<br />
5 McKeever, D.B. (2002) Domestic market activity in solid wood products in the United States, 1950-1998. Gen. Tech. Rep. PNW-GTR-524. Portland, OR: USDA, Forest Service, Pacific Northwest Research Station.<br />
6 Portland Cement Association (2003) United States Cement Industry Fact Sheet, 2003 Edition.<br />
7 U.S. Geological Survey (1998) Estimated Use of Water in the United States in 1995.<br />
8 U.S. General Services Administration (1999) Water Management Guide.<br />
9 U.S. Environmental Protection Agency (EPA) (2003 and 1998) Characterization/Estimation of Building-Related Construction and Demolition Debris in the United States.<br />
10 EPA (2007) An Introduction to Indoor Air Quality – Organic Gases (Volatile Organic Compounds - VOCs).<br />
11 Sheuer, C., G.A. Keoleian, and P. Reppe (2003) “Life cycle energy and environmental per<strong>for</strong>mance of a new university building: modeling challenges and design implications.” Energy and <strong>Buildings</strong> 35, 1049-1064.<br />
12 U.S. Green <strong>Buildings</strong> Council (2008 and 2011) “About LEED.” Presentations.<br />
13 School of Natural Resources and Environment, <strong>University</strong> of Michigan (2003) “The Greening of Dana.”<br />
14 U.S. Department of Energy (2003) “Zion National Park Visitor <strong>Center</strong>, Case Study.”<br />
15 American Institute of Architects (2011) “AIA’s Top Ten Green Projects.”