<strong>CLIVAR</strong> – Spa<strong>in</strong>Paleoclimatenear the sequence studied, or to a different sensitivity of the local vegetation that would <strong>de</strong>term<strong>in</strong>e a variableresponse <strong>in</strong> the signal to the same disturbance.The arid nature of the YD also shows up <strong>in</strong> the mar<strong>in</strong>e records, as is the case of the Alghero-Provençalbas<strong>in</strong> [Jiménez-Espejo et al., 2007 and 2008]. Some <strong>in</strong>dicators suggest that this period was associated with ahigh variability <strong>in</strong> river transport, with peaks that would <strong>in</strong>dicate higher erosion, when arid conditions weredom<strong>in</strong>ant. The YD is represented by a 3ºC cool<strong>in</strong>g <strong>in</strong> the record of Alboran SST [Cacho et al., 2001] and byan <strong>in</strong>crease <strong>in</strong> primary productivity, both <strong>in</strong> the Alboran Sea [Bárcena et al., 2001] and <strong>in</strong> the Alghero-Provençal bas<strong>in</strong> [Jiménez-Espejo et al., 2008]. These changes have been associated with a strengthen<strong>in</strong>g of thewater <strong>in</strong>flux from the Atlantic caused by an <strong>in</strong>tensification of local w<strong>in</strong>ds, a situation that gave rise to verticalmix<strong>in</strong>g and fertilisation of the surface waters.In the mounta<strong>in</strong>s of the Pen<strong>in</strong>sula, post-LGM mora<strong>in</strong>ic sequences have been <strong>de</strong>scribed and some ofthem have been ascribed to the YD. However, there are still no absolute chronologies that confirm that thisphase of glacier advance really corresponds to the YD. The available records seem to <strong>in</strong>dicate that the durationof the YD had a consi<strong>de</strong>rable diachrony at regional level, with several <strong>in</strong>ternal phases. However, higherresolution records with accurate chronologies are necessary to better characterise these differences.3.3.- The 8.2 kyr event and abrupt Holocene climate variabilityMost Holocene climate records show rapid oscillations, from <strong>de</strong>ca<strong>de</strong>s to hundreds of years, thatsignificantly altered climate conditions although, aga<strong>in</strong>, with marked regional differences [Mayewski et al.,2004]. The oscillation that has attracted most <strong>in</strong>terest is the so-called 8.2 event, the most <strong>in</strong>tense Holoceneevent <strong>in</strong> the Greenland record but with large regional variability <strong>in</strong> terms of tim<strong>in</strong>g and impacts. [Rohl<strong>in</strong>g andPalike, 2005]. In the context of the IP, this event is not evi<strong>de</strong>nt <strong>in</strong> most of the cont<strong>in</strong>ental pollen sequences.However, <strong>in</strong> some examples an <strong>in</strong>crease <strong>in</strong> the aridity associated with the 8.2 event has been suggested, asobserved <strong>in</strong> Laguna Med<strong>in</strong>a, Cadiz [Reed et al., 2001] <strong>in</strong> the south or Lake Estanya [Morellón et al., 2009] <strong>in</strong>the northeast. In the Pyrenees it appears as an arid and cold event [González-Sampériz et al., 2006] althoughthe col<strong>de</strong>r temperatures are not evi<strong>de</strong>nt for at least the w<strong>in</strong>ter and spr<strong>in</strong>g seasons accord<strong>in</strong>g to the Lake <strong>Red</strong>órecord [Pla and Catalán, 2005]. Despite the relative scarcity of paleoclimate records that show the impact ofthe 8.2 event, there are archaeological evi<strong>de</strong>nces that <strong>in</strong>dicate a change <strong>in</strong> the distribution of prehistoricsettlements <strong>in</strong> the Ebro Valley at this time. At around 8.2 kyr BP, a wi<strong>de</strong>spread <strong>de</strong>population of the low landareas of the SE Ebro valley (the region known as ‘Bajo Aragón’) occurred, synchronous to the appearance ofnew settlements at higher altitu<strong>de</strong> <strong>in</strong> nearby mounta<strong>in</strong>ous areas. This evolution has been associated with an<strong>in</strong>crease <strong>in</strong> the aridity that forced the groups of hunter-gatherers to move to areas less limited <strong>in</strong> waterresources [González-Sampériz et al., 2009]. This example highlights the significantimpact that a relativelymo<strong>de</strong>st climate oscillation can have on the <strong>de</strong>velopment of human societies.The 8.2 event can be i<strong>de</strong>ntified more clearly <strong>in</strong> the mar<strong>in</strong>e records. Reconstructions of Alboran seasurface temperatures <strong>in</strong>dicate a cool<strong>in</strong>g of about 1ºC [Cacho et al., 2001] (Fig. 2). This event has also beenassociated with a drop <strong>in</strong> the mar<strong>in</strong>e productivity of the Alghero-Balearic bas<strong>in</strong> [Jiménez-Espejo et al., 2008].But the greatest change <strong>in</strong> the western Mediterranean Sea associated with the 8.2 event is a phase of bottomwater ventilation, thus end<strong>in</strong>g the last great phase of relative stagnation that had started with the <strong>de</strong>glaciation[Cacho et al., 2002; Rogerson et al., 2008]. These mar<strong>in</strong>e data would confirm that the 8.2 event would havebeen accompanied by a change <strong>in</strong> the regional climate towards greater aridity and cooler temperatures whichwould potentially strengthen the formation of western <strong>de</strong>ep waters.More recent research papers po<strong>in</strong>t out that the 8.2 is not the only Holocene rapid climate variabilityevent, but that a whole series of events took place. Some of them are evi<strong>de</strong>nt with greater <strong>in</strong>tensity than othersand seem to be easier to correlate between different records (Fig. 2). For example, there are three Holoceneevents that stand out <strong>in</strong> the Alboran Sea record because of their <strong>in</strong>tense cool<strong>in</strong>g (8.2 kyr, 5.5 kyr and 1.3 kyrBP) and they occurred dur<strong>in</strong>g relatively arid phases (Fig. 2). However these three cold events are not the most<strong>in</strong>tense <strong>in</strong> other records more sensitive to aridity fluctuations, show<strong>in</strong>g other Holocene events with comparableor even greater aridity. That is an <strong>in</strong>dicator that the <strong>in</strong>tensification of the cool<strong>in</strong>g and of the aridity were notproportional, and that some aridification phases occurred <strong>in</strong> periods with relatively high temperatures (Fig. 2).In any case, more high resolution and well-dated sequences would be necessary to establish regional climatechange patterns with precision dur<strong>in</strong>g the Holocene.17
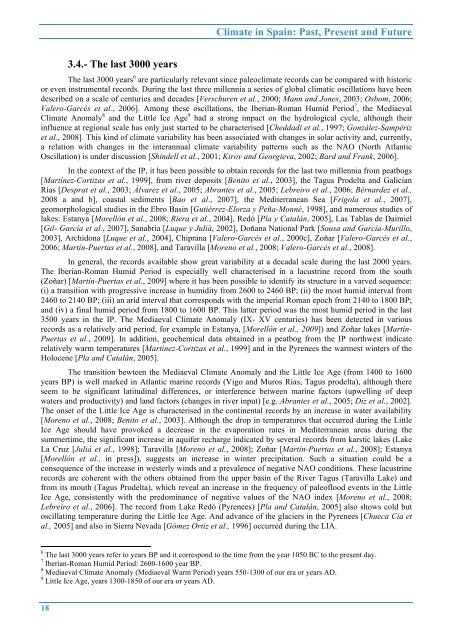
<strong>Climate</strong> <strong>in</strong> Spa<strong>in</strong>: <strong>Past</strong>, <strong>Present</strong> and Future3.4.- The last 3000 yearsThe last 3000 years 6 are particularly relevant s<strong>in</strong>ce paleoclimate records can be compared with historicor even <strong>in</strong>strumental records. Dur<strong>in</strong>g the last three millennia a series of global climatic oscillations have been<strong>de</strong>scribed on a scale of centuries and <strong>de</strong>ca<strong>de</strong>s [Verschuren et al., 2000; Mann and Jones, 2003; Osbom, 2006;Valero-Garcés et al., 2006]. Among these oscillations, the Iberian-Roman Humid Period 7 , the Mediaeval<strong>Climate</strong> Anomaly 8 and the Little Ice Age 9 had a strong impact on the hydrological cycle, although their<strong>in</strong>fluence at regional scale has only just started to be characterised [Cheddadi et al., 1997; González-Sampérizet al., 2008]. This k<strong>in</strong>d of climate variability has been associated with changes <strong>in</strong> solar activity and, currently,a relation with changes <strong>in</strong> the <strong>in</strong>terannual climate variability patterns such as the NAO (North AtlanticOscillation) is un<strong>de</strong>r discussion [Sh<strong>in</strong><strong>de</strong>ll et al., 2001; Kirov and Georgieva, 2002; Bard and Frank, 2006].In the context of the IP, it has been possible to obta<strong>in</strong> records for the last two millennia from peatbogs[Martínez-Cortizas et al., 1999], from river <strong>de</strong>posits [Benito et al., 2003], the Tagus Pro<strong>de</strong>lta and GalicianRías [Desprat et al., 2003; Álvarez et al., 2005; Abrantes et al., 2005; Lebreiro et al., 2006; Bérnar<strong>de</strong>z et al.,2008 a and b], coastal sediments [Bao et al., 2007], the Mediterranean Sea [Frigola et al., 2007],geomorphological studies <strong>in</strong> the Ebro Bas<strong>in</strong> [Gutiérrez-Elorza y Peña-Monné, 1998], and numerous studies oflakes: Estanya [Morellón et al., 2008; Riera et al., 2004], <strong>Red</strong>ó [Pla y Catalán, 2005], Las Tablas <strong>de</strong> Daimiel[Gil- García et al., 2007], Sanabria [Luque y Julià, 2002], Doñana National Park [Sousa and García-Murillo,2003], Archidona [Luque et al., 2004], Chiprana [Valero-Garcés et al., 2000c], Zoñar [Valero-Garcés et al.,2006; Martín-Puertas et al., 2008], and Taravilla [Moreno et al., 2008; Valero-Garcés et al., 2008].In general, the records available show great variability at a <strong>de</strong>cadal scale dur<strong>in</strong>g the last 2000 years.The Iberian-Roman Humid Period is especially well characterised <strong>in</strong> a lacustr<strong>in</strong>e record from the south(Zoñar) [Martín-Puertas et al., 2009] where it has been possible to i<strong>de</strong>ntify its structure <strong>in</strong> a varved sequence:(i) a transition with progressive <strong>in</strong>crease <strong>in</strong> humidity from 2600 to 2460 BP; (ii) the most humid <strong>in</strong>terval from2460 to 2140 BP; (iii) an arid <strong>in</strong>terval that corresponds with the imperial Roman epoch from 2140 to 1800 BP;and (iv) a f<strong>in</strong>al humid period from 1800 to 1600 BP. This latter period was the most humid period <strong>in</strong> the last3500 years <strong>in</strong> the IP. The Mediaeval <strong>Climate</strong> Anomaly (IX- XV centuries) has been <strong>de</strong>tected <strong>in</strong> variousrecords as a relatively arid period, for example <strong>in</strong> Estanya, [Morellón et al., 2009]) and Zoñar lakes [Martín-Puertas et al., 2009]. In addition, geochemical data obta<strong>in</strong>ed <strong>in</strong> a peatbog from the IP northwest <strong>in</strong>dicaterelatively warm temperatures [Martínez-Cortizas et al., 1999] and <strong>in</strong> the Pyrenees the warmest w<strong>in</strong>ters of theHolocene [Pla and Catalán, 2005].The transition bewteen the Mediaeval <strong>Climate</strong> Anomaly and the Little Ice Age (from 1400 to 1600years BP) is well marked <strong>in</strong> Atlantic mar<strong>in</strong>e records (Vigo and Muros Rías, Tagus pro<strong>de</strong>lta), although thereseem to be significant latitud<strong>in</strong>al differences, or <strong>in</strong>terference between mar<strong>in</strong>e factors (upwell<strong>in</strong>g of <strong>de</strong>epwaters and productivity) and land factors (changes <strong>in</strong> river <strong>in</strong>put) [e.g. Abrantes et al., 2005; Diz et al., 2002].The onset of the Little Ice Age is characterised <strong>in</strong> the cont<strong>in</strong>ental records by an <strong>in</strong>crease <strong>in</strong> water availability[Moreno et al., 2008; Benito et al., 2003]. Although the drop <strong>in</strong> temperatures that occurred dur<strong>in</strong>g the LittleIce Age should have provoked a <strong>de</strong>crease <strong>in</strong> the evaporation rates <strong>in</strong> Mediterranean areas dur<strong>in</strong>g thesummertime, the significant <strong>in</strong>crease <strong>in</strong> aquifer recharge <strong>in</strong>dicated by several records from karstic lakes (LakeLa Cruz [Julià et al., 1998]; Taravilla [Moreno et al., 2008]; Zoñar [Martín-Puertas et al., 2008]; Estanya[Morellón et al., <strong>in</strong> press]), suggests an <strong>in</strong>crease <strong>in</strong> w<strong>in</strong>ter precipitation. Such a situation could be aconsequence of the <strong>in</strong>crease <strong>in</strong> westerly w<strong>in</strong>ds and a prevalence of negative NAO conditions. These lacustr<strong>in</strong>erecords are coherent with the others obta<strong>in</strong>ed from the upper bas<strong>in</strong> of the River Tagus (Taravilla Lake) andfrom its mouth (Tagus Pro<strong>de</strong>lta), which reveal an <strong>in</strong>crease <strong>in</strong> the frequency of paleoflood events <strong>in</strong> the LittleIce Age, consistently with the predom<strong>in</strong>ance of negative values of the NAO <strong>in</strong><strong>de</strong>x [Moreno et al., 2008;Lebreiro et al., 2006]. The record from Lake <strong>Red</strong>ó (Pyrenees) [Pla and Catalán, 2005] also shows cold butoscillat<strong>in</strong>g temperature dur<strong>in</strong>g the Little Ice Age. And advance of the glaciers <strong>in</strong> the Pyrenees [Chueca Cía etal., 2005] and also <strong>in</strong> Sierra Nevada [Gómez Ortiz et al., 1996] occurred dur<strong>in</strong>g the LIA.6 The last 3000 years refer to years BP and it correspond to the time from the year 1050 BC to the present day.7 Iberian-Roman Humid Period: 2600-1600 year BP.8 Mediaeval <strong>Climate</strong> Anomaly (Mediaeval Warm Period) years 550-1300 of our era or years AD.9 Little Ice Age, years 1300-1850 of our era or years AD.18
- Page 1 and 2: Climate in Spain:Past, present and
- Page 3 and 4: Climate in Spain: Past, Present and
- Page 5 and 6: Climate in Spain: Past, Present and
- Page 7 and 8: Climate in Spain: Past, Present and
- Page 9 and 10: Climate in Spain: Past, Present and
- Page 11 and 12: Climate in Spain: Past, Present and
- Page 13 and 14: Climate in Spain: Past, Present and
- Page 15 and 16: Climate in Spain: Past, Present and
- Page 17: Climate in Spain: Past, Present and
- Page 21 and 22: Climate in Spain: Past, Present and
- Page 23 and 24: Climate in Spain: Past, Present and
- Page 25 and 26: Climate in Spain: Past, Present and
- Page 27 and 28: Climate in Spain: Past, Present and
- Page 29 and 30: Climate in Spain: Past, Present and
- Page 31 and 32: Climate in Spain: Past, Present and
- Page 33 and 34: Climate in Spain: Past, Present and
- Page 35 and 36: Climate in Spain: Past, Present and
- Page 37 and 38: Climate in Spain: Past, Present and
- Page 39 and 40: Climate in Spain: Past, Present and
- Page 41 and 42: Climate in Spain: Past, Present and
- Page 43 and 44: 42Climate in Spain: Past, Present a
- Page 45 and 46: Climate in Spain: Past, Present and
- Page 47 and 48: Climate in Spain: Past, Present and
- Page 49 and 50: Climate in Spain: Past, Present and
- Page 51 and 52: Climate in Spain: Past, Present and
- Page 53 and 54: Climate in Spain: Past, Present and
- Page 55 and 56: Climate in Spain: Past, Present and
- Page 57 and 58: Climate in Spain: Past, Present and
- Page 59 and 60: Climate in Spain: Past, Present and
- Page 61 and 62: Climate in Spain: Past, Present and
- Page 63 and 64: Climate in Spain: Past, Present and
- Page 65 and 66: Climate in Spain: Past, Present and
- Page 67 and 68: Climate in Spain: Past, Present and
- Page 69 and 70:
68Climate in Spain: Past, Present a
- Page 71 and 72:
Climate in Spain: Past, Present and
- Page 73 and 74:
Climate in Spain: Past, Present and
- Page 75 and 76:
Climate in Spain: Past, Present and
- Page 77 and 78:
Climate in Spain: Past, Present and
- Page 79 and 80:
Climate in Spain: Past, Present and
- Page 81 and 82:
Climate in Spain: Past, Present and
- Page 83 and 84:
Climate in Spain: Past, present and