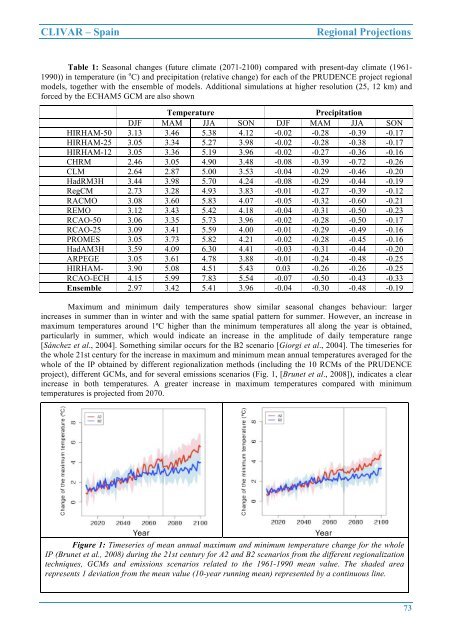
<strong>CLIVAR</strong> – Spa<strong>in</strong>Regional ProjectionsTable 1: Seasonal changes (future climate (2071-2100) compared with present-day climate (1961-1990)) <strong>in</strong> temperature (<strong>in</strong> o C) and precipitation (relative change) for each of the PRUDENCE project regionalmo<strong>de</strong>ls, together with the ensemble of mo<strong>de</strong>ls. Additional simulations at higher resolution (25, 12 km) andforced by the ECHAM5 GCM are also shownECHTemperaturePrecipitationDJF MAM JJA SON DJF MAM JJA SONHIRHAM-50 3.13 3.46 5.38 4.12 -0.02 -0.28 -0.39 -0.17HIRHAM-25 3.05 3.34 5.27 3.98 -0.02 -0.28 -0.38 -0.17HIRHAM-12 3.05 3.36 5.19 3.96 -0.02 -0.27 -0.36 -0.16CHRM 2.46 3.05 4.90 3.48 -0.08 -0.39 -0.72 -0.26CLM 2.64 2.87 5.00 3.53 -0.04 -0.29 -0.46 -0.20HadRM3H 3.44 3.98 5.70 4.24 -0.08 -0.29 -0.44 -0.19RegCM 2.73 3.28 4.93 3.83 -0.01 -0.27 -0.39 -0.12RACMO 3.08 3.60 5.83 4.07 -0.05 -0.32 -0.60 -0.21REMO 3.12 3.43 5.42 4.18 -0.04 -0.31 -0.50 -0.23RCAO-50 3.06 3.35 5.73 3.96 -0.02 -0.28 -0.50 -0.17RCAO-25 3.09 3.41 5.59 4.00 -0.01 -0.29 -0.49 -0.16PROMES 3.05 3.73 5.82 4.21 -0.02 -0.28 -0.45 -0.16HadAM3H 3.59 4.09 6.30 4.41 -0.03 -0.31 -0.44 -0.20ARPEGE 3.05 3.61 4.78 3.88 -0.01 -0.24 -0.48 -0.25HIRHAM- 3.90 5.08 4.51 5.43 0.03 -0.26 -0.26 -0.25RCAO-ECH 4.15 5.99 7.83 5.54 -0.07 -0.50 -0.43 -0.33Ensemble 2.97 3.42 5.41 3.96 -0.04 -0.30 -0.48 -0.19Maximum and m<strong>in</strong>imum daily temperatures show similar seasonal changes behaviour: larger<strong>in</strong>creases <strong>in</strong> summer than <strong>in</strong> w<strong>in</strong>ter and with the same spatial pattern for summer. However, an <strong>in</strong>crease <strong>in</strong>maximum temperatures around 1ºC higher than the m<strong>in</strong>imum temperatures all along the year is obta<strong>in</strong>ed,particularly <strong>in</strong> summer, which would <strong>in</strong>dicate an <strong>in</strong>crease <strong>in</strong> the amplitu<strong>de</strong> of daily temperature range[Sánchez et al., 2004]. Someth<strong>in</strong>g similar occurs for the B2 scenario [Giorgi et al., 2004]. The timeseries forthe whole 21st century for the <strong>in</strong>crease <strong>in</strong> maximum and m<strong>in</strong>imum mean annual temperatures averaged for thewhole of the IP obta<strong>in</strong>ed by different regionalization methods (<strong>in</strong>clud<strong>in</strong>g the 10 RCMs of the PRUDENCEproject), different GCMs, and for several emissions scenarios (Fig. 1, [Brunet et al., 2008]), <strong>in</strong>dicates a clear<strong>in</strong>crease <strong>in</strong> both temperatures. A greater <strong>in</strong>crease <strong>in</strong> maximum temperatures compared with m<strong>in</strong>imumtemperatures is projected from 2070.Figure 1: Timeseries of mean annual maximum and m<strong>in</strong>imum temperature change for the wholeIP (Brunet et al., 2008) dur<strong>in</strong>g the 21st century for A2 and B2 scenarios from the different regionalizationtechniques, GCMs and emissions scenarios related to the 1961-1990 mean value. The sha<strong>de</strong>d arearepresents 1 <strong>de</strong>viation from the mean value (10-year runn<strong>in</strong>g mean) represented by a cont<strong>in</strong>uous l<strong>in</strong>e.73
<strong>Climate</strong> <strong>in</strong> Spa<strong>in</strong>: <strong>Past</strong>, <strong>Present</strong> and Future2.c.2.- PrecipitationThe changes <strong>in</strong> seasonal precipitation shown by several studies us<strong>in</strong>g <strong>in</strong>dividual mo<strong>de</strong>ls [Gibel<strong>in</strong> andDéqué, 2003; Giorgi et al., 2004; Räisänen et al., 2004; Sánchez et al., 2004; Rowell, 2005; Castro et al.,2007b; Giorgi and Lionello, 2008] show a <strong>de</strong>crease <strong>in</strong> summer for all the IP, present<strong>in</strong>g a north-southstructure <strong>in</strong> w<strong>in</strong>ter with slight <strong>in</strong>creases <strong>in</strong> the northern half and <strong>de</strong>creases <strong>in</strong> the southern part. However, thediscrepancies among the results with the different mo<strong>de</strong>ls are larger than those obta<strong>in</strong>ed when compar<strong>in</strong>gtemperatures. A <strong>de</strong>crease is also obta<strong>in</strong>ed <strong>in</strong> the total number of ra<strong>in</strong>y days <strong>in</strong> all seasons and for the wholeregion [Sánchez et al., 2009b]. When the ensemble of RCMs forced by the same GCM from PRUDENCE isanalyzed (Table 1, [Christensen y Christensen, 2007]), a high <strong>de</strong>gree of agreement among them is seen, with anegative change <strong>in</strong> relative precipitation average for the whole IP <strong>in</strong> all seasons, be<strong>in</strong>g maximum <strong>in</strong> summer (-0.48 on average for all the mo<strong>de</strong>ls, between -0.39 and -0.72) and m<strong>in</strong>imum, almost negligible, <strong>in</strong> w<strong>in</strong>ter (-0.04) for the end of the 21st century un<strong>de</strong>r the A2 emissions scenario. In contrast to what happens withtemperature, the RCMs show an important bias for present-day climate that can double the climate changeresponse. However, the all RCM precipitation projections have a similar behaviour for the A2 emissionsscenario, slightly different from the GCM, meanwhile systematic biases are more scattered [Déqué et al.,2005]. The percentage change <strong>in</strong> annual precipitation by <strong>de</strong>gree of <strong>in</strong>crease <strong>in</strong> temperature <strong>in</strong> the global mo<strong>de</strong>lranges between -9.7 and -3.1 K -1 , which is the largest for the whole of Europe. This result is important, evenfrom a political po<strong>in</strong>t of view, <strong>in</strong> relation to the proposed possible stabilization scenarios based on certa<strong>in</strong>temperature thresholds (2, 3 or 4 <strong>de</strong>grees centigra<strong>de</strong>s). The probability distribution functions of changes <strong>in</strong>annual precipitation <strong>in</strong>dicate a <strong>de</strong>crease between 18 and 0.4% for the 1 and 99 percentiles [Ekström et al.,2007, H<strong>in</strong>gray et al., 2007]. The daily precipitation distribution function po<strong>in</strong>ts towards a <strong>de</strong>crease of lightprecipitation amounts (up to 15 mm/day) [Boberg et al., 2009]. The strength (peak <strong>in</strong> the standard frequencyspectrum) of the annual precipitation cycle <strong>in</strong> the north-west region of the IP appears to <strong>in</strong>crease for all RCMs,which could be related to changes <strong>in</strong> frontal activity <strong>in</strong> that area [Tapiador and Sánchez, 2008]. This resultcould be related to a northward move of the low pressure w<strong>in</strong>ter systems obta<strong>in</strong>ed <strong>in</strong> the global mo<strong>de</strong>lprojections (IPCC 2007, Chapter 10 [Meehl et al., 2007]), and also the north-eastward displacement of thepr<strong>in</strong>cipal low frequency variability patterns [Rodríguez-Fonseca et al., 2005]. Regard<strong>in</strong>g more specificregions <strong>in</strong> the IP, a maximum <strong>de</strong>crease is obta<strong>in</strong>ed over the Ebro bas<strong>in</strong> <strong>in</strong> summer, with much smallerchanges, and even slight <strong>in</strong>creases for some mo<strong>de</strong>ls <strong>in</strong> w<strong>in</strong>ter [Blenk<strong>in</strong>sop and Fowler, 2007]. Over thePyrenees area, the mo<strong>de</strong>ls project a <strong>de</strong>crease of 10 and 15% <strong>in</strong> annual precipitation for B2 and A2 scenarios,respectively, be<strong>in</strong>g the maximum <strong>de</strong>crease <strong>in</strong> summer [López-Moreno et al., 2008a].2.d.- Projected changes <strong>in</strong> other climatic magnitu<strong>de</strong>s and processesOther aspects of climate change projected by the RCMs over the IP show an <strong>in</strong>tensification of thetypical summer thermal lows <strong>in</strong> the centre of the IP and an <strong>in</strong>crease <strong>in</strong> sea breezes for the 2071-2100 period[Ho<strong>in</strong>ka et al., 2007], correspond<strong>in</strong>g to an <strong>in</strong>crease <strong>in</strong> annual turbulent k<strong>in</strong>etic energy (as a measurement ofturbulent activity <strong>in</strong> the lower layers of the atmosphere), ma<strong>in</strong>ly <strong>in</strong> summer and <strong>in</strong> the centre of the Pen<strong>in</strong>sula.The Bowen ratio (ratio of sensible to latent heat fluxes over a surface) shows a change for the end of the 21stcentury whose spatial pattern presents a north-south gradient, be<strong>in</strong>g maximum on the southern part, that wouldpo<strong>in</strong>t to an <strong>in</strong>creased aridity and a ten<strong>de</strong>ncy towards the <strong>de</strong>sertification of that area [Sánchez et al., 2007a,b].A significative jump of an important fraction of po<strong>in</strong>ts towards more arid climates is obta<strong>in</strong>ed over theIP <strong>in</strong> respect of present-day climate (top figures) both if the climate change projections are analysed (bottomleft figure) or if the change climate signal is ad<strong>de</strong>d to the observed climatology (bottom right figure) [Castroet al., 2007a]. Although w<strong>in</strong>ter precipitation variability patterns are related to large scale mechanisms, andtheir change for future climate conditions is similar, with a north-eastward displacement <strong>in</strong> these structuresboth for the GCM and the RCM, the more regional mo<strong>de</strong>s show discrepancies <strong>in</strong> their projected change forthe 21st century [Rodríguez-Fonseca et al., 2005]. There is also evi<strong>de</strong>nce that the magnitu<strong>de</strong> of the projectedchanges has an important effect on the evolution of the snow mantle [López-Moreno et al, 2008b].The construction of climate types <strong>in</strong> the Köppen-Trewartha classification from the 10 RCMs of thePRUDENCE project and their changes for future climate conditions is shown <strong>in</strong> Fig. 2.74
- Page 1 and 2:
Climate in Spain:Past, present and
- Page 3 and 4:
Climate in Spain: Past, Present and
- Page 5 and 6:
Climate in Spain: Past, Present and
- Page 7 and 8:
Climate in Spain: Past, Present and
- Page 9 and 10:
Climate in Spain: Past, Present and
- Page 11 and 12:
Climate in Spain: Past, Present and
- Page 13 and 14:
Climate in Spain: Past, Present and
- Page 15 and 16:
Climate in Spain: Past, Present and
- Page 17 and 18:
Climate in Spain: Past, Present and
- Page 19 and 20:
Climate in Spain: Past, Present and
- Page 21 and 22:
Climate in Spain: Past, Present and
- Page 23 and 24: Climate in Spain: Past, Present and
- Page 25 and 26: Climate in Spain: Past, Present and
- Page 27 and 28: Climate in Spain: Past, Present and
- Page 29 and 30: Climate in Spain: Past, Present and
- Page 31 and 32: Climate in Spain: Past, Present and
- Page 33 and 34: Climate in Spain: Past, Present and
- Page 35 and 36: Climate in Spain: Past, Present and
- Page 37 and 38: Climate in Spain: Past, Present and
- Page 39 and 40: Climate in Spain: Past, Present and
- Page 41 and 42: Climate in Spain: Past, Present and
- Page 43 and 44: 42Climate in Spain: Past, Present a
- Page 45 and 46: Climate in Spain: Past, Present and
- Page 47 and 48: Climate in Spain: Past, Present and
- Page 49 and 50: Climate in Spain: Past, Present and
- Page 51 and 52: Climate in Spain: Past, Present and
- Page 53 and 54: Climate in Spain: Past, Present and
- Page 55 and 56: Climate in Spain: Past, Present and
- Page 57 and 58: Climate in Spain: Past, Present and
- Page 59 and 60: Climate in Spain: Past, Present and
- Page 61 and 62: Climate in Spain: Past, Present and
- Page 63 and 64: Climate in Spain: Past, Present and
- Page 65 and 66: Climate in Spain: Past, Present and
- Page 67 and 68: Climate in Spain: Past, Present and
- Page 69 and 70: 68Climate in Spain: Past, Present a
- Page 71 and 72: Climate in Spain: Past, Present and
- Page 73: Climate in Spain: Past, Present and
- Page 77 and 78: Climate in Spain: Past, Present and
- Page 79 and 80: Climate in Spain: Past, Present and
- Page 81 and 82: Climate in Spain: Past, Present and
- Page 83 and 84: Climate in Spain: Past, present and