The Community Youth Development Study
The Community Youth Development Study
The Community Youth Development Study
- No tags were found...

Create successful ePaper yourself
Turn your PDF publications into a flip-book with our unique Google optimized e-Paper software.
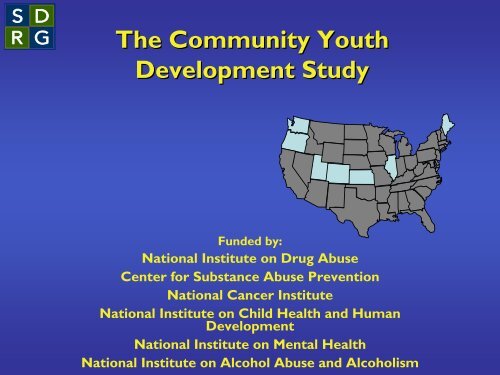
<strong>The</strong> <strong>Community</strong> <strong>Youth</strong><strong>Development</strong> <strong>Study</strong>Funded by:National Institute on Drug AbuseCenter for Substance Abuse PreventionNational Cancer InstituteNational Institute on Child Health and Human<strong>Development</strong>National Institute on Mental HealthNational Institute on Alcohol Abuse and Alcoholism
CYDS State Collaborators• Colorado Alcohol & Drug Abuse Division• Illinois Division of <strong>Community</strong> Health &Prevention• Kansas Alcohol and Drug Abuse Services• Maine Office of Substance Abuse• Oregon Addictions and Mental HealthDivision• Utah Division of Substance Use• Washington Division of Behavioral Healthand Recovery2
CYDS Research TeamRobert D. AbbottMichael W. ArthurJohn S. BrineyBlair Brooke-WeissEric C. BrownRichard F. CatalanoAbigail FaganJohn GrahamKevin HaggertyKoren HansonJ. David HawkinsMargaret KuklinskiMatt LaughlinKathryn MonahanDavid MurraySabrina OesterleDana PrinceIsaac RhewHolly SantosValerie ShapiroM. Lee Van Horn4
Report of the Committee on Prevention of MentalDisorders and Substance Abuse Among Children,<strong>Youth</strong> and Young AdultsO’Connell, Boat &Warner, eds.20095
Disorders Are Common and Costly• Around 1 in 5 young people (14-20%)have a current disorder• Estimated $247 billion in annual costs• Costs to multiple sectors – education,justice, health care, social welfare• Costs to the individual and family6
Preventive Opportunities Early in Life• Early onset (¾ of adult disorders had onsetby age 24; ½ by age 14)• First symptoms occur 2-4 years prior todiagnosable disorder7
Prevention Window8
<strong>Community</strong> <strong>Youth</strong> <strong>Development</strong><strong>Study</strong>• A community randomized trial of CTC• 24 incorporated towns matched in pairs within stateand randomly assigned to CTC or control condition.• 4407 5 th grade students- surveyed annually through8 th grade9
<strong>Youth</strong> <strong>Development</strong> Survey• Participants recruited in grades 5 and 6.• Final consent rate = 76.4%Sixth GradeEligiblePopulationPercentConsentedPercentSurveyedTotalSurveyedExperimental 3170 76.2% 75.4% 2391Control 2621 76.7% 76.3% 1999Total 5791 76.4% 75.8% 439010
2007 YDS• 96.2% Overall Student Participation• 11.9% (n=525) have moved out of projectschools8 th Grade EligiblePopulationPercentSurveyedTotalSurveyedExperimental 2406 95.6% 2300Control 2001 96.9% 1940Total 4407 96.2% 424011
CTC Towns:Coalition of Stakeholders• Received CTC Training• 6 trainings over 12 months• Collected Data on Local Levels of Risk andProtection• CTC <strong>Youth</strong> Survey• Prioritized Risk Factors to Address• Implemented Appropriate TestedPrevention Programs from CTC menu• on average 3 per community per year12
Results• Using CTC System significantly reducedhealth risking behaviors among eighthgrade students community wide.Compared with controls:• 33% less likely to start smoking cigarettes.• 32% less likely to start drinking alcohol.• 25% less likely to start delinquent behavior.13
Results• Using CTC System significantly reducedhealth risking behaviors among eighthgrade students community wide:• 23% less likely to drink alcohol currentlythan controls.• 37% less likely to “binge” (5 or more drinksin a row) than controls.• Committed 31% fewer different delinquentacts in past year than controls.14
Communities That CareLogic ModelAdoption ofScience-basedPrevention<strong>Community</strong> Collaborationfor PreventionAppropriate Choice andImplementation of Tested,Effective Prevention ProgramsCTC Training, TechnicalAssistance<strong>Community</strong> Supportfor Prevention<strong>Community</strong> NormsDecreased Risk andEnhanced ProtectionSocial <strong>Development</strong>StrategyPositive <strong>Youth</strong>OutcomesSystem CatalystSystem Transformation ConstructsSystem Outcomes15
Program SelectionCTC <strong>Community</strong> Boards selectedprevention programs from the CTCPrevention Strategies Guide, a menu* ofprograms that:~ Showed significant effects on risk/protective factors, anddrug use, delinquency, or violence~ In at least one high-quality research study~ Targeted children or families in grades 5-9~ Provided materials and training* Communities That Care Prevention Strategies Guide16
Programs Selected in 2004-20082008PROGRAMAll Stars CoreLife Skills Training (LST)Lion’s-Quest Skills for AdolescenceProject AlertOlweus Bullying Prevention Program2004-05122--2005-0614*312*2006-0715*312*2007-0815*312*Program <strong>Development</strong> Evaluation (PDE) 1 1 - -Project Towards No Drug Abuse (TNDA) - - - 2Project Northland Class Action - - - 1*Participate and Learn Skills (PALS)Big Brothers/Big Sisters (BBBS)Stay SMARTTutoringValued <strong>Youth</strong> Tutoring ProgramStrengthening Families Program (SFP) 10-14Guiding Good Choices (GGC)12341261236137*1216138*2117027Parents Who Care (PWC) 1 1 - -Family Matters 1 1 2 2Parenting Wisely - 1 1 2TOTAL 27 38 37 37 17
Exposure in the <strong>Community</strong>Number of Program Participants/Families Receiving ProgrammingProgram Type 2004-05 2005-06 2006-07 2007-08SchoolCurricula1432 38865165 5705After-school 546 612589448ParentTraining517 665476379Note: Total eligible population of 6 th , 7 th , and 8 th -grade students in 2005-06 was 10,03118
Participant AttendancePercent attending >60% of the total number of sessionsProgram Type 2004-05 2005-06 2006-072007-08SchoolCurricula96% 91% 95% 94%After-school * 77% 81% 65%70%ParentTraining79% 78% 79% 75%*Includes PALS, BBBS, Stay SMART, and Tutoring programs19
Balancing Research Goalsand <strong>Community</strong> Practice<strong>The</strong> Challenge: How could the UW:• Measure fidelity across a range ofprograms?• Encourage local ownership, highfidelity, and sustainability ofprevention programs?20
Required Staff Training• Training from program developers orcertified trainers~ Available for 11 of 16 programs*• Training from SDRG/CTC staff~ CTC CPIT workshops emphasize programfidelity, completion of fidelity instruments,and discussion of potential challenges• All implementers received both trainings*Exceptions: PALS, Tutoring, Parents Who Care, Family Matters, Parenting Wisely22
Fidelity Assessment Checklists• Provided similar information acrossprograms to measure primarilyadherence and dosage• Checklists were completed by programstaff, reviewed locally and analyzed at theUW• 3,000-4,000 checklists were completedannually23
Adherence RatesAveraged across all years1009080706050403020100Percentage of material taught or core components achievedLST AS SFA Alert BPP PDE TNDA SS Tutor VY BBBS PALS SFP GGC PWC FM PW24
Adherence RatesSchool BasedPercentage of material taught or core components achieved1009080706050403020100LST All Stars SFA PDE Alert Olweus TNDA2004-052005-062006-072007-0825
Adherence RatesAfterschool ProgramsPercentage of material taught or core components achieved1009080706050403020100SMART BBBS PALS Tutor Valued <strong>Youth</strong>2004-052005-062006-072007-0826
Adherence RatesParent TrainingPercentage of material taught or core components achieved1009080706050403020100SFP 10-14 GGC PWC Family Matters Parenting Wisely2004-052005-062006-072007-0827
Delivery of LessonsAveraged across all years(number, length, and frequency of required sessions)1009080706050403020100Percentage of delivery requirements metLST AS SFA Alert BPP TNDA SMART Tutor VY BBBS PALS SFP GGC PWC FM28
Program Observations• <strong>Community</strong>volunteers observed10-15% of sessionsfor 10 programs• Completed fidelitychecklists to assessadherence~ Rate of agreementw/ implementerswas 92%-97%29
Quality of Delivery• Observers rated the quality of delivery on10 items (alpha = .87-.90) using a 5-point scale(higher scores indicate better quality)• Example Items:~ In general, how clear were the program implementer’sexplanations of activities?~ To what extent did the implementer keep on time during thesession and activities?~ Rate the implementer on the following qualities:• Level of enthusiasm• Rapport and communication with participants• Effectively addressed questions/concerns30
Quality of DeliveryAveraged across all yearsAverage score on 10 items reported by program observers54.543.532.521.51LST All Stars Alert SFA BPP SMART PALS SFP GGC PWC31
Participant Responsiveness• Observers rated participantresponsiveness on two items, using a1-5 scale (higher scores indicatebetter responsiveness):~ To what extent did the participants appearto understand the material?~ How actively did group members participatein discussions and activities?32
Participant ResponsivenessAveraged across all yearsAverage score on 2 items reported by program observers54.543.532.521.51LST All Stars SFA Alert BPP SMART PALS SFP GGC PWC33
Pre-Post Post Survey ResultsParent Survey Results (n=261) from SFP 10-14 in <strong>Community</strong> QPARENTING SKILLCOMMUNICATION STYLEEG: I let my youth know the reason for therules we haveSCHOOL INVOLVEMENTEG: I attend parent-teacher conferences atschoolNURTURE AND SUPPORTEG: We take time to do something funtogether as a familyCONTINGENT PARENTINGEG: I follow through with consequenceseach time he or she breaks a rulePre-surveyMean ScorePost-surveyMean Score2.82 3.26*3.13 3.39*3.04 3.37*2.86 3.28**Statistically significant change (p
Results: Change in prioritized risk factors0.40Average Level of Risk0.300.200.100.00-0.10-0.20-0.30Grade 5 Grade 6 Grade 7 Grade 8ControlsCTCNote. Results from a linear growth model with community matched pairs using data from YDS Grades 5 through 8averaged across 40 imputed data sets; β 101 = 0.026, SE = 0.010, t (df = 9, N = 4407) = 2.54, p = 0.032 for linearslopes; β 001 = -0.064, SE = 0.031, t (df = 9, N = 4407) = -2.10, p = 0.064 for mean difference at Grade 8.38
Effects of CTC on Initiation(Incidence) of Drug Use andDelinquency• Onset of substance use and delinquency betweengrade 6 and 8:• Alcohol use *• Cigarette smoking*• Smokeless tobacco use*• Marijuana use• Other illicit drug use• Delinquent behavior*• Among 5 th grade students who had not yetinitiated.39
Onset of Alcohol UseAdjusted Hazard0.250.200.150.100.050.00Alcohol0.250.13 0.130.170.110.13Grade 6 Grade 7 Grade 8p < .05OR = 0.63ControlCTC4040
Onset of Cigarette SmokingAdjusted HazardControlCTC0.150.120.100.050.000.050.040.080.05p < .050.03OR = 0.55Grade 6 Grade 7 Grade 84141
Onset of Delinquent BehaviorAdjusted HazardControlCTC0.250.20p < .050.180.21p < .050.150.100.050.000.110.160.130.08OR OR = 0.71 = 0.71Grade 6 Grade 7 Grade 84242
Prevalence of Current Alcohol UseIn PanelIn Control and CTC Communities25.0021.4 p < .05Percentage20.0015.0010.003.3 ns 3.116.45.000.00Grade 5 Grade 8Controls CTCNote. Observed rates averaged across 40 imputations. ns = nonsignificant. N = 4407.43
Prevalence of Binge Drinking in PastTwo WeeksIn PanelIn Control and CTC Communities25.00Percentage20.0015.0010.005.001.3 ns 1.09.0 p < .055.70.00Grade 5 Grade 8Controls CTCNote. Observed rates averaged across 40 imputations. ns = nonsignificant. N = 4407.44
Prevalence of Current SmokelessTobacco UseIn PanelIn CTC and Control Communities25.0020.00Percentage15.0010.005.000.000.7 ns 0.44.3 p < .052.2Grade 5 Grade 8ControlsCTCNote. Observed rates averaged across 40 imputations. ns = nonsignificant. N = 4407.
3.00Mean Number of Different DelinquentBehaviorsCommitted by Panel in Past YearIn CTC and Control CommunitiesNumber2.001.00.36 ns .311.13 p
Why Does CTC Work?• Complete set of manualized trainings.• Process for assessing community readiness.• Milestones and Benchmarks that guidecommunities through the CTC process.• Standardized assessment process forcommunity needs assessment.• Menu of tested and effective preventiveinterventions.• Training and tools for monitoringimplementation fidelity and quality andoutcomes.• Paid community coordinator.47
Communities That Care is owned by the federalgovernment and is available at:http://preventionplatform.samhsa.gov/NIDA Virtual Town Hall:http://www.visualwebcaster.com/drugabuse-TownHall//CSAP Contact:Patricia Getty, Ph.D.Acting Director, Division of Systems <strong>Development</strong>Center for Substance Abuse Preventionpatricia.getty@samhsa.hhs.gov48
Communities That Care:Challenge and Opportunity• Training and technical assistanceare needed to install the CTCsystem with fidelity.• CSAP Contact: Dr. Patricia Getty240 276 2577patricia.getty@samhsa.hhs.gov49
Using Prevention Science to ReduceBehavioral Problems Among YoungPeople <strong>Community</strong>-wideJ. David Hawkins, Ph.D.Professor of PreventionSocial <strong>Development</strong> Research GroupSchool of Social WorkUniversity of Washingtonjdh@u.washington.eduwww.sdrg.org50
Delivery – School Based(number, length, and frequency of required sessions)1009080706050403020100Percentage of delivery requirements metLST All Stars SFA Alert Olweus TNDA2004-052005-062006-072007-0851
Delivery - Afterschool(number, length, and frequency of required sessions)1009080706050403020100Percentage of delivery requirements metSMART BBBS PALS Tutor Valued <strong>Youth</strong>2004-052005-062006-072007-0852
Delivery - Parent Training(number, length, and frequency of required sessions)1009080706050403020100Percentage of delivery requirements metSFP 10-14 GGC PWC Family Matters2004-052005-062006-072007-0853
Quality of DeliverySchool BasedAverage score on 10 items reported by program observers54.543.532.522004-052005-062006-072007-081.51LST All Stars SFA Alert Olweus54
Participant ResponsivenessSchool BasedAverage score on 2 items reported by program observers54.543.532.522004-052005-062006-072007-081.51LST All Stars SFA Alert Olweus56
Participant ResponsivenessAfterschool & Parent TrainingAverage score on 2 items reported by program observers54.543.532.522004-052005-062006-072007-081.51SMART PALS SFP 10-14 GGC PWC57