The Science of Science (Sci2) Tool and Its Utility for Research ... - VW
The Science of Science (Sci2) Tool and Its Utility for Research ... - VW
The Science of Science (Sci2) Tool and Its Utility for Research ... - VW
- No tags were found...

Create successful ePaper yourself
Turn your PDF publications into a flip-book with our unique Google optimized e-Paper software.
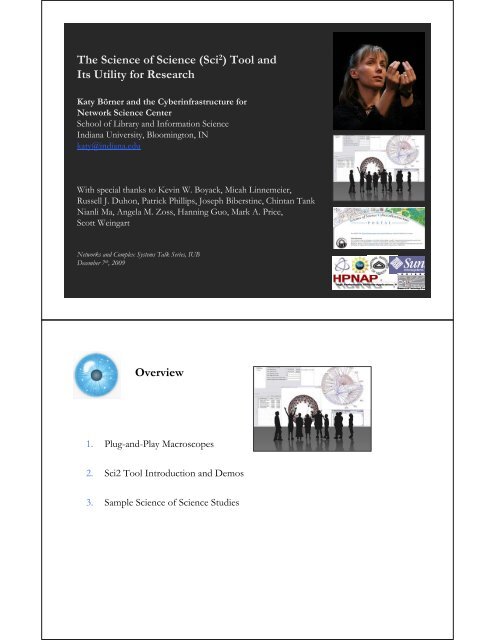
<strong>The</strong> <strong>Science</strong> <strong>of</strong> <strong>Science</strong> (Sci 2 ) <strong>Tool</strong> <strong>and</strong><strong>Its</strong> <strong>Utility</strong> <strong>for</strong> <strong>Research</strong>Katy Börner <strong>and</strong> the Cyberinfrastructure <strong>for</strong>Network <strong>Science</strong> CenterSchool <strong>of</strong> Library <strong>and</strong> In<strong>for</strong>mation <strong>Science</strong>Indiana University, Bloomington, INkaty@indiana.eduWith special thanks to Kevin W. Boyack, Micah Linnemeier,Russell J. Duhon, Patrick Phillips, Joseph Biberstine, Chintan TankNianli Ma, Angela M. Zoss, Hanning Guo, Mark A. Price,Scott WeingartNetworks <strong>and</strong> Complex Systems Talk Series, IUBDecember 7 th , 2009Overview1. Plug-<strong>and</strong>-Play Macroscopes2. <strong>Sci2</strong> <strong>Tool</strong> Introduction <strong>and</strong> Demos3. Sample <strong>Science</strong> <strong>of</strong> <strong>Science</strong> Studies
<strong>The</strong> Changing Scientific L<strong>and</strong>scapeStar Scientist -> <strong>Research</strong> Teams: In <strong>for</strong>mer times, science was driven by key scientists. Today, science is drivenby effectively collaborating co-author teams <strong>of</strong>ten comprising expertise from multiple disciplines <strong>and</strong> severalgeospatial locations (Börner, Dall'Asta, Ke, & Vespignani, 2005; Shneiderman, 2008).Users -> Contributors: Web 2.0 technologies empower anybody to contribute to Wikipedia <strong>and</strong> to exchangeimages <strong>and</strong> videos via Fickr <strong>and</strong> YouTube. WikiSpecies, WikiPr<strong>of</strong>essionals, or WikiProteins combine wiki <strong>and</strong>semantic technology in support <strong>of</strong> real time community annotation <strong>of</strong> scientific datasets (Mons et al., 2008).Cross-disciplinary: <strong>The</strong> best tools frequently borrow <strong>and</strong> synergistically combine methods <strong>and</strong> techniques fromdifferent disciplines <strong>of</strong> science <strong>and</strong> empower interdisciplinary <strong>and</strong>/or international teams <strong>of</strong> researchers,practitioners, or educators to fine-tune <strong>and</strong> interpret results collectively.One Specimen -> Data Streams: Microscopes <strong>and</strong> telescopes were originally used to study one specimen at atime. Today, many researchers must make sense <strong>of</strong> massive streams <strong>of</strong> multiple types <strong>of</strong> data with different<strong>for</strong>mats, dynamics, <strong>and</strong> origin.Static Instrument -> Evolving Cyberinfrastructure (CI): <strong>The</strong> importance <strong>of</strong> hardware instruments that arerather static <strong>and</strong> expensive decreases relative to s<strong>of</strong>tware infrastructures that are highly flexible <strong>and</strong>continuously evolving according to the needs <strong>of</strong> different sciences. Some <strong>of</strong> the most successful services <strong>and</strong>tools are decentralized increasing scalability <strong>and</strong> fault tolerance.Modularity: <strong>The</strong> design <strong>of</strong> s<strong>of</strong>tware modules with well defined functionality that can be flexibly combined helpsreduce costs, makes it possible to have many contribute, <strong>and</strong> increases flexibility in tool development,augmentation, <strong>and</strong> customization.St<strong>and</strong>ardization: Adoption <strong>of</strong> st<strong>and</strong>ards speeds up development as existing code can be leveraged. It helps poolresources, supports interoperability, but also eases the migration from research code to production code <strong>and</strong>hence the transfer <strong>of</strong> research results into industry applications <strong>and</strong> products.Open data <strong>and</strong> open code: Lets anybody check, improve, or repurpose code <strong>and</strong> eases the replication <strong>of</strong> scientificstudies.Microscopes, Telescopes, <strong>and</strong> MacrocopesJust as the microscope empowered our naked eyes to see cells, microbes, <strong>and</strong> virusesthereby advancing the progress <strong>of</strong> biology <strong>and</strong> medicine or the telescope opened ourminds to the immensity <strong>of</strong> the cosmos <strong>and</strong> has prepared mankind <strong>for</strong> the conquest <strong>of</strong>space, macroscopes promise to help us cope with another infinite: the infinitely complex.Macroscopes give us a ‘vision <strong>of</strong> the whole’ <strong>and</strong> help us ‘synthesize’. <strong>The</strong>y let us detectpatterns, trends, outliers, <strong>and</strong> access details in the l<strong>and</strong>scape <strong>of</strong> science. Instead <strong>of</strong> makingthings larger or smaller, macroscopes let us observe what is at once too great, too slow, ortoo complex <strong>for</strong> our eyes.
Desirable Features <strong>of</strong> Plug-<strong>and</strong>-Play MacroscopesDivision <strong>of</strong> Labor: Ideally, labor is divided in a way that the expertise <strong>and</strong> skills <strong>of</strong> computerscientists are utilized <strong>for</strong> the design <strong>of</strong> st<strong>and</strong>ardized, modular, easy to maintain <strong>and</strong> extend “corearchitecture”. Dataset <strong>and</strong> algorithm plugins, i.e., the “filling”, are initially provided by those thatcare <strong>and</strong> know most about the data <strong>and</strong> developed the algorithms: the domain experts.Ease <strong>of</strong> Use: As most plugin contributions <strong>and</strong> usage will come from non-computer scientists it mustbe possible to contribute, share, <strong>and</strong> use new plugins without writing one line <strong>of</strong> code. Wizarddrivenintegration <strong>of</strong> new algorithms <strong>and</strong> data sets by domain experts, sharing via email or onlinesites, deploying plugins by adding them to the ‘plugin’ directory, <strong>and</strong> running them via a Menudriven user interfaces (as used in Word processing systems or Web browsers) seems to work well.Plugin Content <strong>and</strong> Interfaces: Should a plugin represent one algorithm or an entire tool? Whatabout data converters needed to make the output <strong>of</strong> one algorithm compatible with the input <strong>of</strong>the next? Should those be part <strong>of</strong> the algorithm plugin or should they be packaged separately?Supported (Central) Data Models: Some tools use a central data model to which all algorithmscon<strong>for</strong>m, e.g., Cytoscape, see Related Work section. Other tools support many internal datamodels <strong>and</strong> provide an extensive set <strong>of</strong> data converters, e.g., Network Workbench, see below.<strong>The</strong> <strong>for</strong>mer <strong>of</strong>ten speeds up execution <strong>and</strong> visual rendering while the latter eases the integration<strong>of</strong> new algorithms. In addition, most tools support an extensive set <strong>of</strong> input <strong>and</strong> output <strong>for</strong>mats.Core vs. Plugins: As will be shown, the “core architecture” <strong>and</strong> the “plugin filling” can beimplemented as sets <strong>of</strong> plugin bundles. Answers to questions such as: “Should the graphical userinterface (GUI), interface menu, scheduler, or data manager be part <strong>of</strong> the core or its filling?” willdepend on the type <strong>of</strong> tools <strong>and</strong> services to be delivered.Supported Plat<strong>for</strong>ms: If the s<strong>of</strong>tware is to be used via Web interfaces then Web services need to beimplemented. If a majority <strong>of</strong> domain experts prefers a st<strong>and</strong>-alone tool running on a specificoperating system then a different deployment is necessary.Hubble telescope has cost a total <strong>of</strong> about $10billion over its 20 years <strong>of</strong> operation. Ed Weiler,HST space science chief, computed that this"...equates to about two cents per week perAmerican taxpayer over 20 years" – a true bargain.
IlluminatedDiagram DisplayW. Brad<strong>for</strong>d Paley,Kevin W. Boyack,Richard Kalvans, <strong>and</strong>Katy Börner (2007)Mapping,Illuminating, <strong>and</strong>Interacting with<strong>Science</strong>.SIGGRAPH 2007,San Diego, CA.
Overview1. Plug-<strong>and</strong>-Play Macroscopes2. <strong>Sci2</strong> <strong>Tool</strong> Introduction <strong>and</strong> Demos3. Sample <strong>Science</strong> <strong>of</strong> <strong>Science</strong> Studies
Open Data <strong>and</strong> Open CodeStudying Individual, Local, <strong>and</strong> Global Flows <strong>and</strong> Activity PatternsDesign comprehensive databases that capture relevant data <strong>and</strong>cyberinfrastructures that can be used to make sense <strong>of</strong> this data(stream).<strong>Science</strong> studies can be conducted at different levels:‣ local (individual),‣ meso (local, e.g., one institute, one funding agency), or‣ global level (all <strong>of</strong> science or world wide).Using‣ Statistical Analysis/Pr<strong>of</strong>iling‣ Temporal Analysis (When)‣ Geospatial Analysis (Where)‣ Topical Analysis (What)‣ Network Analysis (With Whom?)CI <strong>for</strong> a <strong>Science</strong> <strong>of</strong> <strong>Science</strong> StudiesScholarly Database: 23 million scholarly recordshttp://sdb.slis.indiana.eduIn<strong>for</strong>mation Visualization Cyberinfrastructurehttp://iv.slis.indiana.eduNetwork Workbench <strong>Tool</strong> + Community Wikihttp://nwb.slis.indiana.eduSci 2 <strong>Tool</strong> <strong>and</strong> <strong>Science</strong> <strong>of</strong> <strong>Science</strong> CI Portalhttp://sci.slis.indiana.eduEpidemics Cyberinfrastructurehttp://epic.slis.indiana.edu/18
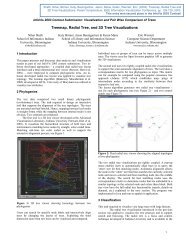
Macroscope DesignNetwork Workbench <strong>Tool</strong>A large-scale networkanalysis, modeling <strong>and</strong>visualization toolkit <strong>for</strong>biomedical, social science <strong>and</strong>physics research.<strong>Science</strong> <strong>of</strong> <strong>Science</strong> <strong>Tool</strong><strong>for</strong> science <strong>of</strong> science studiesat the individual, local, orglobal level <strong>for</strong> temporal,geospatial, semantic, ornetwork analysis <strong>and</strong> vis.Epidemics <strong>Research</strong> <strong>Tool</strong>An open computationalinfrastructure <strong>for</strong> epidemicsresearch.http://nwb.slis.indiana.edu http://sci.slis.indiana.edu http://epic.slis.indiana.eduCIShell.org19Sci 2 <strong>Tool</strong>http://sci.slis.indiana.edu“Open Code <strong>for</strong> S&T Assessment”Br<strong>and</strong>ed OSGi/CIShell based tool with NWB plugins<strong>and</strong> many new plugins.GUESS Network VisSci MapsHorizontal Time GraphsBörner, Katy, Huang, Weixia (Bonnie), Linnemeier, Micah, Duhon, Russell Jackson, Phillips, Patrick, Ma,Nianli, Zoss, Angela, Guo, Hanning & Price, Mark. (2009). Rete-Netzwerk-Red: Analyzing <strong>and</strong>Visualizing Scholarly Networks Using the Scholarly Database <strong>and</strong> the Network Workbench <strong>Tool</strong>.Proceedings <strong>of</strong> ISSI 2009: 12th International Conference on Scientometrics <strong>and</strong> In<strong>for</strong>metrics, Rio de Janeiro,Brazil, July 14-17 . Vol. 2, pp. 619-630.
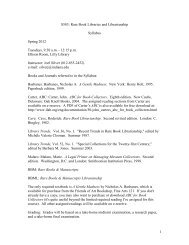
Sci 2 <strong>Tool</strong>Geo MapsCircular HierarchyTopic Mapping: UCSD <strong>Science</strong> Map22
Sci 2 <strong>Tool</strong>: Supported Data FormatsPersonal Bibliographies‣ Bibtex (.bib)‣ Endnote Export Format (.enw)Data Providers‣ Web <strong>of</strong> <strong>Science</strong> by Thomson Scientific/Reuters (.isi)‣ Scopus by Elsevier (.scopus)‣ Google Scholar (access via Publish or Perish save as CSV, Bibtex,EndNote)‣ Awards Search by National <strong>Science</strong> Foundation (.nsf)Scholarly Database (all text files are saved as .csv)‣ Medline publications by National Library <strong>of</strong> Medicine‣ NIH funding awards by the National Institutes <strong>of</strong> Health(NIH)‣ NSF funding awards by the National <strong>Science</strong> Foundation (NSF)‣ U.S. patents by the United States Patent <strong>and</strong> Trademark Office(USPTO)‣ Medline papers – NIH FundingNetwork Formats‣ NWB (.nwb)‣ Pajek (.net)‣ GraphML (.xml or.graphml)‣ XGMML (.xml)Burst Analysis Format‣ Burst (.burst)Other Formats‣ CSV (.csv)‣ Edgelist (.edge)‣ Pajek (.mat)‣ TreeML (.xml)23Sci 2 <strong>Tool</strong>: AlgorithmsSee https://nwb.slis.indiana.edu/communityPreprocessingExtract Top N% RecordsExtract Top N RecordsNormalize TextSlice Table by Line---------------------------------------------Extract Top NodesExtract Nodes Above or Below ValueDelete Isolates---------------------------------------------Extract top EdgesExtract Edges Above or Below ValueRemove Self LoopsTrim by DegreeMST-Pathfinder Network ScalingFast Pathfinder Network Scaling---------------------------------------------Snowball Sampling (in nodes)Node SamplingEdge Sampling---------------------------------------------SymmetrizeDichotomizeMultipartite Joining---------------------------------------------Geocoder---------------------------------------------Extract ZIP CodeModelingR<strong>and</strong>om GraphWatts-StrogatzSmall WorldBarabási-Albert Scale-FreeTARLAnalysisNetwork Analysis <strong>Tool</strong>kit (NAT)Unweighted & UndirectedNode DegreeDegree Distribution---------------------------------------------K-Nearest Neighbor (Java)Watts-Strogatz Clustering CoefficientWatts Strogatz Clustering Coefficient over K---------------------------------------------DiameterAverage Shortest PathShortest Path DistributionNode Betweenness Centrality---------------------------------------------Weak Component ClusteringGlobal Connected Components---------------------------------------------Extract K-CoreAnnotate K-Coreness---------------------------------------------HITSWeighted & UndirectedClustering CoefficientNearest Neighbor DegreeStrength vs DegreeDegree & StrengthAverage Weight vs End-point DegreeStrength DistributionWeight DistributionR<strong>and</strong>omize Weights---------------------------------------------Blondel Community Detection---------------------------------------------HITSUnweighted & DirectedNode IndegreeNode OutdegreeIndegree DistributionOutdegree Distribution---------------------------------------------K-Nearest NeighborSingle Node in-Out Degree Correlations---------------------------------------------Dyad ReciprocityArc ReciprocityAdjacency Transitivity---------------------------------------------Weak Component ClusteringStrong Component Clustering---------------------------------------------24
Sci 2 <strong>Tool</strong>: Algorithms cont.See https://nwb.slis.indiana.edu/community--------------------------------Extract K-CoreAnnotate K-Coreness--------------------------------HITSPageRankWeighted & DirectedHITSWeighted PageRankTextualBurst DetectionVisualizationGnuPlotGUESSImage Viewer---------------------------------------------Radial Tree/Graph (prefuse alpha)Radial Tree/Graph with Annotation(prefuse beta)Tree View (prefuse beta)Tree Map (prefuse beta)Force Directed with Annotation(prefuse beta)Fruchterman-Reingold with Annotation(prefuse beta)---------------------------------------------DrL (VxOrd)Specified (prefuse beta)---------------------------------------------Horizontal Line GraphCircular HierarchyGeo Map (Circle Annotation Style)Geo Map (Colored-Region Annotation Style)ScientometricsRemove ISI Duplicate RecordsRemove Rows with Multitudinous FieldsDetect Duplicate NodesUpdate Network by Merging Nodes---------------------------------------------Extract Directed NetworkExtract Paper Citation NetworkExtract Author Paper Network---------------------------------------------Extract Co-Occurrence NetworkExtract Word Co-Occurrence NetworkExtract Co-Author NetworkExtract Reference Co-Occurrence(Bibliographic Coupling) Network---------------------------------------------Extract Document Co-Citation Network25NWB=Sci 2 <strong>Tool</strong>: Output Formats‣ NWB tool can be used <strong>for</strong> data conversion. Supported output <strong>for</strong>mats comprise:‣ CSV (.csv)‣ NWB (.nwb)‣ Pajek (.net)‣ Pajek (.mat)‣ GraphML (.xml or .graphml)‣ XGMML (.xml)‣ GUESSSupports export <strong>of</strong> images intocommon image file <strong>for</strong>mats.‣ Horizontal Bar Graphs‣ saves out raster <strong>and</strong> ps files.26
Sample Study – NSF Funding <strong>of</strong> STEMUsing NSF Awards Search:http://www.nsf.gov/awardsearchdownload relevant NSF awardsthat have “stem” <strong>and</strong> “education”in title, abstract, <strong>and</strong> awards.Active awards only.Number <strong>of</strong> awards: 1,340Total awarded amount to date:$1,347,802,833Retrieved on Oct 18, 2009Federal K-12 STEM Education Program Funding in 2006SOURCE: Department <strong>of</strong> Education, Report <strong>of</strong> the Academic Competitiveness Council, 2007Search <strong>for</strong> awards that have “stem” <strong>and</strong> “education”in title, abstract, <strong>and</strong> awards.Active awards only. Query run on 10/18/2009.
Top-10 Projects with highest Award Amount to Date1340 Funded ProjectsHorizontal Bar GraphsHorizontal Line Graph was selected.Input Parameters:Start Date: Start DateSize By: Awarded Amount to DateLabel: TitleEnd Date: Expiration DateText, e.g., titleArea size equals numericalvalue, e.g., award amount.Start dateEnd date
1,340 Funded ProjectsGeographic MapsGeocoder was selected.Input Parameters:Place Name Column: Organization StatePlace Type: STATE..........Geo Map (Circle Annotation Style) was selected.Input Parameters:Longitude: LongitudeSize Circles By: Awarded Amount to DateColor Circle Exteriors By: Awarded Amount to DateColor Circle Interiors By: None (no inner color)Exterior Color Scaling: LinearExterior Color Range: Green to RedInterior Color Range: Green to RedSize Scaling: LinearProjection: Albers Equal-Area ConicMap: US StatesAuthor Name: K. BornerInterior Color Scaling: LinearLatitude: LatitudeWhat Co-PI Networks Exist?Extract Directed Network was selected.Input Parameters:Source Column: Principal InvestigatorText Delimiter: |Target Column: Co-PI Name(s)..........Network Analysis <strong>Tool</strong>kit (NAT) was selected.Nodes: 3225Isolated nodes: 276Edges: 2265Average total degree: 1.4047Average in degree: 0.7023Average out degree: 0.7023..........Delete Isolates was selected...........Node Degree was selected...........Weak Component Clustering was selected.Number <strong>of</strong> top clusters: 10722 clusters found, generating graphs<strong>for</strong> the top 10 clusters.Giant component has 39 nodesNext largest networks have 35, 17, 16 nodes
Co-PI Networks – Giant ComponentNodes = investigatorsSize <strong>and</strong> color coded by number <strong>of</strong> collaborators (degree)Directed edges from PI to Co-PIWhat Projects Fund Which PIs?Extract Directed Network was selected.Input Parameters:Source Column: TitleText Delimiter: |Target Column: Principal Investigator..........Network Analysis <strong>Tool</strong>kit (NAT) was selected.Nodes: 2478Isolated nodes: 0Edges: 1337Average total degree: 1.0791Average in degree: 0.5395Average out degree: 0.5395This graph is not weakly connected.<strong>The</strong>re are 1144 weakly connected components. (0 isolates)<strong>The</strong> largest connected component consists <strong>of</strong> 14 nodes.Density (disregarding weights): 0.0002..........Node Indegree was selected...........Node Outdegree was selected...........GUESS
What Projects Fund Which PIs - ZoomWhat Programs at NSF are Co-Funding STEM?Extract Co-Occurrence Network was selected.Input Parameters:Text Delimiter: |Column Name: Program(s)..........Node Degree was selected...........Network Analysis <strong>Tool</strong>kit (NAT) was selected.Nodes: 226Isolated nodes: 71Edges: 483No self loops were discovered.Average degree: 4.2743Density (disregarding weights): 0.019..........GUESS..........Weak Component Clustering was selected.79 clusters found..........Network Analysis <strong>Tool</strong>kit (NAT) was selected.Nodes: 135Isolated nodes: 0Edges: 467No self loops were discovered.Average degree: 6.9185Density (disregarding weights): 0.0516..........GUESS
What Organizations are funded by what NSF Programs?Color <strong>and</strong> size coding bynumber <strong>of</strong> NSF programs thatfund these organizations.Institutions which are fundedby 10 or more programs arelabeled.OrganizationNSF ProgramWhat NSF Programs fund how many Organizations?Color <strong>and</strong> size coding bynumber <strong>of</strong> organizations thatare funded by these programs.NSF programs which fund 10or more organizations arelabeled.OrganizationNSF Program
http://sci.slis.indiana.eduOverview1. Plug-<strong>and</strong>-Play Macroscopes2. <strong>Sci2</strong> <strong>Tool</strong> Introduction <strong>and</strong> Demos3. Sample <strong>Science</strong> <strong>of</strong> <strong>Science</strong> Studies
Type <strong>of</strong> Analysis vs. Level <strong>of</strong> AnalysisMicro/Individual(1-100 records)Meso/Local(101–10,000 records)Macro/Global(10,000 < records)StatisticalAnalysis/Pr<strong>of</strong>ilingIndividual person <strong>and</strong>their expertise pr<strong>of</strong>ilesLarger labs, centers,universities, researchdomains, or statesAll <strong>of</strong> NSF, all <strong>of</strong> USA,all <strong>of</strong> science.Temporal Analysis(When)Funding portfolio <strong>of</strong>one individualMapping topic burstsin 20-years <strong>of</strong> PNAS113 Years <strong>of</strong> Physics<strong>Research</strong>Geospatial Analysis(Where)Career trajectory <strong>of</strong> oneindividualMapping a statesintellectual l<strong>and</strong>scapePNAS PublicationsTopical Analysis(What)Base knowledge fromwhich one grant draws.Knowledge flows inChemistry researchVxOrd/Topic maps <strong>of</strong>NIH fundingNetwork Analysis(With Whom?)NSF Co-PI network <strong>of</strong>one individualCo-author networkNSF’s core competency43Type <strong>of</strong> Analysis vs. Level <strong>of</strong> AnalysisMicro/Individual(1-100 records)Meso/Local(101–10,000 records)Macro/Global(10,000 < records)StatisticalAnalysis/Pr<strong>of</strong>ilingIndividual person <strong>and</strong>their expertise pr<strong>of</strong>ilesLarger labs, centers,universities, researchdomains, or statesAll <strong>of</strong> NSF, all <strong>of</strong> USA,all <strong>of</strong> science.Temporal Analysis(When)Funding portfolio <strong>of</strong>one individualMapping topic burstsin 20-years <strong>of</strong> PNAS113 Years <strong>of</strong> Physics<strong>Research</strong>Geospatial Analysis(Where)Career trajectory <strong>of</strong> oneindividualMapping a statesintellectual l<strong>and</strong>scapePNAS publciationsTopical Analysis(What)Base knowledge fromwhich one grant draws.Knowledge flows inChemistry researchVxOrd/Topic maps <strong>of</strong>NIH fundingNetwork Analysis(With Whom?)NSF Co-PI network <strong>of</strong>one individualCo-author networkNIH’s core competency44
Mapping Indiana’s Intellectual SpaceIdentifyGeospatial/Network‣Analysis Pockets <strong>of</strong> innovation2001-2006, BioMed, IN Scope‣ Pathways from ideas to productsAcademic-Industry collaborations <strong>and</strong> knowledge diffusion‣ Interplay <strong>of</strong> industry <strong>and</strong> academia45Mapping Topic BurstsCo-word space <strong>of</strong>the top 50 highlyfrequent <strong>and</strong> burstywords used in thetop 10% mosthighly cited PNASpublications in1982-2001.Mane & Börner. (2004)PNAS, 101(Suppl. 1):5287-5290.Temporal/Topical Analysis1982-2001, US, PNAS (BioMed) ScopeTopic evolution <strong>and</strong> bursts46
Spatio-Temporal In<strong>for</strong>mation Production <strong>and</strong> Consumption <strong>of</strong> Major U.S.<strong>Research</strong> InstitutionsBörner, Katy, Penumarthy, Shashikant, Meiss, Mark <strong>and</strong> Ke, Weimao. (2006)Mapping the Diffusion <strong>of</strong> Scholarly Knowledge Among Major U.S. <strong>Research</strong>Institutions. Scientometrics. 68(3), pp. 415-426.<strong>Research</strong> questions:1. Does space still matterin the Internet age?2. Does one still have tostudy <strong>and</strong> work at major researchinstitutions in order toTemporal/Geospatialhave access toAnalysishigh quality data <strong>and</strong> expertise1982-2001,<strong>and</strong>US,to producePNAShigh(BioMed) Scopequality research?Citation impact <strong>and</strong> knowledge diffusion3. Does the Internet lead to more global citationpatterns, i.e., more citation links between papersproduced at geographically distant researchinstructions?Contributions:‣ Answer to Qs 1 + 2 is YES.‣ Answer to Qs 3 is NO.‣ Novel approach to analyzing the dual role <strong>of</strong>institutions as in<strong>for</strong>mation producers <strong>and</strong>consumers <strong>and</strong> to study <strong>and</strong> visualize the diffusion<strong>of</strong> in<strong>for</strong>mation among them.47<strong>Research</strong> Collaborations by the Chinese Academy <strong>of</strong> <strong>Science</strong>sBy Weixia (Bonnie) Huang, Russell J. Duhon, Elisha F. Hardy, Katy Börner, Indiana University, USAGeospatial AnalysisWorld, Chinese Academy <strong>of</strong> <strong>Science</strong>Collaboration <strong>and</strong> knowledge diffusion via co-author networksThis map highlights the research co-authorship collaborations <strong>of</strong> the Chinese Academy <strong>of</strong><strong>Science</strong>s with locations in China <strong>and</strong> countries around the world. <strong>The</strong> large geographic mapshows the research collaborations <strong>of</strong> all CAS institutes. Each smaller geographic map shows theresearch collaborations by the CAS researchers in one province-level administrative division.Collaborations between CAS researchers are not included in the data. On each map, locationsare colored on a logarithmic scale by the number <strong>of</strong> collaborations from red to yellow. <strong>The</strong>darkest red is 3,395 collaborations by all <strong>of</strong> CAS with researchers in Beijing. Also, flow lines aredrawn from the location <strong>of</strong> focus to all locations collaborated with. <strong>The</strong> width <strong>of</strong> the flow line islinearly proportional to the number <strong>of</strong> collaborations with the locations it goes to, with thesmallest flow lines representing one collaboration <strong>and</strong> the largest representing differing amountson each geographic map.48
Individual Co-PI NetworkKe & Börner, (2006)Temporal/Network Analysis2001-2006, US, InfoVis ScopeEvolving project-PI networks49Mapping the Evolution <strong>of</strong> Co-Authorship NetworksKe, Visvanath & Börner, (2004) Won 1st price at the IEEE InfoVis Contest.50
Temporal/Network Analysis1986-2004, US, InfoVis ScopeEvolving co-author networks <strong>and</strong> author impact51Studying the Emerging Global Brain: Analyzing <strong>and</strong> Visualizing the Impact <strong>of</strong>Co-Authorship TeamsBörner, Dall’Asta, Ke & Vespignani (2005) Complexity, 10(4):58-67.<strong>Research</strong> question:• Is science driven by prolific single expertsor by high-impact co-authorship teams?Contributions:• New approach to allocate citationalcredit.• Novel weighted graph representation.Temporal/Network Analysis• Visualization <strong>of</strong> the growth 1986-2004, <strong>of</strong> weighted US, InfoVis Scopeco-author network. Impact <strong>of</strong> co-author relations• Centrality measures to identify authorimpact.• Global statistical analysis <strong>of</strong> paperproduction <strong>and</strong> citations in correlationwith co-authorship team size over time.• Local, author-centered entropy measure.52
113 Years <strong>of</strong> Physical Reviewhttp://scimaps.org/dev/map_detail.php?map_id=171Bruce W. Herr II <strong>and</strong> Russell Duhon (Data Mining & Visualization), Elisha F. Hardy (Graphic Design), ShashikantPenumarthy (Data Preparation) <strong>and</strong> Katy Börner (Concept)Topical/Network Analysis1893-2006, World, Physics ScopeTopic evolution, knowledge diffusion, Nobel predictions53Topical Composition <strong>and</strong> Knowledge Flow Patterns in Chemistry <strong>Research</strong><strong>for</strong> 1974 <strong>and</strong> 2004Kevin W. Boyack, Katy Börner, & Richard Klavans (2007)Temporal/Network Analysis1974-2004, US, NSF Chemistry Funding ScopeMapping the main structure, topic evolution, <strong>and</strong> knowledge diffusion54
Interactive Maps <strong>of</strong> <strong>Science</strong> – NIH FundingGoogle maps with charts <strong>and</strong> tablesTopical/Network Analysis2007, US, NIH Funding ScopeMapping the main structure color coded by funding institutehttp://scimaps.org/maps/nih/2007Mapping Transdisciplinary Tobacco Use <strong>Research</strong>Centers PublicationsCompare R01 investigator based funding with TTURCCenter awards in terms <strong>of</strong> number <strong>of</strong> publications <strong>and</strong>evolving co-author networks.Zoss & Börner, <strong>for</strong>thcoming.Temporal/Network Analysis1998-2009, US, Tobacco <strong>Research</strong> ScopeComparing co-author networks with different funding56
Reference MapperDuhon & Börner, <strong>for</strong>thcoming.Topical/Network Analysis2009, US, NSF FundingGrouping interdiciplinary funding proposals <strong>for</strong> review57DataThous<strong>and</strong>s <strong>of</strong> fulltext,locationspecific,timestamped jobpostings fromNature Jobs <strong>and</strong><strong>Science</strong> CareersRSS feeds. <strong>The</strong>posts have beenparsed <strong>and</strong> storedin a relationalMySQL database.Jobs have beengeolocated on aGoogle map.Mapping S&T Job Market Data in Real Time – GeoMapAngela Zoss, Michael Conover
<strong>The</strong> UCSD Map<strong>of</strong> <strong>Science</strong> usedhere is the product<strong>of</strong> a large study byresearchers at theUniversity <strong>of</strong>Cali<strong>for</strong>nia - SanDiego using 7.2million papers <strong>and</strong>over 16,000separate journals,proceedings, <strong>and</strong>series fromThomson Scientific<strong>and</strong> Scopus overthe five year periodfrom 2001 to 2005.<strong>The</strong> UCSD Map <strong>of</strong><strong>Science</strong> used here isthe product <strong>of</strong> a largestudy by researchers atthe University <strong>of</strong>Cali<strong>for</strong>nia - San Diegousing 7.2 millionpapers <strong>and</strong> over16,000 separatejournals, proceedings,<strong>and</strong> series fromThomson Scientific<strong>and</strong> Scopus over thefive year period from2001 to 2005.Jobs were associatedwith nodes in the Map<strong>of</strong> <strong>Science</strong> by way <strong>of</strong>keyword extraction.Mapping S&T Job Market Data in Real Time – SciMapAngela Zoss, Michael Conover
Geospatial <strong>and</strong> Topical/Network Analysis2008-2009, English speaking, Job RSS feedsSupport interactive search <strong>for</strong> job postings in geo <strong>and</strong> topic space.Mapping <strong>Science</strong> Exhibit – 10 Iterations in 10 yearshttp://scimaps.org<strong>The</strong> Power <strong>of</strong> Maps (2005) <strong>Science</strong> Maps <strong>for</strong> Economic Decision Makers (2008)<strong>The</strong> Power <strong>of</strong> Reference Systems (2006)<strong>Science</strong> Maps <strong>for</strong> <strong>Science</strong> Policy Makers (2009)<strong>Science</strong> Maps <strong>for</strong> Scholars (2010)<strong>Science</strong> Maps as Visual Interfaces to Digital Libraries (2011)<strong>Science</strong> Maps <strong>for</strong> Kids (2012)<strong>Science</strong> Forecasts (2013)<strong>The</strong> Power <strong>of</strong> Forecasts (2007) Telling Lies With <strong>Science</strong> Maps (2014)Exhibit has been shown in 72 venues on four continents. Currently at- NSF, 10th Floor, 4201 Wilson Boulevard, Arlington, VA- Wallenberg Hall, Stan<strong>for</strong>d University, CA- Center <strong>of</strong> Advanced European Studies <strong>and</strong> <strong>Research</strong>, Bonn, Germany- <strong>Science</strong> Train, Germany.62
Debut <strong>of</strong> 5 th Iteration <strong>of</strong> Mapping <strong>Science</strong> Exhibit at MEDIA X was on May 18, 2009 at Wallenberg Hall,Stan<strong>for</strong>d University, http://mediax.stan<strong>for</strong>d.edu, http://scaleindependentthought.typepad.com/photos/scimaps63This is the only mockup in this slide show.Everything else is available today.
All papers, maps, cyberinfrastructures, talks, press are linkedfrom http://cns.slis.indiana.edu