Lab: Sugar Content in Beverages - Honors Chemistry Coursework
Lab: Sugar Content in Beverages - Honors Chemistry Coursework
Lab: Sugar Content in Beverages - Honors Chemistry Coursework
- No tags were found...

Create successful ePaper yourself
Turn your PDF publications into a flip-book with our unique Google optimized e-Paper software.
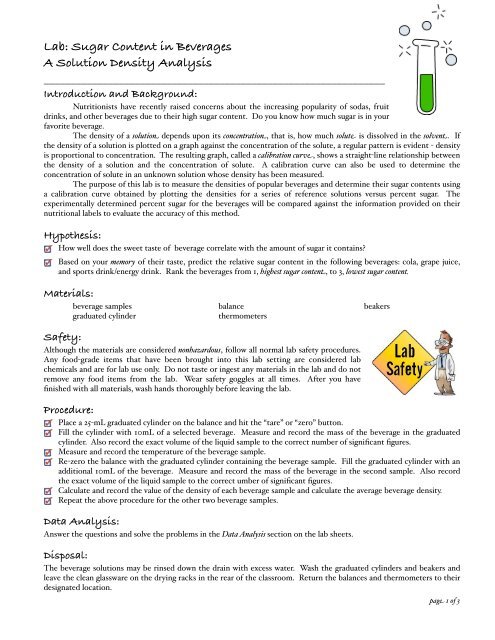
<strong>Lab</strong>: <strong>Sugar</strong> <strong>Content</strong> <strong>in</strong> <strong>Beverages</strong>A Solution Density Analysis________________________________________________________________Introduction and Background: Nutritionists have recently raised concerns about the <strong>in</strong>creas<strong>in</strong>g popularity of sodas, fruitdr<strong>in</strong>ks, and other beverages due to their high sugar content. Do you know how much sugar is <strong>in</strong> yourfavorite beverage. The density of a solution depends upon its concentration, that is, how much solute is dissolved <strong>in</strong> the solvent. Ifthe density of a solution is plotted on a graph aga<strong>in</strong>st the concentration of the solute, a regular pattern is evident - densityis proportional to concentration. The result<strong>in</strong>g graph, called a calibration curve, shows a straight-l<strong>in</strong>e relationship betweenthe density of a solution and the concentration of solute. A calibration curve can also be used to determ<strong>in</strong>e theconcentration of solute <strong>in</strong> an unknown solution whose density has been measured. The purpose of this lab is to measure the densities of popular beverages and determ<strong>in</strong>e their sugar contents us<strong>in</strong>ga calibration curve obta<strong>in</strong>ed by plott<strong>in</strong>g the densities for a series of reference solutions versus percent sugar. Theexperimentally determ<strong>in</strong>ed percent sugar for the beverages will be compared aga<strong>in</strong>st the <strong>in</strong>formation provided on theirnutritional labels to evaluate the accuracy of this method.Hypothesis:How well does the sweet taste of beverage correlate with the amount of sugar it conta<strong>in</strong>s?Based on your memory of their taste, predict the relative sugar content <strong>in</strong> the follow<strong>in</strong>g beverages: cola, grape juice,and sports dr<strong>in</strong>k/energy dr<strong>in</strong>k. Rank the beverages from 1, highest sugar content, to 3, lowest sugar content.Materials: beverage samples balance beakers graduated cyl<strong>in</strong>der thermometersSafety:Although the materials are considered nonhazardous, follow all normal lab safety procedures.Any food-grade items that have been brought <strong>in</strong>to this lab sett<strong>in</strong>g are considered labchemicals and are for lab use only. Do not taste or <strong>in</strong>gest any materials <strong>in</strong> the lab and do notremove any food items from the lab. Wear safety goggles at all times. After you havef<strong>in</strong>ished with all materials, wash hands thoroughly before leav<strong>in</strong>g the lab.Procedure:Place a 25-mL graduated cyl<strong>in</strong>der on the balance and hit the “tare” or “zero” button.Fill the cyl<strong>in</strong>der with 10mL of a selected beverage. Measure and record the mass of the beverage <strong>in</strong> the graduatedcyl<strong>in</strong>der. Also record the exact volume of the liquid sample to the correct number of significant figures.Measure and record the temperature of the beverage sample.Re-zero the balance with the graduated cyl<strong>in</strong>der conta<strong>in</strong><strong>in</strong>g the beverage sample. Fill the graduated cyl<strong>in</strong>der with anadditional 10mL of the beverage. Measure and record the mass of the beverage <strong>in</strong> the second sample. Also recordthe exact volume of the liquid sample to the correct umber of significant figures.Calculate and record the value of the density of each beverage sample and calculate the average beverage density.Repeat the above procedure for the other two beverage samples.Data Analysis:Answer the questions and solve the problems <strong>in</strong> the Data Analysis section on the lab sheets.Disposal:The beverage solutions may be r<strong>in</strong>sed down the dra<strong>in</strong> with excess water. Wash the graduated cyl<strong>in</strong>ders and beakers andleave the clean glassware on the dry<strong>in</strong>g racks <strong>in</strong> the rear of the classroom. Return the balances and thermometers to theirdesignated location.page 1 of 3
<strong>Lab</strong>: <strong>Sugar</strong> <strong>Content</strong> <strong>in</strong> <strong>Beverages</strong>! ! <strong>Lab</strong> Head<strong>in</strong>g:A Solution Density Analysis______________________________________________________________________________Hypothesis:Based on your memory of their taste, predict the relative sugar content <strong>in</strong> the follow<strong>in</strong>g beverages: cola, grape juice,and sports dr<strong>in</strong>k/energy dr<strong>in</strong>k. Rank the beverages from 1, highest sugar content, to 3, lowest sugar content.(1) _________________________ (2) _________________________ (3) _________________________Data and Calculations:SamplenameTrialno.Initialvolume(mL)F<strong>in</strong>alvolume(mL)Samplevolume(mL)Samplemass(g)Density(g/mL)Temp.( o C)Cola 12Grape Juice 12Red Bull 12Average DensityColaGrape JuiceRed BullData Analysis:1. The follow<strong>in</strong>g data represents percent and density values from known sugar solutions. Use this data to create acalibration curve by creat<strong>in</strong>g a Density versus Percent <strong>Sugar</strong> graph of the reference solutions. Use a ruler to draw a“best-fit” straight l<strong>in</strong>e through the data po<strong>in</strong>ts. Be sure to <strong>in</strong>clude all correct labels and units and (of course) beneat.Percent sugarDensity at 20 o C1% 5% 10% 15% 20%1.002 g/mL 1.018 g/mL 1.038 g/mL 1.059 g/mL 1.081 g/mLpage 2 of 3
2. Use the calibration curve you have just created to estimate the sugar concentration of your beverage samples basedon your calculated densities. Record the estimated percent sugar for each different beverage type. Mark and labelthe po<strong>in</strong>ts for each beverage on your calibration curve.Est. Percent <strong>Sugar</strong>ColaGrape JuiceRed Bull3. Consult the nutritional label for the beverage and record the sugar content <strong>in</strong> grams of sugar per serv<strong>in</strong>g and recordthe serv<strong>in</strong>g size <strong>in</strong> milliliters. Then convert this <strong>in</strong>formation to percent sugar <strong>in</strong> the beverage. (Divide the grams ofsugar by the serv<strong>in</strong>g size, then divide by the measured density of the beverage, and f<strong>in</strong>a%y multiply by 100 to make it a percent.)Show a sample of this calculations, <strong>in</strong>clud<strong>in</strong>g all units.ColaGrape JuiceRed Bull<strong>Sugar</strong> <strong>Content</strong> (g) Serv<strong>in</strong>g Size (mL) Calculated % <strong>Sugar</strong>Sample Calculation:4. Calculate the percent error <strong>in</strong> the experimental determ<strong>in</strong>ation of the sugar content. Assume the calculated valuebased on the nutritional label to be the most accurate piece of <strong>in</strong>formation and therefore your accepted. Show asample of this calculation.Percent ErrorColaGrape JuiceRed Bull Sample Calculation:5. This lab exam<strong>in</strong>es the relationship between the density of a beverage and its sugar content. What assumption ismade concern<strong>in</strong>g the other <strong>in</strong>gredients <strong>in</strong> the beverage and their effect on its density? Is this a valid assumption?why or why not?page 3 of 3