CHE 253M Experiment No. 3 LIQUID FLOW MEASUREMENT
CHE 253M Experiment No. 3 LIQUID FLOW MEASUREMENT
CHE 253M Experiment No. 3 LIQUID FLOW MEASUREMENT
- No tags were found...

Create successful ePaper yourself
Turn your PDF publications into a flip-book with our unique Google optimized e-Paper software.
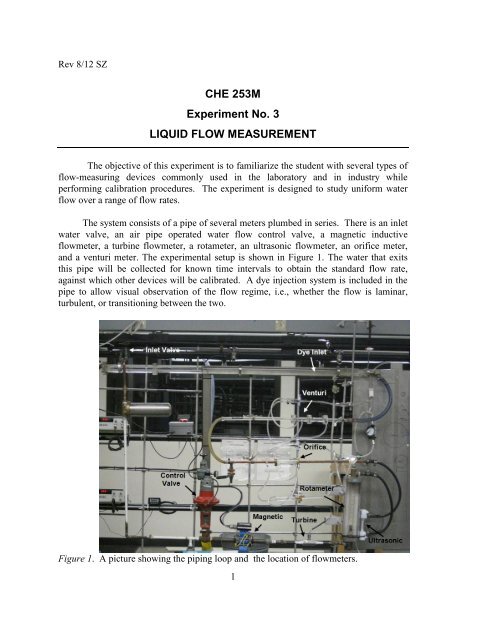
Rev 8/12 SZ<strong>CHE</strong> <strong>253M</strong><strong>Experiment</strong> <strong>No</strong>. 3<strong>LIQUID</strong> <strong>FLOW</strong> <strong>MEASUREMENT</strong>The objective of this experiment is to familiarize the student with several types offlow-measuring devices commonly used in the laboratory and in industry whileperforming calibration procedures. The experiment is designed to study uniform waterflow over a range of flow rates.The system consists of a pipe of several meters plumbed in series. There is an inletwater valve, an air pipe operated water flow control valve, a magnetic inductiveflowmeter, a turbine flowmeter, a rotameter, an ultrasonic flowmeter, an orifice meter,and a venturi meter. The experimental setup is shown in Figure 1. The water that exitsthis pipe will be collected for known time intervals to obtain the standard flow rate,against which other devices will be calibrated. A dye injection system is included in thepipe to allow visual observation of the flow regime, i.e., whether the flow is laminar,turbulent, or transitioning between the two.Figure 1. A picture showing the piping loop and the location of flowmeters.1
THEORYThe Primary StandardIn order to calibrate the flow meters used in this lab, you must compare the outputof the various flow meters to that of a primary standard. The output of the primarystandard is considered the “true” volumetric flow rate passing through the system. Forthis lab, you and your group will come up with and implement a method using agraduated cylinder and a stopwatch to measure the volumetric flow rate passing throughthe system. These data will serve as your primary standard. While there is no “100%correct method” for taking these flow rate measurements, please use what you knowabout measurement uncertainty to devise the best possible method. In your lab write-up(in the results/discussion section) please discuss your procedure and the logic you used toarrive at such a technique.Magnetic-Inductive FlowmeterFigure 2 shows the schematic structure of a magnetic flowmeter. This meteroperates on the basis of the fact that when a conductive fluid (water in this case) flowsthrough a magnetic field, a voltage is induced in the fluid. The induced voltage isproportional to the magnetic field strength, the fluid conductivity, and the velocity of thefluid (and thus the volumetric flowrate, Q v ).For processes in which the working fluid’s conductivity is not changed and theinstrument’s configuration is held constant, the voltage is proportional to fluid velocityonly. In this experiment, the magnetic meter measures the voltage and converts theoutput to a pulse rate (pulses per second or Hertz). The pulse rate is displayed on thepulse counter in units of kHz. Magnetic flow meters are generally expensive but highlyaccurate. They do not require a flow restriction. They are useful only for conductingfluids.2
Figure 2. Schematic structure of a magnetic flowmeter. A magnetic field B is generatedby field coils. D is the pipe diameter. When a conductive fluid travels with a velocity vthrough the magnetic field, a voltage U is induced: U = K (v×B)·D, where K is aninstrument constant.Turbine MeterA diagram of a turbine meter is shown in Figure 3. A turbine-type vaned rotor isplaced in the path of the fluid flow. The rotational motion of the rotor is proportional tothe rate of flow and is sensed by a reluctance-type pickup coil. A permanent magnet isencased in one or all of the rotor vanes. Each time the vane passes the pole of the coil, thechange in the permeability of the magnetic circuit produces a voltage pulse at the outputterminal. The pulse rate is counted by a frequency meter or any other suitable type ofcounter. The count rate is calibrated against the flow rate and is usually linear over arange of flow rates. For flow rates from 0 – 150 cc/sec the manufacturer has providedfollowing calibration empirical relationship between the volumetric flow rate passingthrough the meter and the output frequency:Q = M C * fIn this equation Q is the volumetric flow rate in cc/sec, M C is the universal Sunshineconstant, 73 cm 3 /kHz sec, and f is the output frequency in Hz. Turbine meters aregenerally expensive and accurate, but they are subject to wear and are only useful forparticle-free fluids.3
Figure 3. Cross-sectional view of a turbine flow meterRotameterFigure 4. Schematic diagram of a rotameter.The rotameter offers the advantage of a wide range of flow rates that can be directlymeasured. It is a variable-area meter with a float moving freely in a tapered tube. Figure 4shows the structure of rotameter. For each flowrate, the float is lifted to some point atwhich the upward and downward forces acting on it are in equilibrium. As a fluid movesupward through the tube, the float acts as an obstruction and creates a pressure drop (alsosee orifice and venturi meters). This pressure drop and the buoyancy of the float (whichmay be positive or negative) produce an upward force on the float which is balanced bythe gravitational force. The pressure force is dependent on the flow rate and the annulararea between the float and the tube. As the float rises, the annular area increases, therebyrequiring a larger flowrate to maintain the float position. The basic equation for the4
otameter can be developed in a manner similar to that for the orifice meter, as shown byEquation (3):2gVQ ACw Afw 1/ 2f f w(3)where,Q = volumetric rate of flow, ft 3 /secVf = volume of the float, ft 3 f , w= density of the float and the fluid, lbm/ft 3A f, A w= area of the float and the annular orifice, ft 2C = discharge coefficientThe value of A wvaries with the position of the float due to the taper in the tube.The meter can be calibrated, and typically a scale is shown that directly gives theflowrate. Rotameters are usually not very expensive and their accuracy depends largelyon quality of construction.The rotameter output is given in % max flow, where the maximum flow for thismeter is 3.6 gpm when = 1g/cm 3 and = 1 cP.Orifice and Venturi MetersThese two meters belong to a class of meters called obstruction meters. Theobstruction meter acts as an obstacle placed in the path of the flowing fluid, causinglocalized changes in velocity and, consequently, in pressure. At the point of maximumrestriction, the velocity will be the maximum and the pressure the minimum. Part of thispressure loss is recovered downstream as the velocity energy is changed back intopressure energy. Figure 5 shows the structure of an orifice meter and a venturi meter.5
Figure 5. Diagrams illustrating orifice and venturi meter structure.The nature of the liquid flow, i.e. laminar or turbulent, is described by thedimensionless number called the Reynolds number, Re, which is given by Equation (4)for flow in a cylindrical tube.VDRe (4)where,DV= inside diameter,= liquid density,= linear velocity, and= viscosityThe basic equation for calculating the pressure drop through an orifice or venturiis the mechanical energy balance known as the Bernoulli equation. If subscript 1 refers tothe upstream conditions and subscript 2 to the downstream conditions at the points ofpressure measurement, then the Bernoulli equation is written as:P P V2V22 1 Z Z g1 2 2 1(5) 2gg1 2 c cwhere,6
Orifice and venturi meters cause some permanent loss of pressure due to theturbulence they induce. The magnitude of this permanent pressure loss is dependent on ,Re, and the type of orifice design. This permanent pressure loss is determined bymeasurement of the pressure before the orifice and the pressure far downstream of theorifice.Orifice meters are cheap but cause a high pressure drop, resulting in high fluidpumping costs. Venturi meters are somewhat higher in cost because of more detailedmachining required, but the associated pressure loss is lower than that for orifice plates.Ultrasonic FlowmeterFigure 6. Structure of ultrasonic meterAn ultrasonic flowmeter is illustrated in Figure 6. This flowmeter measures theflow based on the diffference in the time it takes for an ultrasonic wave to travel upstreamas opposed to downstream. If t d is the downstream transit time from A to B, and t u is theupstream transit time from B to A, thenLtd (9)c VcosLtu (10)c Vcoswhere L is the path length, X is the axial spacing between the transducers, c is the speedof sound in the liquid, V is the average linear velocity of the flow, and θ is the anglebetween flow direction and sound transit direction. <strong>No</strong>te that cosθ = X/L. Solvingequations (9) and (10) gives the flow velocity:VL2 t (11)2Xt ut dwhere t=t u -t d . Because V is the average velocity, some small error may be incurred inthe laminar flow regime due to the parabolic velocity profile.8
EXPERIMENTAL PROCEDURE & CALCULATIONSData on the <strong>Experiment</strong>al Setuporifice throat diameter : 0.20 inchesventuri throat diameter: 0.25 inchespipe connected to the orifice: 0.55 inchespipe connected to the venturi: 0.50 inchespipe diameter at the dye injection: 1.75 inchesInitial Setup1) Open the water supply valve to the apparatus2) Open the air supply valve to the control valve actuator3) Connect the pulse counters to the magnetic flow meter and the turbine meter. Becertain that the discharge water hose is in the sink (or else - what a mess!).Part A: Calibrate the magnetic flowmeter, turbine flowmeter, ultrasonic flowmeter androtameter:1) Begin the calibration by setting the water flow to read 30% of max flow on therotameter. Use the graduated cylinder and stopwatch as your primary standard to measurethe volumetric flow rate passing through the system.2) Reduce the water flow rate in 4 even steps to a minimum of 10% of max flow onthe rotameter. Record readings for the turbine meter, magnetic meter, rotameter,ultrasonic meter and, of course, your primary standard.3) Convert readings taken with the bucket and stop watch to cm 3 /sec.4) Plot the ultrasonic meter readings (in cm 3 /min) vs. the bucket/stopwatch readings(in cm 3 /sec)5) Determine least squares equations for the ultrasonic meter.9
Part B: Calibrate the orifice plate and the venturi, assume that the ultrasonic meter is nowthe absolute standard.1) Calculate water flows required to produce Reynolds numbers of 8,000, 15,000,and 20,000 through the orifice. Do this calculation before you come to class. Assume adensity for water of 1.000 g/cm 3 .2) Back calculate the readings required on the ultrasonic meter to achieve the aboveflows by using the least squares equation.3) Set the flows such that the ultrasonic meter reads what you calculated in Part B-2above. Measure P across orifice plate itself and also downstream of the orifice plateusing the pressure gauges and/or manometer (Blue Fluid specific gravity = 1.75). DONOT turn the pressure gauge toggle counter-clockwise. Move from the least sensitive tomost sensitive gauge.4) Repeat steps 1 through 3 for the venturi flowmeter.Part C: Visual Determination of the Onset of Turbulence:1) Ensure that the burettes are filled with a dye solution.2) Adjust the flowrate to 1000 cm 3 /s on the ultrasonic meter. Describe thecharacteristics of laminar flow. Then adjust the flowrate to 6000 cm 3 /s on the ultrasonicmeter. Describe the characteristics of turbulent flow.3) Increase the water flowrate slowly and determine the point at which transitional(random) motion begins to affect the dye pattem downstream of the injection. Repeat ifneeded.4) Repeat the experiment starting from turbulent flow conditions and then reducingflow rate. Record ultrasonic meter readings once laminar flow is detected. Repeat ifneeded.<strong>No</strong>te: At low Reynolds numbers the flow is laminar, as may be judged by a plume of dyeinjected into the pipe. The plume travels straight with the liquid for some distancewithout being disturbed or mixed with the rest of the liquid. At high Reynolds numbersthe flow is turbulent, and the dye is instantly mixed with the rest of the liquid near thepoint of injection. The approximate transition Reynolds number in a pipe is ~ 2100.10
RESULTS1. Show the calibration equations for the magnetic flow meter, turbine flow meter,ultrasonic flowmeter, and the rotameter versus the bucket/stopwatch standard.Report your results in the form y = mx + b, where x is the flow rate, y is theinstrument output, and m and b are the slope and intercept respectively. You needto report the 95% confidence limits on m and b only for the magnetic flow meterand the rotameter. Also include the calibration plots of the rotameter, turbinemeter, ultrasonic meter and the magnetic meter.2. Which is the most precise: the rotameter, ultrasonic meter, or the turbine meterbased on the precision standard discussed in lecture (confidence limits)?3. Compare the accuracy of the ultrasonic meter, turbine meter and the rotameter bycomparing them against the bucket/stopwatch standard. In order to compareaccuracies, all meter outputs must be in the same units. What is the flaw in thisaccuracy test? Which meter is best at low flow rates and which is best at highflow rates? Discuss your observations.4. Calculate the discharge coefficient for the orifice and venturi at Re = 8,000,15,000, and 20,000. Determine and report the permanent pressure loss for bothinstruments at these Reynolds numbers. Which instrument, based on yourmeasurements, would result in lower pumping costs? Explain using the dischargecoefficient and permanent pressure drop data.5. Report the transitional Reynolds number range you observed. Discuss thedifficulties in definining the transitional range in terms of the physics of theexperiment. Why is this a difficult measurement to make?6. Discuss sources of error in this experiment. What could be done to improve theexperiment?7. Include your sample calculations. This section should show the formulas forlinear regression and confidence intervals, but the summations do not have to becarried out by hand. You should show the “t” value for the confidence intervalcalculations. Include other appropriate sample calculations such as the requiredflowrates for the specified Reynolds numbers, the discharge coefficients, etc.8. Discuss the procedure and the logic you used to arrive at the technique you endedup using to measure the flowrates with the primary standard (the bucket andstopwatch method).9. Research the function of a standard pressure regulator; use more than one sourceand cite them using the APA style or ACS style (if a journal reference). Describe11
how this device works. How does the regulator control the downstream pressureof a fluid? What are some limiting cases where the regulator might fail toperform as expected?12