The Procurement Executives Group (PEG)
The Procurement Executives Group (PEG)
The Procurement Executives Group (PEG)
- No tags were found...

You also want an ePaper? Increase the reach of your titles
YUMPU automatically turns print PDFs into web optimized ePapers that Google loves.
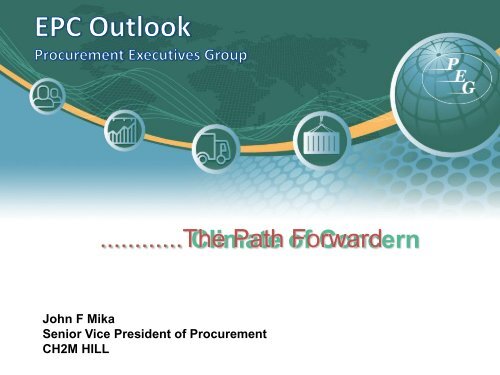
............<strong>The</strong> Climate Path of Forward ConcernJohn F MikaSenior Vice President of <strong>Procurement</strong>CH2M HILL
ProcuP EG<strong>Procurement</strong> <strong>Executives</strong> <strong>Group</strong>AMEC, Peter JessupBechtel, David HammerleBlack & Veatch, Mike GammillBurns & McDonnell, MattNordhusBurns & Roe, Michael ClarkCB&I, Dan KinseyCH2MHill, John MikaFluor, Jim Scotti, Ed RuaneFoster Wheeler USA, JohnCrockettMcDermott, Ryan SiebenkittelJacobs, Harry BreijaertKBR, John TownsendKiewitt, Christopher GonzalezKvaerner Americas Inc., JeaneanSlamenMustang, Ted KellyS & B, Kent MaloneShaw, Gary Dellesky, Jim MaloneTechnip USA, Art Wardlaw<strong>The</strong> Industrial Co., MichaelChambersURS, Joe Christopher, LarryDingerWorley Parsons, Tom BrockZachry, Glenn Kloos3
2011 Membership ProfileENR Rankings•Top Contractors 6 of top 10 are <strong>PEG</strong> 10 of top 25 are <strong>PEG</strong> 12 of top 50 are <strong>PEG</strong>•Top Design Firms 7 of top 10 are <strong>PEG</strong> 13 of top 25 are <strong>PEG</strong> 15 of top 50 are <strong>PEG</strong>•Top International Contractors15 of top 225 are <strong>PEG</strong>4
ProcuP EGCharterCore Values<strong>The</strong> <strong>Procurement</strong> <strong>Executives</strong> <strong>Group</strong>(<strong>PEG</strong>) serves as a forum for theexecutive leadership of procurementand supply management in theengineering and constructionindustry. We seek to represent,promote, and improve thecontributions of our profession to theindustry we serve. In fulfilling thismission, <strong>PEG</strong> and our membercompany representatives arecommitted to a set of Core Values….• Ethics and Integrity• Safety• Quality• Diversity• Sustainability• Collaboration• Leadership in<strong>Procurement</strong>ExcellenceFor more information, visit http://peg-eci.org/5
ProcuP EGHeadlines• Concern around a double dip recession• US and European expansion anemic– Consumer and business confidence– Sovereign worries– Fiscal tightening– Gridlocked US government• Emerging markets fairing better– Best growth– Best pricing potential, selling or buying• Projects– “Giga Projects” is the new landscape6
ProcuP EGGlobal Recovery: Diminished ExpectationsReal GDP Growth2009 2010 2011 2012 2013United States -2.6 2.9 1.5 1.8 2.3Eurozone -4.1 1.7 1.8 1.2 1.6UnitedKingdom -4.9 1.4 1.1 1.9 2.3Japan -6.3 4.0 -0.2 3.9 1.8China 9.2 10.3 9.2 8.3 8.9India 9.1 8.8 7.5 8.1 8.6Brazil -0.6 7.5 4.2 4.6 5.2World -1.9 4.1 3.0 3.6 4.0Source: IHS Global Insight7
P EGU.S. Economic Growth by Sector(Percent change unless otherwise noted)2010 2011 2012 2013Real GDP 3.0 1.5 1.8 2.3Unemployment Rate 9.6 9.1 9.2 8.9Consumption 2.0 2.1 1.9 1.8Light Vehicle Sales (Millions) 11.6 12.5 13.5 15.0Industrial Production (growth) 5.3 3.7 2.0 2.9Housing Starts (Millions) 0.58 0.60 0.67 0.94Business Fixed Investment 4.4 7.8 4.3 5.7Fed Government 4.5 -2.3 -2.9 -3.6CPI 1.6 3.2 1.6 1.810 yr Treasury Yield 3.2 2.8 2.7 2.9Oil Prices (WTI, $/bbl) 79 94 98 106ProcuSource: Global Insight8
ProcuP EGPurchasing Managers‟ Indexes: Manufacturing Slowing DownPMI Manufacturing Indexesvalues over 50 indicate expansion65605550454035302006 2007 2008 2009 2010 2011United States Eurozone ChinaSource: Global Insight9
ProcuP EGPressures in Supply Chains are Beginning to Abate70United States1540China206510156054510550550-550045-10-540-1555-102005 2006 2007 2008 2009 2010 2011 20122005 2006 2007 2008 2009 2010 2011 20126 Month Lag, PMI Component Index - Supplier Deliveries (Left Scale)6 Month Lag, PMI Component Index - Delivery Times (Left Scale)Year over year change, PPI, Core Intermediate Materials (Right Scale)Year over year change, PPI, Total Industrial Products (Right Scale)30Eurozone840Brazil20356154045504204510555-250060-4-5652005 2006 2007 2008 2009 2010 2011 20126 Month Lag, PMI Component Index - Delivery Times (Left Scale)-6552005 2006 2007 2008 2009 2010 2011 20126 Month Lag, PMI Component Index - Supplier Deliveries (Left Scale)-10Year over year change, PPI, Intermediate and Capital Goods (Right Scale)Year over year change, PPI, Industrial Products (Right Scale)Source: Global Insight10
ProcuP EGSupply Base Risks and Influences• Supplier performance• Shop capacity restraints• Global dispersion of supply chain,continues• Regulation changes and compliance• Financial condition and access• Commodity volatility• Energy cost and availability• Counterfeit, fraud, and suspect items11
ProcuP EGMarket Capital Expenditures (Capex)• Power• Oil, Gas, and Chemical (OG&C)• Civil• Mining12
MMBOEDP EG400350300250Global Energy DemandForecast50% GrowthProcu200150100CoalNatural Gas500Liquids1965 1975 1985 1995 2005 2015 2025 2035Fossil fuels projected to meet 80% of energy demand in 2035Source: U.S. Department of Energy, International Energy Outlook & BP StatisticalReview.13
Nominal $US BnNominal $US BnNominal $US BnNominal $US BnProcuP EG160014001200100080060040020009008007006005004003002001000Power Global Capex6004002002010 2011 2012 2013 2014 2015 201602010 2011Civil Global Capex2010 2011 2012 2013 2014 2015 20161200100080050040030020010002010 2011Source: IHS Global InsightOil, Gas & Chemicals Global Capex2010 2011 2012 2013 2014 2015 20162010 2011Mining Global Capex2010 2011 2012 2013 2014 2015 20162010 201114
Nominal $US BnProcuP EGTotal Global Capex(Power, Oil, Gas & Chemical, Civil, Mining40003500300025002000September 2010 ForecastOctober 2011 Forecast1500100050002010 2011 2012 2013 2014 2015Source: IHS Global Insight15
Nominal $US BnProcuP EGRegional Global Capex3,0002,0001,000006 07 08 09 10 11 12 13 14 15Africa North America Western EuropeAsia-Pacific Middle East Latin AmericaEastern EuropeSource: Global Insight16
ProcuP EGEPC Industry Landscape• Strong capital expenditures 2012 – 2015• Significant growth in EPC Spend ahead,some bow wave happening• Global project challenges– Attracting and retaining staff– Local labor shortages– Lack of infrastructure– Remote and challenging locations– Complex scope and size• Global sourcing– Opportunities and challenges17
Nominal $US BnProcuP EGEPC Spend „Crystal Forecast Ball‟ - Spend - Revisited Forecast16001200CivilOG&CMiningPower800400011 12 13 14 1518
Freight Spend in $US BillionsFreight Tons in BillionsProcuP EG‘Crystal Ball‟ – Part II- Revisited18016014012010080604020Total Freight SpendTotal Freight Tons21.81.61.41.210.80.60.40.202011 2012 2013 2014 2015019
ProcuP EG…….Climate of Concern• 40% chance for double dip• Can Washington work again incollaboration• Can the European debt crisis stabilize• From Arab Spring to Arab Fall• Can we continue to be ready forimpending expansionLogistics is even more critical toEPC success!20
ProcuP EGQuestions & Answers21