Example of WDS style article: MS WORD template
Example of WDS style article: MS WORD template
Example of WDS style article: MS WORD template
- No tags were found...

You also want an ePaper? Increase the reach of your titles
YUMPU automatically turns print PDFs into web optimized ePapers that Google loves.
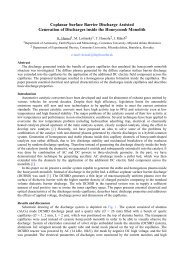
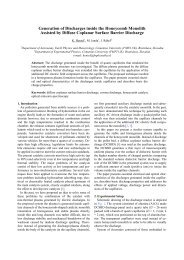
<strong>WDS</strong>'07 Proceedings <strong>of</strong> Contributed Papers, Part II, 134–138, 2007.ISBN 978-80-7378-024-1 © MATFYZPRESSAC Microdischarges in Porous CeramicsM. Leštinský, M. Janda, Z. Machala, K. HenselDepartment <strong>of</strong> Astronomy, Earth Physics and Meteorology, Comenius University, Bratislava, Slovakia.Abstract. Generation <strong>of</strong> microdischarges inside porous ceramics by AC high voltagehas been investigated. Electrical and optical measurements were performed to explorethe physical properties <strong>of</strong> the microdischarges. The effect <strong>of</strong> pore size, dischargepower and gas mixture on the discharge properties and development is described.IntroductionResearch <strong>of</strong> various types <strong>of</strong> non-thermal plasmas generated by electrical discharges at atmosphericpressure has received a fast development in the last two decades. Streamer and pulsed coronas, and various types<strong>of</strong> dielectric or ferroelectric barrier discharges are mostly used. They are typical with nonequilibrium characterand a large amount <strong>of</strong> thin filamentary channels, called microdischarges. The microdischarges produce a largedensity <strong>of</strong> energetic electrons and free radicals at relatively low energy consumption; therefore they represent apotential method for car exhaust cleaning [1-3].In the recent years, there appeared a few pioneering works dealing with the generation <strong>of</strong> microdischargesin narrow cavities and capillaries <strong>of</strong> porous dielectric materials. The objective <strong>of</strong> the paper was to investigate thephysical properties <strong>of</strong> these microdischarges by 50 Hz AC high voltage power supply by the electrical andoptical methods.Experimental SetupThe experimental set-up (Figure 1) includes a discharge reactor and electrical and optical circuits. Thedischarge reactor consisted <strong>of</strong> a porous ceramics placed between two stainless steel mesh electrodes inside thequartz cylinder. The ceramics were composed <strong>of</strong> alumina, and their diameter and thickness were 31 and 7 mm,respectively. The pore sizes <strong>of</strong> the ceramics were from 2 to 200 µm. (Figure 2). The whole reactor was placed ina Faraday cage to reduce induced noise signals.AC regulated high voltage power supply was used to generate the discharge. The voltage on the reactor wasmeasured by a high voltage probe Tektronix P6015A and the discharge current was measured using a currentprobe Pearson Electronics 2877 (1V/A), both linked to the digitizing oscilloscope Tektronix TDS2024 (200MHz, 2.5 GS/s). The total power including power losses in the electrical circuit was measured by the digitalwattmeter Metex 3860M.Optical emission spectroscopy system consisted <strong>of</strong> a dual fiber-optic compact spectrometer Ocean OpticsSD2000 with CCD detector used for fast scanning in the UV and VIS-NIR region (200-500 and 400-1050 nm).The photographs <strong>of</strong> discharge were taken by the digital camera Nikon E4300. All experiments were carried outin mixtures <strong>of</strong> nitrogen and oxygen at atmospheric pressure and at room temperature. The total gas flow rateranged from 0.4 to 2 l/min.Figure 1. Experimental set-up134
LESTINSKY ET AL.: AC MICRODISCHARGES IN POROUS CERAMICS500 µm10 µm 30 µm 50 µm 80 µm 120 µm 200 µm1 cmFigure 2. Structure <strong>of</strong> ceramics.I. Formation <strong>of</strong> microdischargesThe physical mechanism generating microdischarges inside the porous ceramics is probably related to theback-corona discharge, a phenomenon <strong>of</strong>ten found in the electrostatic precipitators [4, 5]. It occurs whencharged dielectric p<strong>article</strong>s are collected on the electrode and form a porous layer <strong>of</strong> high resistivity, which theelectric current must pass through. The highly resistive layer does not allow the charge to decay at a desired rate,resulting in the buildup <strong>of</strong> an excess charge on the layer. When the voltage drop across the layer exceeds acritical value, an ultimate breakdown through the layer occurs. This breakdown is observed as fine dischargechannels called microdischarges. The regular pulsed microdischarges are result <strong>of</strong> repeated chargeaccumulations and subsequent breakdown <strong>of</strong> the dielectric layer.II. Electrical propertiesWe found that the successful generation <strong>of</strong> microdischarges inside the ceramics depends on the pore sizeand the applied voltage. At small voltage only a surface discharge could be observed. With the increase <strong>of</strong> theapplied voltage the surface discharge “leaked into” the ceramics and the microdischarges were formed inside.Figure 3 displays the P-U characteristics after the onset <strong>of</strong> the microdischarges in three different ceramics.While the slope <strong>of</strong> the surface discharge’s characteristics was independent <strong>of</strong> the used ceramics, the slope <strong>of</strong> themicrodischarge characteristics increased with the pore size. The pore size determined the volume <strong>of</strong> thedischarge and thus also limited the discharge current. The increase <strong>of</strong> the slope at the constant voltage was theresult <strong>of</strong> the increase <strong>of</strong> the discharge current. The slope <strong>of</strong> the characteristics increased also with the content <strong>of</strong>nitrogen in the gas mixture (Figure 4), resulting from the changes in the number and the distribution <strong>of</strong> dischargechannels in the ceramics.Figure 3. Discharge power as a function <strong>of</strong> the applied voltage (air).135
LESTINSKY ET AL.: AC MICRODISCHARGES IN POROUS CERAMICSFigure 4. Discharge power as a function <strong>of</strong> the applied voltage (gas mixtures).Figure 5. Current pulse amplitude as a function <strong>of</strong> the pore size (20% O 2 in N 2 ).We recorded oscilloscopic waveforms <strong>of</strong> the applied voltage and the current pulses. The microdischargesoccurred both in negative and positive polarity <strong>of</strong> the applied voltage. During one half-period severalbreakdowns were observed and they were accompanied by a voltage drop almost to zero and a sharp currentpulses. The current pulses had a short duration <strong>of</strong> less than 100 ns and relatively high amplitude reaching severaltenths <strong>of</strong> amps. The amplitude <strong>of</strong> the current pulses increased with the applied voltage and the pore size. At theconstant power, the maximum amplitude <strong>of</strong> the current pulses was observed with 50 and 80 µm pore sizeceramics (Figure 5).III. Optical propertiesWe also recorded a photographs to visualize the macroscopic changes <strong>of</strong> microdischarges, depending onthe gas composition and the pore size. This observations showed that the spatial and temporal distribution <strong>of</strong> thechannels was not steady but randomly changed. The emission intensity increased with the discharge powerresulting from the increase <strong>of</strong> the number <strong>of</strong> discharge channels and the discharge current.We found that the increase <strong>of</strong> the oxygen amount in the gas mixture resulted in a redistribution <strong>of</strong> themicrodischarge channels inside the ceramics. In nitrogen, the light emission was relatively homogenouslydistributed over the whole surface <strong>of</strong> the ceramics. With the increase <strong>of</strong> oxygen a gradual migration <strong>of</strong> thechannels toward the rim <strong>of</strong> the ceramics occurred. Similar effect we observed also in CO 2 (Figure 6). Theincrease <strong>of</strong> oxygen caused also a reduction <strong>of</strong> the total number <strong>of</strong> discharge channels, which resulted in a136
LESTINSKY ET AL.: AC MICRODISCHARGES IN POROUS CERAMICSdecrease <strong>of</strong> the discharge current/power at a given voltage. Comparing all ceramics, at the given power and gasmixture, the most homogenous distribution <strong>of</strong> the channels inside the ceramics was observed for the pore size <strong>of</strong>80 µm (Figure 7).N 2 O 2 Air CO 2Figure 6. The effect <strong>of</strong> gas mixture (pore size 80 µm, P ~ 2-4 W).10 µm 30 µm 80 µm 120 µmFigure 7. The effect <strong>of</strong> pore size (P = 6.4 W, 20% O 2 in N 2 ).Figure 8. Emission spectra <strong>of</strong> microdischarges in UV-VIS region (pore size 80 µm, U = 16.5 kV).Figure 8 presents the emission spectra <strong>of</strong> microdischarges in UV-VIS-NIR region taken at the constantpower in mixtures with various amounts <strong>of</strong> oxygen. In nitrogen containing mixtures, the 2 nd positive system <strong>of</strong>N 2 (C 3 Π u – B 3 Π g ), the 1 st positive system <strong>of</strong> N 2 (B 3 Π g – A 3 Σ u + ) and atomic N and O lines were observed.Based on the spectral bands <strong>of</strong> the N 2 2 nd positive system we were able to determine rotational (T r ) andvibrational (T v ) temperatures by fitting the experimental spectra with the simulated ones using Specair s<strong>of</strong>twarefor spectral simulation [6]. Owing to fast collisional relaxation at atmospheric pressure, the gas temperature T gequals with T r . Vibrational temperature T v > T r indicates the non-equilibrium in the plasma. The temperaturesmeasured for the ceramics with 80 µm pore size were the following:N 2 T g ~ T r = (300 ± 50) K T v = (2000 ± 300) K5% O 2 in N 2 T g ~ T r = (350 ± 50) K T v = (2500 ± 300) K20% O 2 in N 2 T g ~ T r = (400 ± 50) K T v = (2800 ± 300) KThe temperatures increased with the increasing amount <strong>of</strong> O 2 . This is because O 2 is an electronegative gasand so decreases the number <strong>of</strong> electrons by attachment under formation <strong>of</strong> negative ions. Higher energy is thusrequired to sustain the discharge at the same parameters than in nitrogen, thus resulting in higher temperatures.137
SummaryLESTINSKY ET AL.: AC MICRODISCHARGES IN POROUS CERAMICSElectrical and optical properties <strong>of</strong> microdischarges generated inside the porous ceramics by AC highvoltage power have been investigated. The effects <strong>of</strong> the pore size, discharge power and gas mixture on thedischarge properties were described. It was found that the onset voltage <strong>of</strong> the microdischarges decreased withthe pore size, while the slope <strong>of</strong> the P-U characteristics increased with the pore size. Amplitude <strong>of</strong> the currentpulses increased with the applied voltage and the maximum was observed for 50 and 80 µm pore size ceramics.In N 2 , the light emission was relatively homogenously distributed over the whole surface <strong>of</strong> the ceramics, whilein oxygen the microdischarges concentrated mainly at the edges <strong>of</strong> the ceramics. Emission spectroscopy showedthe presence <strong>of</strong> the N 2 systems and atomic N and O lines. Overall, the optimal generation <strong>of</strong> the microdischargesand their distribution in the ceramics was observed for the ceramics with 50 and 80 µm pore size.The microdischarge formation inside porous ceramics represents a novel way to generate large volume <strong>of</strong>stable atmospheric pressure plasmas in hybrid plasma–catalyst reactors, and can be effectively used for flue gastreatment.Acknowledgements. The research has been supported by Slovak Research and Development Agency Grants APVT20-032404 and SK-FR00506 and Slovak Grant Agency VEGA 1/3041/06.References[1] T. Oda, T. Kato, T. Takahashi, K. Shimizu, IEEE Trans. Industry Appl. 1998, 34, 268.[2] T. Yamamoto, M. Okubo, T. Nagaoka, K. Hayakawa, IEEE Trans. Ind. Appl. 2002, 38, 1168.[3] H.-H. Kim, G. Prieto, K. Takashima, S. Katsura, A. Mizuno, J. Electrostat. 2002, 55, 25.[4] A. Mizuno, IEEE Trans. Dielec. Electr. Insul. 2000, 7, 615.[5] A. Jaworek, A. Krupa, T. Czech, J. Phys. D: Appl. Phys. 1996, 29, 2439.[6] C.O. Laux, T.G. Spence, C.H. Kruger, R.N. Zare, Plasma Sources Sci. Technol. 2003, 12, 125.138