Key Performance Indicators - Vodafone
Key Performance Indicators - Vodafone
Key Performance Indicators - Vodafone

You also want an ePaper? Increase the reach of your titles
YUMPU automatically turns print PDFs into web optimized ePapers that Google loves.
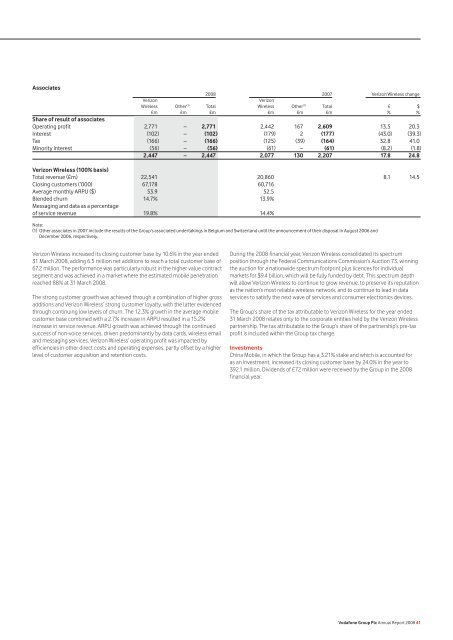
Associates<br />
2008 2007 Verizon Wireless change<br />
Verizon Verizon<br />
Wireless Other (1) Total Wireless Other (1) Total £ $<br />
£m £m £m £m £m £m % %<br />
Share of result of associates<br />
Operating profit 2,771 – 2,771 2,442 167 2,609 13.5 20.3<br />
Interest (102) – (102) (179) 2 (177) (43.0) (39.3)<br />
Tax (166) – (166) (125) (39) (164) 32.8 41.0<br />
Minority interest (56) – (56) (61) – (61) (8.2) (1.8)<br />
2,447 – 2,447 2,077 130 2,207 17.8 24.8<br />
Verizon Wireless (100% basis)<br />
Total revenue (£m) 22,541 20,860 8.1 14.5<br />
Closing customers (’000) 67,178 60,716<br />
Average monthly ARPU ($) 53.9 52.5<br />
Blended churn 14.7% 13.9%<br />
Messaging and data as a percentage<br />
of service revenue 19.8% 14.4%<br />
Note:<br />
(1) Other associates in 2007 include the results of the Group’s associated undertakings in Belgium and Switzerland until the announcement of their disposal in August 2006 and<br />
December 2006, respectively.<br />
Verizon Wireless increased its closing customer base by 10.6% in the year ended<br />
31 March 2008, adding 6.5 million net additions to reach a total customer base of<br />
67.2 million. The performance was particularly robust in the higher value contract<br />
segment and was achieved in a market where the estimated mobile penetration<br />
reached 88% at 31 March 2008.<br />
The strong customer growth was achieved through a combination of higher gross<br />
additions and Verizon Wireless’ strong customer loyalty, with the latter evidenced<br />
through continuing low levels of churn. The 12.3% growth in the average mobile<br />
customer base combined with a 2.7% increase in ARPU resulted in a 15.2%<br />
increase in service revenue. ARPU growth was achieved through the continued<br />
success of non-voice services, driven predominantly by data cards, wireless email<br />
and messaging services. Verizon Wireless’ operating profit was impacted by<br />
efficiencies in other direct costs and operating expenses, partly offset by a higher<br />
level of customer acquisition and retention costs.<br />
During the 2008 financial year, Verizon Wireless consolidated its spectrum<br />
position through the Federal Communications Commission’s Auction 73, winning<br />
the auction for a nationwide spectrum footprint plus licences for individual<br />
markets for $9.4 billion, which will be fully funded by debt. This spectrum depth<br />
will allow Verizon Wireless to continue to grow revenue, to preserve its reputation<br />
as the nation’s most reliable wireless network, and to continue to lead in data<br />
services to satisfy the next wave of services and consumer electronics devices.<br />
The Group’s share of the tax attributable to Verizon Wireless for the year ended<br />
31 March 2008 relates only to the corporate entities held by the Verizon Wireless<br />
partnership. The tax attributable to the Group’s share of the partnership’s pre-tax<br />
profit is included within the Group tax charge.<br />
Investments<br />
China Mobile, in which the Group has a 3.21% stake and which is accounted for<br />
as an investment, increased its closing customer base by 24.0% in the year to<br />
392.1 million. Dividends of £72 million were received by the Group in the 2008<br />
financial year.<br />
<strong>Vodafone</strong> Group Plc Annual Report 2008 41