- Page 2 and 3: LARGE SCALE EFFECTS.OF CLOUD SEEDiN
- Page 4: LARGE SCALE EFFECTSOF CLOUD SEEDING
- Page 11 and 12: eCEC40_ -RBL*UKI-SACSF0SHOWINGPROJE
- Page 13 and 14: IxIAMV 00 N 2Al0 Ww -jAll- 3-~0
- Page 15 and 16: mechanism is used in a supplementar
- Page 17 and 18: ehavior c,ýnforms to the motion of
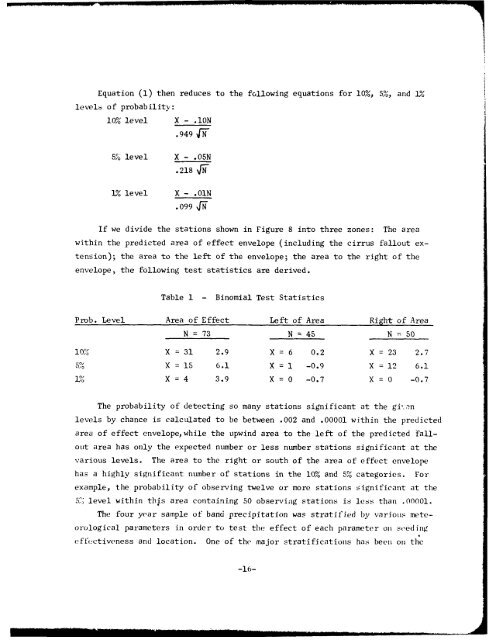
- Page 19 and 20: (nia-
- Page 21 and 22: )0@C~i U7Le0 ~ ~LC',0o-U,-ra-400zoC
- Page 23: LqOL~ LuOw,cp -Ju~Q(0> LLJZ Za-w I
- Page 27 and 28: CCw. L.LjLAJ0 0~ V)0 WU.L7-19-LjIZ
- Page 29 and 30: U.PcliaKY(-InLU)-21- z4 44 NQ-0 Cz~
- Page 31 and 32: 0.Lo
- Page 33 and 34: -44 0 t4o 00
- Page 35 and 36: UiafllwOO~~LLLLLLcc~>~0(r.4c-jCL -2
- Page 37 and 38: TABLE 3-ACONCENTRATION OF SILVER IN
- Page 39 and 40: 0200
- Page 41 and 42: zz~coLU +Uu I SL4L.0~000~0nZ4--'UA1
- Page 43 and 44: C)04~ IIII0uwuj 1. ,,wujwowCw00MIR]
- Page 45 and 46: SEEIN STE DOWNWINDSAN LUIS OBISPO S
- Page 47 and 48: Table 4.Seeded to not seeded statio
- Page 49 and 50: This analysis suggests rather stron
- Page 51 and 52: procedure. The seeding mode will be
- Page 53 and 54: Keyes, C., 1971: Presentation at We
- Page 55 and 56: APPENDIX A (CONT'D)NORTH AMERICAN W
- Page 57 and 58: APPENDIX A (CONT'D)L. A. COUNTY FLO
- Page 59 and 60: APPENDIX A (CONT'D)SANTA BARBARA CO
- Page 61 and 62: APPENDIX B1968-69 BAND CHRONOLOGYPa
- Page 63 and 64: APPENDIX B1970-71 BAND CHRONOLOGY(G
- Page 65 and 66: -~A AAAAAAA\AAAA\AAAAAAAAAAA AAAAAA
- Page 67 and 68: 0 AAAAAAAAAAAAAAAAAA AAAAA AAAAAAH
- Page 69 and 70: AAAAAAm - r-4 C') ,-qNZz H-4 H H0AA
- Page 71 and 72: ý-iAAAAAAAAAAAAAAAOto 41 M M M 14
- Page 73 and 74: 0 o D to No 0C1 ý CAAO=AAAAAAAAAAA
- Page 75 and 76:
CD-4 ~r-.V0 0'-DCC7,Cl) 0 qON C 0N
- Page 77 and 78:
00 -it 0 C14 00 ,*0-"rC CJ~I U Z -4
- Page 79 and 80:
a AAAAAAAgOCDgAAAgýAAAAAAAAAAAAAA
- Page 81 and 82:
C-' C, 0 00 -. r-0 AAc~cAoAAAAAAAC)
- Page 83 and 84:
(Fig. 19) (Fig. 20)Bands Followed b
- Page 85 and 86:
(Fig. 19) (Fig. 20)Bands Followed b
- Page 87 and 88:
A 47E 442.00 .OL .08 .04 .00 .04 .0
- Page 89 and 90:
L 213.00 .11 .24 .01 .14 .01 .00 .0
- Page 91 and 92:
-1. -1. -1. -1. .33 .12 .19 .01 .02
- Page 93 and 94:
.30 -1. .75 .05 .27 .01V 121V 138-1
- Page 95 and 96:
.09 .24 .06 .25 .24 .21 .07 .00 .03
- Page 97 and 98:
E6006-1. -1. -1. -1. .00 -1. .00 .2
- Page 99 and 100:
.07 .26 .12 .28 .22 .44 .92 .18 .04
- Page 101 and 102:
N 7 1968-69.18 .17 .07 .02 - I. -1.
- Page 103 and 104:
-1. -1. -1. -1. .57 1.85 .15 .30 .1
- Page 105 and 106:
v 190.04 .08 .03 .12 .00 .09 .00 .0
- Page 107 and 108:
A 45A 46A 47E0442 1969-70.08 .09 .0
- Page 109 and 110:
L 179 1969-70.00 .13 .00 .03 .00 .2
- Page 111 and 112:
.29 .35 .02 .01 .11 .10 .02 .18 .11
- Page 113 and 114:
.32 .17 .37 .07 .10 .73S 257V 85 19
- Page 115 and 116:
. 14 .00 .OL .00 .00 .55 14• .07
- Page 117 and 118:
.05 .05 .00 .39 .22 .32E9283.12 .02
- Page 119 and 120:
M 228.20 .31 .06 .04 1.35 .50 .32 .
- Page 121 and 122:
.15 .34 .10 .06 1.55 .68 .57 .07 .2
- Page 123 and 124:
.01 .03 .OU .10 .09 .15V 221.00 .13
- Page 125 and 126:
A 44A 45A 464 47E0442 1967-68000 01
- Page 127 and 128:
CO0 020 030 040 160 000 025 000 000
- Page 129 and 130:
020 030 025 045 13t 060 060 000 000
- Page 131 and 132:
050 020 040 035 130 030 ObO 000 000
- Page 133 and 134:
035 020 020 020 180 075 000 000 000
- Page 135 and 136:
CC0 230 000 000 145 ago OOO 080 065
- Page 137 and 138:
050 015 060 060 000 000 000 105 000
- Page 139 and 140:
090 300 110 040 100 090 020 050 020
- Page 141 and 142:
105 060 020 040 050 075 075 090 070
- Page 143 and 144:
04S 225 000 000 150 120 060 150 C65
- Page 145 and 146:
-1 -I -1 -1 015 075 000 205 04' 075
- Page 147 and 148:
065 315 135 070 150 065 000 055 045
- Page 149 and 150:
060 075 060 000 C75 240E4867 1969-7
- Page 151 and 152:
040 090 050 065 170 260L 372 1969-7
- Page 153 and 154:
105 055 050 030 120 230N 11 1969-70
- Page 155 and 156:
C80 060 120 050 160 25SS 249 1969-7
- Page 157 and 158:
120 125 060 070 13U 240V 227 1969-7
- Page 159 and 160:
55 bO 70 100 100 140 135 145 0 80 2
- Page 161 and 162:
80 so 35 0 90 170 135 90 0 75 270 1
- Page 163 and 164:
120 35 160 100N 12A 1970-71N 136019
- Page 165 and 166:
S 251 1970-71110 200 120 85 &65 40
- Page 167:
45 30 0 -1 -1 1 -I 120 0 -1 -1 -l -


![Combat Support in Korea [270 Pages] - The Black Vault](https://img.yumpu.com/49796461/1/190x71/combat-support-in-korea-270-pages-the-black-vault.jpg?quality=85)