EOF analysis
EOF analysis
EOF analysis
- No tags were found...

You also want an ePaper? Increase the reach of your titles
YUMPU automatically turns print PDFs into web optimized ePapers that Google loves.
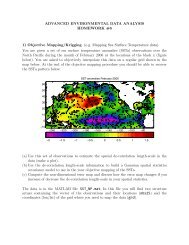
• <strong>EOF</strong> <strong>analysis</strong> determines a set of orthogonalfunctions that characterizes the covariability oftime series for a set of grid points. So instead ofX grid points each with N values in time we haveX <strong>EOF</strong> patterns each with N values in time.• Analogous to Fourier Transform, but more usefulthan FT if the time series has “jumps” in it
How are the <strong>EOF</strong>s chosen?• <strong>EOF</strong> 1: It is the index time series that producesregression/correlation maps with the overall strongestamplitudes.• <strong>EOF</strong> 2: It is the index time series that producesregression/correlation maps with the overall strongestamplitudes AFTER the variability associated with <strong>EOF</strong> 1is subtracted out of the data. And so on for <strong>EOF</strong> 3, 4 etc.Why is this useful?• Going back to the Fourier <strong>analysis</strong> analogy, the data aremore compactly characterized by <strong>EOF</strong>s. Large-scalevariability will be in the low-order <strong>EOF</strong>s and the higherorder<strong>EOF</strong>s will have low-amplitude spatially-incoherent“noise”.
Advantages of <strong>EOF</strong> <strong>analysis</strong>· Produces the index time series which explains thegreatest amount of variability (i.e., amplitude ofregression map)· Convenient method for characterizing dominant spatialpattern of variability· Compact representation of data· <strong>EOF</strong> patterns and time series are linearly independentDisadvantages of <strong>EOF</strong> <strong>analysis</strong>· Can be sensitive to choice of spatial domain and timeperiod· Features can be mixed between <strong>EOF</strong>s if theireigenvalues are similar and the degrees of freedom inthe time series are too small.· No guarantee the <strong>EOF</strong> pattern has physical meaning(i.e., <strong>EOF</strong> <strong>analysis</strong> can create patterns from “noise”)
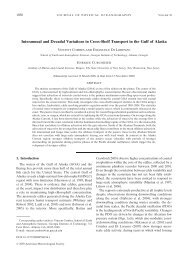
Examples of detrended global <strong>EOF</strong>s insummer calculated over 1980-1999
PC 1 St.Dev.: 0.267 ExpVar 44.29% CumVar 44.29%PC 2 St.Dev.: 0.138 ExpVar 11.92% CumVar 56.21%PC 3 St.Dev.: 0.104 ExpVar 6.75% CumVar 62.96%PC 4 St.Dev.: 0.098 ExpVar 5.98% CumVar 68.95%PC 5 St.Dev.: 0.086 ExpVar 4.64% CumVar 73.59%PC 6 St.Dev.: 0.082 ExpVar 4.22% CumVar 77.81%PC 7 St.Dev.: 0.073 ExpVar 3.29% CumVar 81.10%PC 8 St.Dev.: 0.066 ExpVar 2.75% CumVar 83.84%PC 9 St.Dev.: 0.060 ExpVar 2.25% CumVar 86.09%PC 10 St.Dev.: 0.056 ExpVar 1.94% CumVar 88.02%
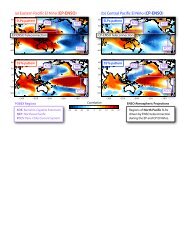
another example NAO relatedfrom Kucharski, Molteni and Bracco, 2006regression of 500 hPa height andSST onto the NAO indexand regression of SST onto WTPindex defined as difference in SSTaveraged over 140E to 170Wand 20S to 20N.
<strong>EOF</strong>1 of the 500 hPaheight from globallySST forcedexperiments andprincipal component(PC) associated with<strong>EOF</strong>1 and globallyaveraged SST (red)<strong>EOF</strong>2 of the 500 hPaheight from EXP1 andPC associated with<strong>EOF</strong>2 and WTP SSTgradient index (red)
Regression of SSTonto PC1 (in K)regression of SSTonto PC2 (in K)