Raven Space Use 587bird per 24 hr; Otis and White 1999). Typically we saw the taggedbird and recorded its location with a hand-held GPS unit. Whenthis was not possible because of dense vegetation or the remotenessof parts of the study area, we triangulated (199 locations, or6% of the total). We based estimates <strong>by</strong> triangulation on at leastthree compass bearings forming angles of 45–110°, obtainedwithin 5 min of each other. Telemetry locations and error polygonswere generated with LOCATE II (Nams 1990), and locations witherror polygons >2.0 ha (a circular area with radius 80 m) wereomitted. The detectability of transmitter signals ranged from1 to 50 km, depending upon the search mode (vehicle, foot, oraircraft), topography, and behavior of the individual birds. Twiceannually (once in the spring and fall) we used vehicle-based radioreceivingequipment to search extensively outside the study site <strong>by</strong>driving up to 150 km beyond its perimeter.We used vocal and visual cues to estimate the abundanceof conspecifics within a 100-m radius of each radio-taggedbird. We verified distance radii for abundance estimates in thefield with a hand-held GPS unit. On the basis of consistentlyhigh raven abundance at locations providing the birds dependablesources of food, we identified eight communal pointsubsidies within the study area: three livestock ranches, twowaste facilities, one hob<strong>by</strong> farm, a fish hatchery, and a prison.To compare the relative importance of point subsidies forbreeders and nonbreeders, we quantified the volume of intersectionof the home ranges of breeders and nonbreeders with a500-m buffer around each communal point subsidy.Space-use analysesAn important measure of avian space use is the home range. Weestimated ravens’ home ranges as the two-dimensional extent oftheir three-dimensional utilization distributions (UDs) on the basisof point locations in ArcGIS 9.2 with the Home Range Tools(HRT) for ArcGIS 9.x (Rodgers et al. 2005) <strong>by</strong> implementing a99% fixed-kernel estimator (Seaman et al. 1999). We estimatedhome ranges for ravens with 10 or more locations and for juvenileravens with 10 or more locations of dispersal outside the natalterritory. Consistent with previous findings with this species(Webb et al. 2009), we established that this definition of adequatesample size was sufficient to quantify relative differences in spaceuse (Garton et al. 2001) <strong>by</strong> determining that there was no positivecorrelation between sample size and home range (R 2 = 0.01,P = 0.49) (Webb et al. 2011a). Using an objective criterion thatminimizes the risk for oversmoothing or undersmoothing (Worton1989, Sain et al. 1994), we selected the smoothing parameter<strong>by</strong> first buffering each location <strong>by</strong> 625 m. This scale relates to datacollection (the square of the minimum resolution of spatial data,25 m), forest management, and reflects a priori distances thoughtrelevant to ravens’ behavior and their sensory abilities. We thengenerated provisional home ranges with different proportions ofHREF until the provisional home range with a continuous outerisopleth closely approximated the 625-m buffer around the largestgrouping of locations for each individual. We chose the smoothingparameter based on the proportion of href associated withthe closest-matching provisional UDs. We generated individualhome ranges for each raven and separate sets of group homeranges for breeders and nonbreeders. We calculated a group homerange for each individual (the focal individual) <strong>by</strong> using locationsfor all members of the group (breeding or nonbreeding) except thefocal individual. We used a two-factor ANOVA to compare averagehome range area across all years between birds of differentsex, different breeding status, and their interaction.In a tagged population, the distances birds move betweenlocations where they are radio-tracked represent anotherimportant aspect of their space use. Therefore, in additionto quantifying home ranges, we measured three indices ofbreeders’ and nonbreeders’ movement, including the median,initial, and maximum distance ravens were located fromthe location where they were initially trapped. We defined abreeder’s extraterritorial movements as any movement fartherfrom the location of initial trapping than the diameter of thelargest contiguous isopleth of its home range.Statistical analysesUsing two-factor ANOVAs for breeders and nonbreeders (subadultswith >10 locations and juveniles with >10 post-dispersallocations), we compared movement indices <strong>by</strong> sex and breedingstatus, as well as their interaction. We defined natal dispersal asthe movements of juvenile ravens between their natal territoryand first breeding territory (Greenwood 1980). Although thereare few records of their natal dispersal, most ravens probablydo not breed until their fourth year or later (Webb 2010). Therefore,we defined juvenile dispersal as the subset of movementsjuvenile ravens made outside their natal territory prior to nataldispersal. We defined a juvenile’s initial movement distance asits first dispersal location outside its natal territory. Based uponobservations of territorial behavior of breeders, this area usuallyextended 0.5 to 1.0 km from the nest. We restricted ouranalyses of space use between relatives to known relationshipsbetween juveniles, broodmates, and their parents established <strong>by</strong>observing reproductive behavior.Since our study was much shorter than the lifespan of manyravens, and we were unable to radio-tag every individual withineach family group, our knowledge of family relationships betweenbirds was incomplete. We assumed that all known parent–offspring relationships were genetic since extra-pair copulation israre among ravens (Boarman and Heinrich 1999), and we did notobserve evidence of this behavior. To characterize the durationof the bonds between adults and their offspring, we also investigatedthe degree of post-dispersal association between juveniles,broodmates, and their parents <strong>by</strong> quantifying the frequency andtiming of locations recorded inside the natal territory after initialdispersal from the natal territory.The amount of space conspecifics share is an important characteristicof space use and provides insight into social behavior. Wequantified space-sharing <strong>by</strong> ravens <strong>by</strong> the index statistic volume ofintersection (VI) (Seidel 1992, Kernohan et al. 2001). The VI indexdetermines the proportion of an animal’s UD which is shared, and
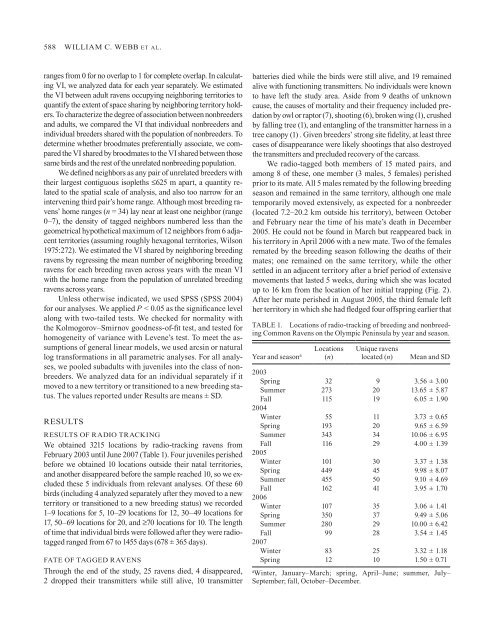
588 William C. Webb et al.ranges from 0 for no overlap to 1 for complete overlap. In calculatingVI, we analyzed data for each year separately. We estimatedthe VI between adult ravens occupying neighboring territories toquantify the extent of space sharing <strong>by</strong> neighboring territory holders.To characterize the degree of association between nonbreedersand adults, we compared the VI that individual nonbreeders andindividual breeders shared with the population of nonbreeders. Todetermine whether broodmates preferentially associate, we comparedthe VI shared <strong>by</strong> broodmates to the VI shared between thosesame birds and the rest of the unrelated nonbreeding population.We defined neighbors as any pair of unrelated breeders withtheir largest contiguous isopleths ≤625 m apart, a quantity relatedto the spatial scale of analysis, and also too narrow for anintervening third pair’s home range. Although most breeding ravens’home ranges (n = 34) lay near at least one neighbor (range0–7), the density of tagged neighbors numbered less than thegeometrical hypothetical maximum of 12 neighbors from 6 adjacentterritories (assuming roughly hexagonal territories, Wilson1975:272). We estimated the VI shared <strong>by</strong> neighboring breedingravens <strong>by</strong> regressing the mean number of neighboring breedingravens for each breeding raven across years with the mean VIwith the home range from the population of unrelated breedingravens across years.Unless otherwise indicated, we used SPSS (SPSS 2004)for our analyses. We applied P < 0.05 as the significance levelalong with two-tailed tests. We checked for normality withthe Kolmogorov–Smirnov goodness-of-fit test, and tested forhomogeneity of variance with Levene’s test. To meet the assumptionsof general linear models, we used arcsin or naturallog transformations in all parametric analyses. For all analyses,we pooled subadults with juveniles into the class of nonbreeders.We analyzed data for an individual separately if itmoved to a new territory or transitioned to a new breeding status.The values reported under Results are means ± SD.RESULTSResults of radio trackingWe obtained 3215 locations <strong>by</strong> radio-tracking ravens fromFebruary 2003 until June 2007 (Table 1). Four juveniles perishedbefore we obtained 10 locations outside their natal territories,and another disappeared before the sample reached 10, so we excludedthese 5 individuals from relevant analyses. Of these 60birds (including 4 analyzed separately after they moved to a newterritory or transitioned to a new breeding status) we recorded1–9 locations for 5, 10–29 locations for 12, 30–49 locations for17, 50–69 locations for 20, and ≥70 locations for 10. The lengthof time that individual birds were followed after they were radiotaggedranged from 67 to 1455 days (678 ± 365 days).Fate of tagged ravensThrough the end of the study, 25 ravens died, 4 disappeared,2 dropped their transmitters while still alive, 10 transmitterbatteries died while the birds were still alive, and 19 remainedalive with functioning transmitters. No individuals were knownto have left the study area. Aside from 9 deaths of unknowncause, the causes of mortality and their frequency included predation<strong>by</strong> owl or raptor (7), shooting (6), broken wing (1), crushed<strong>by</strong> falling tree (1), and entangling of the transmitter harness in atree canopy (1) . Given breeders’ strong site fidelity, at least threecases of disappearance were likely shootings that also destroyedthe transmitters and precluded recovery of the carcass.We radio-tagged both members of 15 mated pairs, andamong 8 of these, one member (3 males, 5 females) perishedprior to its mate. All 5 males remated <strong>by</strong> the following breedingseason and remained in the same territory, although one maletemporarily moved extensively, as expected for a nonbreeder(located 7.2–20.2 km outside his territory), between Octoberand February near the time of his mate’s death in December2005. He could not be found in March but reappeared back inhis territory in April 2006 with a new mate. Two of the femalesremated <strong>by</strong> the breeding season following the deaths of theirmates; one remained on the same territory, while the othersettled in an adjacent territory after a brief period of extensivemovements that lasted 5 weeks, during which she was locatedup to 16 km from the location of her initial trapping (Fig. 2).After her mate perished in August 2005, the third female lefther territory in which she had fledged four offspring earlier thatTABLE 1. Locations of radio-tracking of breeding and nonbreedingCommon Ravens on the Olympic Peninsula <strong>by</strong> year and season.Year and season aLocations(n)Unique ravenslocated (n)Mean and SD2003Spring 32 9 3.56 ± 3.00Summer 273 20 13.65 ± 5.87Fall 115 19 6.05 ± 1.902004Winter 55 11 3.73 ± 0.65Spring 193 20 9.65 ± 6.59Summer 343 34 10.06 ± 6.95Fall 116 29 4.00 ± 1.392005Winter 101 30 3.37 ± 1.38Spring 449 45 9.98 ± 8.07Summer 455 50 9.10 ± 4.69Fall 162 41 3.95 ± 1.702006Winter 107 35 3.06 ± 1.41Spring 350 37 9.49 ± 5.06Summer 280 29 10.00 ± 6.42Fall 99 28 3.54 ± 1.452007Winter 83 25 3.32 ± 1.18Spring 12 10 1.50 ± 0.71aWinter, January–March; spring, April–June; summer, July–September; fall, October–December.


