Ozone chemistry for BEOL resist stripping â A systematic ... - Chemie
Ozone chemistry for BEOL resist stripping â A systematic ... - Chemie
Ozone chemistry for BEOL resist stripping â A systematic ... - Chemie
- No tags were found...

You also want an ePaper? Increase the reach of your titles
YUMPU automatically turns print PDFs into web optimized ePapers that Google loves.
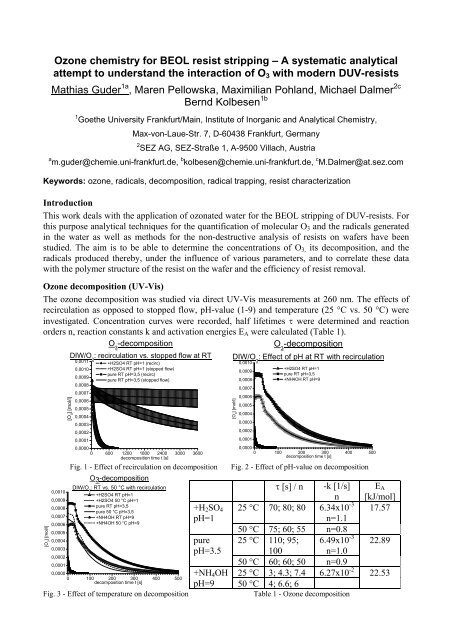
<strong>Ozone</strong> <strong>chemistry</strong> <strong>for</strong> <strong>BEOL</strong> <strong>resist</strong> <strong>stripping</strong> – A <strong>systematic</strong> analyticalattempt to understand the interaction of O 3 with modern DUV-<strong>resist</strong>sMathias Guder 1a , Maren Pellowska, Maximilian Pohland, Michael Dalmer 2cBernd Kolbesen 1b1 Goethe University Frankfurt/Main, Institute of Inorganic and Analytical Chemistry,Max-von-Laue-Str. 7, D-60438 Frankfurt, Germany2 SEZ AG, SEZ-Straße 1, A-9500 Villach, Austriaa m.guder@chemie.uni-frankfurt.de, b kolbesen@chemie.uni-frankfurt.de, c M.Dalmer@at.sez.comKeywords: ozone, radicals, decomposition, radical trapping, <strong>resist</strong> characterizationIntroductionThis work deals with the application of ozonated water <strong>for</strong> the <strong>BEOL</strong> <strong>stripping</strong> of DUV-<strong>resist</strong>s. Forthis purpose analytical techniques <strong>for</strong> the quantification of molecular O 3 and the radicals generatedin the water as well as methods <strong>for</strong> the non-destructive analysis of <strong>resist</strong>s on wafers have beenstudied. The aim is to be able to determine the concentrations of O 3, its decomposition, and theradicals produced thereby, under the influence of various parameters, and to correlate these datawith the polymer structure of the <strong>resist</strong> on the wafer and the efficiency of <strong>resist</strong> removal.<strong>Ozone</strong> decomposition (UV-Vis)The ozone decomposition was studied via direct UV-Vis measurements at 260 nm. The effects ofrecirculation as opposed to stopped flow, pH-value (1-9) and temperature (25 °C vs. 50 °C) wereinvestigated. Concentration curves were recorded, half lifetimes τ were determined and reactionorders n, reaction constants k and activation energies E A were calculated (Table 1).O 3-decompositionO 3-decomposition[O 3] [mol/l]0,00100,00090,00080,00070,00060,00050,00040,00030,00020,0001[O 3] [mol/l]DIW/O 3: recirculation vs. stopped flow at RT0,00110,00100,00090,0008+H2SO4 RT pH=1 (recirc)+H2SO4 RT pH=1 (stopped flow)pure RT pH=3,5 (recirc)pure RT pH=3,5 (stopped flow)0,00070,00060,00050,00040,00030,00020,00010,00000 600 1200 1800 2400 3000 3600decomposition time t [s]Fig. 1 - Effect of recirculation on decompositionO3-decompositionDIW/O 3: RT vs. 50 °C with recirculation+H2SO4 RT pH=1+H2SO4 50 °C pH=1pure RT pH=3,5pure 50 °C pH=3,5+NH4OH RT pH=9+NH4OH 50 °C pH=90,00000 100 200 300 400 500decomposition time t [s]Fig. 3 - Effect of temperature on decomposition+H 2 SO 4pH=1purepH=3.5+NH 4 OHpH=9DIW/O 3: Effect of pH at RT with recirculation[O 3] [mol/l]0,00100,00090,00080,00070,00060,00050,00040,00030,00020,0001+H2SO4 RT pH=1pure RT pH=3,5+NH4OH RT pH=90,00000 100 200 300 400 500decomposition time t [s]Fig. 2 - Effect of pH-value on decompositionτ [s] / n -k [1/s]nE A[kJ/mol]25 °C 70; 80; 80 6.34x10 -3 17.57n=1.150 °C 75; 60; 55 n=0.825 °C 110; 95; 6.49x10 -3 22.89100 n=1.050 °C 60; 60; 50 n=0.925 °C 3; 4.3; 7.4 6.27x10 -2 22.5350 °C 4; 6.6; 6Table 1 - <strong>Ozone</strong> decomposition
Of the three parameters studied recirculation unexpectedly produced the largest increase in thespeed of decomposition - up to 80 times faster with H 2 SO 4 and even 35 times in pure ozonatedwater. Altering the pH from pH=3.5 to 9 increased the speed of decomposition by a factor of 22 andthe increase in temperature only produced an increase of 1.5 times.1; 2; 3; 4The DDL-method <strong>for</strong> radical trappingThe DDL-method is based on the detection of stable <strong>for</strong>maldehyde (CH 2 O) <strong>for</strong>med by the oxidationof either DMSO (Fig. 5) or MeOH (Fig. 7) which is then further converted by the Hantzschreaction 2 to the yellow dye DDL (Fig. 4) and quantified via photometry. The calibration plot <strong>for</strong>both trapping reactions is obtained by measuring the OH radicals from the solution and the onesgenerated by UV irradiation of known amounts of H 2 O 2 (Fig. 6; Fig. 8) as standardized additives.2OOacetylacetoneRadical trapping with DMSO 12 * OH + 22 *CH 3 2 O 2+HFig. 5 - Trapping with DMSORadical trapping with MeOH 3OSDMSOOH<strong>for</strong>maldehydeOHAc/Ac -NH 4+O43 5(pH=4.75)N +1H3,5-diacetyl-1,4-dihydrolutidine (DDL)Fig. 4 – Conversion of CH 2 O to DDLSOHmethanesulfinic acid+ 2CH 3OO *O2CH 3OO * + CH 3OH +H H2+O 22 * CH 3O(yellow, absorbs at 412 nm)*OH generation by UV decomposition of H 2O 2at 310 nm3,0 +H2SO4+H2O2 pH=1+H2O2 pH=3.52,5 +NH4OH+H2O2 pH=90,00,0000 0,0005 0,0010 0,0015 0,0020[*OH] [mol/l] in 10mlFig. 6 – Calibration of DMSO-trapped ·OHHOH OOH2 OCalibration of MeOH-trapped *OH+ * OHC**OH generation by UV decomposition of H 2O 2at 310 nmHH HH-H 2O - * 4,0+H2SO4+H2O2 pH=1OOH H H+H2O2 pH=3.53,5MeOH<strong>for</strong>maldehyde+NH4OH+H2O2 pH=93,0Fig. 7 - Trapping with MeOH2,5+++ H 2 SO 4 pH=1 DMSO: y = 584−25 + 0 .06−0 . 032,0++MeOH: y = 922−189 + 0 .4−0 . 21,5++pure pH=3.5 DMSO: y = 1093−39 + 0 .06−0 . 041,0MeOH:++y = 1052−90 + 1 .35−0 . 080,5+++NH 4 OH DMSO: y = 1356−32 + 0 .23−0 . 030,0++0,0000 0,0005 0,0010 0,0015 0,0020pH=9MeOH: y = 3990−652 + 0 .8−0 . 2[*OH] [mol/l] in 10 mlTable 2 – Calibration curves <strong>for</strong> the DDL-methodFig. 8 - Calibration of MeOH-trapped ·OHBoth calibrations show good linearity over the selected region. In both cases the gradient increaseswith the pH-value of the sample. With faster O 3 -decomposition at high pH-values the radicalconcentration increases as well. Both trapping variations show the same tendency but un<strong>for</strong>tunatelythe difference between the ·OH concentrations obtained which is only slight at pH 1 increases up toa factor of 10 at pH 9. A reason <strong>for</strong> this might be known advanced oxidation processes (AOP’s) 4 .absorbanceabsorbance2,01,51,00,5Calibration of DMSO-trapped *OH
Iodometric titration <strong>for</strong> radical trappingWhile the UV-Vis method allows a selective determination of molecular O 3 , with iodometrictitration the sum of all oxidizing components (O 3 and ·OH in this case) can be measured. Theconcentration of radicals is then obtained as the difference between the two values.2·OH + 2S 2 O 2- 3 → 2OH - + S 4 O 2- 6 (5)O 3 + 2H + + 2S 2 O 2- 2-3 → O 2 + S 4 O 6 + H 2 O (6) mol ·OH = mol S 2 O 2- 3 - 2x mol O 3Two variations of the iodometric titration <strong>for</strong> pure ozonated water were tried out: one with(NH 4 ) 6 Mo 7 O 24 as a catalyst <strong>for</strong> fast and complete oxidation of 2I - to I 2 and the other without.Methodlower limit [·OH]DIW/O 3 pureupper limit [·OH]DIW/O 3 pureDMSO trapping direct calibration / /standard addition 1.07x10 -3 1.43x10 -3MeOH trapping direct calibration 0.39x10 -3 0.401x10 -3standard addition 0.69x10 -3 1.07x10 -3iodometric titration without catalyst 0.61x10 -3with catalyst 1.02x10 -3Table 3 – Comparison of radical concentration calculated from the DDL-method (Table 1) and iodometric titrationResist <strong>stripping</strong> efficiency <strong>for</strong> a polyhydroxystyrene (PHS)-type DUV-<strong>resist</strong>The <strong>resist</strong> <strong>stripping</strong> was studied with different additives to vary the pH-value from 1 to 8 <strong>for</strong> each ofthe four applied process steps. The measurements were carried out in a beaker with 150 mL<strong>stripping</strong> solution under constant stirring. The experiments were conducted in 2 sets, one at 25 °Cand the other at 50 °C. The ozone concentration was continuously monitored by UV/Vis and the<strong>stripping</strong> solutions were renewed when it dropped to half its initial value (0.85 mM/41 ppm → 0.42mM/21 ppm in 5-7 min.). For pH=7 & 8 one minute was chosen as the shortest manageableinterval.Fig. 9 - Results of <strong>resist</strong> <strong>stripping</strong>A= +H 2 SO 4 ; B= +HNO 3 ; C= +HAc; D= +HAc/Ac - ; E= +PO 4 3- ; F= +PO 43-The results show that the minimum <strong>resist</strong> <strong>stripping</strong> time was obtained <strong>for</strong> pH=4.8 with an HAc/Ac - -buffer. Higher and lower pH-values decreased the <strong>stripping</strong> efficiency. Surprisingly an additionaloxidant like HNO 3 produced a strong negative effect on the <strong>stripping</strong> efficiency making it the worststudied additive.
IR-studies on a polyhydroxystyrene (PHS)-type DUV-<strong>resist</strong>With direct IR-measurements on the wafer it is possible even in transmission mode to followstructural changes at successive stages of the process. Knowledge of the <strong>resist</strong> composition enablesthe assignment of peaks to functional groups of the components of the <strong>resist</strong> and allows thedetermination of chemical structures and the changes they undergo. With IR-spectroscopy,structural changes that occur during the process steps (here from the soft bake stage to the softbake+litho stage - Fig. 10) can be followed as well as changes during the <strong>resist</strong> strip (Fig. 11). Thedifferential spectra in Fig. 11 show the sharp decrease of a peak at 1513 cm -1 corresponding to thedecomposition of an aromatic C=C-bond from the PHS side group as well as an increase inintensity at 1745 cm -1 corresponding to the <strong>for</strong>mation of a carboxylic C=O-bond. These resultssuggest a classic ozonolysis reaction under oxidizing conditions (Fig. 12).IR-study of polyhydroxystyrene type DUV-<strong>resist</strong>(tracking of structural changes after different process steps)absorbance*PGOpolyhydroxystyrene/PHSwith protecting group PG*<strong>resist</strong>+softbake+litho<strong>resist</strong>+softbake4000 3500 3000 2500 2000 1500 1000wavenumber (1/cm)absorbancesample 1.2 - coated+softbake in DIW/O 3<strong>for</strong> 5 min.aromatic C=C=C-H0,120,100,080,06PHS-type DUV-<strong>resist</strong>aromatic C=C=C-H-CH 3C=Oaldehydes,ketonesO0,04R0,020,00-0,02sample 1.2 be<strong>for</strong>e O3-0,04 sample 1.2 differential-0,06-0,084000 3500 3000 2500 2000 1500 1000wavenumber (1/cm)-C-Oester * *PGOOO 3*OHOOshould be stable under oxidativeconditions - but conversionOto Acyloin under reductiveconditionsFig. 10 - IR-spectra at successive Fig. 11 – Differential spectra <strong>for</strong> removal Fig. 12 – Possible ozonolysis ofprocess stages process with DIW/O 3 after softbake the aromatic side groupSummaryThe UV-Vis detection of molecular O 3 is a technically mature method. The decomposition rate ofO 3 increases with recirculation, temperature and pH-value. The faster decomposition corresponds tohigher radical concentrations. ·OH values determined <strong>for</strong> the two DDL trapping variations differ athigher pH-values up to a factor of 10 whereas that of DMSO (without any additive = 2-3x10 -3[mol/l]) is close to that obtained by iodometric titration (Table 3). IR-spectroscopy can be used tofollow <strong>resist</strong> changes on the wafer but a precise knowledge of the <strong>resist</strong> composition is needed.Differential spectra taken during the <strong>stripping</strong> process support the assumption of classicalozonolysis as a possible decomposition reaction. For a more sophisticated analysis the knowledgeof the exact <strong>resist</strong> composition is essential. This is neither available from the producers nor couldwe obtain it by GC-MS or HPLC-MS. Resist <strong>stripping</strong> at the pH of 4.8 showed the best results <strong>for</strong>all process steps; <strong>stripping</strong> times increased above and below this value. Increasing the temperatureto 50 °C generally results in increased <strong>resist</strong> <strong>stripping</strong>. However, the interval between renewing thesolutions varies and can be too short <strong>for</strong> a fresh solution to attain this temperature.References[1] Chao Tai et al.; Analytica Chimica Acta 527 (2004) 73-80[2] T. Nash; Biochem J. 1953 Oct;55(3):416-421[3] Dissertation Marion Lackhoff: „Photokatalytische Aktivität ambienter Partikelsysteme“Institut für Wasserchemie und chemische BalneologieLehrstuhl für Hydrogeologie, Hydrochemie und UmweltanalytikDer Technischen Universität MünchenChapter 2.2.2 Page 11[4] Piotr Ulanski, Clemens von Sonntag; J. Chem. Soc., Perkin Trans. 2, 1999, 165-168*