- Page 2 and 3:
TO BE THE PREMIERMULTINATIONALCORPO
- Page 4: GROUP FINANCIALHIGHLIGHTS2011 2010
- Page 12 and 13: BOARD OF DIRECTORSTSUI KAI CHONG, 5
- Page 14 and 15: SENIOR MANAGEMENT1. CHRISTINA TAN H
- Page 18 and 19: INVESTOR RELATIONSas well as two Me
- Page 20 and 21: AWARDS AND ACCOLADES121. Keppel Lan
- Page 22 and 23: SPECIAL FEATURECREATING URBANVITALI
- Page 24 and 25: SPECIAL FEATURETianjin Eco-City als
- Page 26 and 27: OPERATIONS ANDMARKET REVIEWOVERVIEW
- Page 28 and 29: OPERATIONS AND MARKET REVIEWSINGAPO
- Page 30 and 31: OPERATIONS AND MARKET REVIEWSINGAPO
- Page 32 and 33: OPERATIONS AND MARKET REVIEWSINGAPO
- Page 34 and 35: OPERATIONS AND MARKET REVIEWSINGAPO
- Page 36 and 37: OPERATIONS AND MARKET REVIEWPROPERT
- Page 38 and 39: OPERATIONS AND MARKET REVIEWCHINA:
- Page 40 and 41: OPERATIONS AND MARKET REVIEWCHINA12
- Page 42 and 43: OPERATIONS AND MARKET REVIEWCHINACH
- Page 44 and 45: OPERATIONS AND MARKET REVIEWCHINAZH
- Page 46 and 47: OPERATIONS AND MARKET REVIEWVIETNAM
- Page 48 and 49: OPERATIONS AND MARKET REVIEW2INDIA1
- Page 50 and 51: OPERATIONS AND MARKET REVIEWINDONES
- Page 52 and 53: OPERATIONS AND MARKET REVIEWOPERATI
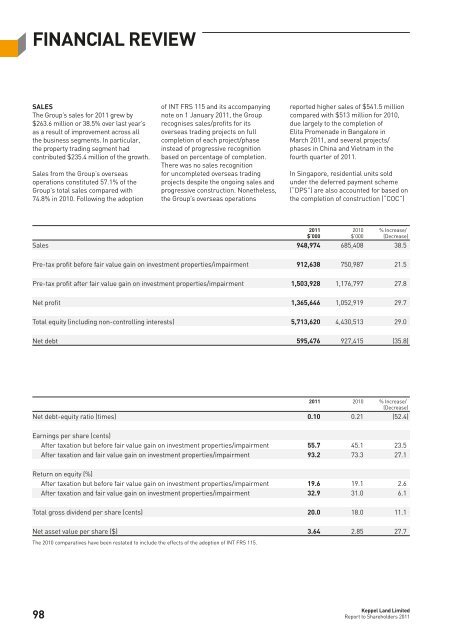
- Page 56 and 57: method. Singapore trading projects
- Page 58 and 59: The Group’s properties held for s
- Page 60 and 61: The second highest net profit wasac
- Page 62 and 63: Analysis by Estimated Gross Floor A
- Page 64 and 65: ECONOMIC VALUE ADDEDEconomic Value
- Page 66 and 67: Value Added Statement2007$ million2
- Page 68 and 69: PRODUCTIVITY DATA (EXCLUDING ASSOCI
- Page 70 and 71: In 2011, net interest cost on exter
- Page 72 and 73: CRITICAL ACCOUNTINGPOLICIESAs requi
- Page 74 and 75: SustainabilityReportKeppel Land is
- Page 76 and 77: The Company’s Directors andManage
- Page 78 and 79: The NEDs actively participate in se
- Page 80 and 81: BOARD PERFORMANCEPrinciple 5:Formal
- Page 82 and 83: Directors’ fees are established a
- Page 84 and 85: ACCOUNTABILITYPrinciple 10:The Boar
- Page 86 and 87: the whistle-blower protection polic
- Page 88 and 89: 21. Keppel Land’s Board Safety Co
- Page 90 and 91: Interested Person TransactionsName
- Page 92 and 93: Sustaining Growth Risk Managementto
- Page 94 and 95: Sustaining Growth Environmentas wel
- Page 96 and 97: Empowering LivesHealthand SafetyKep
- Page 98 and 99: Empowering Lives People Mattertie-u
- Page 100 and 101: Nurturing Communities Community and
- Page 102 and 103: Directors’ ReportFor the financia
- Page 104 and 105:
Directors’ Report1. Directors (co
- Page 106 and 107:
Directors’ Report3. Share Plans o
- Page 108 and 109:
Directors’ Report4. Share Plans o
- Page 110 and 111:
Statement by DirectorsFor the finan
- Page 112 and 113:
Consolidated Profit andLoss Account
- Page 114 and 115:
Balance SheetsAs at 31 December 201
- Page 116 and 117:
Statements of Changes in EquityFore
- Page 118 and 119:
ConsolidatedCash Flow StatementFor
- Page 120 and 121:
Notes to theFinancial StatementsFor
- Page 122 and 123:
Notes to the Financial Statements2.
- Page 124 and 125:
Notes to the Financial Statements2.
- Page 126 and 127:
Notes to the Financial Statements2.
- Page 128 and 129:
Notes to the Financial Statements2.
- Page 130 and 131:
Notes to the Financial Statements2.
- Page 132 and 133:
Notes to the Financial Statements2.
- Page 134 and 135:
Notes to the Financial Statements2.
- Page 136 and 137:
Notes to the Financial Statements2.
- Page 138 and 139:
Notes to the Financial Statements5.
- Page 140 and 141:
Notes to the Financial Statements8.
- Page 142 and 143:
Notes to the Financial Statements12
- Page 144 and 145:
Notes to the Financial Statements13
- Page 146 and 147:
Notes to the Financial Statements15
- Page 148 and 149:
Notes to the Financial Statements15
- Page 150 and 151:
Notes to the Financial Statements15
- Page 152 and 153:
Notes to the Financial Statements16
- Page 154 and 155:
Notes to the Financial Statements17
- Page 156 and 157:
Notes to the Financial Statements18
- Page 158 and 159:
Notes to the Financial Statements19
- Page 160 and 161:
Notes to the Financial Statements22
- Page 162 and 163:
Notes to the Financial Statements23
- Page 164 and 165:
Notes to the Financial Statements25
- Page 166 and 167:
Notes to the Financial Statements27
- Page 168 and 169:
Notes to the Financial Statements28
- Page 170 and 171:
Notes to the Financial Statements30
- Page 172 and 173:
Notes to the Financial Statements31
- Page 174 and 175:
Notes to the Financial Statements32
- Page 176 and 177:
Notes to the Financial Statements35
- Page 178 and 179:
Notes to the Financial Statements36
- Page 180 and 181:
Notes to the Financial Statements36
- Page 182 and 183:
Notes to the Financial Statements36
- Page 184 and 185:
Notes to the Financial Statements37
- Page 186 and 187:
Notes to the Financial Statements40
- Page 188 and 189:
Significant Subsidiary andAssociate
- Page 190 and 191:
Significant Subsidiary and Associat
- Page 192 and 193:
Significant Subsidiary and Associat
- Page 194 and 195:
Corporate InformationBoard of Direc
- Page 196 and 197:
Profile of Directors and Senior Man
- Page 198 and 199:
Profile of Directors and Senior Man
- Page 200 and 201:
Profile of Directors and Senior Man
- Page 202 and 203:
Profile of Directors and Senior Man
- Page 204 and 205:
Calendar of Financial EventsFY 2011
- Page 206 and 207:
Corporate StructureChina Projects10
- Page 208 and 209:
Corporate StructureVietnam and Indo
- Page 210 and 211:
Property PortfolioGroup Properties
- Page 212 and 213:
Property PortfolioGroup Properties
- Page 214 and 215:
Property PortfolioGroup Properties
- Page 216 and 217:
Property PortfolioGroup Properties
- Page 218 and 219:
Property PortfolioGroup Properties
- Page 220 and 221:
Property PortfolioGroup Properties
- Page 222 and 223:
Property PortfolioGroup Properties
- Page 224 and 225:
Property PortfolioGroup Properties
- Page 226 and 227:
Property PortfolioGroup Properties
- Page 228 and 229:
Statistics of ShareholdingsAs at 2
- Page 230 and 231:
Notice ofAnnual General MeetingKepp
- Page 232 and 233:
Notice of Annual General Meeting(ii
- Page 234 and 235:
Notice of Annual General Meeting7.4
- Page 236 and 237:
Share Transaction StatisticsCompara
- Page 238 and 239:
Share Transaction StatisticsInvesto
- Page 240 and 241:
Notes for Proxy Form1. Please inser
- Page 242:
KEPPEL LAND LIMITED(Incorporated in


