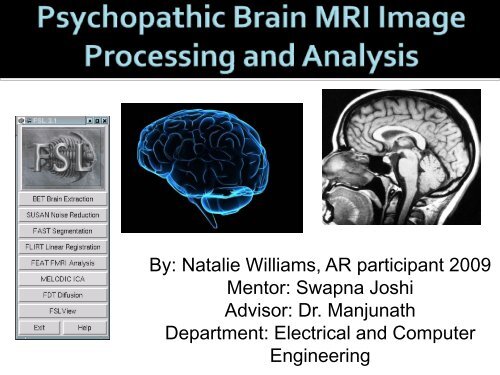
Analyzing 3D Structural Brain MRI Images - CSEP Center for ...
Analyzing 3D Structural Brain MRI Images - CSEP Center for ...
Analyzing 3D Structural Brain MRI Images - CSEP Center for ...
- No tags were found...

Create successful ePaper yourself
Turn your PDF publications into a flip-book with our unique Google optimized e-Paper software.
B.E.T.- <strong>Brain</strong> ExtractionTool• Purpose: take skull andexcess matter out ofimages• Experiment withFractional IntensityThreshold andThreshold Gradient/Record• Script used in batchprocesses“Betbatch.sh”• Record bad resolutionBe<strong>for</strong>e:After:
F.L.I.R.T.- LinearRegistration Tool• Purpose: places eachbrain in a standardorientation andposition• Rigid AffineTrans<strong>for</strong>mation:preserves collinearityand ratios of distances• Rotation, Translation,Scaling,Shearing/Skewing• “FlirtBatch.sh”Template:
Registration ExampleBe<strong>for</strong>e:After:
FSL Software Data• Input: views in incorrectorder (un-swapped), withskull, in a space notstandard, with CSF,White matter and Graymatter not segmented.• Output: views in correctorder (swapped), withoutskull, in the standardspace (template) andsegmented into the threeparts.Be<strong>for</strong>e:After:
Segmentation Output• Necessary <strong>for</strong> thelabeling of whitematter, gray matterand CSF• Labeled as:• 1, CSF• 2, Gray matter• 3, White matter• Can extract one of thethree labeledsegments using Matlabsoftware
Gray Matter• Closely packed neuron cellbodies• Helps with sensory perceptions(seeing, hearing emotions,memory, speech) and musclecontrol• Linked to many disordersincluding:• Schizophrenia, Bipolar Disorder,Obsessive‐compulsive Disorder
Analysis• Kernel Regression 3technique• Best fit curve <strong>for</strong> data,used to recognizepatterns• Comparison ofvariables:• Overall Gray Mattervolume vs. Age (topright)• Overall Gray Mattervolume vs. PCL-R Score(bottom right)Overall Gray Matter-NormalizedOverall Gray Matter-NormalizedAgePCL-R Score
Conclusions• Pre-processing:• <strong>Brain</strong> size and shape differ from person to person• Scans taken from same machine, but head not in the sameposition• Analysis:• Eliminated idea of association of overall gray matter volumeand psychopathic behavior• Contribution to my Research Project:• Provided basis <strong>for</strong> research involving more complexaspects of brain structure• Possible analysis: gray matter volumes at specific regionsin brain
Reflections• Personal:• Pay attention to detail, bepatient and be precise• Voice my opinions and sharemy findings• Ask <strong>for</strong> help, ask questions• Science and Research:• Inter-disciplinary field exposure• Computer/ programming skills• Not always a typical lab setting• Can be really fun and definitelyeye-opening
References1. S.M. Smith, M. Jenkinson, M.W. Woolrich, C.F. Beckmann, T.E.J.Behrens, H. Johansen‐Berg, P.R. Bannister, M. De Luca,I. Drobnjak, D.E. Flitney, R. Niazy, J. Saunders, J. Vickers, Y. Zhang,N. De Stefano, J.M. Brady, and P.M. Matthews. Advances infunctional and structural MR image analysis and implementationas FSL. NeuroImage, 23(S1):208‐219, 2004.2. Purves, Dale, George J. Augustine, David Fitzpatrick, William C.Hall, Anthony‐Samuel LaMantia, James O. McNamara, andLeonard E. White . Neuroscience. 4th ed.. Sinauer Associates.pp. 15‐16, 2008.3. E.A Nadaraya. On estimating regression. Theory of Probability andits applications, 10:186‐190, 1964.
Acknowledgments• Swapna Joshi• Dr. Manjunath, and the Bioin<strong>for</strong>matics Lab• Dr. Scott Grafton• Karthikeyan S.• Apprentice Research Program• Lubi Lenaburg• Anthony Karmis• Herb Waite
THANK YOU!
Kernel Regression• Average representationof data set• Calculated by theweighted average of thedata• Weights are the kernel• Kernel meaning function,in our case is a GaussianCurve (bell curve)Example of kernel at each point: