GP-B Post-Flight Analysis—Final Report - Gravity Probe B - Stanford ...
GP-B Post-Flight Analysis—Final Report - Gravity Probe B - Stanford ...
GP-B Post-Flight Analysis—Final Report - Gravity Probe B - Stanford ...
- No tags were found...

You also want an ePaper? Increase the reach of your titles
YUMPU automatically turns print PDFs into web optimized ePapers that Google loves.
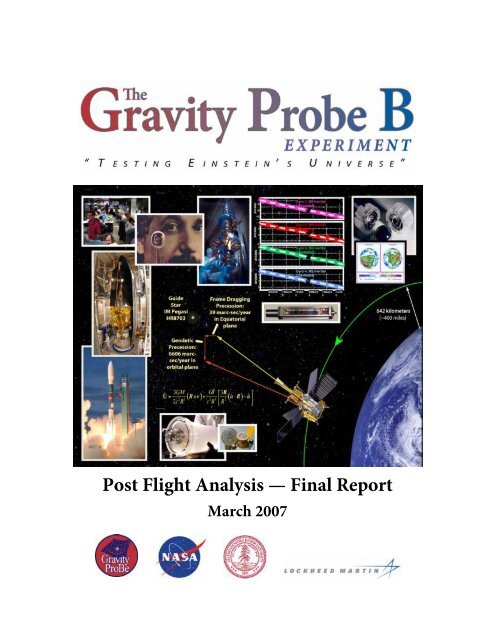
<strong>Post</strong> <strong>Flight</strong> Analysis — Final <strong>Report</strong>March 2007
<strong>Gravity</strong> <strong>Probe</strong> B — <strong>Post</strong> <strong>Flight</strong> Analysis • Final <strong>Report</strong> March 2007 ii
Signatures & ApprovalsPrepared byPublic Affairs Coordinator,<strong>Stanford</strong> University September 10, 2007Robert KahnDateApproved byPrincipal Investigator,<strong>Stanford</strong> University September 10, 2007Francis EverittDateApproved byProgram Manager<strong>Stanford</strong> University September 10, 2007William BenczeDateApproved byDeputy Program Manager<strong>Stanford</strong> University September 10, 2007Tom LangensteinDateTom Langenstein: ITAR Assessment performed. ITAR Control required: ____Yes _X_No<strong>Gravity</strong> <strong>Probe</strong> B — <strong>Post</strong> <strong>Flight</strong> Analysis • Final <strong>Report</strong> March 2007 iii
iv October 2006 Signatures & Approvals
Table of ContentsPreface . . . . . . . . . . . . . . . . . . . . . . . . . . . . . . . . . . . . . . . . . . . . . . . . . . . . . . . . . . . . . . . . . . . . . . . . . . . . . . . . . . . . . . . . . . . xxvii1 Executive Summary . . . . . . . . . . . . . . . . . . . . . . . . . . . . . . . . . . . . . . . . . . . . . . . . . . . . . . . . . . . . . . . . . . . . . . . . . . . . . 11.1 What is <strong>Gravity</strong> <strong>Probe</strong> B? . . . . . . . . . . . . . . . . . . . . . . . . . . . . . . . . . . . . . . . . . . . . . . . . . . . . . . . . . . . . . . . . . . . . . 31.2 A Quest for Experimental Truth . . . . . . . . . . . . . . . . . . . . . . . . . . . . . . . . . . . . . . . . . . . . . . . . . . . . . . . . . . . . . 31.3 The <strong>GP</strong>-B <strong>Flight</strong> Mission . . . . . . . . . . . . . . . . . . . . . . . . . . . . . . . . . . . . . . . . . . . . . . . . . . . . . . . . . . . . . . . . . . . . . . 41.4 The Two Einstein Effects . . . . . . . . . . . . . . . . . . . . . . . . . . . . . . . . . . . . . . . . . . . . . . . . . . . . . . . . . . . . . . . . . . . . . 51.5 Why Perform Another Test of Einstein? . . . . . . . . . . . . . . . . . . . . . . . . . . . . . . . . . . . . . . . . . . . . . . . . . . . . 61.6 Experimental Design & “Near Zeroes” . . . . . . . . . . . . . . . . . . . . . . . . . . . . . . . . . . . . . . . . . . . . . . . . . . . . . . 61.7 Unique and Extraordinary Technologies . . . . . . . . . . . . . . . . . . . . . . . . . . . . . . . . . . . . . . . . . . . . . . . . . . . 71.7.1 The World’s Most Perfect Gyroscopes . . . . . . . . . . . . . . . . . . . . . . . . . . . . . . . . . . . . . . . . . . . . . . . . . . . . . 71.7.2 Gyro Suspension System (GSS) . . . . . . . . . . . . . . . . . . . . . . . . . . . . . . . . . . . . . . . . . . . . . . . . . . . . . . . . . . . 81.7.3 SQUID Magnetometers for Gyro Orientation Readout . . . . . . . . . . . . . . . . . . . . . . . . . . . . . . . . . . . . . 91.7.4 The Pointing Telescope . . . . . . . . . . . . . . . . . . . . . . . . . . . . . . . . . . . . . . . . . . . . . . . . . . . . . . . . . . . . . . . . . 101.7.5 Relating the Guide Star’s Motion to a Distant Quasar . . . . . . . . . . . . . . . . . . . . . . . . . . . . . . . . . . . . . 111.7.6 The Dewar . . . . . . . . . . . . . . . . . . . . . . . . . . . . . . . . . . . . . . . . . . . . . . . . . . . . . . . . . . . . . . . . . . . . . . . . . . . . . . 111.7.7 Spacecraft Control—Nine Degrees of Freedom . . . . . . . . . . . . . . . . . . . . . . . . . . . . . . . . . . . . . . . . . . 131.8 The Management Experiment . . . . . . . . . . . . . . . . . . . . . . . . . . . . . . . . . . . . . . . . . . . . . . . . . . . . . . . . . . . . . . 131.9 The <strong>GP</strong>-B Spacecraft . . . . . . . . . . . . . . . . . . . . . . . . . . . . . . . . . . . . . . . . . . . . . . . . . . . . . . . . . . . . . . . . . . . . . . . . . 141.10 On-Orbit Operations . . . . . . . . . . . . . . . . . . . . . . . . . . . . . . . . . . . . . . . . . . . . . . . . . . . . . . . . . . . . . . . . . . . . . . . . 161.11 Anomaly Resolution . . . . . . . . . . . . . . . . . . . . . . . . . . . . . . . . . . . . . . . . . . . . . . . . . . . . . . . . . . . . . . . . . . . . . . . . . 181.12 Managing Program Risks . . . . . . . . . . . . . . . . . . . . . . . . . . . . . . . . . . . . . . . . . . . . . . . . . . . . . . . . . . . . . . . . . . . 191.13 A Successful Mission . . . . . . . . . . . . . . . . . . . . . . . . . . . . . . . . . . . . . . . . . . . . . . . . . . . . . . . . . . . . . . . . . . . . . . . . 201.14 The Broader Legacy of <strong>GP</strong>-B . . . . . . . . . . . . . . . . . . . . . . . . . . . . . . . . . . . . . . . . . . . . . . . . . . . . . . . . . . . . . . . . 222 Overview of the <strong>GP</strong>-B Experiment & Mission . . . . . . . . . . . . . . . . . . . . . . . . . . . . . . . . . . . . . . . . . . . 232.1 <strong>Gravity</strong> <strong>Probe</strong> B in a Nutshell . . . . . . . . . . . . . . . . . . . . . . . . . . . . . . . . . . . . . . . . . . . . . . . . . . . . . . . . . . . . . . . 252.1.1 A Brief History of <strong>GP</strong>-B . . . . . . . . . . . . . . . . . . . . . . . . . . . . . . . . . . . . . . . . . . . . . . . . . . . . . . . . . . . . . . . . . . 252.1.2 Einstein Stands on Newton’s Shoulders . . . . . . . . . . . . . . . . . . . . . . . . . . . . . . . . . . . . . . . . . . . . . . . . . . 312.1.3 Why perform another test of Einstein? . . . . . . . . . . . . . . . . . . . . . . . . . . . . . . . . . . . . . . . . . . . . . . . . . . . 322.1.4 The Geodetic and Frame-dragging Effects . . . . . . . . . . . . . . . . . . . . . . . . . . . . . . . . . . . . . . . . . . . . . . . 332.1.5 The Significance of the <strong>GP</strong>-B Experiment . . . . . . . . . . . . . . . . . . . . . . . . . . . . . . . . . . . . . . . . . . . . . . . . 342.1.6 The Basic <strong>GP</strong>-B Experimental Design . . . . . . . . . . . . . . . . . . . . . . . . . . . . . . . . . . . . . . . . . . . . . . . . . . . . . 352.1.7 The <strong>GP</strong>-B Spacecraft . . . . . . . . . . . . . . . . . . . . . . . . . . . . . . . . . . . . . . . . . . . . . . . . . . . . . . . . . . . . . . . . . . . . 362.1.8 The Broader Legacy of <strong>GP</strong>-B . . . . . . . . . . . . . . . . . . . . . . . . . . . . . . . . . . . . . . . . . . . . . . . . . . . . . . . . . . . . . 422.2 Spacecraft Launch . . . . . . . . . . . . . . . . . . . . . . . . . . . . . . . . . . . . . . . . . . . . . . . . . . . . . . . . . . . . . . . . . . . . . . . . . . . 432.3 Spacecraft Separation . . . . . . . . . . . . . . . . . . . . . . . . . . . . . . . . . . . . . . . . . . . . . . . . . . . . . . . . . . . . . . . . . . . . . . . 44<strong>Gravity</strong> <strong>Probe</strong> B — <strong>Post</strong> <strong>Flight</strong> Analysis • Final <strong>Report</strong> March 2007 v
2.4 Initialization & Orbit Checkout (IOC) . . . . . . . . . . . . . . . . . . . . . . . . . . . . . . . . . . . . . . . . . . . . . . . . . . . . . . 442.4.1 Overview of IOC . . . . . . . . . . . . . . . . . . . . . . . . . . . . . . . . . . . . . . . . . . . . . . . . . . . . . . . . . . . . . . . . . . . . . . . . 442.4.2 Weekly Summary of IOC Accomplishments . . . . . . . . . . . . . . . . . . . . . . . . . . . . . . . . . . . . . . . . . . . . . . 472.4.3 Overview of Main IOC Tasks . . . . . . . . . . . . . . . . . . . . . . . . . . . . . . . . . . . . . . . . . . . . . . . . . . . . . . . . . . . . . 492.5 Science Phase . . . . . . . . . . . . . . . . . . . . . . . . . . . . . . . . . . . . . . . . . . . . . . . . . . . . . . . . . . . . . . . . . . . . . . . . . . . . . . . . 572.5.1 Overview of the Science Phase . . . . . . . . . . . . . . . . . . . . . . . . . . . . . . . . . . . . . . . . . . . . . . . . . . . . . . . . . . 572.5.2 Monthly Science Phase Highlights . . . . . . . . . . . . . . . . . . . . . . . . . . . . . . . . . . . . . . . . . . . . . . . . . . . . . . . 592.6 Calibration Phase . . . . . . . . . . . . . . . . . . . . . . . . . . . . . . . . . . . . . . . . . . . . . . . . . . . . . . . . . . . . . . . . . . . . . . . . . . . . 612.6.1 Overview of the Calibration Phase . . . . . . . . . . . . . . . . . . . . . . . . . . . . . . . . . . . . . . . . . . . . . . . . . . . . . . . 622.6.2 Weekly Calibration Phase Highlights . . . . . . . . . . . . . . . . . . . . . . . . . . . . . . . . . . . . . . . . . . . . . . . . . . . . 623 Accomplishments & Technology Innovations . . . . . . . . . . . . . . . . . . . . . . . . . . . . . . . . . . . . . . . . . . 653.1 Goals & Accomplishments . . . . . . . . . . . . . . . . . . . . . . . . . . . . . . . . . . . . . . . . . . . . . . . . . . . . . . . . . . . . . . . . . . 673.1.1 <strong>GP</strong>-B’s Seven Near Zeroes . . . . . . . . . . . . . . . . . . . . . . . . . . . . . . . . . . . . . . . . . . . . . . . . . . . . . . . . . . . . . . . 673.1.2 Noteworthy Accomplishments . . . . . . . . . . . . . . . . . . . . . . . . . . . . . . . . . . . . . . . . . . . . . . . . . . . . . . . . . . 683.2 Extraordinary Technology of <strong>GP</strong>-B . . . . . . . . . . . . . . . . . . . . . . . . . . . . . . . . . . . . . . . . . . . . . . . . . . . . . . . . . 693.2.1 An Overview of <strong>GP</strong>-B Technology . . . . . . . . . . . . . . . . . . . . . . . . . . . . . . . . . . . . . . . . . . . . . . . . . . . . . . . 693.2.2 Redundancy in <strong>GP</strong>-B Systems and Technology . . . . . . . . . . . . . . . . . . . . . . . . . . . . . . . . . . . . . . . . . . . 783.2.3 <strong>GP</strong>-B’s Unique Technological Challenges and Solutions . . . . . . . . . . . . . . . . . . . . . . . . . . . . . . . . . . 803.3 <strong>GP</strong>-B Technology Transfer . . . . . . . . . . . . . . . . . . . . . . . . . . . . . . . . . . . . . . . . . . . . . . . . . . . . . . . . . . . . . . . . . . 934 <strong>GP</strong>-B On Orbit . . . . . . . . . . . . . . . . . . . . . . . . . . . . . . . . . . . . . . . . . . . . . . . . . . . . . . . . . . . . . . . . . . . . . . . . . . . . . . . . . . . . 954.1 Overview of On-Orbit Operations . . . . . . . . . . . . . . . . . . . . . . . . . . . . . . . . . . . . . . . . . . . . . . . . . . . . . . . . . . 974.1.1 Three Mission Phases . . . . . . . . . . . . . . . . . . . . . . . . . . . . . . . . . . . . . . . . . . . . . . . . . . . . . . . . . . . . . . . . . . . 974.1.2 Daily Operations Routine . . . . . . . . . . . . . . . . . . . . . . . . . . . . . . . . . . . . . . . . . . . . . . . . . . . . . . . . . . . . . . . 974.1.3 NASA Group Achievement Award . . . . . . . . . . . . . . . . . . . . . . . . . . . . . . . . . . . . . . . . . . . . . . . . . . . . . . . 984.2 Mission Planning . . . . . . . . . . . . . . . . . . . . . . . . . . . . . . . . . . . . . . . . . . . . . . . . . . . . . . . . . . . . . . . . . . . . . . . . . . . . 984.2.1 Function Charter: What is Mission Planning? . . . . . . . . . . . . . . . . . . . . . . . . . . . . . . . . . . . . . . . . . . . . . 984.2.2 Critical Factor: Efficiency . . . . . . . . . . . . . . . . . . . . . . . . . . . . . . . . . . . . . . . . . . . . . . . . . . . . . . . . . . . . . . . 1014.2.3 Critical Factor: Flexibility . . . . . . . . . . . . . . . . . . . . . . . . . . . . . . . . . . . . . . . . . . . . . . . . . . . . . . . . . . . . . . . 1044.2.4 Critical Factor: Error-Free . . . . . . . . . . . . . . . . . . . . . . . . . . . . . . . . . . . . . . . . . . . . . . . . . . . . . . . . . . . . . . . 1064.3 Data Processing . . . . . . . . . . . . . . . . . . . . . . . . . . . . . . . . . . . . . . . . . . . . . . . . . . . . . . . . . . . . . . . . . . . . . . . . . . . . . 1074.3.1 General . . . . . . . . . . . . . . . . . . . . . . . . . . . . . . . . . . . . . . . . . . . . . . . . . . . . . . . . . . . . . . . . . . . . . . . . . . . . . . . . 1074.3.2 Data Archiving . . . . . . . . . . . . . . . . . . . . . . . . . . . . . . . . . . . . . . . . . . . . . . . . . . . . . . . . . . . . . . . . . . . . . . . . . 1104.4 Orbit Determination . . . . . . . . . . . . . . . . . . . . . . . . . . . . . . . . . . . . . . . . . . . . . . . . . . . . . . . . . . . . . . . . . . . . . . . 1104.4.1 The <strong>GP</strong>-B Mission Orbit Design . . . . . . . . . . . . . . . . . . . . . . . . . . . . . . . . . . . . . . . . . . . . . . . . . . . . . . . . . 1114.4.2 Launch Requirements . . . . . . . . . . . . . . . . . . . . . . . . . . . . . . . . . . . . . . . . . . . . . . . . . . . . . . . . . . . . . . . . . . 1124.4.3 <strong>Post</strong>-Launch Orbit Events . . . . . . . . . . . . . . . . . . . . . . . . . . . . . . . . . . . . . . . . . . . . . . . . . . . . . . . . . . . . . . 1134.4.4 Orbit Determination Calculations . . . . . . . . . . . . . . . . . . . . . . . . . . . . . . . . . . . . . . . . . . . . . . . . . . . . . . 1144.4.5 Conclusions . . . . . . . . . . . . . . . . . . . . . . . . . . . . . . . . . . . . . . . . . . . . . . . . . . . . . . . . . . . . . . . . . . . . . . . . . . . 1184.5 Computer Hardware . . . . . . . . . . . . . . . . . . . . . . . . . . . . . . . . . . . . . . . . . . . . . . . . . . . . . . . . . . . . . . . . . . . . . . . 1184.5.1 Reliability . . . . . . . . . . . . . . . . . . . . . . . . . . . . . . . . . . . . . . . . . . . . . . . . . . . . . . . . . . . . . . . . . . . . . . . . . . . . . . 1194.5.2 Disk Storage Issues . . . . . . . . . . . . . . . . . . . . . . . . . . . . . . . . . . . . . . . . . . . . . . . . . . . . . . . . . . . . . . . . . . . . 1194.5.3 System Design – MOC LAN . . . . . . . . . . . . . . . . . . . . . . . . . . . . . . . . . . . . . . . . . . . . . . . . . . . . . . . . . . . . . 1204.5.4 System Design – SCIENCE LAN . . . . . . . . . . . . . . . . . . . . . . . . . . . . . . . . . . . . . . . . . . . . . . . . . . . . . . . . . 1204.5.5 Performance . . . . . . . . . . . . . . . . . . . . . . . . . . . . . . . . . . . . . . . . . . . . . . . . . . . . . . . . . . . . . . . . . . . . . . . . . . . 1204.6 The Integrated Test Facility (ITF) . . . . . . . . . . . . . . . . . . . . . . . . . . . . . . . . . . . . . . . . . . . . . . . . . . . . . . . . . 121vi March 2007 Table of Contents
6.8 Sources and References . . . . . . . . . . . . . . . . . . . . . . . . . . . . . . . . . . . . . . . . . . . . . . . . . . . . . . . . . . . . . . . . . . . . 1667 Attitude & Translation Control Subsystem Analysis . . . . . . . . . . . . . . . . . . . . . . . . . . . . . . . . . 1697.1 ATC Background and Overview . . . . . . . . . . . . . . . . . . . . . . . . . . . . . . . . . . . . . . . . . . . . . . . . . . . . . . . . . . . 1717.1.1 ATC Hardware . . . . . . . . . . . . . . . . . . . . . . . . . . . . . . . . . . . . . . . . . . . . . . . . . . . . . . . . . . . . . . . . . . . . . . . . . 1717.1.2 Vehicle ATC Modes . . . . . . . . . . . . . . . . . . . . . . . . . . . . . . . . . . . . . . . . . . . . . . . . . . . . . . . . . . . . . . . . . . . . 1727.1.3 GS Valid/Invalid . . . . . . . . . . . . . . . . . . . . . . . . . . . . . . . . . . . . . . . . . . . . . . . . . . . . . . . . . . . . . . . . . . . . . . . . 1727.1.4 Guide Star Verification . . . . . . . . . . . . . . . . . . . . . . . . . . . . . . . . . . . . . . . . . . . . . . . . . . . . . . . . . . . . . . . . . 1737.2 He Thruster Technology . . . . . . . . . . . . . . . . . . . . . . . . . . . . . . . . . . . . . . . . . . . . . . . . . . . . . . . . . . . . . . . . . . . 1737.3 ATC Performance . . . . . . . . . . . . . . . . . . . . . . . . . . . . . . . . . . . . . . . . . . . . . . . . . . . . . . . . . . . . . . . . . . . . . . . . . . 1757.3.1 Pitch/Yaw Pointing . . . . . . . . . . . . . . . . . . . . . . . . . . . . . . . . . . . . . . . . . . . . . . . . . . . . . . . . . . . . . . . . . . . . 1757.3.2 Roll Phase Error RMS . . . . . . . . . . . . . . . . . . . . . . . . . . . . . . . . . . . . . . . . . . . . . . . . . . . . . . . . . . . . . . . . . . 1837.3.3 Drag-Free Control System . . . . . . . . . . . . . . . . . . . . . . . . . . . . . . . . . . . . . . . . . . . . . . . . . . . . . . . . . . . . . . 1847.3.4 Pressure Controller/Mass Flow . . . . . . . . . . . . . . . . . . . . . . . . . . . . . . . . . . . . . . . . . . . . . . . . . . . . . . . . . 1867.3.5 Calibration Phase . . . . . . . . . . . . . . . . . . . . . . . . . . . . . . . . . . . . . . . . . . . . . . . . . . . . . . . . . . . . . . . . . . . . . . 1887.4 Conclusions and Performance Summary . . . . . . . . . . . . . . . . . . . . . . . . . . . . . . . . . . . . . . . . . . . . . . . . . 1897.5 <strong>Flight</strong> Challenges/Solutions and Additional Accomplishments . . . . . . . . . . . . . . . . . . . . . . . . 1897.5.1 Quick vehicle stabilization off Delta II w/ failed thruster . . . . . . . . . . . . . . . . . . . . . . . . . . . . . . . . . 1897.5.2 Successful recovery from multiple CCCA reboots . . . . . . . . . . . . . . . . . . . . . . . . . . . . . . . . . . . . . . . 1907.5.3 Supporting higher science roll rate . . . . . . . . . . . . . . . . . . . . . . . . . . . . . . . . . . . . . . . . . . . . . . . . . . . . . 1907.5.4 Successful large-scale dither . . . . . . . . . . . . . . . . . . . . . . . . . . . . . . . . . . . . . . . . . . . . . . . . . . . . . . . . . . . 1907.5.5 ARP Motion Challenges . . . . . . . . . . . . . . . . . . . . . . . . . . . . . . . . . . . . . . . . . . . . . . . . . . . . . . . . . . . . . . . . 1917.5.6 Proton Activity . . . . . . . . . . . . . . . . . . . . . . . . . . . . . . . . . . . . . . . . . . . . . . . . . . . . . . . . . . . . . . . . . . . . . . . . . 1957.5.7 Star Tracker Magnitude Updates . . . . . . . . . . . . . . . . . . . . . . . . . . . . . . . . . . . . . . . . . . . . . . . . . . . . . . . 1997.5.8 Dewar Slosh Control . . . . . . . . . . . . . . . . . . . . . . . . . . . . . . . . . . . . . . . . . . . . . . . . . . . . . . . . . . . . . . . . . . . 1998 Other Spacecraft Subsystems Analyses . . . . . . . . . . . . . . . . . . . . . . . . . . . . . . . . . . . . . . . . . . . . . . . . . 2018.1 Commands & Data Handling (CDH) . . . . . . . . . . . . . . . . . . . . . . . . . . . . . . . . . . . . . . . . . . . . . . . . . . . . . . . 2038.1.1 Performance . . . . . . . . . . . . . . . . . . . . . . . . . . . . . . . . . . . . . . . . . . . . . . . . . . . . . . . . . . . . . . . . . . . . . . . . . . . 2048.1.2 Conclusion . . . . . . . . . . . . . . . . . . . . . . . . . . . . . . . . . . . . . . . . . . . . . . . . . . . . . . . . . . . . . . . . . . . . . . . . . . . . 2068.2 Thermal Control Systems (TCS) . . . . . . . . . . . . . . . . . . . . . . . . . . . . . . . . . . . . . . . . . . . . . . . . . . . . . . . . . . . 2068.2.1 System Performance . . . . . . . . . . . . . . . . . . . . . . . . . . . . . . . . . . . . . . . . . . . . . . . . . . . . . . . . . . . . . . . . . . . 2088.2.2 QBS and SRE Temperature Control . . . . . . . . . . . . . . . . . . . . . . . . . . . . . . . . . . . . . . . . . . . . . . . . . . . . . 2188.2.3 TCS Accomplishments . . . . . . . . . . . . . . . . . . . . . . . . . . . . . . . . . . . . . . . . . . . . . . . . . . . . . . . . . . . . . . . . . 2238.2.4 TCS Summary . . . . . . . . . . . . . . . . . . . . . . . . . . . . . . . . . . . . . . . . . . . . . . . . . . . . . . . . . . . . . . . . . . . . . . . . . . 2238.3 Electrical Power Systems (EPS) . . . . . . . . . . . . . . . . . . . . . . . . . . . . . . . . . . . . . . . . . . . . . . . . . . . . . . . . . . . . 2238.3.1 System Features and Capabilities . . . . . . . . . . . . . . . . . . . . . . . . . . . . . . . . . . . . . . . . . . . . . . . . . . . . . . . 2238.3.2 Critical Mission Requirement . . . . . . . . . . . . . . . . . . . . . . . . . . . . . . . . . . . . . . . . . . . . . . . . . . . . . . . . . . . 2248.3.3 System Performance . . . . . . . . . . . . . . . . . . . . . . . . . . . . . . . . . . . . . . . . . . . . . . . . . . . . . . . . . . . . . . . . . . . 2248.3.4 EPS Accomplishments . . . . . . . . . . . . . . . . . . . . . . . . . . . . . . . . . . . . . . . . . . . . . . . . . . . . . . . . . . . . . . . . . 2248.3.5 Eclipse Cycle . . . . . . . . . . . . . . . . . . . . . . . . . . . . . . . . . . . . . . . . . . . . . . . . . . . . . . . . . . . . . . . . . . . . . . . . . . . 2258.3.6 Bus Power . . . . . . . . . . . . . . . . . . . . . . . . . . . . . . . . . . . . . . . . . . . . . . . . . . . . . . . . . . . . . . . . . . . . . . . . . . . . . 2258.3.7 Batteries . . . . . . . . . . . . . . . . . . . . . . . . . . . . . . . . . . . . . . . . . . . . . . . . . . . . . . . . . . . . . . . . . . . . . . . . . . . . . . . 2268.3.8 Solar Array Power . . . . . . . . . . . . . . . . . . . . . . . . . . . . . . . . . . . . . . . . . . . . . . . . . . . . . . . . . . . . . . . . . . . . . . 2288.3.9 Solar Array Power Degradation Analysis . . . . . . . . . . . . . . . . . . . . . . . . . . . . . . . . . . . . . . . . . . . . . . . . 2308.3.10 Conclusion . . . . . . . . . . . . . . . . . . . . . . . . . . . . . . . . . . . . . . . . . . . . . . . . . . . . . . . . . . . . . . . . . . . . . . . . . . . . 232viii March 2007 Table of Contents
8.4 Communications . . . . . . . . . . . . . . . . . . . . . . . . . . . . . . . . . . . . . . . . . . . . . . . . . . . . . . . . . . . . . . . . . . . . . . . . . . . . 2328.4.1 TDRSS Operations . . . . . . . . . . . . . . . . . . . . . . . . . . . . . . . . . . . . . . . . . . . . . . . . . . . . . . . . . . . . . . . . . . . . . 2348.4.2 Ground Network Operations . . . . . . . . . . . . . . . . . . . . . . . . . . . . . . . . . . . . . . . . . . . . . . . . . . . . . . . . . . . 2358.4.3 Communications Anomalies . . . . . . . . . . . . . . . . . . . . . . . . . . . . . . . . . . . . . . . . . . . . . . . . . . . . . . . . . . . 2358.4.4 Communications—Prime Mission and Beyond . . . . . . . . . . . . . . . . . . . . . . . . . . . . . . . . . . . . . . . . . . 2398.5 <strong>Flight</strong> Software (FSW) . . . . . . . . . . . . . . . . . . . . . . . . . . . . . . . . . . . . . . . . . . . . . . . . . . . . . . . . . . . . . . . . . . . . . . 2398.5.1 Requirements Satisfaction . . . . . . . . . . . . . . . . . . . . . . . . . . . . . . . . . . . . . . . . . . . . . . . . . . . . . . . . . . . . . 2398.5.2 <strong>Flight</strong> Software Statistics . . . . . . . . . . . . . . . . . . . . . . . . . . . . . . . . . . . . . . . . . . . . . . . . . . . . . . . . . . . . . . . 2418.5.3 Test It Like You Fly It . . . . . . . . . . . . . . . . . . . . . . . . . . . . . . . . . . . . . . . . . . . . . . . . . . . . . . . . . . . . . . . . . . . 2428.5.4 On-Orbit Software Changes . . . . . . . . . . . . . . . . . . . . . . . . . . . . . . . . . . . . . . . . . . . . . . . . . . . . . . . . . . . . 2438.5.5 Safemode Discussion . . . . . . . . . . . . . . . . . . . . . . . . . . . . . . . . . . . . . . . . . . . . . . . . . . . . . . . . . . . . . . . . . . 2468.5.6 CCCA Single Bit Errors . . . . . . . . . . . . . . . . . . . . . . . . . . . . . . . . . . . . . . . . . . . . . . . . . . . . . . . . . . . . . . . . . . 2488.5.7 CCCA Multi-Bit Errors . . . . . . . . . . . . . . . . . . . . . . . . . . . . . . . . . . . . . . . . . . . . . . . . . . . . . . . . . . . . . . . . . . 2529 Gyro Suspension Subsystem (GSS) Analysis . . . . . . . . . . . . . . . . . . . . . . . . . . . . . . . . . . . . . . . . . . . 2559.1 GSS Hardware Description . . . . . . . . . . . . . . . . . . . . . . . . . . . . . . . . . . . . . . . . . . . . . . . . . . . . . . . . . . . . . . . . . 2589.1.1 Low voltage drive amplifier . . . . . . . . . . . . . . . . . . . . . . . . . . . . . . . . . . . . . . . . . . . . . . . . . . . . . . . . . . . . 2589.1.2 High voltage drive amplifier . . . . . . . . . . . . . . . . . . . . . . . . . . . . . . . . . . . . . . . . . . . . . . . . . . . . . . . . . . . . 2589.1.3 Computer drive . . . . . . . . . . . . . . . . . . . . . . . . . . . . . . . . . . . . . . . . . . . . . . . . . . . . . . . . . . . . . . . . . . . . . . . . 2599.1.4 Position Bridge . . . . . . . . . . . . . . . . . . . . . . . . . . . . . . . . . . . . . . . . . . . . . . . . . . . . . . . . . . . . . . . . . . . . . . . . 2599.1.5 Analog Backup Controllers . . . . . . . . . . . . . . . . . . . . . . . . . . . . . . . . . . . . . . . . . . . . . . . . . . . . . . . . . . . . . 2599.1.6 Suspension arbiter . . . . . . . . . . . . . . . . . . . . . . . . . . . . . . . . . . . . . . . . . . . . . . . . . . . . . . . . . . . . . . . . . . . . . 2609.1.7 Mode Register . . . . . . . . . . . . . . . . . . . . . . . . . . . . . . . . . . . . . . . . . . . . . . . . . . . . . . . . . . . . . . . . . . . . . . . . . 2609.1.8 Forward Communication Link . . . . . . . . . . . . . . . . . . . . . . . . . . . . . . . . . . . . . . . . . . . . . . . . . . . . . . . . . . 2619.1.9 RAD6000 Processor . . . . . . . . . . . . . . . . . . . . . . . . . . . . . . . . . . . . . . . . . . . . . . . . . . . . . . . . . . . . . . . . . . . . 2619.1.10 Mux and Timing . . . . . . . . . . . . . . . . . . . . . . . . . . . . . . . . . . . . . . . . . . . . . . . . . . . . . . . . . . . . . . . . . . . . . . . 2619.1.11 Clock synchronization . . . . . . . . . . . . . . . . . . . . . . . . . . . . . . . . . . . . . . . . . . . . . . . . . . . . . . . . . . . . . . . . . 2629.1.12 Aft Comm Link . . . . . . . . . . . . . . . . . . . . . . . . . . . . . . . . . . . . . . . . . . . . . . . . . . . . . . . . . . . . . . . . . . . . . . . . . 2629.1.13 Power supply . . . . . . . . . . . . . . . . . . . . . . . . . . . . . . . . . . . . . . . . . . . . . . . . . . . . . . . . . . . . . . . . . . . . . . . . . . 2629.2 Suspension Controller Design . . . . . . . . . . . . . . . . . . . . . . . . . . . . . . . . . . . . . . . . . . . . . . . . . . . . . . . . . . . . . 2639.2.1 Controller description and space of operation . . . . . . . . . . . . . . . . . . . . . . . . . . . . . . . . . . . . . . . . . . 2639.2.2 Controller performance on Orbit . . . . . . . . . . . . . . . . . . . . . . . . . . . . . . . . . . . . . . . . . . . . . . . . . . . . . . . 2659.2.3 Drag-Free control . . . . . . . . . . . . . . . . . . . . . . . . . . . . . . . . . . . . . . . . . . . . . . . . . . . . . . . . . . . . . . . . . . . . . . 2709.3 GSS Software . . . . . . . . . . . . . . . . . . . . . . . . . . . . . . . . . . . . . . . . . . . . . . . . . . . . . . . . . . . . . . . . . . . . . . . . . . . . . . . . 2749.4 References . . . . . . . . . . . . . . . . . . . . . . . . . . . . . . . . . . . . . . . . . . . . . . . . . . . . . . . . . . . . . . . . . . . . . . . . . . . . . . . . . . 2799.4.1 Engineering Documents . . . . . . . . . . . . . . . . . . . . . . . . . . . . . . . . . . . . . . . . . . . . . . . . . . . . . . . . . . . . . . . 27910 SQUID Readout Subsystem (SRE) Analysis . . . . . . . . . . . . . . . . . . . . . . . . . . . . . . . . . . . . . . . . . . . . . 28110.1 Introduction . . . . . . . . . . . . . . . . . . . . . . . . . . . . . . . . . . . . . . . . . . . . . . . . . . . . . . . . . . . . . . . . . . . . . . . . . . . . . . . . . 28310.2 Hardware Description . . . . . . . . . . . . . . . . . . . . . . . . . . . . . . . . . . . . . . . . . . . . . . . . . . . . . . . . . . . . . . . . . . . . . . 28410.3 Pre-Launch Ground-Based Tests . . . . . . . . . . . . . . . . . . . . . . . . . . . . . . . . . . . . . . . . . . . . . . . . . . . . . . . . . . 28810.4 On-Orbit Performance Data . . . . . . . . . . . . . . . . . . . . . . . . . . . . . . . . . . . . . . . . . . . . . . . . . . . . . . . . . . . . . . . 29310.4.1 SQUID Noise . . . . . . . . . . . . . . . . . . . . . . . . . . . . . . . . . . . . . . . . . . . . . . . . . . . . . . . . . . . . . . . . . . . . . . . . . . . 29310.4.2 SQUID Bracket Temperature Control . . . . . . . . . . . . . . . . . . . . . . . . . . . . . . . . . . . . . . . . . . . . . . . . . . . 29410.4.3 SRE Temperature Control Performance . . . . . . . . . . . . . . . . . . . . . . . . . . . . . . . . . . . . . . . . . . . . . . . . 29610.5 SRE Software . . . . . . . . . . . . . . . . . . . . . . . . . . . . . . . . . . . . . . . . . . . . . . . . . . . . . . . . . . . . . . . . . . . . . . . . . . . . . . . . 29710.6 References . . . . . . . . . . . . . . . . . . . . . . . . . . . . . . . . . . . . . . . . . . . . . . . . . . . . . . . . . . . . . . . . . . . . . . . . . . . . . . . . . . 306<strong>Gravity</strong> <strong>Probe</strong> B — <strong>Post</strong> <strong>Flight</strong> Analysis • Final <strong>Report</strong> March 2007 ix
11 Telescope Readout Subsystem (TRE) Analysis . . . . . . . . . . . . . . . . . . . . . . . . . . . . . . . . . . . . . . . . 30711.1 Telescope Readout Electronics <strong>Report</strong> Summary . . . . . . . . . . . . . . . . . . . . . . . . . . . . . . . . . . . . . . . . 30911.2 Operational Performance and Overview . . . . . . . . . . . . . . . . . . . . . . . . . . . . . . . . . . . . . . . . . . . . . . . . . 31011.2.1 Gain Levels . . . . . . . . . . . . . . . . . . . . . . . . . . . . . . . . . . . . . . . . . . . . . . . . . . . . . . . . . . . . . . . . . . . . . . . . . . . . 31011.2.2 PID Temperature Controllers for DMAs . . . . . . . . . . . . . . . . . . . . . . . . . . . . . . . . . . . . . . . . . . . . . . . . . 31111.2.3 Signal Strengths . . . . . . . . . . . . . . . . . . . . . . . . . . . . . . . . . . . . . . . . . . . . . . . . . . . . . . . . . . . . . . . . . . . . . . . 31111.2.4 Telescope Operation with the Shutter Open . . . . . . . . . . . . . . . . . . . . . . . . . . . . . . . . . . . . . . . . . . . . 31111.3 Hardware Performance . . . . . . . . . . . . . . . . . . . . . . . . . . . . . . . . . . . . . . . . . . . . . . . . . . . . . . . . . . . . . . . . . . . . 31211.3.1 TRE Detector Dark Noise . . . . . . . . . . . . . . . . . . . . . . . . . . . . . . . . . . . . . . . . . . . . . . . . . . . . . . . . . . . . . . . 31211.3.2 Platform Temperature Stability . . . . . . . . . . . . . . . . . . . . . . . . . . . . . . . . . . . . . . . . . . . . . . . . . . . . . . . . . 31211.3.3 Temperature History and Detector High Levels . . . . . . . . . . . . . . . . . . . . . . . . . . . . . . . . . . . . . . . . . 31311.3.4 Daily Data Example . . . . . . . . . . . . . . . . . . . . . . . . . . . . . . . . . . . . . . . . . . . . . . . . . . . . . . . . . . . . . . . . . . . . 31711.4 Optically Related Performance . . . . . . . . . . . . . . . . . . . . . . . . . . . . . . . . . . . . . . . . . . . . . . . . . . . . . . . . . . . . 31811.4.1 Guide Star Brightness Variation and Period . . . . . . . . . . . . . . . . . . . . . . . . . . . . . . . . . . . . . . . . . . . . . 31811.4.2 Telescope Pointing Signal . . . . . . . . . . . . . . . . . . . . . . . . . . . . . . . . . . . . . . . . . . . . . . . . . . . . . . . . . . . . . . 31911.4.3 Telescope Scale Factor . . . . . . . . . . . . . . . . . . . . . . . . . . . . . . . . . . . . . . . . . . . . . . . . . . . . . . . . . . . . . . . . . 32011.4.4 RMS pointing noise . . . . . . . . . . . . . . . . . . . . . . . . . . . . . . . . . . . . . . . . . . . . . . . . . . . . . . . . . . . . . . . . . . . . 32111.4.5 Dither amplitude variation . . . . . . . . . . . . . . . . . . . . . . . . . . . . . . . . . . . . . . . . . . . . . . . . . . . . . . . . . . . . . 32611.4.6 Bias Variation . . . . . . . . . . . . . . . . . . . . . . . . . . . . . . . . . . . . . . . . . . . . . . . . . . . . . . . . . . . . . . . . . . . . . . . . . . 32711.4.7 Snapshots Comparison to Science Slopes . . . . . . . . . . . . . . . . . . . . . . . . . . . . . . . . . . . . . . . . . . . . . . . 33111.4.8 Telescope and Windows operating temperature . . . . . . . . . . . . . . . . . . . . . . . . . . . . . . . . . . . . . . . . 33112 Cryogenic Subsystem Analysis . . . . . . . . . . . . . . . . . . . . . . . . . . . . . . . . . . . . . . . . . . . . . . . . . . . . . . . . . . . . . 33312.1 Cryogenic System Requirements . . . . . . . . . . . . . . . . . . . . . . . . . . . . . . . . . . . . . . . . . . . . . . . . . . . . . . . . . . 33512.2 Temperature / pressure control of the Main Tank . . . . . . . . . . . . . . . . . . . . . . . . . . . . . . . . . . . . . . 33612.3 Events and conditions related to Dewar performance . . . . . . . . . . . . . . . . . . . . . . . . . . . . . . . . . . 33612.3.1 Launch . . . . . . . . . . . . . . . . . . . . . . . . . . . . . . . . . . . . . . . . . . . . . . . . . . . . . . . . . . . . . . . . . . . . . . . . . . . . . . . . 33612.3.2 Thermal transient events . . . . . . . . . . . . . . . . . . . . . . . . . . . . . . . . . . . . . . . . . . . . . . . . . . . . . . . . . . . . . . . 33712.3.3 Stuck thrusters . . . . . . . . . . . . . . . . . . . . . . . . . . . . . . . . . . . . . . . . . . . . . . . . . . . . . . . . . . . . . . . . . . . . . . . . 33712.3.4 Heating events in the <strong>Probe</strong> . . . . . . . . . . . . . . . . . . . . . . . . . . . . . . . . . . . . . . . . . . . . . . . . . . . . . . . . . . . . 33812.3.5 Drag-Free operation . . . . . . . . . . . . . . . . . . . . . . . . . . . . . . . . . . . . . . . . . . . . . . . . . . . . . . . . . . . . . . . . . . . 33812.3.6 Effect of Dewar shell temperature . . . . . . . . . . . . . . . . . . . . . . . . . . . . . . . . . . . . . . . . . . . . . . . . . . . . . . 33812.3.7 Thermo-acoustic oscillations (TAOs) . . . . . . . . . . . . . . . . . . . . . . . . . . . . . . . . . . . . . . . . . . . . . . . . . . . . 33812.4 Lifetime projection . . . . . . . . . . . . . . . . . . . . . . . . . . . . . . . . . . . . . . . . . . . . . . . . . . . . . . . . . . . . . . . . . . . . . . . . . 33912.4.1 Thermal models . . . . . . . . . . . . . . . . . . . . . . . . . . . . . . . . . . . . . . . . . . . . . . . . . . . . . . . . . . . . . . . . . . . . . . . 33912.4.2 Helium mass gauging . . . . . . . . . . . . . . . . . . . . . . . . . . . . . . . . . . . . . . . . . . . . . . . . . . . . . . . . . . . . . . . . . . 34012.4.3 Initial lifetime estimate . . . . . . . . . . . . . . . . . . . . . . . . . . . . . . . . . . . . . . . . . . . . . . . . . . . . . . . . . . . . . . . . . 34012.4.4 Update of lifetime estimate . . . . . . . . . . . . . . . . . . . . . . . . . . . . . . . . . . . . . . . . . . . . . . . . . . . . . . . . . . . . 34112.5 Heat pulse measurement (HPM) operation . . . . . . . . . . . . . . . . . . . . . . . . . . . . . . . . . . . . . . . . . . . . . . 34112.5.1 Principle of operation . . . . . . . . . . . . . . . . . . . . . . . . . . . . . . . . . . . . . . . . . . . . . . . . . . . . . . . . . . . . . . . . . . 34112.5.2 Results from HPM operations . . . . . . . . . . . . . . . . . . . . . . . . . . . . . . . . . . . . . . . . . . . . . . . . . . . . . . . . . . . 34212.6 Dewar Vent Rate Measurement . . . . . . . . . . . . . . . . . . . . . . . . . . . . . . . . . . . . . . . . . . . . . . . . . . . . . . . . . . . 34312.7 Reconciliation of lifetime estimates . . . . . . . . . . . . . . . . . . . . . . . . . . . . . . . . . . . . . . . . . . . . . . . . . . . . . . 34412.8 Comparison of lifetime prediction with final result . . . . . . . . . . . . . . . . . . . . . . . . . . . . . . . . . . . . . 34512.9 HPM Results: Conclusions . . . . . . . . . . . . . . . . . . . . . . . . . . . . . . . . . . . . . . . . . . . . . . . . . . . . . . . . . . . . . . . . . 347x March 2007 Table of Contents
12.10 Magnetic Shielding Performance . . . . . . . . . . . . . . . . . . . . . . . . . . . . . . . . . . . . . . . . . . . . . . . . . . . . . . . . . 34812.10.1 Rotor Trapped Flux . . . . . . . . . . . . . . . . . . . . . . . . . . . . . . . . . . . . . . . . . . . . . . . . . . . . . . . . . . . . . . . . . . . . 34812.10.2 AC Shielding . . . . . . . . . . . . . . . . . . . . . . . . . . . . . . . . . . . . . . . . . . . . . . . . . . . . . . . . . . . . . . . . . . . . . . . . . . . 34912.11 <strong>Probe</strong> Vacuum Performance . . . . . . . . . . . . . . . . . . . . . . . . . . . . . . . . . . . . . . . . . . . . . . . . . . . . . . . . . . . . . . . 34913 Other Payload Subsystems Analyses . . . . . . . . . . . . . . . . . . . . . . . . . . . . . . . . . . . . . . . . . . . . . . . . . . . . 35113.1 Experiment Control Unit (ECU) . . . . . . . . . . . . . . . . . . . . . . . . . . . . . . . . . . . . . . . . . . . . . . . . . . . . . . . . . . . . 35313.1.1 ECU Hardware . . . . . . . . . . . . . . . . . . . . . . . . . . . . . . . . . . . . . . . . . . . . . . . . . . . . . . . . . . . . . . . . . . . . . . . . 35313.1.2 ECU-Controlled Heaters & Temperature Sensors . . . . . . . . . . . . . . . . . . . . . . . . . . . . . . . . . . . . . . . . 35313.1.3 ECU-Managed Subsystems . . . . . . . . . . . . . . . . . . . . . . . . . . . . . . . . . . . . . . . . . . . . . . . . . . . . . . . . . . . . . 35513.1.4 ECU Performance During Flux Reduction & Low Temperature Bakeout . . . . . . . . . . . . . . . . . . 35813.1.5 ECU Heater Activity During IOC . . . . . . . . . . . . . . . . . . . . . . . . . . . . . . . . . . . . . . . . . . . . . . . . . . . . . . . . . 36013.1.6 ECU Heater Activity During the Science Phase . . . . . . . . . . . . . . . . . . . . . . . . . . . . . . . . . . . . . . . . . . 36413.1.7 ECU transmission of Spacecraft Noise . . . . . . . . . . . . . . . . . . . . . . . . . . . . . . . . . . . . . . . . . . . . . . . . . . 36613.2 Proton Monitor . . . . . . . . . . . . . . . . . . . . . . . . . . . . . . . . . . . . . . . . . . . . . . . . . . . . . . . . . . . . . . . . . . . . . . . . . . . . . 36713.2.1 <strong>GP</strong>-B Radiation Environment . . . . . . . . . . . . . . . . . . . . . . . . . . . . . . . . . . . . . . . . . . . . . . . . . . . . . . . . . . . 36713.2.2 Proton Monitor Features and Specifications . . . . . . . . . . . . . . . . . . . . . . . . . . . . . . . . . . . . . . . . . . . . 36713.2.3 History of Performance . . . . . . . . . . . . . . . . . . . . . . . . . . . . . . . . . . . . . . . . . . . . . . . . . . . . . . . . . . . . . . . . 36913.2.4 Data Collected . . . . . . . . . . . . . . . . . . . . . . . . . . . . . . . . . . . . . . . . . . . . . . . . . . . . . . . . . . . . . . . . . . . . . . . . . 36913.2.5 Correlating the PM with the Telescope . . . . . . . . . . . . . . . . . . . . . . . . . . . . . . . . . . . . . . . . . . . . . . . . . 37313.2.6 Possible <strong>Post</strong>-Science Missions and Analysis . . . . . . . . . . . . . . . . . . . . . . . . . . . . . . . . . . . . . . . . . . . . 37513.3 Payload Magnetometers . . . . . . . . . . . . . . . . . . . . . . . . . . . . . . . . . . . . . . . . . . . . . . . . . . . . . . . . . . . . . . . . . . . 37513.3.1 About the Magnetometers . . . . . . . . . . . . . . . . . . . . . . . . . . . . . . . . . . . . . . . . . . . . . . . . . . . . . . . . . . . . . 37613.3.2 Other Applications for Payload Magnetometers . . . . . . . . . . . . . . . . . . . . . . . . . . . . . . . . . . . . . . . . 37813.3.3 Lessons Learned Using Payload Magnetometers . . . . . . . . . . . . . . . . . . . . . . . . . . . . . . . . . . . . . . . . 37813.4 Global Positioning System (<strong>GP</strong>S) . . . . . . . . . . . . . . . . . . . . . . . . . . . . . . . . . . . . . . . . . . . . . . . . . . . . . . . . . . 37813.4.1 <strong>GP</strong>S Hardware . . . . . . . . . . . . . . . . . . . . . . . . . . . . . . . . . . . . . . . . . . . . . . . . . . . . . . . . . . . . . . . . . . . . . . . . . 37913.4.2 Hardware Modifications for <strong>GP</strong>-B . . . . . . . . . . . . . . . . . . . . . . . . . . . . . . . . . . . . . . . . . . . . . . . . . . . . . . . 38013.4.3 Pre-Launch Testing and Results . . . . . . . . . . . . . . . . . . . . . . . . . . . . . . . . . . . . . . . . . . . . . . . . . . . . . . . . 38013.4.4 Time Reconciliation . . . . . . . . . . . . . . . . . . . . . . . . . . . . . . . . . . . . . . . . . . . . . . . . . . . . . . . . . . . . . . . . . . . . 38213.4.5 Orbital Accuracy . . . . . . . . . . . . . . . . . . . . . . . . . . . . . . . . . . . . . . . . . . . . . . . . . . . . . . . . . . . . . . . . . . . . . . . 38513.4.6 On-Orbit Results . . . . . . . . . . . . . . . . . . . . . . . . . . . . . . . . . . . . . . . . . . . . . . . . . . . . . . . . . . . . . . . . . . . . . . . 38613.4.7 On-Orbit Events . . . . . . . . . . . . . . . . . . . . . . . . . . . . . . . . . . . . . . . . . . . . . . . . . . . . . . . . . . . . . . . . . . . . . . . 38713.4.8 References . . . . . . . . . . . . . . . . . . . . . . . . . . . . . . . . . . . . . . . . . . . . . . . . . . . . . . . . . . . . . . . . . . . . . . . . . . . . 38913.5 Gas Management Assembly (GMA) . . . . . . . . . . . . . . . . . . . . . . . . . . . . . . . . . . . . . . . . . . . . . . . . . . . . . . . 39013.5.1 GMA Development and Operational Concept . . . . . . . . . . . . . . . . . . . . . . . . . . . . . . . . . . . . . . . . . . . 39013.5.2 Pre-Launch Ground Support . . . . . . . . . . . . . . . . . . . . . . . . . . . . . . . . . . . . . . . . . . . . . . . . . . . . . . . . . . . 39213.5.3 GMA Gas Consumption for Gyro #4 Spin-Up . . . . . . . . . . . . . . . . . . . . . . . . . . . . . . . . . . . . . . . . . . . . 39513.5.4 Total GMA Gas Consumption for Gyro Spin-Up . . . . . . . . . . . . . . . . . . . . . . . . . . . . . . . . . . . . . . . . . . 39513.5.5 GMA Science and <strong>Post</strong>-mission Status . . . . . . . . . . . . . . . . . . . . . . . . . . . . . . . . . . . . . . . . . . . . . . . . . . 396<strong>Gravity</strong> <strong>Probe</strong> B — <strong>Post</strong> <strong>Flight</strong> Analysis • Final <strong>Report</strong> March 2007 xi
14 Data Collection, Processing & Analysis . . . . . . . . . . . . . . . . . . . . . . . . . . . . . . . . . . . . . . . . . . . . . . . . . 39714.1 Collection and Processing <strong>GP</strong>-B Data . . . . . . . . . . . . . . . . . . . . . . . . . . . . . . . . . . . . . . . . . . . . . . . . . . . . . 39914.1.1 Data Collection and Telemetry . . . . . . . . . . . . . . . . . . . . . . . . . . . . . . . . . . . . . . . . . . . . . . . . . . . . . . . . . 39914.1.2 Detecting and Correcting Computer Memory Errors in Orbit . . . . . . . . . . . . . . . . . . . . . . . . . . . . 40314.1.3 <strong>GP</strong>-B Safemodes and Anomaly Resolution . . . . . . . . . . . . . . . . . . . . . . . . . . . . . . . . . . . . . . . . . . . . . . 40614.1.4 Effects of Anomalous Events on the Experimental Results of <strong>GP</strong>-B . . . . . . . . . . . . . . . . . . . . . . . 40814.1.5 Aberration of Starlight—Nature’s Calibrating Signal . . . . . . . . . . . . . . . . . . . . . . . . . . . . . . . . . . . . 40914.1.6 Telescope Dither—Correlating the Gyro & Telescope Scale Factors . . . . . . . . . . . . . . . . . . . . . . 41414.1.7 Extracting the Gyro Signals from the Noise . . . . . . . . . . . . . . . . . . . . . . . . . . . . . . . . . . . . . . . . . . . . . 41614.2 The <strong>GP</strong>-B Science Data Analysis Process . . . . . . . . . . . . . . . . . . . . . . . . . . . . . . . . . . . . . . . . . . . . . . . . . . 41814.2.1 Formal Data Analysis Phases . . . . . . . . . . . . . . . . . . . . . . . . . . . . . . . . . . . . . . . . . . . . . . . . . . . . . . . . . . . 41814.2.2 Independent Data Analysis Teams . . . . . . . . . . . . . . . . . . . . . . . . . . . . . . . . . . . . . . . . . . . . . . . . . . . . . . 42014.2.3 Data Grading . . . . . . . . . . . . . . . . . . . . . . . . . . . . . . . . . . . . . . . . . . . . . . . . . . . . . . . . . . . . . . . . . . . . . . . . . . 42014.2.4 Data Analysis “Standard Model” . . . . . . . . . . . . . . . . . . . . . . . . . . . . . . . . . . . . . . . . . . . . . . . . . . . . . . . . 42114.2.5 Publication of Overall Results . . . . . . . . . . . . . . . . . . . . . . . . . . . . . . . . . . . . . . . . . . . . . . . . . . . . . . . . . . 42215 Preliminary Results . . . . . . . . . . . . . . . . . . . . . . . . . . . . . . . . . . . . . . . . . . . . . . . . . . . . . . . . . . . . . . . . . . . . . . . . . . . . 42315.1 <strong>GP</strong>-B Successfully Collected the Data to Test Einstein’s Predictions About <strong>Gravity</strong> . . 42515.2 The Effects of Relativity Are Clearly Visible in the Raw Data . . . . . . . . . . . . . . . . . . . . . . . . . . . 42515.3 A First Peek at the Results . . . . . . . . . . . . . . . . . . . . . . . . . . . . . . . . . . . . . . . . . . . . . . . . . . . . . . . . . . . . . . . . . 42715.4 The Two Surprises and Their Impact On The Experiment . . . . . . . . . . . . . . . . . . . . . . . . . . . . . . . 42815.4.1 Time-Varying Motion in the Gyro Rotors . . . . . . . . . . . . . . . . . . . . . . . . . . . . . . . . . . . . . . . . . . . . . . . . 43015.4.2 The Effects of Time-Varying Polhode Motion on the Experiment . . . . . . . . . . . . . . . . . . . . . . . . . 43115.4.3 Classical Misalignment Torques on the Gyros . . . . . . . . . . . . . . . . . . . . . . . . . . . . . . . . . . . . . . . . . . . 43315.4.4 Patch Effects—The Underlying Cause of Both Effects . . . . . . . . . . . . . . . . . . . . . . . . . . . . . . . . . . . . 43415.5 Next Steps—Moving Towards a Final Result . . . . . . . . . . . . . . . . . . . . . . . . . . . . . . . . . . . . . . . . . . . . . 43715.6 <strong>GP</strong>-B Data Archive to be Available Through the NSSDC . . . . . . . . . . . . . . . . . . . . . . . . . . . . . . . . 43916 Lessons Learned and Best Practices . . . . . . . . . . . . . . . . . . . . . . . . . . . . . . . . . . . . . . . . . . . . . . . . . . . . . 44116.1 Lessons Learned . . . . . . . . . . . . . . . . . . . . . . . . . . . . . . . . . . . . . . . . . . . . . . . . . . . . . . . . . . . . . . . . . . . . . . . . . . . . 44316.1.1 Pre-launch lessons learned . . . . . . . . . . . . . . . . . . . . . . . . . . . . . . . . . . . . . . . . . . . . . . . . . . . . . . . . . . . . . 44316.1.2 Lessons Learned from On-orbit Operations . . . . . . . . . . . . . . . . . . . . . . . . . . . . . . . . . . . . . . . . . . . . . 44716.1.3 IOC Observations by Lewis Wooten of NASA MSFC . . . . . . . . . . . . . . . . . . . . . . . . . . . . . . . . . . . . . . 45316.2 Selected Best Practices . . . . . . . . . . . . . . . . . . . . . . . . . . . . . . . . . . . . . . . . . . . . . . . . . . . . . . . . . . . . . . . . . . . . 45416.2.1 Design team transition to mission operations . . . . . . . . . . . . . . . . . . . . . . . . . . . . . . . . . . . . . . . . . . . 45416.2.2 Mission planning flexibility . . . . . . . . . . . . . . . . . . . . . . . . . . . . . . . . . . . . . . . . . . . . . . . . . . . . . . . . . . . . . 45416.2.3 Control and communication of spacecraft configuration . . . . . . . . . . . . . . . . . . . . . . . . . . . . . . . . 45516.2.4 Effective use of databases . . . . . . . . . . . . . . . . . . . . . . . . . . . . . . . . . . . . . . . . . . . . . . . . . . . . . . . . . . . . . . 45516.2.5 Inclusion of operations experts in hardware development . . . . . . . . . . . . . . . . . . . . . . . . . . . . . . 45516.2.6 Team member cross-training . . . . . . . . . . . . . . . . . . . . . . . . . . . . . . . . . . . . . . . . . . . . . . . . . . . . . . . . . . . 45516.2.7 Peer reviews in software development . . . . . . . . . . . . . . . . . . . . . . . . . . . . . . . . . . . . . . . . . . . . . . . . . 45616.2.8 Minimizing program risks with formal risk management plan . . . . . . . . . . . . . . . . . . . . . . . . . . . 456xii March 2007 Table of Contents
16.3 Management Lessons from the Calder-Jones <strong>Report</strong> . . . . . . . . . . . . . . . . . . . . . . . . . . . . . . . . . . . 45716.3.1 Working With Organizational Asymmetries . . . . . . . . . . . . . . . . . . . . . . . . . . . . . . . . . . . . . . . . . . . . . 45816.3.2 Recognizing and Managing Critical Transition Points . . . . . . . . . . . . . . . . . . . . . . . . . . . . . . . . . . . . 45816.3.3 Adaptive Program Management. . . . . . . . . . . . . . . . . . . . . . . . . . . . . . . . . . . . . . . . . . . . . . . . . . . . . . . . 45816.3.4 Maintaining Aerospace Knowledge at Universities . . . . . . . . . . . . . . . . . . . . . . . . . . . . . . . . . . . . . . 45816.3.5 Managing Risk . . . . . . . . . . . . . . . . . . . . . . . . . . . . . . . . . . . . . . . . . . . . . . . . . . . . . . . . . . . . . . . . . . . . . . . . . 45916.3.6 Funding Predictability . . . . . . . . . . . . . . . . . . . . . . . . . . . . . . . . . . . . . . . . . . . . . . . . . . . . . . . . . . . . . . . . . 459A <strong>Gravity</strong> <strong>Probe</strong> B Quick Facts . . . . . . . . . . . . . . . . . . . . . . . . . . . . . . . . . . . . . . . . . . . . . . . . . . . . . . . . . . . . . . . . 461B Spacecraft Data Chart . . . . . . . . . . . . . . . . . . . . . . . . . . . . . . . . . . . . . . . . . . . . . . . . . . . . . . . . . . . . . . . . . . . . . . . . 465C Weekly Chronicle of the <strong>GP</strong>-B Mission . . . . . . . . . . . . . . . . . . . . . . . . . . . . . . . . . . . . . . . . . . . . . . . . . . . 469C.1 Pre-Launch Mission Phase: 4/2/04 – 4/18/04 . . . . . . . . . . . . . . . . . . . . . . . . . . . . . . . . . . . . . . . . . . . . . 471C.2 <strong>GP</strong>-B Launch: 4/19/04 – 4/20/04 . . . . . . . . . . . . . . . . . . . . . . . . . . . . . . . . . . . . . . . . . . . . . . . . . . . . . . . . . . . 472C.3 IOC Mission Phase: 4/21/04 – 8/26/04 . . . . . . . . . . . . . . . . . . . . . . . . . . . . . . . . . . . . . . . . . . . . . . . . . . . . 473C.4 Science Mission Phase: 8/27/04 - 8/12/05 . . . . . . . . . . . . . . . . . . . . . . . . . . . . . . . . . . . . . . . . . . . . . . . . 484C.5 Instrument Calibration Phase: 8/19/05 – 9/30/05 . . . . . . . . . . . . . . . . . . . . . . . . . . . . . . . . . . . . . . . . 511D Summary Table of <strong>Flight</strong> Anomalies . . . . . . . . . . . . . . . . . . . . . . . . . . . . . . . . . . . . . . . . . . . . . . . . . . . . . 521E <strong>Flight</strong> Software Applications SLOC . . . . . . . . . . . . . . . . . . . . . . . . . . . . . . . . . . . . . . . . . . . . . . . . . . . . . . . 549F Acronyms & Abbreviations . . . . . . . . . . . . . . . . . . . . . . . . . . . . . . . . . . . . . . . . . . . . . . . . . . . . . . . . . . . . . . . . . 569<strong>Gravity</strong> <strong>Probe</strong> B — <strong>Post</strong> <strong>Flight</strong> Analysis • Final <strong>Report</strong> March 2007 xiii
xiv March 2007 Table of Contents
List of FiguresFigure 1-1. <strong>GP</strong>-B Principal Investigator, Francis Everitt, receiving the NASA Distinguished Public Service Awardat an awards ceremony at NASA Headquarters in April 2005 . . . . . . . . . . . . . . . . . . . . . . . . . . . . . . . . . . . . .4Figure 1-2. Newton’s flat and fixed space and time (left) vs. Einstein’s warped and twisted spacetime (right) .5Figure 1-3. The <strong>GP</strong>-B spacecraft in orbit and the two measurements being made with the gyroscopes on-board6Figure 1-4. A <strong>GP</strong>-B niobium-coated gyro rotor and housing (left), the Guinness Database recordfor roundness (center), and measuring the sphericity of a gyro rotor (right) . . . . . . . . . . . . . . . . . . . . . .8Figure 1-5. A <strong>GP</strong>-B SQUID module (left) and a diagram of the magnetic pickup loop and London moment . . .9Figure 1-6. A pre-flight prototype of the <strong>GP</strong>-B telescope and diagram of its image-centering operation . . . . .10Figure 1-7. Guide Star IM Pegasi (HR 8703) sky location (left), photo (center) and proper motion (right) . . . . .11Figure 1-8. Clockwise, from top left: The dewar, a cross-section of the dewar, the porous plug, and one thruster12Figure 1-9. The <strong>GP</strong>-B spacecraft and its main payload components . . . . . . . . . . . . . . . . . . . . . . . . . . . . . . . . . . . . . . . .15Figure 1-10. The <strong>GP</strong>-B Mission Operations Center (MOC) during gyro spin-up (left) and end of helium (right) .17Figure 1-11. NASA <strong>GP</strong>-B Program Manager, Tony Lyons, from the Marshall Space <strong>Flight</strong> Center in Huntsville, AL,presents a NASA Group Achievement Award to the entire <strong>GP</strong>-B team in November 2005. . . . . . . .18Figure 1-12. The <strong>GP</strong>-B Anomaly Room in action . . . . . . . . . . . . . . . . . . . . . . . . . . . . . . . . . . . . . . . . . . . . . . . . . . . . . . . . . . . .19Figure 1-13. <strong>Stanford</strong> <strong>GP</strong>-B/<strong>GP</strong>S graduate students and a faculty member pose next to a <strong>GP</strong>S-controlled tractor(left); Clark Cohen and Brad Parkinson receive awards from the Space Technology Hall of Fame .22Figure 2-1. <strong>GP</strong>-B Historical Time Line . . . . . . . . . . . . . . . . . . . . . . . . . . . . . . . . . . . . . . . . . . . . . . . . . . . . . . . . . . . . . . . . . . . . . .26Figure 2-2. <strong>GP</strong>-B Co-founders and Nancy Roman. Clockwise from top left: Leonard Schiff (~1970),William Fairbank (~1988), Robert Cannon (2005), and Nancy Roman (2005) . . . . . . . . . . . . . . . . . . . . .27Figure 2-3. Clockwise from top left: <strong>GP</strong>-B Principal Investigator, Francis Everitt, and Co-PIs Brad Parkinson,John Turneaure and Dan DeBra. . . . . . . . . . . . . . . . . . . . . . . . . . . . . . . . . . . . . . . . . . . . . . . . . . . . . . . . . . . . . . . .29Figure 2-4. <strong>GP</strong>-B Principal Investigator, Francis Everitt, receiving the NASA Distinguished Public Service Awardat an awards ceremony at NASA Headquarters in April 2005. . . . . . . . . . . . . . . . . . . . . . . . . . . . . . . . . . . .31Figure 2-5. Newton’s universe: Space and time are absolute or fixed entities. <strong>Gravity</strong> is a force that actsinstantaneously between objects at a distance, causing them to attract one another. . . . . . . . . . . .31Figure 2-6. Einstein’s Universe: Space and time are relative entities, interwoven into a spacetime fabric whosecurvature we call gravity. Objects follow the straightest possible lines, called geodesics, throughcurved spacetime. . . . . . . . . . . . . . . . . . . . . . . . . . . . . . . . . . . . . . . . . . . . . . . . . . . . . . . . . . . . . . . . . . . . . . . . . . . . .32Figure 2-7. The Missing Inch . . . . . . . . . . . . . . . . . . . . . . . . . . . . . . . . . . . . . . . . . . . . . . . . . . . . . . . . . . . . . . . . . . . . . . . . . . . . . .33Figure 2-8. Illustration of frame-dragging . . . . . . . . . . . . . . . . . . . . . . . . . . . . . . . . . . . . . . . . . . . . . . . . . . . . . . . . . . . . . . . . .34Figure 2-9. Frame-dragging around a black hole . . . . . . . . . . . . . . . . . . . . . . . . . . . . . . . . . . . . . . . . . . . . . . . . . . . . . . . . . .35Figure 2-10. Schematic diagram of the <strong>GP</strong>-B experiment . . . . . . . . . . . . . . . . . . . . . . . . . . . . . . . . . . . . . . . . . . . . . . . . . . . .36Figure 2-11. Exploded diagram of the <strong>GP</strong>-B spacecraft & payload . . . . . . . . . . . . . . . . . . . . . . . . . . . . . . . . . . . . . . . . . . .37Figure 2-12. Final assembly of the <strong>Probe</strong> . . . . . . . . . . . . . . . . . . . . . . . . . . . . . . . . . . . . . . . . . . . . . . . . . . . . . . . . . . . . . . . . . . .38Figure 2-13. Looking inside the top hat down into the <strong>Probe</strong> . . . . . . . . . . . . . . . . . . . . . . . . . . . . . . . . . . . . . . . . . . . . . . .39Figure 2-14. The <strong>GP</strong>-B spacecraft . . . . . . . . . . . . . . . . . . . . . . . . . . . . . . . . . . . . . . . . . . . . . . . . . . . . . . . . . . . . . . . . . . . . . . . . . . .39Figure 2-15. <strong>Stanford</strong> <strong>GP</strong>-B/<strong>GP</strong>S graduate students and a faculty member pose next to a <strong>GP</strong>S-controlled tractor;Clark Cohen (left) and Brad Parkinson (right) receive awards from the Space Technology Hall ofFame. . . . . . . . . . . . . . . . . . . . . . . . . . . . . . . . . . . . . . . . . . . . . . . . . . . . . . . . . . . . . . . . . . . . . . . . . . . . . . . . . . . . . . . . .42Figure 2-16. Photos of the <strong>GP</strong>-B Launch on April 20, 2004 . . . . . . . . . . . . . . . . . . . . . . . . . . . . . . . . . . . . . . . . . . . . . . . . . . .43Figure 2-17. On-board video camera shows separation . . . . . . . . . . . . . . . . . . . . . . . . . . . . . . . . . . . . . . . . . . . . . . . . . . . . .44Figure 3-1. <strong>Gravity</strong> <strong>Probe</strong> B gyroscope rotor, with quartz housing halves. . . . . . . . . . . . . . . . . . . . . . . . . . . . . . . . . . .69Figure 3-2. SQUID detector package, with housing cover . . . . . . . . . . . . . . . . . . . . . . . . . . . . . . . . . . . . . . . . . . . . . . . . . .71Figure 3-3. Functional diagram of a SQUID pickup loop measuring the London Moment around a <strong>GP</strong>-B gyrorotor (left) and four SQUID readouts—one for each gyro (right). . . . . . . . . . . . . . . . . . . . . . . . . . . . . . . . .72<strong>Gravity</strong> <strong>Probe</strong> B — <strong>Post</strong> <strong>Flight</strong> Analysis • Final <strong>Report</strong> March 2007 xv
Figure 3-4. The <strong>GP</strong>-B dewar—one of the largest and most sophisticated dewars ever flown . . . . . . . . . . . . . . . .72Figure 3-5. Cross sectional schematic of the dewar . . . . . . . . . . . . . . . . . . . . . . . . . . . . . . . . . . . . . . . . . . . . . . . . . . . . . . . .73Figure 3-6. Proportional micro thrusters used for <strong>GP</strong>-B spacecraft attitude control . . . . . . . . . . . . . . . . . . . . . . . . . .74Figure 3-7. A pre-flight prototype of the Cassegrain telescope on-board the <strong>GP</strong>-B spacecraft . . . . . . . . . . . . . . .75Figure 3-8. Tracking the guide star, IM Pegasi, with the <strong>GP</strong>-B telescope . . . . . . . . . . . . . . . . . . . . . . . . . . . . . . . . . . . . .76Figure 3-9. Schematic diagram of starlight image division in the <strong>GP</strong>-B telescope . . . . . . . . . . . . . . . . . . . . . . . . . . .78Figure 3-10. The porous plug . . . . . . . . . . . . . . . . . . . . . . . . . . . . . . . . . . . . . . . . . . . . . . . . . . . . . . . . . . . . . . . . . . . . . . . . . . . . . .81Figure 3-11. Lead bag magnetic shield in <strong>GP</strong>-B flight probe . . . . . . . . . . . . . . . . . . . . . . . . . . . . . . . . . . . . . . . . . . . . . . . . .82Figure 3-12. <strong>GP</strong>_B proportional micro thruster assembly . . . . . . . . . . . . . . . . . . . . . . . . . . . . . . . . . . . . . . . . . . . . . . . . . . . .83Figure 3-13. Polishing a gyro rotor . . . . . . . . . . . . . . . . . . . . . . . . . . . . . . . . . . . . . . . . . . . . . . . . . . . . . . . . . . . . . . . . . . . . . . . . .83Figure 3-14. Measuring the roundness of a gyro rotor and mapping the contours on its surface . . . . . . . . . . . . . .84Figure 3-15. A gyro rotor and both halves of its quartz housing . . . . . . . . . . . . . . . . . . . . . . . . . . . . . . . . . . . . . . . . . . . . .85Figure 3-16. Top view of the Gas Management Assembly (GMA) . . . . . . . . . . . . . . . . . . . . . . . . . . . . . . . . . . . . . . . . . . . .85Figure 3-17. The telescope Image Divider Assembly (IDA) and Detector Package Assemblies (DPA) . . . . . . . . . .86Figure 3-18. Schematic diagram and photo of a SQUID gyro readout . . . . . . . . . . . . . . . . . . . . . . . . . . . . . . . . . . . . . . . .87Figure 3-19. Checking the <strong>GP</strong>-B solar arrays on the spacecraft at Lockheed Martin & solar arrays deployed on ascale model of the spacecraft . . . . . . . . . . . . . . . . . . . . . . . . . . . . . . . . . . . . . . . . . . . . . . . . . . . . . . . . . . . . . . . . . .88Figure 3-20. <strong>GP</strong>-B’s annual orientation patterns with respect to the sun . . . . . . . . . . . . . . . . . . . . . . . . . . . . . . . . . . . . .89Figure 3-21. Window #4—the outer vacuum seal of the <strong>Probe</strong> . . . . . . . . . . . . . . . . . . . . . . . . . . . . . . . . . . . . . . . . . . . . . .90Figure 3-22. <strong>GP</strong>-B—The first spacecraft with 6 degrees of freedom in position and attitude control . . . . . . . . . .91Figure 4-1. NASA <strong>GP</strong>-B Program Manager, Tony Lyons, from the Marshall Space <strong>Flight</strong> Center in Huntsville, AL,presents a NASA Group Achievement Award to the entire <strong>GP</strong>-B team in November 2005. . . . . . . .98Figure 4-2. Example TISI visualization. . . . . . . . . . . . . . . . . . . . . . . . . . . . . . . . . . . . . . . . . . . . . . . . . . . . . . . . . . . . . . . . . . . . 103Figure 4-3. Number of hours of re-planning required per day during IOC. . . . . . . . . . . . . . . . . . . . . . . . . . . . . . . . . 105Figure 4-4. Data flow through the <strong>GP</strong>-B’s automated data processing. . . . . . . . . . . . . . . . . . . . . . . . . . . . . . . . . . . . 109Figure 4-5. Pictorial depiction of η. The circle represents the Earth, the vertical line is the orbit plane viewededge-on, and the asterisk represents the guide star. η is the angle between orbit plane andguide star at any point in the orbit plane. . . . . . . . . . . . . . . . . . . . . . . . . . . . . . . . . . . . . . . . . . . . . . . . . . . . . 112Figure 4-6. Eta and Eta-Average Histories (Degrees) Associated with <strong>GP</strong>-B . . . . . . . . . . . . . . . . . . . . . . . . . . . . . . . . 113Figure 4-7. Eta-Average Error Associated with <strong>GP</strong>-B Orbit as a function of IOC duration and sciencemission lifetime . . . . . . . . . . . . . . . . . . . . . . . . . . . . . . . . . . . . . . . . . . . . . . . . . . . . . . . . . . . . . . . . . . . . . . . . . . . . . 114Figure 4-8. Usable <strong>GP</strong>S Points per Day (2005) . . . . . . . . . . . . . . . . . . . . . . . . . . . . . . . . . . . . . . . . . . . . . . . . . . . . . . . . . . . . 115Figure 4-9. Typical residual plot from daily <strong>GP</strong>S solution. . . . . . . . . . . . . . . . . . . . . . . . . . . . . . . . . . . . . . . . . . . . . . . . . 116Figure 4-10. SLR passes per day . . . . . . . . . . . . . . . . . . . . . . . . . . . . . . . . . . . . . . . . . . . . . . . . . . . . . . . . . . . . . . . . . . . . . . . . . . 117Figure 4-11. Comparison of <strong>GP</strong>S and SLR Cross-Track Errors. . . . . . . . . . . . . . . . . . . . . . . . . . . . . . . . . . . . . . . . . . . . . . . 118Figure 4-12. <strong>GP</strong>-B Computer Network. . . . . . . . . . . . . . . . . . . . . . . . . . . . . . . . . . . . . . . . . . . . . . . . . . . . . . . . . . . . . . . . . . . . 119Figure 4-13. The Integrated Test Facility (ITF) flight simulator hardware in a Clean Room at Lockheed Martin . .122Figure 5-1. Anomaly Review Team Organization . . . . . . . . . . . . . . . . . . . . . . . . . . . . . . . . . . . . . . . . . . . . . . . . . . . . . . . . 128Figure 5-2. <strong>GP</strong>-B Anomaly Room Layout . . . . . . . . . . . . . . . . . . . . . . . . . . . . . . . . . . . . . . . . . . . . . . . . . . . . . . . . . . . . . . . . 131Figure 5-3. For each risk, an assessment is completed by the identifying team or person . . . . . . . . . . . . . . . . . . 134Figure 5-4. Metric of risk item closure prior to launch of <strong>GP</strong>-B. All risk items were either acceptedor closed prior to launch. . . . . . . . . . . . . . . . . . . . . . . . . . . . . . . . . . . . . . . . . . . . . . . . . . . . . . . . . . . . . . . . . . . . . 135Figure 5-5. (part 1 or 3). Open risk items during on-orbit science mission . . . . . . . . . . . . . . . . . . . . . . . . . . . . . . . . . 136Figure 5-6. (part 2 or 3). Open risk items during on-orbit science mission . . . . . . . . . . . . . . . . . . . . . . . . . . . . . . . . . 137Figure 5-7. (part 3 or 3). Open risk items during on-orbit science mission . . . . . . . . . . . . . . . . . . . . . . . . . . . . . . . . . 137Figure 6-1. Clockwise from top left: <strong>GP</strong>-B Co Founders Leonard Schiff, William Fairbank, and Robert Cannon andformer head of NASA's Office of Space Sciences, Nancy Roman. . . . . . . . . . . . . . . . . . . . . . . . . . . . . . . 144Figure 6-2. Clockwise from top left: <strong>GP</strong>-B Principal Investigator, Francis Everitt and Co-PIsBradford Parkinson, John Turneaure and Dan DeBra. . . . . . . . . . . . . . . . . . . . . . . . . . . . . . . . . . . . . . . . . . 147xvi March 2007
Figure 6-3. The six <strong>GP</strong>-B Co-Investigators. Clockwise from top left: Sasha Buchman, George (Mac) Keiser, JohnLipa, James Lockhart, Barry Muhlfelder, and Michael Taber. . . . . . . . . . . . . . . . . . . . . . . . . . . . . . . . . . . . 148Figure 6-4. <strong>Probe</strong> C: testing in clean room (left), ready for integration with dewar (center) and connectionsinside the top hat interface (right). . . . . . . . . . . . . . . . . . . . . . . . . . . . . . . . . . . . . . . . . . . . . . . . . . . . . . . . . . . . 150Figure 6-5. Left: Engineering Development Dewar (EDD); Middle & Right: Science Mission Dewar (SMD). . . 151Figure 6-6. Gyroscope rotor development and precision sphericity measurement. . . . . . . . . . . . . . . . . . . . . . . . 151Figure 6-7. SQUID readout development prototypes and lithograph for SQUID chip. . . . . . . . . . . . . . . . . . . . . . 152Figure 6-8. An early development telescope prototype (left), the pre-flight #2 prototype telescope (center), anda close-up of the Image Divider Assembly and Detector Assembly Package from the #2 pre-flightprototype. . . . . . . . . . . . . . . . . . . . . . . . . . . . . . . . . . . . . . . . . . . . . . . . . . . . . . . . . . . . . . . . . . . . . . . . . . . . . . . . . . . 152Figure 6-9. The Lockheed Martin <strong>GP</strong>-B Spacecraft Development Team circa 1995. Key managers from LMincluded: Norman Bennett, Hugh Dougherty, Bill Reeve, Robert Schultz, and Jeff Vanden Beukel. . .154Figure 6-10. MSFC Program Managers/supporters of <strong>GP</strong>-B since 1995. Clockwise from top left: Rudolph Decher,Richard Potter, Joyce Neighbors, Rein Ise, Steve Richards, Rex Geveden, Tony Lyons, and ArthurStephenson. . . . . . . . . . . . . . . . . . . . . . . . . . . . . . . . . . . . . . . . . . . . . . . . . . . . . . . . . . . . . . . . . . . . . . . . . . . . . . . . . 162Figure 6-11. MSFC resident and engineering managers. Left to right: Edward Ingraham, Todd May,Buddy Randolph, and Stephan Davis. . . . . . . . . . . . . . . . . . . . . . . . . . . . . . . . . . . . . . . . . . . . . . . . . . . . . . . . . 162Figure 6-12. <strong>GP</strong>-B Program Managers. Clockwise from top left: Bradford Parkinson, John Turneaure, SashaBuchman, Ron Singley, Gaylord Green, and Bill Bencze and <strong>GP</strong>-B . . . . . . . . . . . . . . . . . . . . . . . . . . . . . 165Figure 6-13. <strong>GP</strong>-B Deputy Program Managers. Left to right: Robert Farnsworth, Tom Langenstein,and Robert Brumley . . . . . . . . . . . . . . . . . . . . . . . . . . . . . . . . . . . . . . . . . . . . . . . . . . . . . . . . . . . . . . . . . . . . . . . . . 165Figure 7-1. Schematic of Guide Star Valid (GSV) and Guide Star Invalid (GSI) periods . . . . . . . . . . . . . . . . . . . . . . 173Figure 7-2. 12 hours of thruster pressure data from 2004 day 184 . . . . . . . . . . . . . . . . . . . . . . . . . . . . . . . . . . . . . . . . 174Figure 7-3. Science Telescope Components Schematic . . . . . . . . . . . . . . . . . . . . . . . . . . . . . . . . . . . . . . . . . . . . . . . . . . 176Figure 7-4. Normalized Telescope Signal vs Pointing Error . . . . . . . . . . . . . . . . . . . . . . . . . . . . . . . . . . . . . . . . . . . . . . . 177Figure 7-5. Pitch and Yaw Pointing Performance during the science mission . . . . . . . . . . . . . . . . . . . . . . . . . . . . . 178Figure 7-6. X-Axis RMS pointing performance correlation with solar angle . . . . . . . . . . . . . . . . . . . . . . . . . . . . . . . 179Figure 7-7. Magnitude of the roll rate component of pitch yaw pointing performance . . . . . . . . . . . . . . . . . . . . 180Figure 7-8. Correlation of pointing roll rate component with telescope/sun angle . . . . . . . . . . . . . . . . . . . . . . . . 181Figure 7-9. Guide star capture performance before capture method update . . . . . . . . . . . . . . . . . . . . . . . . . . . . . 182Figure 7-10. Guide star capture performance after capture method update . . . . . . . . . . . . . . . . . . . . . . . . . . . . . . . 183Figure 7-11. Roll Phase Error over 4 orbits . . . . . . . . . . . . . . . . . . . . . . . . . . . . . . . . . . . . . . . . . . . . . . . . . . . . . . . . . . . . . . . . 184Figure 7-12. Drag-Free system diagram . . . . . . . . . . . . . . . . . . . . . . . . . . . . . . . . . . . . . . . . . . . . . . . . . . . . . . . . . . . . . . . . . . 185Figure 7-13. Drag-Free performance . . . . . . . . . . . . . . . . . . . . . . . . . . . . . . . . . . . . . . . . . . . . . . . . . . . . . . . . . . . . . . . . . . . . . 186Figure 7-14. ATC Mass Flow Usage in drag-free Mode . . . . . . . . . . . . . . . . . . . . . . . . . . . . . . . . . . . . . . . . . . . . . . . . . . . . . 187Figure 7-15. Mass flow effects of a Heat Pulse Meter Test and the Magnetic Torquing System . . . . . . . . . . . . . . 188Figure 7-16. Vehicle rotation rate damping after separation from the Delta II . . . . . . . . . . . . . . . . . . . . . . . . . . . . . . 189Figure 7-17. Large Scale Dither Performance (2004/197) . . . . . . . . . . . . . . . . . . . . . . . . . . . . . . . . . . . . . . . . . . . . . . . . . . 191Figure 7-18. GSV/GSI rate gyroscope bias offset . . . . . . . . . . . . . . . . . . . . . . . . . . . . . . . . . . . . . . . . . . . . . . . . . . . . . . . . . . 193Figure 7-19. Side view of partially assembled dewar showing primary structural elementsexcept for forward PODS. . . . . . . . . . . . . . . . . . . . . . . . . . . . . . . . . . . . . . . . . . . . . . . . . . . . . . . . . . . . . . . . . . . . 194Figure 7-20. Cutaway top view of dewar showing forward PODS and ARP post locations and details of theARP post and flexure. (Representation of the ARP is schematic and not accurate.) . . . . . . . . . . . . . 195Figure 7-21. Percentage of data corrupted by proton activity in the South Atlantic Anomaly . . . . . . . . . . . . . . . 196Figure 7-22. South Atlantic Anomaly Region produced from telescope proton hit data . . . . . . . . . . . . . . . . . . . . 197Figure 7-23. Effects on telescope pointing from the solar flare on January 20, 2005 . . . . . . . . . . . . . . . . . . . . . . . . 198Figure 8-1. Physical Location of CDH boxes on <strong>GP</strong>-B . . . . . . . . . . . . . . . . . . . . . . . . . . . . . . . . . . . . . . . . . . . . . . . . . . . . . 203Figure 8-2. Block Diagram of CDH communications. Green blocks belong to the CDH subsystem . . . . . . . . . 204Figure 8-3. Commands sent by month . . . . . . . . . . . . . . . . . . . . . . . . . . . . . . . . . . . . . . . . . . . . . . . . . . . . . . . . . . . . . . . . . . 205Figure 8-4. Commanding loads sent to the vehicle by month . . . . . . . . . . . . . . . . . . . . . . . . . . . . . . . . . . . . . . . . . . . . 206<strong>Gravity</strong> <strong>Probe</strong> B — <strong>Post</strong> <strong>Flight</strong> Analysis • Final <strong>Report</strong> March 2007 xvii
Figure 8-5. The Seasons of <strong>GP</strong>-B . . . . . . . . . . . . . . . . . . . . . . . . . . . . . . . . . . . . . . . . . . . . . . . . . . . . . . . . . . . . . . . . . . . . . . . . 207Figure 8-6. The annual gamma angle and eclipse cycle of <strong>GP</strong>-B . . . . . . . . . . . . . . . . . . . . . . . . . . . . . . . . . . . . . . . . . . 208Figure 8-7. Battery 1 & 2 Temperature Trends for Mission Duration . . . . . . . . . . . . . . . . . . . . . . . . . . . . . . . . . . . . . . . 209Figure 8-8. GSS1 Temperature Trends for Mission Duration . . . . . . . . . . . . . . . . . . . . . . . . . . . . . . . . . . . . . . . . . . . . . . 210Figure 8-9. Solar Array (Average) Temperatures for Mission Duration . . . . . . . . . . . . . . . . . . . . . . . . . . . . . . . . . . . . 211Figure 8-10. Forward Dewar Vacuum Shell Temperatures for Mission Duration . . . . . . . . . . . . . . . . . . . . . . . . . . . . 212Figure 8-11. Aft Dewar Vacuum Shell Temperatures for Mission Duration . . . . . . . . . . . . . . . . . . . . . . . . . . . . . . . . . 213Figure 8-12. Forward +X Thruster Temperatures for Mission Duration . . . . . . . . . . . . . . . . . . . . . . . . . . . . . . . . . . . . . 215Figure 8-13. Forward -X Thruster Temperatures for Mission Duration . . . . . . . . . . . . . . . . . . . . . . . . . . . . . . . . . . . . . . 216Figure 8-14. Aft +X Thruster Temperatures for Mission Duration . . . . . . . . . . . . . . . . . . . . . . . . . . . . . . . . . . . . . . . . . . 217Figure 8-15. Aft -X Thruster Temperatures for Mission Duration . . . . . . . . . . . . . . . . . . . . . . . . . . . . . . . . . . . . . . . . . . . 218Figure 8-16. The temperature from of the SQUID Bracket (top), the QBS (middle) and the Cryo Pump . . . . . . 221Figure 8-17. Bus Ripple Metric (Ripple Value in Volts since Launch) . . . . . . . . . . . . . . . . . . . . . . . . . . . . . . . . . . . . . . . . 224Figure 8-18. Eclipse Length and Depth of Discharge Metric . . . . . . . . . . . . . . . . . . . . . . . . . . . . . . . . . . . . . . . . . . . . . . . 225Figure 8-19. Space Vehicle Power Margin Metric . . . . . . . . . . . . . . . . . . . . . . . . . . . . . . . . . . . . . . . . . . . . . . . . . . . . . . . . . . 226Figure 8-20. Battery Voltage Metric . . . . . . . . . . . . . . . . . . . . . . . . . . . . . . . . . . . . . . . . . . . . . . . . . . . . . . . . . . . . . . . . . . . . . . 227Figure 8-21. Battery State of Charge Metric . . . . . . . . . . . . . . . . . . . . . . . . . . . . . . . . . . . . . . . . . . . . . . . . . . . . . . . . . . . . . . . 228Figure 8-22. Solar array voltage and bus power performance metric . . . . . . . . . . . . . . . . . . . . . . . . . . . . . . . . . . . . . . 229Figure 8-23. Solar Array Temperatures Variations vs. Gamma Angle . . . . . . . . . . . . . . . . . . . . . . . . . . . . . . . . . . . . . . . 230Figure 8-24. EPS Power Generation Capability Comparison 2004 Vs 2005 . . . . . . . . . . . . . . . . . . . . . . . . . . . . . . . . . . 231Figure 8-25. EPS Power Generation Capability Comparison (minus attitude discrepancies) . . . . . . . . . . . . . . . . . 231Figure 8-26. <strong>GP</strong>-B Communications Block Diagram . . . . . . . . . . . . . . . . . . . . . . . . . . . . . . . . . . . . . . . . . . . . . . . . . . . . . . . 232Figure 8-27. Location of antennae and transponder palette on spacecraft. . . . . . . . . . . . . . . . . . . . . . . . . . . . . . . . . 233Figure 8-28. Remote controlled operation of GRST from WSC . . . . . . . . . . . . . . . . . . . . . . . . . . . . . . . . . . . . . . . . . . . . . 234Figure 8-29. The Svalbard Ground Station Network. . . . . . . . . . . . . . . . . . . . . . . . . . . . . . . . . . . . . . . . . . . . . . . . . . . . . . . 235Figure 8-30. Xpndr-A STDN (green), Xpndr-A TDRS (yellow), Xpndr-B STDN (red), Xpndr-B TDRS (white) . . . . 236Figure 8-31. Transponder B TDRS AGC (red) vs Transponder A TDRS AGC (green) . . . . . . . . . . . . . . . . . . . . . . . . . . 237Figure 8-32. Plot of TDRS AGC vs Temperature over a 20-minute time frame . . . . . . . . . . . . . . . . . . . . . . . . . . . . . . . 238Figure 8-33. CCCA 1Hz CPU Usage (in %) averaged over ~4 hours. (Red = max; Blue = avg; Green = min): . . . 240Figure 8-34. CCCA 10Hz CPU Usage (in %) averaged over ~4 hours. (Red = max; Blue = avg; Green = min) . . 241Figure 8-35. ITF Hardware and Interconnects . . . . . . . . . . . . . . . . . . . . . . . . . . . . . . . . . . . . . . . . . . . . . . . . . . . . . . . . . . . . . 243Figure 8-36. Structure of a Safemode Test . . . . . . . . . . . . . . . . . . . . . . . . . . . . . . . . . . . . . . . . . . . . . . . . . . . . . . . . . . . . . . . . 247Figure 8-37. Excerpt from Safemode Status in March 2005 . . . . . . . . . . . . . . . . . . . . . . . . . . . . . . . . . . . . . . . . . . . . . . . . 247Figure 8-38. Excerpt from Test Description Table in Safemode Design Document . . . . . . . . . . . . . . . . . . . . . . . . . . 248Figure 8-39. Location of Single Bit Errors during Science Data Collection . . . . . . . . . . . . . . . . . . . . . . . . . . . . . . . . . . 249Figure 8-40. A-side CCCA Single Bit Errors from Oct. 10, 2004 to Nov. 10, 2004 . . . . . . . . . . . . . . . . . . . . . . . . . . . . . 250Figure 8-41. B-side CCCA Single Bit Errors from Apr. 10, 2005 to May 10, 2005 . . . . . . . . . . . . . . . . . . . . . . . . . . . . . 250Figure 8-42. Proton Flux measured by GOES11 satellite during January 20, 2005 solar flare . . . . . . . . . . . . . . . . 251Figure 8-43. A-side CCCA Single Bit Errors during January 20, 2005 solar flare . . . . . . . . . . . . . . . . . . . . . . . . . . . . . . 252Figure 8-44. Location of Multi-Bit Errors during the first year of on-orbit operations . . . . . . . . . . . . . . . . . . . . . . . . 253Figure 8-45. Cumulative CCCA MBE count from launch through end of May 2005. . . . . . . . . . . . . . . . . . . . . . . . . . 253Figure 9-1. Block diagram of the payload electronics package showing the interconnect of the GSS units . 257Figure 9-2. Photograph of GSS units. Aft processor and power supply (left), forward quiet analogelectronics (right). One pair is required for each gyroscope. During the mission, thetemperature of the aft assembly ranges between 300 K and 320 K; the forward assembly range is265 K to 300 K. . . . . . . . . . . . . . . . . . . . . . . . . . . . . . . . . . . . . . . . . . . . . . . . . . . . . . . . . . . . . . . . . . . . . . . . . . . . . . . 258Figure 9-3. Block diagram of the Forward Suspension Unit (FSU) . . . . . . . . . . . . . . . . . . . . . . . . . . . . . . . . . . . . . . . . . 259Figure 9-4. GSS Arbiter State Transition diagram. . . . . . . . . . . . . . . . . . . . . . . . . . . . . . . . . . . . . . . . . . . . . . . . . . . . . . . . . 260Figure 9-5. Block Diagram of the Aft Suspension Unit (ACU) . . . . . . . . . . . . . . . . . . . . . . . . . . . . . . . . . . . . . . . . . . . . . 261Figure 9-6. Block diagram of the GSS power system. . . . . . . . . . . . . . . . . . . . . . . . . . . . . . . . . . . . . . . . . . . . . . . . . . . . . . 262xviii March 2007
Figure 9-7. Photograph of rotor and housing. Suspension electrodes and spin-up channel are clearly seen. . . .263Figure 9-8. Block diagram of the LQE control architecture. . . . . . . . . . . . . . . . . . . . . . . . . . . . . . . . . . . . . . . . . . . . . . . . 264Figure 9-9. Simulated response of adaptive LQE controller showing constant excursion for varying disturbance264Figure 9-10. Suspension Controllers and Modes of Operation showing the 8 ordersof magnitude of operation for this system. . . . . . . . . . . . . . . . . . . . . . . . . . . . . . . . . . . . . . . . . . . . . . . . . . . . 265Figure 9-11. Initial suspension of gyroscope in analog backup mode (blue=A axis, green = B, red = C) . . . . . . 266Figure 9-12. GSS step response in Science mode, showing control stiffness as a function of miscentering. . . 267Figure 9-13. Details of control response showing high-bandwidth (left) low-bandwidth (right) operation. . . 267Figure 9-14. GSS control efforts during full flow gyroscope spin-up operations(top plot: blue = A, green = B, red = C) . . . . . . . . . . . . . . . . . . . . . . . . . . . . . . . . . . . . . . . . . . . . . . . . . . . . . . . 268Figure 9-15. Simulated (L) and actual (R) spin axis alignment tracks for Gyro 3 coarse alignment . . . . . . . . . . . 269Figure 9-16. Predicted and measured drift rates for coarse and fine alignment modes. . . . . . . . . . . . . . . . . . . . . . 270Figure 9-17. Unsuspended or “prime” drag-free control topology. . . . . . . . . . . . . . . . . . . . . . . . . . . . . . . . . . . . . . . . . 271Figure 9-18. Suspended or “backup” drag-free control topology. . . . . . . . . . . . . . . . . . . . . . . . . . . . . . . . . . . . . . . . . . . 272Figure 9-19. Drag-free transitions: Backup and prime . . . . . . . . . . . . . . . . . . . . . . . . . . . . . . . . . . . . . . . . . . . . . . . . . . . . . 273Figure 9-20. Representative drag-free performance together with gravity gradientacceleration on the space vehicle . . . . . . . . . . . . . . . . . . . . . . . . . . . . . . . . . . . . . . . . . . . . . . . . . . . . . . . . . . . . 274Figure 10-1. Gyroscope SQUID Readout System . . . . . . . . . . . . . . . . . . . . . . . . . . . . . . . . . . . . . . . . . . . . . . . . . . . . . . . . . . 285Figure 10-2. SQUID Readout Electronics (SRE) – Forward Units . . . . . . . . . . . . . . . . . . . . . . . . . . . . . . . . . . . . . . . . . . . . 286Figure 10-3. SQUID Readout Electronics (SRE) – Aft Units . . . . . . . . . . . . . . . . . . . . . . . . . . . . . . . . . . . . . . . . . . . . . . . . . 287Figure 10-4. SQUID Readout Electronics (SRE) – Sub-system Architecture . . . . . . . . . . . . . . . . . . . . . . . . . . . . . . . . . . 287Figure 10-5. SQUID Noise Data - Payload Test . . . . . . . . . . . . . . . . . . . . . . . . . . . . . . . . . . . . . . . . . . . . . . . . . . . . . . . . . . . . 289Figure 10-6. AC Magnetic Shielding – Payload Test . . . . . . . . . . . . . . . . . . . . . . . . . . . . . . . . . . . . . . . . . . . . . . . . . . . . . . . 290Figure 10-7. SQUID Temperature Coefficient – Payload Test . . . . . . . . . . . . . . . . . . . . . . . . . . . . . . . . . . . . . . . . . . . . . . 291Figure 10-8. Temperature Error of SQUID Bracket Temperature Control Test at August 8 2001 18:19-20:19 . 292Figure 10-9. Square Root of Power Spectrum Magnitude of the Temperature Error . . . . . . . . . . . . . . . . . . . . . . . . 292Figure 10-10. Quiescent SQUID Noise Data – On Orbit . . . . . . . . . . . . . . . . . . . . . . . . . . . . . . . . . . . . . . . . . . . . . . . . . . . . . 294Figure 10-11. SQUID Bracket Temperature Control – On-Orbit . . . . . . . . . . . . . . . . . . . . . . . . . . . . . . . . . . . . . . . . . . . . . . 295Figure 10-12. SQUID Electronics Temperature Control – On-Orbit . . . . . . . . . . . . . . . . . . . . . . . . . . . . . . . . . . . . . . . . . . 296Figure 11-1. Block diagram of TRE and associated aspects of the SRE system . . . . . . . . . . . . . . . . . . . . . . . . . . . . . . 310Figure 11-2. CLL switch states during normal operation . . . . . . . . . . . . . . . . . . . . . . . . . . . . . . . . . . . . . . . . . . . . . . . . . . 313Figure 11-3. CLL switch states during the reset interval. . . . . . . . . . . . . . . . . . . . . . . . . . . . . . . . . . . . . . . . . . . . . . . . . . . . 314Figure 11-4. CLL switches locked for offset adjustment . . . . . . . . . . . . . . . . . . . . . . . . . . . . . . . . . . . . . . . . . . . . . . . . . . . 314Figure 11-5. Local box temperature and detector high signals since launch . . . . . . . . . . . . . . . . . . . . . . . . . . . . . . . 315Figure 11-6. High Gamma Angle Data Sample . . . . . . . . . . . . . . . . . . . . . . . . . . . . . . . . . . . . . . . . . . . . . . . . . . . . . . . . . . . . 317Figure 11-7. Low Gamma Angle Data Sample . . . . . . . . . . . . . . . . . . . . . . . . . . . . . . . . . . . . . . . . . . . . . . . . . . . . . . . . . . . . 318Figure 11-8. Guide Star intensity versus time . . . . . . . . . . . . . . . . . . . . . . . . . . . . . . . . . . . . . . . . . . . . . . . . . . . . . . . . . . . . . 319Figure 11-9. Point spread function of IM Peg image at the roof prism . . . . . . . . . . . . . . . . . . . . . . . . . . . . . . . . . . . . . 321Figure 11-10. Pointing angle . . . . . . . . . . . . . . . . . . . . . . . . . . . . . . . . . . . . . . . . . . . . . . . . . . . . . . . . . . . . . . . . . . . . . . . . . . . . . . 321Figure 11-11. X-axis, A side RMS pointing noise equivalent due to detector noise . . . . . . . . . . . . . . . . . . . . . . . . . . . 322Figure 11-12. Y axis, A side RMS pointing noise equivalent due to detector noise . . . . . . . . . . . . . . . . . . . . . . . . . . . 323Figure 11-13. X axis, B side RMS pointing noise equivalent due to detector noise . . . . . . . . . . . . . . . . . . . . . . . . . . . 323Figure 11-14. Y axis, B side RMS pointing noise equivalent due to detector noise . . . . . . . . . . . . . . . . . . . . . . . . . . . 324Figure 11-15. X axis, A side current variation . . . . . . . . . . . . . . . . . . . . . . . . . . . . . . . . . . . . . . . . . . . . . . . . . . . . . . . . . . . . . . . 325Figure 11-16. Y axis, A side current variation . . . . . . . . . . . . . . . . . . . . . . . . . . . . . . . . . . . . . . . . . . . . . . . . . . . . . . . . . . . . . . . 325Figure 11-17. X axis, B side current variation . . . . . . . . . . . . . . . . . . . . . . . . . . . . . . . . . . . . . . . . . . . . . . . . . . . . . . . . . . . . . . . 326Figure 11-18. Y axis, B-side current variation . . . . . . . . . . . . . . . . . . . . . . . . . . . . . . . . . . . . . . . . . . . . . . . . . . . . . . . . . . . . . . . 326Figure 11-19. Dither amplitude as a function of time . . . . . . . . . . . . . . . . . . . . . . . . . . . . . . . . . . . . . . . . . . . . . . . . . . . . . . . 327<strong>Gravity</strong> <strong>Probe</strong> B — <strong>Post</strong> <strong>Flight</strong> Analysis • Final <strong>Report</strong> March 2007 xix
Figure 11-20. Pointing angle difference between primary and redundant readouts . . . . . . . . . . . . . . . . . . . . . . . . . 328Figure 11-21. The color variation of IM Peg. The sum of the detector current of one of the axisis also shown to indicate how star brightness varies. . . . . . . . . . . . . . . . . . . . . . . . . . . . . . . . . . . . . . . . . . 328Figure 11-22. The scaled summed current for each of the four pairs of detectors. . . . . . . . . . . . . . . . . . . . . . . . . . . . 329Figure 11-23. Comparison of four pairs of scaled summed current with each otherand with R band of ground measurement. . . . . . . . . . . . . . . . . . . . . . . . . . . . . . . . . . . . . . . . . . . . . . . . . . . . 329Figure 11-24. Scaled summed current compared with the values of channel XB.The ratios have been normalized for easy comparison. . . . . . . . . . . . . . . . . . . . . . . . . . . . . . . . . . . . . . . . 330Figure 11-25. Comparison of estimated photocurrent based on Science slopes andon least square fit slope derived from TRE snapshots . . . . . . . . . . . . . . . . . . . . . . . . . . . . . . . . . . . . . . . . . 331Figure 11-26. Temperature variation of telescope top plate . . . . . . . . . . . . . . . . . . . . . . . . . . . . . . . . . . . . . . . . . . . . . . . . 332Figure 11-27. Temperature variation of Window 1 . . . . . . . . . . . . . . . . . . . . . . . . . . . . . . . . . . . . . . . . . . . . . . . . . . . . . . . . . 332Figure 11-28. Temperature variation of Window 2 . . . . . . . . . . . . . . . . . . . . . . . . . . . . . . . . . . . . . . . . . . . . . . . . . . . . . . . . . 332Figure 11-29. Temperature variation of Window 4 . . . . . . . . . . . . . . . . . . . . . . . . . . . . . . . . . . . . . . . . . . . . . . . . . . . . . . . . . 332Figure 12-1. Integrated probe and dewar. . . . . . . . . . . . . . . . . . . . . . . . . . . . . . . . . . . . . . . . . . . . . . . . . . . . . . . . . . . . . . . . . 335Figure 12-2. Temperature spiking at probe station 200 (primary cryogenic probe/dewar interface). . . . . . . . . 337Figure 12-3. Helium flow rate predicted by dewar model based on both the measuredshell temperatures and predicted temperatures. . . . . . . . . . . . . . . . . . . . . . . . . . . . . . . . . . . . . . . . . . . . . . 340Figure 12-4. Main tank temperature in response to fourth heat pulse measurement with lineartrendlines before and after heat pulse. Temperature increase is taken to be the difference in thetwo trendline values at the middle of the pulse. . . . . . . . . . . . . . . . . . . . . . . . . . . . . . . . . . . . . . . . . . . . . . . 342Figure 12-5. Plot of the remaining mass of liquid helium as a function of HPM measurement date with lineartrendline. The fact that the trendline does not project backwards to the original quantity of liquidhelium (taken to be 337 kg) is indicative of a scale factor error. . . . . . . . . . . . . . . . . . . . . . . . . . . . . . . . 343Figure 12-6. Flow meter and ATC flow rates as a function of UTC date starting at launch. Data encompass periodsof flow control (constant segments in the ATC data) as well as pressure control. . . . . . . . . . . . . . . . 344Figure 12-7. Mass remaining estimated from integrated flow meter and ATC flow rates. Trendline fits areextrapolated to zero mass. Since depletion did not occur in early July, it is clear that the dewar flowmeter results under-predicted lifetime. . . . . . . . . . . . . . . . . . . . . . . . . . . . . . . . . . . . . . . . . . . . . . . . . . . . . . . 344Figure 12-8. Flow meter data reduced by 10% and plotted with ATC flow rate and flow rate predicted by thedewar thermal model. Thermal model is based on measured shell temperatures rather thanpredicted shell temperatures. . . . . . . . . . . . . . . . . . . . . . . . . . . . . . . . . . . . . . . . . . . . . . . . . . . . . . . . . . . . . . . . 345Figure 12-9. HPM data analyzed under three different assumptions together with extrapolated linear trendlines.348Figure 13-1. Locations of Forward and Aft ECU boxes on the <strong>GP</strong>-B spacecraft . . . . . . . . . . . . . . . . . . . . . . . . . . . . . . 353Figure 13-2. ECU-operated heaters in the dewar & probe . . . . . . . . . . . . . . . . . . . . . . . . . . . . . . . . . . . . . . . . . . . . . . . . . 354Figure 13-3. ECU-operated temperature sensors in the dewar & <strong>Probe</strong> . . . . . . . . . . . . . . . . . . . . . . . . . . . . . . . . . . . . 354Figure 13-4. ECU-operated heaters and temperature sensors in the <strong>Probe</strong> and <strong>Probe</strong> windows . . . . . . . . . . . . 355Figure 13-5. General locations of ECU-controlled subsystems on the spacecraft . . . . . . . . . . . . . . . . . . . . . . . . . . . 355Figure 13-6. A six-inch Vatterfly leakage exhaust valve at the top of the dewar . . . . . . . . . . . . . . . . . . . . . . . . . . . . 356Figure 13-7. The Gas Management System (GMA) . . . . . . . . . . . . . . . . . . . . . . . . . . . . . . . . . . . . . . . . . . . . . . . . . . . . . . . . 356Figure 13-8. UV lamps and the gyro electrostatic discharge system . . . . . . . . . . . . . . . . . . . . . . . . . . . . . . . . . . . . . . . 357Figure 13-9. The <strong>GP</strong>-B Proton Monitor box . . . . . . . . . . . . . . . . . . . . . . . . . . . . . . . . . . . . . . . . . . . . . . . . . . . . . . . . . . . . . . . 357Figure 13-10. Performance during Low Temperature Bakeout . . . . . . . . . . . . . . . . . . . . . . . . . . . . . . . . . . . . . . . . . . . . . . 359Figure 13-11. ECU performance during IOC flux reduction . . . . . . . . . . . . . . . . . . . . . . . . . . . . . . . . . . . . . . . . . . . . . . . . . 360Figure 13-12. ECU heater activity following launch . . . . . . . . . . . . . . . . . . . . . . . . . . . . . . . . . . . . . . . . . . . . . . . . . . . . . . . . . 361Figure 13-13. ECU heater activity during first month of IOC . . . . . . . . . . . . . . . . . . . . . . . . . . . . . . . . . . . . . . . . . . . . . . . . 361Figure 13-14. ECU heater activity during the 2nd month of IOC . . . . . . . . . . . . . . . . . . . . . . . . . . . . . . . . . . . . . . . . . . . . 362Figure 13-15. ECU heater activity from mid June - mid July, 2004 . . . . . . . . . . . . . . . . . . . . . . . . . . . . . . . . . . . . . . . . . . . 363Figure 13-16. ECU heater activity during gyro spinup and other critical IOC procedures . . . . . . . . . . . . . . . . . . . . . 363Figure 13-17. ECU heater activity during the last month of IOC . . . . . . . . . . . . . . . . . . . . . . . . . . . . . . . . . . . . . . . . . . . . . 364xx March 2007
Figure 13-18. ECU heater activity during the first half of the Science Phase . . . . . . . . . . . . . . . . . . . . . . . . . . . . . . . . . 365Figure 13-19. ECU heater activity during the Science Phase, from January-May 2005 . . . . . . . . . . . . . . . . . . . . . . . . 366Figure 13-20. Typical Month of Proton Monitor Data . . . . . . . . . . . . . . . . . . . . . . . . . . . . . . . . . . . . . . . . . . . . . . . . . . . . . . . 369Figure 13-21. Proton Monitor data in South Atlantic Anomaly . . . . . . . . . . . . . . . . . . . . . . . . . . . . . . . . . . . . . . . . . . . . . . 370Figure 13-22. Twice Orbital Component . . . . . . . . . . . . . . . . . . . . . . . . . . . . . . . . . . . . . . . . . . . . . . . . . . . . . . . . . . . . . . . . . . . 370Figure 13-23. FFT of data from the horizontal detector . . . . . . . . . . . . . . . . . . . . . . . . . . . . . . . . . . . . . . . . . . . . . . . . . . . . . 371Figure 13-24. Histogram of Proton Events . . . . . . . . . . . . . . . . . . . . . . . . . . . . . . . . . . . . . . . . . . . . . . . . . . . . . . . . . . . . . . . . . 371Figure 13-25. Proton Monitor Data from November 2004 . . . . . . . . . . . . . . . . . . . . . . . . . . . . . . . . . . . . . . . . . . . . . . . . . . 372Figure 13-26. Zoomed out view of Figure 13-25 . . . . . . . . . . . . . . . . . . . . . . . . . . . . . . . . . . . . . . . . . . . . . . . . . . . . . . . . . . . 372Figure 13-27. Increased Proton Flux during the November 2004 solar activity . . . . . . . . . . . . . . . . . . . . . . . . . . . . . . . 373Figure 13-28. Correlation between Vertical PM Detector and Science Telescope (PXA) . . . . . . . . . . . . . . . . . . . . . . 373Figure 13-29. Correlation between Horizontal PM Detector and Science Telescope (PXA) . . . . . . . . . . . . . . . . . . . 374Figure 13-30. Correlation between Vertical PM Detector and Science Telescope (PYA). . . . . . . . . . . . . . . . . . . . . . . 375Figure 13-31. <strong>GP</strong>-B payload magnetometer . . . . . . . . . . . . . . . . . . . . . . . . . . . . . . . . . . . . . . . . . . . . . . . . . . . . . . . . . . . . . . . . 376Figure 13-32. Measurement axes of the payload magnetometers. . . . . . . . . . . . . . . . . . . . . . . . . . . . . . . . . . . . . . . . . . . 377Figure 13-33. Mounting locations of the payload magnetometers. . . . . . . . . . . . . . . . . . . . . . . . . . . . . . . . . . . . . . . . . . 377Figure 13-34. Location of <strong>GP</strong>S equipment on <strong>GP</strong>-B . . . . . . . . . . . . . . . . . . . . . . . . . . . . . . . . . . . . . . . . . . . . . . . . . . . . . . . . . 379Figure 13-35. <strong>GP</strong>S Antennae Field of View . . . . . . . . . . . . . . . . . . . . . . . . . . . . . . . . . . . . . . . . . . . . . . . . . . . . . . . . . . . . . . . . . 380Figure 13-36. Rolling Rig . . . . . . . . . . . . . . . . . . . . . . . . . . . . . . . . . . . . . . . . . . . . . . . . . . . . . . . . . . . . . . . . . . . . . . . . . . . . . . . . . . 381Figure 13-37. Master Antenna Switching . . . . . . . . . . . . . . . . . . . . . . . . . . . . . . . . . . . . . . . . . . . . . . . . . . . . . . . . . . . . . . . . . . 382Figure 13-38. Histogram of PPS Data . . . . . . . . . . . . . . . . . . . . . . . . . . . . . . . . . . . . . . . . . . . . . . . . . . . . . . . . . . . . . . . . . . . . . . 383Figure 13-39. Time difference between transmission and reception of <strong>GP</strong>S data packet. . . . . . . . . . . . . . . . . . . . . 384Figure 13-40. Residuals of Least Square fitting algorithm with 2nd order model. . . . . . . . . . . . . . . . . . . . . . . . . . . . . 385Figure 13-41. Coverage Curves for <strong>GP</strong>S simulator, rolling rig, and flight data. At <strong>GP</strong>-B's roll rate, the simulatedcoverage is 86%, while flight rate is better than 95% . . . . . . . . . . . . . . . . . . . . . . . . . . . . . . . . . . . . . . . . . 386Figure 13-42. Coverage rates during an increase in vehicle roll rate. . . . . . . . . . . . . . . . . . . . . . . . . . . . . . . . . . . . . . . . . 387Figure 13-43. Percent Lock and data points used before and after the switch to the B-sidereceiver on March 4, 2005, day 64. . . . . . . . . . . . . . . . . . . . . . . . . . . . . . . . . . . . . . . . . . . . . . . . . . . . . . . . . . . . 389Figure 13-44. A Top View of the GMA Pallet with the Thermal Blanket Frame Attached . . . . . . . . . . . . . . . . . . . . . . 391Figure 13-45. A Bottom View of the GMA Showing the Supply Tanks and Outlet Valves . . . . . . . . . . . . . . . . . . . . . 392Figure 13-46. GMA vent manifold and service GSE used to minimize cryogenic contamination and ensureregulator lock-up for launch . . . . . . . . . . . . . . . . . . . . . . . . . . . . . . . . . . . . . . . . . . . . . . . . . . . . . . . . . . . . . . . . . 393Figure 13-47. Service valve assembly (fill and drain valves) used to service the GMA to reduce the risk of cryogeniccontamination during ground support . . . . . . . . . . . . . . . . . . . . . . . . . . . . . . . . . . . . . . . . . . . . . . . . . . . . . . 393Figure 13-48. The GMA configuration on a vented honeycomb pallet . . . . . . . . . . . . . . . . . . . . . . . . . . . . . . . . . . . . . . 394Figure 13-49. Schematic diagram of the GMA . . . . . . . . . . . . . . . . . . . . . . . . . . . . . . . . . . . . . . . . . . . . . . . . . . . . . . . . . . . . . . 394Figure 13-50. Helium gas consumption for 10 hz and full spin-up of gyro #4 during IOC . . . . . . . . . . . . . . . . . . . . . 395Figure 13-51. Pressure Transducer <strong>GP</strong>-1 Snap-Shot of Actual Gas Consumed by the GMA . . . . . . . . . . . . . . . . . . . 395Figure 14-1. A drawing of the spacecraft communicating with ground tracking stations . . . . . . . . . . . . . . . . . . . 399Figure 14-2. A typical solid state recorder (SSR) manufactured by SEAKR Engineering . . . . . . . . . . . . . . . . . . . . . . 400Figure 14-3. A NASA TDRSS Satellite . . . . . . . . . . . . . . . . . . . . . . . . . . . . . . . . . . . . . . . . . . . . . . . . . . . . . . . . . . . . . . . . . . . . . 401Figure 14-4. NASA ground stations at Svalbard, Norway (upper left), Poker Flats, Alaska (lower left),and Wallops Island, Virginia (right) . . . . . . . . . . . . . . . . . . . . . . . . . . . . . . . . . . . . . . . . . . . . . . . . . . . . . . . . . . . 402Figure 14-5. The <strong>GP</strong>-B building and Mission Operations Center (MOC) at <strong>Stanford</strong> University . . . . . . . . . . . . . . . 403Figure 14-6. ITF readout showing a discrepancy between the actual value (left) of memory location in thespacecraft's computer vs the correct value (right) stored in the ITF simulator. . . . . . . . . . . . . . . . . . 405Figure 14-7. Two members of the <strong>GP</strong>-B Mission Operations team discuss an MBE that triggered a B-Side (CCCBcomputer) reboot on March 18, 2005 . . . . . . . . . . . . . . . . . . . . . . . . . . . . . . . . . . . . . . . . . . . . . . . . . . . . . . . . 405Figure 14-8. Uploading commands to the spacecraft from the MOC, following a B-side computer reboot. . . 406<strong>Gravity</strong> <strong>Probe</strong> B — <strong>Post</strong> <strong>Flight</strong> Analysis • Final <strong>Report</strong> March 2007 xxi
Figure 14-9. In the Anomaly Room, team members discuss a series of recovery commands thatwill be uploaded to the spacecraft. . . . . . . . . . . . . . . . . . . . . . . . . . . . . . . . . . . . . . . . . . . . . . . . . . . . . . . . . . . 407Figure 14-10. British Astronomer Royal, James Bradley . . . . . . . . . . . . . . . . . . . . . . . . . . . . . . . . . . . . . . . . . . . . . . . . . . . . . 409Figure 14-11. Due to the motion of the Earth, the apparent position of a distant star viewed through a telescopediffers from its actual position—Bradley called this difference the aberration angle. . . . . . . . . . . . 411Figure 14-12. <strong>GP</strong>-B's Orbital aberration of light from the Guide Star, IM Pegasi . . . . . . . . . . . . . . . . . . . . . . . . . . . . . . 412Figure 14-13. <strong>GP</strong>-B's annual aberration of light from the Guide Star, IM Pegasi . . . . . . . . . . . . . . . . . . . . . . . . . . . . . . 413Figure 14-14. Schematic diagram of the <strong>GP</strong>-B telescope optics . . . . . . . . . . . . . . . . . . . . . . . . . . . . . . . . . . . . . . . . . . . . . 414Figure 14-15. Normalized pointing values for the <strong>GP</strong>-B telescope . . . . . . . . . . . . . . . . . . . . . . . . . . . . . . . . . . . . . . . . . . . 415Figure 14-16. Centering the telescope's light distribution . . . . . . . . . . . . . . . . . . . . . . . . . . . . . . . . . . . . . . . . . . . . . . . . . . 415Figure 14-17. The telescope dither pattern around Guide Star, IM Pegasi . . . . . . . . . . . . . . . . . . . . . . . . . . . . . . . . . . . 416Figure 14-18. Components of the <strong>GP</strong>-B Data Analysis Standard Model (equations shown are significantlysimplified and are of iconic value only) . . . . . . . . . . . . . . . . . . . . . . . . . . . . . . . . . . . . . . . . . . . . . . . . . . . . . . 421Figure 15-1. A photo montage of the <strong>GP</strong>-B spacecraft in orbit and a photo of the <strong>GP</strong>-B Mission Operations Centerin action during the spin-up of gyro #4. . . . . . . . . . . . . . . . . . . . . . . . . . . . . . . . . . . . . . . . . . . . . . . . . . . . . . . 425Figure 15-2. A diagram of the <strong>GP</strong>-B experiment showing the predicted geodetic and frame-dragging effects. . .426Figure 15-3. A slide from the <strong>GP</strong>-B plenary talk that Francis Everitt will deliver at the APS meeting on April 14,2007. The plots on the left side of this slide clearly show the predicted geodetic effect in theunprocessed gyro data to an accuracy level of ~1%. A copy of this talk will be available on the APSpage of the <strong>GP</strong>-B Web site:http://einstein.stanford.edu/content/aps_posters#talks. . . . . . . . . . . . . . . . . . . . . . . . . . . . . . . . . . . . . . 426Figure 15-4. A slide from the <strong>GP</strong>-B plenary talk that Francis Everitt will deliver at the APS meeting on April 14,2007. This slide shows the changing polhode paths of gyros #1 and #4 and summarizes the issues ofpolhode rate variations in the gyros. . . . . . . . . . . . . . . . . . . . . . . . . . . . . . . . . . . . . . . . . . . . . . . . . . . . . . . . . . 428Figure 15-5. A slide from the <strong>GP</strong>-B plenary talk that Francis Everitt will deliver at the APS meeting on April 14,2007. This slide shows the misalignment torques discovered during a series of instrumentcalibration tests performed during the last six weeks of the mission, prior to depletion of helium inthe dewar. . . . . . . . . . . . . . . . . . . . . . . . . . . . . . . . . . . . . . . . . . . . . . . . . . . . . . . . . . . . . . . . . . . . . . . . . . . . . . . . . . . 429Figure 15-6. Plots from different viewing angles showing the changing polhode path of gyor #1 over the life ofthe experiment. . . . . . . . . . . . . . . . . . . . . . . . . . . . . . . . . . . . . . . . . . . . . . . . . . . . . . . . . . . . . . . . . . . . . . . . . . . . . . 430Figure 15-7. A poster on gyro polhode motion to be presented at the APS meeting in April 2007.You can view/download a larger and more readable PDF version of this posteron our <strong>GP</strong>-B APS Web page: http://einstein.stanford.edu/content/aps_posters#posters. . . . . . . . 431Figure 15-8. A slide from the <strong>GP</strong>-B plenary talk that Francis Everitt will deliver at the APS meeting on April 14,2007. This slide shows how dither and aberration of starlight are used as calibrating signals indetermining the gyro-telescope scale factor, C g . . . . . . . . . . . . . . . . . . . . . . . . . . . . . . . . . . . . . . . . . . . . . . 432Figure 15-9. A poster on the effects of classical torques on the gyros to be presented at the APS meeting in April2007. You can view/download a larger and more readable PDF version of this posteron our <strong>GP</strong>-B APS Web page: http://einstein.stanford.edu/content/aps_posters#posters. . . . . . . . 434Figure 15-10. A poster on the evidence for patch effects to be presented at the APS meeting in April 2007.You can view/download a larger and more readable PDF version of this poster on our <strong>GP</strong>-B APS Webpage:http://einstein.stanford.edu/content/aps_posters#posters. . . . . . . . . . . . . . . . . . . . . . . . . . . . . . . . . . . . 435Figure 15-11. A slide from the <strong>GP</strong>-B plenary talk that Francis Everitt will deliver at the APS meeting on April 14,2007. This slide shows the succession of investigative steps and observations that led to thedetermination that patch effects are the root cause of both the polhode variation and misalignmenttorques on the gyros. . . . . . . . . . . . . . . . . . . . . . . . . . . . . . . . . . . . . . . . . . . . . . . . . . . . . . . . . . . . . . . . . . . . . . . . 436Figure 15-12. A slide from the <strong>GP</strong>-B plenary talk that Francis Everitt will deliver at the APS meeting on April 14,2007. This slide shows the <strong>GP</strong>-B data analysis team, except for Principal Investigator, Francis Everitt.A copy of this talk will be available on our APS Web site:http://einstein.stanford.edu/content/aps_posters#talks. . . . . . . . . . . . . . . . . . . . . . . . . . . . . . . . . . . . . . 437xxii March 2007
Figure 15-13. Map of the estimated magnetic flux trapped on the surface of the gyro rotors. Two methods arecurrently being employed—one mapping individual fluxons and the other mapping magnetic fieldstrength. . . . . . . . . . . . . . . . . . . . . . . . . . . . . . . . . . . . . . . . . . . . . . . . . . . . . . . . . . . . . . . . . . . . . . . . . . . . . . . . . . . . 438Figure 15-14. A slide from a talk that Irwin Shapiro will deliver at the APS meeting on April 14, 2007, entitled: ProperMotion of the <strong>GP</strong>-B guide star. . . . . . . . . . . . . . . . . . . . . . . . . . . . . . . . . . . . . . . . . . . . . . . . . . . . . . . . . . . . . . . . . . . . . 439Figure 16-1. Six interacting translational degrees of freedom . . . . . . . . . . . . . . . . . . . . . . . . . . . . . . . . . . . . . . . . . . . . . 452Figure D-1. Anomaly Type Trends during the mission . . . . . . . . . . . . . . . . . . . . . . . . . . . . . . . . . . . . . . . . . . . . . . . . . . . . 523Figure D-2. Observation categories by subsystem . . . . . . . . . . . . . . . . . . . . . . . . . . . . . . . . . . . . . . . . . . . . . . . . . . . . . . . 524<strong>Gravity</strong> <strong>Probe</strong> B — <strong>Post</strong> <strong>Flight</strong> Analysis • Final <strong>Report</strong> March 2007 xxiii
xxiv March 2007
List of TablesTable 1-1. <strong>GP</strong>-B Seven Near Zeroes . . . . . . . . . . . . . . . . . . . . . . . . . . . . . . . . . . . . . . . . . . . . . . . . . . . . . . . . . . . . . . . . . . . . . . . .7Table 2-1. Final gyro spin rates . . . . . . . . . . . . . . . . . . . . . . . . . . . . . . . . . . . . . . . . . . . . . . . . . . . . . . . . . . . . . . . . . . . . . . . . . . .46Table 2-2. Weekly summary of IOC accomplishments . . . . . . . . . . . . . . . . . . . . . . . . . . . . . . . . . . . . . . . . . . . . . . . . . . . . .47Table 2-3. Spin-up history of the <strong>GP</strong>-B gyros . . . . . . . . . . . . . . . . . . . . . . . . . . . . . . . . . . . . . . . . . . . . . . . . . . . . . . . . . . . . . .55Table 2-4. Monthly highlights of the <strong>GP</strong>-B Science Phase . . . . . . . . . . . . . . . . . . . . . . . . . . . . . . . . . . . . . . . . . . . . . . . . .59Table 2-5. Weekly highlights of the 7-week final instrument calibration phase . . . . . . . . . . . . . . . . . . . . . . . . . . . . .63Table 3-1. <strong>GP</strong>-B Seven Near Zeroes . . . . . . . . . . . . . . . . . . . . . . . . . . . . . . . . . . . . . . . . . . . . . . . . . . . . . . . . . . . . . . . . . . . . . . .68Table 4-1. Mission Planning Mastery Index . . . . . . . . . . . . . . . . . . . . . . . . . . . . . . . . . . . . . . . . . . . . . . . . . . . . . . . . . . . . . 101Table 4-2. Mission Planning Commercial Software . . . . . . . . . . . . . . . . . . . . . . . . . . . . . . . . . . . . . . . . . . . . . . . . . . . . . . 101Table 4-3. Mission Planning software developed by <strong>GP</strong>-B . . . . . . . . . . . . . . . . . . . . . . . . . . . . . . . . . . . . . . . . . . . . . . . 102Table 4-4. Pre-TISI Mission Planning Challenges . . . . . . . . . . . . . . . . . . . . . . . . . . . . . . . . . . . . . . . . . . . . . . . . . . . . . . . . 102Table 4-5. Addressing mission planning needs with TISI . . . . . . . . . . . . . . . . . . . . . . . . . . . . . . . . . . . . . . . . . . . . . . . . 103Table 4-6. Features & benefits of Web delivery . . . . . . . . . . . . . . . . . . . . . . . . . . . . . . . . . . . . . . . . . . . . . . . . . . . . . . . . . 104Table 4-7. Re-inventing the mission operations concept . . . . . . . . . . . . . . . . . . . . . . . . . . . . . . . . . . . . . . . . . . . . . . . . 104Table 4-8. Mission Planning workload volume—IOC & Science . . . . . . . . . . . . . . . . . . . . . . . . . . . . . . . . . . . . . . . . . . 106Table 4-9. Summary of Data Capture . . . . . . . . . . . . . . . . . . . . . . . . . . . . . . . . . . . . . . . . . . . . . . . . . . . . . . . . . . . . . . . . . . . 108Table 4-10. Significant Events/Sources of Data Loss . . . . . . . . . . . . . . . . . . . . . . . . . . . . . . . . . . . . . . . . . . . . . . . . . . . . . . 110Table 4-11. ITF equipment list . . . . . . . . . . . . . . . . . . . . . . . . . . . . . . . . . . . . . . . . . . . . . . . . . . . . . . . . . . . . . . . . . . . . . . . . . . . 121Table 5-1. Summary of Open <strong>GP</strong>-B risks at the end of IOC . . . . . . . . . . . . . . . . . . . . . . . . . . . . . . . . . . . . . . . . . . . . . . . 135Table 6-1. <strong>GP</strong>-B Promised vs. Actual Funding History, FY '99 - FY '02 . . . . . . . . . . . . . . . . . . . . . . . . . . . . . . . . . . . . . 155Table 7-1. Control System Equipment List . . . . . . . . . . . . . . . . . . . . . . . . . . . . . . . . . . . . . . . . . . . . . . . . . . . . . . . . . . . . . . 171Table 8-1. SRE Temperature Coefficients (in mV/K) . . . . . . . . . . . . . . . . . . . . . . . . . . . . . . . . . . . . . . . . . . . . . . . . . . . . . 221Table 8-2. TDRS Command Modes . . . . . . . . . . . . . . . . . . . . . . . . . . . . . . . . . . . . . . . . . . . . . . . . . . . . . . . . . . . . . . . . . . . . . 234Table 8-3. Ground Station Setup . . . . . . . . . . . . . . . . . . . . . . . . . . . . . . . . . . . . . . . . . . . . . . . . . . . . . . . . . . . . . . . . . . . . . . . 235Table 8-4. SCRs Addressed in On-orbit S/W Change . . . . . . . . . . . . . . . . . . . . . . . . . . . . . . . . . . . . . . . . . . . . . . . . . . . . 243Table 8-5. Tests Executed and Passed to Verify SCRs . . . . . . . . . . . . . . . . . . . . . . . . . . . . . . . . . . . . . . . . . . . . . . . . . . . . 246Table 9-1. GSS Science Mission Mode (220Hz) CPU Utilization . . . . . . . . . . . . . . . . . . . . . . . . . . . . . . . . . . . . . . . . . . . 275Table 9-2. GSS Spin-up Mode (660Hz) CPU Utilization . . . . . . . . . . . . . . . . . . . . . . . . . . . . . . . . . . . . . . . . . . . . . . . . . . 276Table 9-3. GSW application source lines of code (SLOC) metrics . . . . . . . . . . . . . . . . . . . . . . . . . . . . . . . . . . . . . . . . . 276Table 10-1. Calculations of true noise for each of the four SQUIDs . . . . . . . . . . . . . . . . . . . . . . . . . . . . . . . . . . . . . . . . 289Table 10-2. Measured SQUID bias temperature coefficients . . . . . . . . . . . . . . . . . . . . . . . . . . . . . . . . . . . . . . . . . . . . . . 291Table 10-3. Thermal Power Density at Roll (C/(Hz))— Worst case estimate . . . . . . . . . . . . . . . . . . . . . . . . . . . . . . . . 296Table 10-4. RMS Temperature Variations in 3 mHz Band About Roll (C)— Worst case estimate . . . . . . . . . . . . 297Table 10-5. RE Bias Temperature Coefficients . . . . . . . . . . . . . . . . . . . . . . . . . . . . . . . . . . . . . . . . . . . . . . . . . . . . . . . . . . . . 297Table 10-6. Processor utilization and activation schedule for SQUID/Science telescope applications duringGuide Start Valid and Invalid . . . . . . . . . . . . . . . . . . . . . . . . . . . . . . . . . . . . . . . . . . . . . . . . . . . . . . . . . . . . . . . . 298Table 10-7. SSW application source lines of code (SLOC) metrics . . . . . . . . . . . . . . . . . . . . . . . . . . . . . . . . . . . . . . . . . 299Table 11-1. Gain code change times . . . . . . . . . . . . . . . . . . . . . . . . . . . . . . . . . . . . . . . . . . . . . . . . . . . . . . . . . . . . . . . . . . . . . 311Table 11-2. Photo detector dark noise . . . . . . . . . . . . . . . . . . . . . . . . . . . . . . . . . . . . . . . . . . . . . . . . . . . . . . . . . . . . . . . . . . . 312Table 11-3. Dates and UTC times when clamp commands were changed . . . . . . . . . . . . . . . . . . . . . . . . . . . . . . . . . 316Table 11-4. Weighting factors used for processing data . . . . . . . . . . . . . . . . . . . . . . . . . . . . . . . . . . . . . . . . . . . . . . . . . . 320Table 11-5. On-orbit detector pair characteristics . . . . . . . . . . . . . . . . . . . . . . . . . . . . . . . . . . . . . . . . . . . . . . . . . . . . . . . . 324Table 12-1. Key cryogenic system flight requirements . . . . . . . . . . . . . . . . . . . . . . . . . . . . . . . . . . . . . . . . . . . . . . . . . . . 335Table 12-2. Measured trapped field compared to the London moment equivalent field in each of the gyrorotors. . . . . . . . . . . . . . . . . . . . . . . . . . . . . . . . . . . . . . . . . . . . . . . . . . . . . . . . . . . . . . . . . . . . . . . . . . . . . . . . . . . . . . . 349Table 13-1. Proton monitor channel configuration . . . . . . . . . . . . . . . . . . . . . . . . . . . . . . . . . . . . . . . . . . . . . . . . . . . . . . . 368Table 13-2. Technical Specifications . . . . . . . . . . . . . . . . . . . . . . . . . . . . . . . . . . . . . . . . . . . . . . . . . . . . . . . . . . . . . . . . . . . . . 368<strong>Gravity</strong> <strong>Probe</strong> B — <strong>Post</strong> <strong>Flight</strong> Analysis • Final <strong>Report</strong> March 2007 xxv
Table 13-3. <strong>GP</strong>-B payload magnetometer performance characteristics. . . . . . . . . . . . . . . . . . . . . . . . . . . . . . . . . . . . 376Table 13-4. Installed Position of <strong>GP</strong>S Antennae . . . . . . . . . . . . . . . . . . . . . . . . . . . . . . . . . . . . . . . . . . . . . . . . . . . . . . . . . . 379Table 13-5. Environmental Testing Highlights . . . . . . . . . . . . . . . . . . . . . . . . . . . . . . . . . . . . . . . . . . . . . . . . . . . . . . . . . . . 381Table 13-6. Percent Lock for Various Scenarios . . . . . . . . . . . . . . . . . . . . . . . . . . . . . . . . . . . . . . . . . . . . . . . . . . . . . . . . . . . 382Table 13-7. Raw and Processed Positions vs. Truth . . . . . . . . . . . . . . . . . . . . . . . . . . . . . . . . . . . . . . . . . . . . . . . . . . . . . . . 385Table 13-8. Raw and Processed Velocities vs. Truth . . . . . . . . . . . . . . . . . . . . . . . . . . . . . . . . . . . . . . . . . . . . . . . . . . . . . . 385Table 13-9. Summary of Components for the Gas Management Assembly . . . . . . . . . . . . . . . . . . . . . . . . . . . . . . . . 391Table 13-10. Summary for Helium Gas Consumption for GMA Operations On Orbit . . . . . . . . . . . . . . . . . . . . . . . . 396Table 16-1. <strong>GP</strong>-B Risk categories and definitions . . . . . . . . . . . . . . . . . . . . . . . . . . . . . . . . . . . . . . . . . . . . . . . . . . . . . . . . . 457Table E-1. Mission Support Software (MSS) Software Lines Of Code (SLOC) Detail . . . . . . . . . . . . . . . . . . . . . . . . 551xxvi March 2007
Preface<strong>Gravity</strong> <strong>Probe</strong> B (<strong>GP</strong>-B) is a test of Einstein's General Theory of Relativity based on orbiting gyroscopes. NASAtechnology funding commenced in March 1964. After a long development process, reaching completion in2003 to 2004, the mission was successfully launched on April 20, 2004—almost exactly 40 years later. This <strong>Post</strong>-<strong>Flight</strong> Analysis <strong>Report</strong> provides a coherent overall final account of all aspects of <strong>GP</strong>-B, except the science resultswhich are now planned for publication towards the end of 2007.<strong>GP</strong>-B has been a collaborative program between two <strong>Stanford</strong> University Departments, Physics andAeronautics-Astronautics. Since 1965, it has also involved a continuous collaboration between <strong>Stanford</strong> andGeorge C. Marshall Space <strong>Flight</strong> Center in Huntsville, Alabama. A payload subcontract was let from <strong>Stanford</strong> toLockheed Martin in November 1984; the spacecraft contract, also to Lockheed Martin, was let in October 1993.The <strong>GP</strong>-B story is, therefore, a complex one, in fact, seven interfolded stories:1. About testing Einstein2. About the invention of many new technologies3. About a collaboration between university departments4. About highly successful student involvement in a long-running space program5. About a remarkable range of spin-offs, including drag-free technology, Autofarm® <strong>GP</strong>S-based precisiontractor control, a novel quartz bonding technique, and the porous plug device for controlling superfluidhelium in space which made possible the IRAS, COBE, WMAP and Spitzer missions6. About collaboration between NASA and academia7. About the challenge of managing a flight program with a very highly integrated payload and spacecraftwhich led the then-NASA Administrator, Mr. James Beggs, in 1984, to say that <strong>GP</strong>-B was not only afascinating physics experiment but also a fascinating management experiment.We, at <strong>Stanford</strong>, feel profound appreciation to NASA Marshall Center and also many friends at NASAHeadquarters who have helped to make this challenging mission possible. Credit for coordinating, assembling,and editing this report goes to our <strong>GP</strong>-B Public Affairs Coordinator, Bob Kahn.Francis Everitt & Bradford ParkinsonMarch 2007<strong>Gravity</strong> <strong>Probe</strong> B — <strong>Post</strong> <strong>Flight</strong> Analysis • Final <strong>Report</strong>March 2007 xxvii
xxviiiMarch 2007
1Executive Summary<strong>Gravity</strong> <strong>Probe</strong> B — <strong>Post</strong> <strong>Flight</strong> Analysis • Final <strong>Report</strong> March 2007 1
2 March 2007 Chapter 1 — Executive Summary
1.1 What is <strong>Gravity</strong> <strong>Probe</strong> B?<strong>Gravity</strong> <strong>Probe</strong> B (<strong>GP</strong>-B) is a NASA physics mission to experimentally investigate Albert Einstein's 1916 generaltheory of relativity—his theory of gravity. GB-B uses four spherical gyroscopes and a telescope, housed in asatellite orbiting 642 km (400 mi) above the Earth, to measure in a new way, and with unprecedented accuracy,two extraordinary effects predicted by the general theory of relativity (the second having never before beendirectly measured):1. The geodetic effect—the amount by which the Earth warps the local spacetime in which it resides.2. The frame-dragging effect—the amount by which the rotating Earth drags its local spacetime aroundwith it.The <strong>GP</strong>-B experiment tests these two effects by precisely measuring the precession (displacement) angles of thespin axes of the four gyros over the course of a year and comparing these experimental results with predictionsfrom Einstein's theory.<strong>GP</strong>-B is actually the second dedicated NASA physics experiment to test aspects of general relativity. The first,<strong>Gravity</strong> <strong>Probe</strong> A, was led in 1976 by Dr. Robert Vessot of the Smithsonian Astrophysical Observatory. <strong>Gravity</strong><strong>Probe</strong> A compared elapsed time in three identical hydrogen maser clocks—two on the ground and the thirdtraveling for two hours in a rocket, and confirmed the Einstein redshift prediction to 1.4 parts in 10 4 .1.2 A Quest for Experimental TruthThe idea for testing Einstein’s general theory of relativity with orbiting gyroscopes was suggested independentlyby two physicists, George Pugh and Leonard Schiff, in late 1959-early 1960. Schiff, then chairman of the <strong>Stanford</strong>University Physics Department, published a paper summarizing the experiment, “Possible New ExperimentalTest of General Relativity,” in Physical Review Letters (March 1960). Also during this time, Schiff teamed up withtwo colleagues from the <strong>Stanford</strong> faculty: low-temperature physicist William Fairbank and gyroscope expertRobert Cannon of the Department of Aeronautics & Astronautics. Thus was born the collaboration between the<strong>Stanford</strong> Physics and Aero-Astro departments which has been essential to the success of <strong>GP</strong>-B.In 1962, Professor Fairbank invited Francis Everitt to come to <strong>Stanford</strong> as the first full-time academic staffmember on the experiment. NASA's Office of Space Sciences, under the leadership of Dr. Nancy Roman,provided research funding in 1964, with Fairbank and Cannon as Co-Principal Investigators and Schiff asProgram Advisor. Initial funding was direct from NASA Headquarters to <strong>Stanford</strong>. In 1971, program oversightwas transferred to NASA Marshall Space <strong>Flight</strong> Center (MSFC) where some engineering collaboration hadalready begun. Also in 1971, in parallel with the technology development, MSFC funded an in-depth MissionDefinition Study by Ball Brothers Research Corporation (BBRC, now Ball Aerospace), performed in closecollaboration with <strong>Stanford</strong>, the starting point of all future flight studies.Between 1978 and 1984, following in-house Phase A and Phase B studies at MSFC, the experiment was restructuredas a NASA flight program. An important step between 1982 and 1984 was the definition of atechnology development program for <strong>GP</strong>-B to be performed on the Shuttle in 1989—the Shuttle Test Of theRelativity Experiment (STORE), followed two years later by a satellite launch from the Shuttle. In 1981, FrancisEveritt became Principal Investigator, the position which he still holds, and in 1984, <strong>Stanford</strong> Professor BradfordParkinson (Aero-Astro) joined <strong>GP</strong>-B as Program Manager, and also as Co-PI, along with Co-PI's JohnTurneaure (Physics) and Daniel DeBra (Aero-Astro).NASA initiated funding of STORE in FY 1985, following receipt in November 1984 of a <strong>Stanford</strong> proposal, with<strong>Stanford</strong> as prime contractor, and Lockheed Missiles and Space Company (LMSC, now Lockheed Martin) assubcontractor to <strong>Stanford</strong>. In this proposal, Lockheed held principal responsibility for developing the unique650-gallon dewar and probe—the cryogenic apparatus that houses the telescope and four gyroscopes. After theChallenger disaster in 1986 and the subsequent closure of NASA's West-Coast, polar-orbiting shuttle launch<strong>Gravity</strong> <strong>Probe</strong> B — <strong>Post</strong> <strong>Flight</strong> Analysis • Final <strong>Report</strong> March 2007 3
facility, it was necessary to recast the mission as the launch of a dedicated satellite from its own expendablelaunch vehicle, without losing the technology funding. Eventually, after extended NASA review and twocompetitive industrial Phase A studies and proposals, <strong>Stanford</strong> selected LMSC to build the space vehicle andassociated control systems that would contain the dewar and probe in orbit.William Fairbank once remarked: “No mission could be simpler than <strong>Gravity</strong> <strong>Probe</strong> B. It's just a star, a telescope,and a spinning sphere.” However, it took the exceptional collaboration of <strong>Stanford</strong>, MSFC, Lockheed Martin anda host of others almost two more decades to finally bring this “simple” experiment to the launch pad in April2004. Over this period, as construction of the payload and spacecraft commenced, the <strong>GP</strong>-B team expanded,reaching a peak of approximately 100 persons at <strong>Stanford</strong>, and eventually some 200 persons at Lockheed Martin.Six scientists, each with a different area of specialization, became Co-Investigators: Saps (Sasha) Buchman,George (Mac) Keiser, John Lipa, James Lockhart, Barry Muhlfelder, and Michael Taber. In 1998, BradfordParkinson stepped aside as Program Manager, to be succeeded first by John Turneaure, and then in turn, SashaBuchman, Ronald Singley, and Gaylord Green for the flight program, and William Bencze for the data analysisphase of the mission. Throughout this period, Tom Langenstein served as the Deputy Program Manager, withresponsibility for resources and procurements.Figure 1-1. <strong>GP</strong>-B Principal Investigator, Francis Everitt, receiving the NASA Distinguished Public Service Award atan awards ceremony at NASA Headquarters in April 2005However, if there is one person who, along with William Fairbank has proved to be the driving force of <strong>GP</strong>-Bsince his arrival in 1962, it is Francis Everitt. His leadership has markedly advanced the state of the art in theareas of cryogenics, magnetics, quantum devices, telescope design, control systems, quartz fabricationtechniques, metrology and, most of all, gyroscope technology. The fact that <strong>GP</strong>-B survived no fewer than sevenpotential cancellations, finally launched in April 2004, successfully completed a 17-month flight mission, and isnow in the final stages of analyzing the relativity data is a direct tribute to Everitt’s leadership, tenacity, anddogged pursuit of the experimental truth. It was in recognition of these seminal contributions that, in April2005, NASA awarded Everitt the Distinguished Public Service Medal—the highest award that NASA can conferupon a non-government employee.1.3 The <strong>GP</strong>-B <strong>Flight</strong> MissionOn April 20, 2004 at 9:57:24 AM PDT, a crowd of over 2,000 current and former <strong>GP</strong>-B team members andsupporters watched and cheered as the <strong>GP</strong>-B spacecraft lifted off from Vandenberg Air Force Base. Thatemotionally overwhelming day, culminating with the extraordinary live video of the spacecraft separating fromthe second stage booster meant, as <strong>GP</strong>-B Program Manager Gaylord Green put it, “that 10,000 things went right.”The orbital insertion was within a few meters of a perfect “bulls eye,” and thus no orbit trim was required duringthe initialization and checkout phase of the mission.4 March 2007 Chapter 1 — Executive Summary
Once in orbit, the spacecraft first underwent a four-month Initialization and Orbit Checkout (IOC), in which allsystems and instruments were initialized, tested, and optimized for the data collection to follow. The IOC phaseculminated with the spin-up and initial alignment of each of the four science gyros early in August 2004.On August 28, 2004, the spacecraft began collecting science data. During the ensuing 50 weeks, the spacecrafttransmitted over a terabyte of science data to the <strong>GP</strong>-B Mission Operations Center (MOC) at <strong>Stanford</strong>, where itwas processed and stored in a comprehensive database for analysis. On August 15, 2005, the <strong>GP</strong>-B flight teamfinished collecting science data and began a planned set of essential calibration tests of the gyros, telescope, andSQUID readouts that lasted six weeks, until the liquid helium in the dewar was exhausted on September 25,2005. (The helium actually lasted about three weeks longer than expected, allowing for extra calibration tests tobe made.)In October 2005, the <strong>GP</strong>-B science team began a three-phase data analysis process. As of March 2007, the teamhas progressed through Phase I, Phase II, and much of Phase III, and is preparing to announce preliminaryresults on April 14-15, 2007_ at the American Physical Society (APS) meeting in Jacksonville, Florida. In April-May, the team will be releasing the science data and a complete archive of <strong>GP</strong>-B documents to the National SpaceSciences Data Center (NSSDC) at the Goddard Space <strong>Flight</strong> Center. Subsequently, the science team plans tospend several more months refining the analysis in order to achieve the most precise result possible. The analysisand results will then undergo a careful and critical review by the <strong>GP</strong>-B external Science Advisory Committee(SAC) and other international experts. During the latter part of 2007, the <strong>GP</strong>-B team will also be preparingscientific and engineering papers for publication, as well as working with NASA in planning an announcementof the final results of this unprecedented test of General Relativity.1.4 The Two Einstein EffectsNewton believed that space and time were absolute or fixed entities and that gravity could be represented as anattractive force that somehow acted instantaneously between objects at a distance. In Newton's universe, the spinaxis of a perfect gyroscope orbiting the Earth would remain forever fixed with respect to absolute space. Einsteindetermined that space and time are relative entities, interwoven into a “fabric,” which he called spacetime, and herealized that no force—not even gravity—could act faster than the speed of light. In Einstein's universe, thepresence of celestial bodies causes spacetime to warp or curve; and gravity is the product of bodies moving incurved spacetime (Figure 1-2). Thus, in Einstein’s universe, the spin axis of a perfect gyroscope orbiting theEarth will precess (change its orientation) over time with respect to the distant universe, as it follows the warpingand twisting curvature of spacetime.Figure 1-2. Newton’s flat and fixed space and time (left) vs. Einstein’s warped and twisted spacetime (right)<strong>GP</strong>-B is measuring both the predicted geodetic effect, the amount by which the Earth’s presence is warping itslocal spacetime. Concurrently, and even more important, <strong>GP</strong>-B is measuring the predicted frame-draggingeffect, deduced in 1918 as a corollary to general relativity by Austrian physicists Josef Lense and Hans Thirring,and never before directly measured. It states that massive celestial bodies, like the Earth, drag their local<strong>Gravity</strong> <strong>Probe</strong> B — <strong>Post</strong> <strong>Flight</strong> Analysis • Final <strong>Report</strong> March 2007 5
spacetime around with them as they rotate. This effect of a moving “gravitational charge” is often compared tothe generation of a magnetic field by a moving electric charge, and is often referred to as gravitomagnetism.Physicists and cosmologists are particularly interested in frame-dragging because it may account for theenormous power generation in the most massive and explosive objects in the universe, such as black holes.1.5 Why Perform Another Test of Einstein?While it has become a cornerstone of modern physics, general relativity has remained among the least tested ofall theories in physics, because, as Caltech physicist Kip Thorne once put it: “In the realm of black holes and theuniverse, the language of general relativity is spoken, and it is spoken loudly. But in our tiny solar system, theeffects of general relativity are but whispers.”And so, any measurements of the relativistic effects of gravity around Earth must be carried out with utmostprecision. Over the past 90 years, various tests suggest that Einstein was on the right track. But, in most previoustests, the relativity signals had to be extracted from a significant level of background noise. The purpose of <strong>GP</strong>-Bis to test Einstein's theory by carrying out the experiment in a pristine orbiting laboratory, reducing backgroundnoise to extremely low levels and enabling the experiment to examine general relativity in new ways. If <strong>GP</strong>-B'sresults corroborate the predictions of general relativity, we will have made the most precise measurement of theshape of local space-time, and confirmed the theory of general relativity to a new standard of precision. If on theother hand, the results disagree with Einstein's theoretical predictions, theoretical physicists may be faced withthe challenge of constructing a whole new theory of the structure of the universe and the motion of matter.1.6 Experimental Design & “Near Zeroes”Conceptually, the <strong>GP</strong>-B experiment is simple (Figure 1-3): Place a gyroscope and a telescope in a polar-orbitingsatellite, 642 km (400 mi) above the Earth. (<strong>GP</strong>-B actually uses four gyroscopes for redundancy.) At the start ofthe experiment, align both the telescope and the spin axis of each gyroscope with a distant reference point—aguide star. Keep the telescope aligned with the guide star for a year, and measure the precession change in thespin-axis alignment of each gyro over this period in both the plane of the orbit (the geodetic precession) andorthogonally in the plane of the Earth's rotation (frame-dragging precession).Figure 1-3. The <strong>GP</strong>-B spacecraft in orbit and the two measurements being made with the gyroscopes on-boardThe predicted geodetic gyro-spin-axis precession is a tiny angle of 6, 606 milliarcseconds (0.0018 degrees) in theorbital plane of the spacecraft. The orthogonal frame-dragging precession is a minuscule angle of 39milliarcseconds (1.1x10 -5 degrees)—about the width of a human hair viewed from ¼ mile away, or four feet atthe Earth’s radius. <strong>GP</strong>-B's measurement of the geodetic effect has an expected accuracy of better than 0.01%. Theframe-dragging effect has never directly been measured, but <strong>Gravity</strong> <strong>Probe</strong>-B is expected to determine itsaccuracy to ~1%.6 March 2007 Chapter 1 — Executive Summary
Designing a physics experiment involves a basic choice: maximize the effect to be measured, or minimize the“noise” that obscures it. For the <strong>Gravity</strong> <strong>Probe</strong>-B experiment, that choice was moot because Einstein's relativisticeffects that literally “roar” near black holes whisper almost inaudibly here on earth. Thus, implementing theexperimental design described above required meeting seven near-zero design constraints—three near-zeroconstraints on the gyro rotors, which had to be near-perfect spheres, with uniform superconductive coatings andvirtually no imperfections in shape and density, and four near-zero constraints on the pristine space-borne,cryogenic laboratory, which housed the gyros and shielded them from any sources of noise or interference thatmight distort the results—solar radiation, atmospheric friction, magnetic fields, electro-magnetic signalsradiating from Earth, and so on. Table 1-1 summarizes these seven near-zero constraints, showing the tolerancerequired and the tolerance actually achieved for each one during the mission.Table 1-1. <strong>GP</strong>-B Seven Near ZeroesExperimental Variable Tolerance Requirements Tolerances Achieved During MissionGyroscope Rotor Near ZerosMechanical Sphericity 50 nanometers (2 micro inches)
After years of work and the invention of new technologies and processes for polishing, measuring sphericity, andthin-film coating, the result was a homogenous 1.5-inch sphere of pure fused quartz, polished to within a fewatomic layers of perfectly smooth. In fact, the <strong>GP</strong>-B gyro rotors are now listed in the Guinness Database of WorldRecords as being the roundest objects ever manufactured; they are topped in sphericity only by neutron stars.The spherical rotors are the heart of each <strong>GP</strong>-B gyroscope. The raw quartz material was mined in Brazil, andthen fused (baked) and refined in a proprietary process at Heraeus Amercil in Germany. The interiorcomposition of each gyro rotor is homogeneous to within two parts in a million. On its surface, each gyroscoperotor is less than three ten-millionths of an inch from perfect sphericity. This means that every point on thesurface of the rotor is the exact same distance from the center of the rotor to within 3x10 -7 inches. If a <strong>GP</strong>-Bgyroscope rotor were enlarged to the size of the Earth, its tallest mountain or deepest ocean trench would be lessthan eight feet!Figure 1-4. A <strong>GP</strong>-B niobium-coated gyro rotor and housing (left), the Guinness Database recordfor roundness (center), and measuring the sphericity of a gyro rotor (right)Finally, a <strong>GP</strong>-B gyroscope is freed from any mechanical bearings or supports by levitating the spherical rotorwithin a precisely machined fused-quartz housing cavity. Six electrodes, evenly spaced around the interior of thehousing, keep the rotor levitated in the housing cavity. During the IOC phase of the mission, a stream of purehelium gas was used to spin up each of the four gyroscopes to approximately 4,000 rpm. After that, all but a fewmolecules of the helium spin-up gas was evacuated from the housings, and the gyroscopes were left spinning—amere 32 microns (0.001 inches) from their housing walls, free from any mechanical or fluid supports. During theexperiment, the near-perfectly spherical and homogeneous rotors, combined with the highly sophisticated GyroSuspension System (GSS), resulted in an average spin-down time constant of approximately 15,000 years for thefour <strong>GP</strong>-B gyros.1.7.2 Gyro Suspension System (GSS)The GSS, that electrostatically suspends the science gyroscopes within their housing cavities and enables them tospin freely with minimal friction and torque, is a marvel of engineering in its own right. To perform its missionsuccessfully, the GSS had to satisfy a number of requirements:1. Operate over 8 orders of force magnitude. The same system must be able to suspend the gyroscopes onEarth in a 1 g field as well as generate minimal disturbances at the 10 -8 g level during data collection.2. Suspend or levitate the gyroscopes reliably. The system must never let a spinning rotor touch the housing.There is sufficient mechanical energy in a rotor spinning at 4,000 rpm to effectively destroy the rotor andhousing in such an event.8 March 2007 Chapter 1 — Executive Summary
3. Operate compatibly with the SQUID readout system. The SQUID magnetometers are extremelysensitive. Thus, the suspension system must not interfere with these sensors, both during ground and onorbitoperation.4. Minimize electrostatic torques during science data collection. The suspension system must meetcentering requirements with absolutely minimal control effort, and thereby with minimal residualtorques on the rotors.5. Apply controlled torques to the rotor for calibration and initial rotor spin-axis alignment.6. Act as an accelerometer as part of the “drag-free” translation control system to further minimize classicaltorques on the rotors by another factor of 10 6 .All of these requirements were met during the <strong>GP</strong>-B flight mission. Furthermore, the suspension systemscontinue to operate well following the depletion of helium from the dewar, since they do not require cryogenicelectronics to function.1.7.3 SQUID Magnetometers for Gyro Orientation ReadoutHow can one monitor the spin-axis orientation of a near-perfect spherical gyroscope without any physicalmarker showing the location of the spin axis on the gyro rotor? The answer lies in a property exhibited by somemetals, called “superconductivity.” At temperatures slightly above absolute zero, many metals completely losetheir electrical resistance and become superconductive. Furthermore, as predicted in 1948 by theoreticalphysicist Fritz London, a spinning superconductor develops a magnetic moment—created by the electronslagging the lattice of the superconducting metal—which is therefore exactly aligned with its instantaneous spinaxis.What is wonderful about this phenomenon (and most fortunate for <strong>GP</strong>-B) is that the axis of this magnetic fieldlines up exactly with the physical axis of the spinning metal coating on each rotor. Here was the “marker” <strong>Gravity</strong><strong>Probe</strong> B needed. Each spherical <strong>GP</strong>-B quartz gyroscope rotor is coated with a very thin layer of superconductingniobium (1,270 nanometers thick). When each niobium-coated gyroscope rotor is spinning, a small magneticfield surrounds it. By monitoring the axis of the magnetic field, <strong>Gravity</strong> <strong>Probe</strong> B knows precisely which directionthe gyroscope's spin axis is pointing, relative to its housing. This is one of the many technologies invented anddeveloped specifically for <strong>GP</strong>-B.Figure 1-5. A <strong>GP</strong>-B SQUID module (left) and a diagram of the magnetic pickup loop and London momentThe spinning rotor’s magnetic field axis is monitored with a special type of magnetometer, called a SQUID(Superconducting QUantum Interference Device, shown in Figure 1-5). The SQUID is connected to asuperconducting niobium pickup loop, deposited on the flat surface at the outer edge of one optically flat matingsurface of the quartz housing in which the gyro rotor spins. Thus, the loop, which senses the gyro’s spin-axisorientation, is located on the planar surface where the two halves of the gyro housing are joined. When the spin<strong>Gravity</strong> <strong>Probe</strong> B — <strong>Post</strong> <strong>Flight</strong> Analysis • Final <strong>Report</strong> March 2007 9
axis of a gyroscope rotor changes its orientation, the London moment magnetic field moves with it, passingthrough the superconducting loop. This causes a quantized current to flow in the loop, and the SQUID detectsthis change in magnetic field orientation. The SQUID magnetometers are so sensitive that a field change of only5x10 -14 gauss (one ten-billion th of the Earth's magnetic field) and corresponding to a gyro deflection of 0.1milliarcseconds (3x10 -8 degrees)—is detectable.1.7.4 The Pointing TelescopeA 36 centimeter (14 inch) long Cassegrain reflecting astronomical telescope (Figure 1-6) with a focal length of3.8 meters (12.5 feet), mounted inside the <strong>GP</strong>-B <strong>Probe</strong> along the central axis of the spacecraft and dewar,provided the experiment’s required reference to a distant “guide star.” Any change in spin-axis orientation ofeach of the gyros, as they traveled through the warped and twisted spacetime around the Earth, was measuredagainst this guide star reference to distant spacetime. During the science phase of the mission, the telescope’s job(in conjunction with the ATC) was to keep the entire spacecraft precisely pointed at the center of the guide starwith a pointing deviation in the range of approximately ±200 milliarcseconds (±6x10 -5 degrees).To satisfy these precision pointing requirements, it was necessary to locate the optical center of the guide starimage in the telescope to an accuracy of 0.1 milliarcseconds (3x10 -8 degrees). The diffraction limit size of the<strong>GP</strong>-B telescope is approximately 1.4 arcseconds, which is about 14,000 times larger than the required pointingaccuracy, and this presented a formidable challenge to the <strong>GP</strong>-B team. The solution was to precisely split theimage into equal x-axis and y-axis components, and then to divide each of the axis components into two halfimages whose brightness values could be compared.Figure 1-6. A pre-flight prototype of the <strong>GP</strong>-B telescope and diagram of its image-centering operation<strong>GP</strong>-B accomplished this task by focusing the mirror-reflected starlight onto an Image Divider Assembly (IDA) atthe telescope's front end. In the IDA, the starlight was first passed through a beam-splitter (a half-silveredmirror), that forms two separate images, one for the horizontal (x) axis and one for the vertical (y) axis. The halfbeam from each axis was then focused onto a roof-prism (a prism shaped like a peaked rooftop). Each roofprism sliced its portion of the starlight beam into two half-disks, which were focused onto a pair of silicon photodiodes.The photo diodes converted the light signals from each half-disk to electrical signals which were then compared.If the signals were not equal, the roof-prism was not slicing the image precisely in half. The orientation of theentire spacecraft was then readjusted in real time until the signals were equal and the image was split right downthe middle. When this was accomplished for both the x-axis and y-axis halves of the starlight beam, the telescopewas locked on the exact center of the guide star. Once tuned up, the Attitude and Translation Control (ATC)system on-board the spacecraft was capable of locking the telescope onto the guide star in less than a minuteeach time the spacecraft emerged from behind the Earth over the North Pole and the guide star came into view.Once the telescope was locked onto the guide star, the telescope pointing signals were used to compensate for thesmall pointing deviation to an accuracy of better than 0.1 milliarcseconds (3x10 -8 degrees).10 March 2007 Chapter 1 — Executive Summary
1.7.5 Relating the Guide Star’s Motion to a Distant QuasarIdeally, the telescope would be aligned with a distant quasar, because quasars are so distant from the Earth thatthey appear to be fixed in their relative position and would thus provide an ideal, stable reference point formeasuring changes in gyroscope spin-axis orientation. However, quasars are too dim for any optical telescopethis size to track. So, instead, the telescope was focused on a brighter, nearby guide star whose motion could bemapped relative to quasars separately. As such, the frame of reference of the <strong>Gravity</strong> <strong>Probe</strong> B gyroscopemeasurements will ultimately be related to the far distant universe.In order to precisely map the motion of a guide star relative to a quasar, it was necessary to select a guide star thatwas in the correct position for tracking by the on-board telescope, shines brightly enough for the on-boardtelescope to track accurately, can be tracked by radio telescopes on Earth, and is visually located within a fractionof a degree from a reference quasar. Out of 1,400 stars that were examined, only three matched all the necessarycriteria, and the star that was chosen as the <strong>GP</strong>-B guide star is named IM Pegasi (HR 8703).Thus, throughout the science phase of the mission, the <strong>GP</strong>-B science telescope was tracking a very slowlymoving star, but the gyros were unaffected by the star's so-called “proper motion;” their pointing reference wasIM Pegasi's position in the celestial sphere. Consequently, in the gyro precession data, it is necessary to subtractout the displacement of the original guide-star orientation so that the angular displacements of the gyros can berelated to the guide star’s initial position, rather than to its current position. For this reason, a very accurate mapof the proper motion of IM Pegasi is required in order to complete the <strong>GP</strong>-B data analysis.Figure 1-7. Guide Star IM Pegasi (HR 8703) sky location (left), photo (center) and proper motion (right)Because IM Pegasi is a radio source, its proper motion can be tracked by a sophisticated world-wide network ofradio telescopes, through a technique called Very Long Baseline Interferometry or VLBI. A team at the Harvard-Smithsonian Center for Astrophysics (CfA) led by astrophysicist Irwin Shapiro, in collaboration withastrophysicist Norbert Bartel and others from York University in Canada and French astronomer Jean-FrancoisLestrade, have now mapped the motion of IM Pegasi with respect to a reference quasar over a number of years toan unprecedented level of accuracy. With these measurements the motions of the <strong>GP</strong>-B gyroscope spin axes cannow be precisely ‘related to the reference quasar in the far distant universe.1.7.6 The DewarOne of the greatest technical challenges for <strong>Gravity</strong> <strong>Probe</strong> B was keeping the probe and science instrumentprecisely at a designated cryogenic temperature, just above absolute zero, of approximately 2.3 kelvin (-270.9degrees Celsius or -455.5 degrees Fahrenheit) constantly for 16 months or longer. This was accomplished byintegrating the probe into a special 2,441 liter (645-gallon) dewar, or thermos (Figure 1-8), about the size of amini van, that is filled with liquid helium, cooled to a superfluid state. This nine-foot tall Dewar comprised themain structure of the <strong>GP</strong>-B satellite itself.<strong>Gravity</strong> <strong>Probe</strong> B — <strong>Post</strong> <strong>Flight</strong> Analysis • Final <strong>Report</strong> March 2007 11
Figure 1-8. Clockwise, from top left: The dewar, a cross-section of the dewar, the porous plug, and one thrusterThrough a combination of multi-layer insulation, vapor-cooled shields, and a unique porous plug, the dewar'sinsulating chamber was maintained in a cryogenic vacuum throughout the mission. While virtually no heatcould penetrate from the outside wall through the vacuum and multi-layer insulation inside, a small amount ofheat was continually conducted from the neck of the Dewar and from the heat-trapping windows inside theprobe into the superfluid helium inside the dewar chamber. This very slight, but continual warming caused thesuperfluid helium to slowly vaporize into helium gas, which needed to be vented continually from the dewarchamber through the porous plug.Invented at <strong>Stanford</strong>, and engineered for space at the NASA Marshall Space <strong>Flight</strong> Center, Ball Aerospace, andthe Jet Propulsion Laboratory, the porous plug controls the flow of this evaporating helium gas, allowing it toescape from the Dewar, but retaining the superfluid helium inside. The plug is made of powdered titanium thathas been sintered (heated) until it coalesces into a sponge-like pumice with very tiny pores. The evaporatinghelium gas climbed the side of the dewar near the plug and collected on the plug’s surface, where it evaporatedthrough the pores in the plug, much like sweating in the human body, drawing heat out of the liquid heliumremaining in the Dewar, and thereby balancing the heat flow into the Dewar. The helium gas continuallyescaping through the porous plug was cycled past the shields in the outer layers of the Dewar, cooling them (thusthe name, “vapor-cooled shields.”) Moreover, it then was used as the propellant for eight pairs of micro thrusters,strategically located at the extremities of the spacecraft and used by the Attitude and Translation Control system(ATC) for high-precision pointing and positional control. Thus, not only did the dewar serve as the means ofmaintaining a cryogenic environment for the experiment, it was also the sole source of propellant for the ATCsystem.12 March 2007 Chapter 1 — Executive Summary
1.7.7 Spacecraft Control—Nine Degrees of Freedom<strong>GP</strong>-B is the first spacecraft ever launched requiring six degrees of freedom in active attitude control—threedegrees of freedom in pointing control to maintain its guide-star pointing orientation (pitch and yaw) plus itsconstant roll rate, and three degrees of freedom in translational control (up-down, front-to-back, and side-toside),to maintain a drag-free orbit throughout the 17-month flight mission. In addition, the Gyro SuspensionSystem (GSS) for each gyroscope required three degrees of freedom in controlling the location of the sphericalrotor within its housing. Thus, in total, the <strong>GP</strong>-B experiment required nine degrees of freedom for controllingthe spacecraft—a truly demanding and remarkable accomplishment.The term “drag-free” refers to a body that is moving without any friction or drag, and thus its motion is affectedonly by gravity. A drag-free satellite refers to a feedback system consisting of a satellite within a satellite. Theinner satellite, often called a proof-mass, is typically a small homogeneous object, such as a spherical <strong>GP</strong>-Bgyroscope, totally shielded from air drag and solar pressure. The position of the outer shielding satellite must betightly controlled to prevent it from ever touching the proof mass. This is accomplished by equipping the outersatellite with sensors that precisely measure its position relative to the proof mass and a set of thrusters thatautomatically control its position, based on feedback from the sensors. Through this feedback system, thesatellite continually “chases” the proof-mass, always adjusting its position so that the satellite remains centeredabout the proof mass, which is orbiting the Earth in a constant state of free fall—i.e, a purely gravitational orbit.In the <strong>GP</strong>-B spacecraft, the drag-free feedback system was based on data from the Gyro Suspension System(GSS) for the science gyro that was serving as the drag-free proof mass. Based on this feedback, the ATC systemmetered the flow of the escaping helium gas through the 16 micro-thrusters in order to precisely control thespacecraft's position. In fact, the location of the entire spacecraft was continually balanced around the proofmassgyroscope by increasing or decreasing the flow of helium through opposing thrusters, to maintain a dragfreeorbit.The drag-free feature of the <strong>GP</strong>-B spacecraft was critically important to the experiment becauseexternal drag on the spacecraft would otherwise cause an acceleration that would obscure the minusculerelativistic gyro precessions being measured.<strong>GP</strong>-B’s ATC system, designed by Lockheed Martin, was truly an engineering “tour-de-force.” It took aconsiderable amount of time during the 4-month Initialization and Orbit Checkout (IOC) phase of the missionand part of the science phase of the mission for the <strong>GP</strong>-B and Lockheed Martin Mission Operations Team tomaster all the subtleties of this complex system.1.8 The Management Experiment<strong>GP</strong>-B was not a packaged experiment carried into orbit by a space-cargo vehicle. Rather, the <strong>GP</strong>-B spacecraft wasa total system, comprising both the space vehicle and its unique payload—an integrated system dedicated as asingle entity to making the measurements of unprecedented precision required by the experiment. Toaccomplish this goal, it was crucial that the whole system be developed by a strong and cohesive team.In 1984, <strong>GP</strong>-B began the transition from program definition to payload and spacecraft design. Francis Everitthad become Principal Investigator in 1981, and with the anticipated increase in staff and activity required fordesign and development, he recruited Bradford Parkinson to join <strong>GP</strong>-B as Program Manager and also as a Co-PI, along with Co-PI's John Turneaure (Physics) and Dan DeBra (Aero-Astro). At that time, <strong>GP</strong>-B was defined asa two-phase Space Shuttle mission: first, a technology readiness demonstration (STORE—Shuttle Test of theRelativity Experiment) to be launched in 1989, followed two years later by the actual experiment, a satellite to belaunched from a polar-orbiting Shuttle. For a number of reasons including the interdependency of the payloadand spacecraft and the high level of technology development required, Samuel Keller, then Deputy Director ofthe NASA Office of Space Science Applications, decided to make <strong>Stanford</strong> NASA's prime contractor on the <strong>GP</strong>-B mission. James Beggs, then the NASA Administrator, concurred with this decision and remarked that inaddition to being a physics experiment that needed to be carried out in space, <strong>GP</strong>-B was equally interesting as a<strong>Gravity</strong> <strong>Probe</strong> B — <strong>Post</strong> <strong>Flight</strong> Analysis • Final <strong>Report</strong> March 2007 13
“management experiment.” This was one of the first, and largest NASA missions, in which a university was giventhe prime role of managing the development of an entire space flight mission—science instrument, spacecraft,operations and data analysis.Following the Challenger disaster in 1986 and the subsequent closure of NASA's West Coast, polar-orbitingshuttle launch facility, it became necessary to re-cast the <strong>GP</strong>-B mission as a satellite to be launched from its ownexpendable rocket. From 1992-1994, <strong>Stanford</strong> conducted a thorough source selection process from which LMSCwas chosen to build the space vehicle into which the dewar and probe would be integrated. During the ensuingyears, <strong>Stanford</strong> led the combined team, with oversight from NASA's Marshall Space <strong>Flight</strong> Center (MSFC), indeveloping and perfecting each of the components of the payload and spacecraft.In the late 1990s, it was time to transition <strong>GP</strong>-B from a research and development program with limited NASAoversight to a classical NASA flight program that would culminate in the complete integration and testing of thepayload-spacecraft system, followed by a successful launch, on-orbit operations, and subsequent data analysis.This shift in focus from maximizing advances in research and development to minimizing the risks in producinga flight-ready spacecraft was a difficult transition for <strong>GP</strong>-B. It took the exceptional insight and leadership of RexGeveden, then NASA's <strong>GP</strong>-B Program Manager at MSFC (now Associate Administrator at NASAHeadquarters), in collaboration with Principal Investigator Francis Everitt and other senior management at<strong>Stanford</strong>, LMSC, and NASA to arrive at an effective, minimum-risk-based management plan that would readythe <strong>GP</strong>-B spacecraft, payload and operations team for the flight mission.Given the success of the <strong>GP</strong>-B launch and 17.3-month flight mission, the management experiment was also asuccess. It showed that a university, in close partnership with NASA and an experienced aerospace subcontractor,can effectively develop and operate a sophisticated integrated satellite, and it provided NASA withinvaluable management insights for future missions.1.9 The <strong>GP</strong>-B SpacecraftAll of the <strong>Gravity</strong> <strong>Probe</strong> B technologies were integrated into one of the most elegant satellites ever launched(Figure 1-9). The spacecraft was built around the dewar. Embedded along the dewar’s central axis was a cigarshapedcanister called the <strong>Probe</strong> which contained a series of heat-absorbing windows, a helium-adsorbingcryopump, and the Science Instrument Assembly (SIA)—the pristine space-borne laboratory for making the<strong>GP</strong>-B experimental measurements.The SIA comprised the telescope and the quartz block, optically bonded together. The quartz block contains thefour gyros and SQUIDs that monitor the spin-axis orientations of the gyros. The telescope and all four gyroswere precisely aligned along the long, central axis of the spacecraft, around which the spacecraft rolledcontinuously at 0.77 rpm (77.5 seconds per revolution) throughout the science phase of the mission.14 March 2007 Chapter 1 — Executive Summary
Figure 1-9. The <strong>GP</strong>-B spacecraft and its main payload componentsOutside the dewar, mounted to the spacecraft frame are all the systems that provide power, navigation,communication and control of the spacecraft, including:Sun Shield. This is a conical tube, attached to the probe, that kept stray light from entering the telescope.Proportional Micro Thrusters. Eight pairs of balanced, proportional thrusters provided very precise attitudeand position control in orbit during the flight mission. (Now that the helium is exhausted from the dewar, thesemicro thrusters are no longer functional, and only a set of magnetic torque rods control the spacecraft’s attitude,with much less precision than the thrusters provided.)Solar Arrays. These four arrays convert energy from the Sun into electrical power that is stored in thespacecraft’s two batteries and then used to run the various electrical systems on board. Because the orbit plane ofthe <strong>GP</strong>-B spacecraft always contained the guide star, the position of each solar array was precisely canted tomaximize the power output as the spacecraft rolled and changed position with respect to the Sun over the courseof the mission.<strong>GP</strong>S Sensors & Antennae. Four <strong>GP</strong>S (Global Positioning System) antennas on-board the spacecraft—two at theforward end of the spacecraft and two at the aft end—transmit information about both the spacecraft’s positionand its attitude.Telemetry & Communications Antennae. These fore and aft antennae enable both inbound and outboundcommunications with the space vehicle, including communications with ground stations and with orbitingcommunications satellites in the Tracking Data Relay Satellite System (TDRSS).Two Star Trackers. Basically, these are telescopes with cameras and pattern-matching systems that useconstellations and stars to determine the direction in which the satellite is pointing. During the mission the startrackers functioned like “spotting scopes” for the science telescope. Once the star trackers had oriented thespacecraft within 60 arcseconds (0.017 degrees) of the guide star, the telescope took over the job of achieving andmaintaining the precise alignment required for measuring gyroscope precession.<strong>Gravity</strong> <strong>Probe</strong> B — <strong>Post</strong> <strong>Flight</strong> Analysis • Final <strong>Report</strong> March 2007 15
Attitude-Control Gyroscopes. Two pairs of standard, flight-qualified rate-sensing gyroscopes, equivalent tothose found on other spacecraft (and also airplanes, ships, and other vehicles) were included as part of thegeneral navigation system used for monitoring the orientation of the spacecraft.Electro-mechanical Control Systems. Surrounding the dewar, a lattice of trusses forms the outer structure ofthe spacecraft. Attached to these trusses are a number of electrical and mechanical systems that control theoperation of the spacecraft and enabled the relativistic measurements to be carried out. These control systemsinclude the following:• Attitude & Translation Control System (ATC)—Uses feedback from the gyro suspension system (GSS),the SQUID readout system (SRE), the telescope readout system (TRE), the star trackers, magnetometers,and rate-sensing navigational gyroscopes to control the proportional micro thrusters and magnetictorque rods that determine and maintain the spacecraft’s precise attitude and position relative to one ofthe science gyro rotors that serves as the drag-free proof mass.• Magnetic Torquing System (MTS)—A set of long electromagnets that push or pull against the Earth’smagnetic field to orient the spacecraft’s attitude.• Mass Trim Mechanism (MTM)—A system of movable weights that can be adjusted during flight torestore precise rotational balance of the space vehicle (similar to spin balancing the tires on anautomobile)• Gyro Suspension System (GSS)—The electronics that levitate and precisely control the suspension of thefour gyroscopes at the heart of the <strong>Gravity</strong> <strong>Probe</strong> B experiment.• Gas Management Assembly (GMA)—A very complex set of valves, pipes, and tubing that was used tospin up each of the four gyroscopes by blowing a stream of 99.99999% pure helium gas over them,through a channel built into one half of each gyroscope’s quartz housing. (Subsequently, all but a fewmolecules of the helium gas were removed from each housing; the gyro rotors spun in a near-perfectvacuum.)• Experiment Control Unit (ECU)—The ECU controls many of the systems on-board the space vehicle,including the GMA, the ultraviolet light system used to remove electrostatic charge from the gyro rotors,and various thermal devices.1.10 On-Orbit OperationsWith a typical spacecraft, the mission operations team spends a considerable amount of time after launchlearning how the spacecraft behaves and responds. Once the team has become comfortable operating thevehicle, the more sophisticated experimental operations are then attempted. In contrast, <strong>GP</strong>-B required that anumber of very complex operations be carried out during the Initialization and Orbit Checkout (IOC) missionphase immediately following launch, because the dewar's lifetime was limited to approximately 16-17 monthsand a year's worth of experimental data had to be collected while there was still liquid helium in the dewar. Withall of the unique features and cutting-edge technologies embodied in the <strong>GP</strong>-B spacecraft, it became apparentearly on that the <strong>GP</strong>-B mission operations team would have to “hit the ground running.” To accomplish this goal,a sophisticated mission operations plan was created. Detailed procedures with contingencies, were developed,and the <strong>GP</strong>-B mission operations team went through rigorous training. One of the hallmarks of the <strong>GP</strong>-Bmission operations team was “test it as you fly it, and fly it as you test it.” This meant that all of the ground testsoftware and procedures used were essentially the same as those used in flight. The <strong>GP</strong>-B team also workedthrough a number of pre-launch simulations, with the test program being based on expected mission operations.Thus, by the time of launch, the team was already well-rehearsed and ready to tackle real issues and anomalies.16 March 2007 Chapter 1 — Executive Summary
Launch operations proceeded like clockwork, with virtually perfect orbit insertion. The team then immediatelyset to work performing IOC initialization and checkout procedures. Activities during the IOC phase includedtuning the ATC system to set the spacecraft’s roll rate, capturing the guide star at the top of each orbit in less thanone minute, and establishing and maintaining drag-free control. In addition, it was necessary to balance thespacecraft about its center of mass by adjusting the Mass Trim Mechanisms on the spacecraft frame and touniformly wrap the helium bubble inside the dewar by briefly increasing the spacecraft’s roll rate.However, the most delicate and painstaking operations concerned the four science gyros, for which there wereno precedents in any other space mission. First, the gyro suspension system had to be checked out and calibratedfor each of the four gyros. Then, the gyros were spun-up, one by one, by blowing a stream of pure helium gasthrough a spin-up channel in each rotor housing. The spin-up was accomplished gradually, in three stages thatlasted over a month, ultimately resulting in the final gyro spin rates averaging 4,000 rpm. The spin-up operationswere among the most stressful and risky of the entire mission. Following gyro spin-up, it was necessary to “bakeout” excess helium molecules remaining in the <strong>Probe</strong> from the spin-up gas. It was then necessary to align thespin axis of each gyro with the guide star—another set of painstaking procedures.Finally, gyro #3 was designatedas the “proof mass” to be used by the ATC system to maintain the spacecraft in a drag-free orbit. At last, onAugust 28, 2004, the spacecraft and payload were ready to begin collecting science data.Figure 1-10. The <strong>GP</strong>-B Mission Operations Center (MOC) during gyro spin-up (left) and end of helium (right)The IOC phase was followed by an 11 month science-data-taking phase. In comparison to IOC, this period wasrelatively straightforward and routine. By the start of the science phase, the team was very well trained; eachteam member knew well his or her responsibilities, thus further easing the effort. Moreover, while most dayswere uneventful, an “all-hands” meeting was held every day to ensure that the team remained focused on thestatus of the total system—spacecraft and payload. The all-important science data were transmitted to theground four times a day. The engineering and science teams reviewed the data on a daily basis and provided toplevelfeedback on the previous day's data at the daily meeting.The science mission concluded with a 6-week instrument calibration phase. The purpose of this phase was tohelp evaluate sources of systematic experiment error and to allow the team to place limits on possible gyroscopetorques. Although many operations were performed during this period, the implementation was performednearly flawlessly.Ever since the launch of the spacecraft in April 2004, the Mission Operations Center (MOC) at <strong>Stanford</strong>(Figure 1-10) was the lifeline to the spacecraft. Mission operations personnel in the MOC were always focusedon the current vehicle status. Typically, the vehicle would be “green” and the MOC would verify this status with areal-time monitoring system. In a typical “green” day, the daily 10 am “all-hands” meeting would inform theteam of the previous day's events and planned future operations. Following the all-hands meeting, missionplanners would meet with subsystem specialists to develop the detailed plan for the next day. In practice, muchof the planning already had been developed long before, and only rearrangement of the order of tasks wasrequired. When new products were required, the Integrated Test Facility (ITF), a ground-based computerizedmodel of all systems on-board the <strong>GP</strong>-B spacecraft, was used for verification prior to use on the vehicle.<strong>Gravity</strong> <strong>Probe</strong> B — <strong>Post</strong> <strong>Flight</strong> Analysis • Final <strong>Report</strong> March 2007 17
Any significant deviation from “green” would immediately “trump” other program activities. An efficientelectronic communication-information system allowed for rapid response. Telemetry information from theMOC, as well as information determined from off-line analysis, were in near-constant review. Deviations from a“green” or expected result would cause the immediate initiation of an in-house anomaly resolution process,described in the next section.By the end of mission, the <strong>GP</strong>-B team had become very skilled at both operating the spacecraft and handlinganomalies. Thus, there was some sadness—as well as the thrill of accomplishment—when the mission ended andmembers of this truly remarkable mission operations team moved on to new jobs and other missions in theircareers.Figure 1-11. NASA <strong>GP</strong>-B Program Manager, Tony Lyons, from the Marshall Space <strong>Flight</strong> Center in Huntsville, AL,presents a NASA Group Achievement Award to the entire <strong>GP</strong>-B team in November 2005.At the end of November 2005, shortly after the successful completion of the <strong>GP</strong>-B flight mission, NASA’s <strong>GP</strong>-BProgram Manager, Tony Lyons from the Marshall Space <strong>Flight</strong> Center, presented a NASA Group AchievementAward to the entire <strong>GP</strong>-B science mission team, including, of course, people from both <strong>Stanford</strong> and LockheedMartin (Figure 1-11). The award reads: “For exceptional dedication and highly innovative scientific andengineering accomplishments leading to the successful execution and completion of the <strong>Gravity</strong> <strong>Probe</strong> B ScienceMission.” The award is signed by NASA Administrator Michael Griffin, and an individual citation was given toeach and every member of the team.1.11 Anomaly ResolutionIn space missions, there are always some problematic events—both anticipated and unexpected. The <strong>GP</strong>-Bmission was no exception. We call these surprising events “observations” and “anomalies.” An important part ofthe pre-launch preparation for the mission was to set up a formal anomaly review process, including proceduresfor assembling a quick-response anomaly team at any time—day or night—to work through the anomaly,determine the root cause, and come up with a procedure for addressing the issues and returning the spacecraft tonominal operating mode.A special room in the <strong>GP</strong>-B Mission Operations, called the Anomaly Room (Figure 1-12), was the home of the<strong>GP</strong>-B Anomaly Review Board (ARB), a select group of senior <strong>GP</strong>-B team members from <strong>Stanford</strong>, NASA, andLockheed Martin, who managed the troubleshooting of anomalies and observations. The Anomaly Room,which was located across the corridor from the <strong>GP</strong>-B MOC, contained a set of spacecraft status monitors,communications and teleconference equipment, computer and voice hookups, a documentation library, whiteboards, a computer projection system, and an oval discussion table.18 March 2007 Chapter 1 — Executive Summary
Figure 1-12. The <strong>GP</strong>-B Anomaly Room in actionDuring the flight mission, whenever an anomaly was in the process of being resolved, the Anomaly Room wasstaffed 24 hours a day, 7 days a week; at other times, it was staffed during normal working hours, with teammembers on call. When major anomalous events, such as computer reboots, occurred outside normal workinghours, the Mission Director on duty activated the Anomaly Room and issued a series of pager and cell phonecalls via computer, summoning key staff members on the ARB, along with a selected anomaly team, comprisedof resident engineers and engineering specialists, to come in and work through the issue. The group used atechnique called “fault tree analysis” to evaluate and determine the root cause of unexpected events.The first anomaly in orbit occurred just two weeks into the mission at around 3:00 AM, when stray protons froma solar flare struck multiple critical memory cells in the main on-board flight computer, causing an automaticswitch-over to the backup computer. The <strong>GP</strong>-B anomaly team was assembled by 4:30 AM that morning—within90 minutes of the event—and they immediately began taking corrective action.Over the course of the flight mission, the ARB successfully worked through 193 observations/anomalies. Ofthese, 23 were classified at true “anomalies,” five of which were sub-classified as “major anomalies,” including theB-Side computer switch-over and the stuck-open valve problems with two micro thrusters early in the mission,as well as subsequent computer and subsystem reboot problems due to radiation strikes. Of the remaining 18anomalies, 12 were sub-classified as “medium anomalies” and 6 were sub-classified as “minor anomalies.”The 170 other issues (88%) were classified—at least initially—as “observations.” These observations typicallydocumented various unanticipated events, sub-optimal parameter settings, and other unusual results that weremonitored until their root cause was understood. In several cases, observations were escalated to anomaly status,and then necessary actions were taken first to understand, and then to correct the problem. In all cases, theestablished anomaly resolution process enabled the team to identify the root causes and provide procedures thatled to recovery.Anomalies on orbit did cause some disruptions in the data collection. Methods of treating these had beenidentified prior to launch and are currently being systematically addressed in the data analysis.1.12 Managing Program RisksThrough mission development, <strong>GP</strong>-B instituted a high-visibility risk steering committee, which programmanagement used to evaluate and set overall program priorities. Risk groups met on a monthly basis; both<strong>Stanford</strong> and MSFC had independent risk evaluation teams, using different processes, that met regularly to sharetheir assessments.Hardware risks were evaluated on the basis of probability of occurrence, as well as the impact of potential failure,using a complete Failure Modes and Effects Analysis (FMEA) process. Other program risks (e.g., budget,schedule and personnel) were evaluated using a similar method. The committees solicited advice fromindependent councils of experts to ensure that our evaluations were correct. Five categories of risk were<strong>Gravity</strong> <strong>Probe</strong> B — <strong>Post</strong> <strong>Flight</strong> Analysis • Final <strong>Report</strong> March 2007 19
established, ranging from Level 1 (not likely, little cost or critical path impact, and no compromise in missionperformance) to Level 5 (Nearly certain likelihood, very large program cost and critical path impact and loss ofmission).Based on potential impact to the program, each risk was evaluated using a table of risk levels and consequencesas a guideline. The risk action was then assigned to one of three categories:• Mitigate. Eliminate or reduce the risk by reducing the impact, reducing the probability or shifting thetime frame.• Watch. Monitor the risks and their attributes for early warning of critical changes in impact, probability,time frame, or other aspects.• Accept. Do nothing. The risk will be handled as a problem if it occurs. No further resources are expendedmanaging the risk.Risks were promoted or demoted as program needs or technical understanding evolved. This risk mitigationprocess was an exceptionally good example of the complementary skills of the MSFC and <strong>Stanford</strong>-Lockheedteams, as borne out by the success of the mission.1.13 A Successful MissionManaging a flight program such as <strong>GP</strong>-B, in which the spacecraft contained only a single, highly integratedpayload proved to be a challenge for NASA, its government overseers, <strong>Stanford</strong> University as NASA’s primecontractor, and <strong>Stanford</strong>’s subcontractor, Lockheed Martin—so much so that in 1984, the then NASAAdministrator, James Beggs, remarked that <strong>GP</strong>-B was not only a fascinating physics experiment, but also afascinating management experiment. NASA thoroughly addressed these challenges, and the many years ofplanning, inventing, designing, developing, testing, training and rehearsing paid off handsomely for <strong>GP</strong>-B,culminating in a highly successful flight mission.Beginning with a picture-perfect launch, bull’s-eye orbit insertion, and breath-taking live video of spacecraftseparation, the mission got off to a flawless start. The preparedness of the <strong>GP</strong>-B mission operations teamimmediately became evident in its deft handling of two major anomalies that occurred within the first month ofthe mission—the automatic switch-over from the main to the backup flight computer due to proton strikesinduced by solar flares and two micro thrusters that had to be isolated due to stuck-open valves. In both cases,the team’s knowledge and well-coordinated responses resulted in efficient mitigation of the problems and timelyrestoration of nominal spacecraft operations. Furthermore, the experience of working through major anomaliesearly in the mission provided invaluable experience that enabled the team to handle similar anomalies duringthe science phase of the mission with even more efficiency.<strong>GP</strong>-B is arguably one of the most sophisticated spacecraft ever flown. It incorporated many new technologies—most notably the gyros, their suspension systems, the accompanying SQUID readouts, and the precisionpointingof the spacecraft-fixed telescope—whose debut performance in space occurred during this mission. It isremarkable, and a testament to the preparation, talent, knowledge and skill of the <strong>Stanford</strong>-NASA-LockheedMartin development team, that all of these technologies performed exceedingly well on orbit, with some, such asthe GSS and SQUID readouts, far exceeding their required performance specifications. Likewise, the <strong>GP</strong>-Bmission operations team was one of the best ever assembled. During IOC, even the most difficult and riskyoperations, including gyro spin-up, low-temperature bakeout of the excess helium gas, and gyro spin-axisalignment all proceeded smoothly. The one system that required considerable fine-tuning well into the sciencephase of the mission was the Attitude and Translation Control (ATC) system. Due in large part to solarenvironment sensitivity of the external Attitude Reference Platform (ARP), on which the ATC’s star trackerswere mounted, parameters in the ATC system had to be seasonally adjusted in order for the spacecraft’s requiredprecision pointing to be maintained. By April 2005, all of the issues with the ATC had been identified andaddressed, and from that time forward, the ATC system performance was quite good.20 March 2007 Chapter 1 — Executive Summary
By the end of IOC in August 2004, <strong>GP</strong>-B team members had a masterful command and knowledge of thespacecraft’s systems and its nuances, and they were well-primed to handle any situation or anomaly that mightoccur during the ensuing science (data collection) and instrument calibration phases. As it turned out, thehelium in the dewar lasted 17 months and 9 days—a month longer than had been anticipated through numeroushelium lifetime tests performed throughout the mission by the dewar team. This made it possible to collectscience data for 50 weeks, just 14 days shy of the one-year data collection goal, and this was of great benefit to the<strong>GP</strong>-B science team. In fact the helium lasted long enough for the team to perform many extra calibration testsfollowing the science data collection phase.During the months after the flight mission, the team performed several feasibility tests of possible post-missionexperiments, and then they readied the spacecraft for a hibernation state, from which it can be awakened at anytime, in the event that there is interest and funding for post-mission experiments or uses of the spacecraft. (Thespacecraft can remain functional in orbit for another ten years or more.)Following is a list of some of the extraordinary accomplishments achieved by <strong>GP</strong>-B during the 17 months of itsflight mission.• Over the course of the 17.3-month mission, we communicated with the spacecraft over 4,000 times, andthe Mission Planning team successfully transmitted over 106,000 commands to the spacecraft.• <strong>GP</strong>-B is the first spacecraft ever to achieve nine degrees of freedom in control. The spacecraft itselfmaintained three degrees of freedom in attitude control (pitch, yaw, and roll), plus three degrees offreedom in translational drag-free control (front-to-back, side-to-side, and up-down). In addition, theGyro Suspension System (GSS) for each gyro maintained three degrees of freedom in controlling thelocation of its spherical rotor within the gyro housing.• The <strong>GP</strong>-B gyros, which performed extraordinarily well in orbit, have been listed in the GuinnessDatabase of World Records as being the roundest objects ever manufactured.• The spin-down rates of all four gyros were considerably better than expected. <strong>GP</strong>-B’s conservativerequirement was a characteristic spin-down period (time required to slow down to ~37% of its initialspeed) of 2,300 years. Measurements during IOC showed that the average characteristic spin-downperiod of the <strong>GP</strong>-B gyros was approximately 15,000 years—well beyond the requirement.• The magnetic field surrounding the gyros and SQUIDs (Super-conducting QUantum InterferenceDevice) was reduced to 10 -7 gauss, less than one millionth of the Earth’s magnetic field—the lowest everachieved in space.• The gyro readout measurements from the SQUID magnetometers had unprecedented precision,detecting fields to 10 -13 gauss, less than one trillionth of the strength of Earth’s magnetic field.• The gyro suspension system operated magnificently. It had to be able to operate both on the ground fortesting purposes prior to launch, as well as in space. This meant that the suspension system had tooperate over 11 orders of magnitude—an enormous dynamic control range—and its performancethroughout the mission was outstanding.• The science telescope on board the spacecraft tracked the guide star, IM Pegasi (HR 8703), to superbaccuracy, and it also collected a year’s worth of brightness data on that star. The brightness data wecollected on IM Pegasi represents the most continuous data ever collected on any star in the universe.• In November 2005, the entire <strong>GP</strong>-B team was awarded a NASA Group Achievement Award “Forexceptional dedication and highly innovative scientific and engineering accomplishments leading to thesuccessful execution and completion of the <strong>Gravity</strong> <strong>Probe</strong> B Science Mission.”<strong>Gravity</strong> <strong>Probe</strong> B — <strong>Post</strong> <strong>Flight</strong> Analysis • Final <strong>Report</strong> March 2007 21
1.14 The Broader Legacy of <strong>GP</strong>-BAt least a dozen new technologies had to be invented and perfected to carry out this experiment. For example,the spherical gyros, at 10 -8 g, are better than ten million times more accurate than the best navigational gyros.The ping-pong-ball-sized rotors in these gyros had to be so perfectly spherical and homogeneous that it tookmore than 10 years and a whole new set of manufacturing techniques to produce them. They're now listed in theGuinness Database of Records as the world's roundest man-made objects. The SQUIDs are so sensitive that theycan digitally detect a gyro tilt of 0.1 milliarcseconds (3x10 -8 degrees).Over its 40+ year life span, spin-offs from the <strong>GP</strong>-B program have yielded many technological, commercial, andsocial benefits. For example, <strong>GP</strong>-B's porous plug for controlling helium in space was essential to several othervital NASA missions, including IRAS (Infrared Astronomical Satellite) and COBE (COsmic BackgroundExplorer). Most important, <strong>GP</strong>-B has had a profound effect on the lives and careers of numerous faculty andstudents—graduate, undergraduate and high school—including 79 Ph.D. dissertations at <strong>Stanford</strong> and 13elsewhere. <strong>GP</strong>-B alumni include the first U. S. woman astronaut, an aerospace CEO, and a Nobel laureate.Figure 1-13. <strong>Stanford</strong> <strong>GP</strong>-B/<strong>GP</strong>S graduate students and a faculty member pose next to a <strong>GP</strong>S-controlled tractor(left); Clark Cohen and Brad Parkinson receive awards from the Space Technology Hall of FameOne interesting <strong>GP</strong>-B spin-off story is automated precision farming. Under the supervision of <strong>GP</strong>-B Co-PI BradParkinson, centimeter-accurate Global Positioning Satellite (<strong>GP</strong>S) technology, originally developed for attitudecontrol of the <strong>GP</strong>-B spacecraft, was re-purposed for other automated guidance and control applications in theearly 1990’s by Clark Cohen and a group of his fellow <strong>GP</strong>-B/<strong>GP</strong>S graduate students at <strong>Stanford</strong>. After receivinghis Ph.D., Cohen founded a company, now Novariant Corporation, to develop precision <strong>GP</strong>S guidance andcontrol applications, such as an automatic aircraft landing system and automated precision farming. In May2006, Novariant’s Autofarm technology was inducted into the Space Technology Hall of Fame, and individualawards were given to Cohen and several colleagues at Novariant, along with Parkinson and <strong>Stanford</strong>’s <strong>GP</strong>-B andHansen Experimental Physics Lab (HEPL) for their role in supporting this technology development.22 March 2007 Chapter 1 — Executive Summary
2Overview of the <strong>GP</strong>-B Experiment & Mission<strong>Gravity</strong> <strong>Probe</strong> B — <strong>Post</strong> <strong>Flight</strong> Analysis • Final <strong>Report</strong> March 2007 23
24 March 2007 Chapter 2 — Overview of the <strong>GP</strong>-B Experiment & Mission
This chapter provides an overview of the <strong>Gravity</strong> <strong>Probe</strong> B experiment, the spacecraft and its associatedtechnologies, a description of the mission and mission phases, including a summary and discussion of theactivities, issues, and accomplishments that took place during the Initialization and Orbit Checkout (IOC),Science (data collection), and Instrument Calibration phases of the mission.2.1 <strong>Gravity</strong> <strong>Probe</strong> B in a NutshellThe <strong>Gravity</strong> <strong>Probe</strong> B (<strong>GP</strong>-B) mission is a physics experiment that uses four spherical gyroscopes and a telescope,housed in a satellite orbiting 642 km (400 mi) above the Earth, to measure, with unprecedented accuracy, twoextraordinary effects predicted by Albert Einstein’s general theory of relativity—our present theory ofgravitation. The first measurement is the geodetic effect—the amount by which the Earth warps the localspacetime in which it resides. The other effect, called frame-dragging, is the amount by which the rotating Earthdrags local spacetime around with it. The <strong>GP</strong>-B experiment tests these two effects by precisely measuring thedrift angles of the spin axes of the four gyros over the course of a year and comparing these experimental resultswith predictions from Einstein’s theory.2.1.1 A Brief History of <strong>GP</strong>-BThe idea of testing general relativity by means of orbiting gyroscopes was suggested independently by twophysicists, George Pugh and Leonard Schiff, in late 1959-early 1960. Pugh’s Proposal for a Satellite Test of the CoriolisPrediction of General Relativity appeared in an unusual location: the U.S. Department of Defense Weapons SystemsEvaluation Group (WSEG) Memo #11 (November, 12, 1959). Schiff ’s Possible New Experimental Test of GeneralRelativity Theory was published in the March 1, 1960 issue of Physical Review Letters. For an historical review andcomparison, see C. W. F. Everitt: The <strong>Stanford</strong> Relativity Gyroscope Experiment (A): History and Overview, in Near Zero:New Frontiers of Physics, ed. J. D. Fairbank et. al., New York, W. H. Freeman, 1988.Schiff, then chairman of the <strong>Stanford</strong> University Physics Department, discussed his developing ideas with twophysics department colleagues, Professors William Little and William Fairbank, both low-temperaturephysicists. Fairbank, in turn, had an exchange with Professor Robert Cannon, who like Fairbank had justarrived at <strong>Stanford</strong>. Cannon had considerable experience with state-of-the-art gyroscopes, and he had come to<strong>Stanford</strong> to create a Guidance and Control Laboratory in the Department of Aeronautics & Astronautics. Therefollowed an amusing and much publicized three-way meeting between Fairbank, Cannon and Schiff at the nowno-longer-existingswimming pool in the <strong>Stanford</strong> Men’s Gymnasium. Thus began the essential collaborationbetween the Physics and Aero-Astro departments which has been fundamental to the success of <strong>GP</strong>-B.Schiff ’s more extended paper, entitled Motion of a Gyroscope According to Einstein's Theory of Gravitation was thenpublished in the June 15, 1960 issue of the Proceedings of the National Academy of Sciences (Volume 46, Number6, pp. 871-882). Pugh’s too-little-known article was finally published in Nonlinear Gravitodynamics: The Lense-Thirring Effect, ed. R. Ruffini and C. Sigsmondi, Singapore, World Scientific, 2003. An important feature ofPugh’s paper was that it contained the first proposal and analysis of the concept of a drag-free satellite.During the startup period of <strong>GP</strong>-B, at the 1961 meeting of the International Union of Theoretical and AppliedMechanics, Cannon presented the first engineering paper describing the planned orbital experiment:Requirements & Design for a Special Gyro for Measuring General Relativity Effects from an Astronomical Satellite, published inKreiselprobleme Gyrodynamics, Symposium Celerina, August, 1962, ed. H. Ziegler, Berlin, Springer-Verlag.Copies of all the papers mentioned in this section, plus other historical <strong>GP</strong>-B papers, are available in AdobeAcrobat PDF format on the Web at: http://einstein.stanford.edu/content/sci_papers/origins.html.It is worth noting that earlier theoretical discussions of gyroscope tests of general relativity were given in the1920’s by J. A. Schouten and A. S. Eddington. In the 1930’s, P. M. S. Blackett investigated the possibility of aground-based experiment, concluding correctly that it was beyond the reach of technologies known at that time.<strong>Gravity</strong> <strong>Probe</strong> B — <strong>Post</strong> <strong>Flight</strong> Analysis • Final <strong>Report</strong> March 2007 25
Figure 2-1. <strong>GP</strong>-B Historical Time Line26 March 2007 Chapter 2 — Overview of the <strong>GP</strong>-B Experiment & Mission
In the months following publication of Schiff ’s paper, Schiff, Fairbank and Cannon continued to develop andrefine various aspects of the relativity gyroscope experiment. One early question was the feasibility of flying areference telescope. Cannon, being familiar with NASA’s forthcoming Orbiting Astronomical Observatory(OAO) from conversations with Dr. Nancy Roman of NASA Headquarters was able to dispel this concern. InJanuary 1961, Schiff and Fairbank sent a two-page letter proposal to NASA’s Office of Space Sciences, outlininga possible approach to the relativity gyroscope flight experiment.Figure 2-2. <strong>GP</strong>-B Co-founders and Nancy Roman. Clockwise from top left: Leonard Schiff (~1970),William Fairbank (~1988), Robert Cannon (2005), and Nancy Roman (2005)During Roman’s first year at NASA, the Office of Space Sciences had received a number of proposals on spacetests of general relativity, including this one. Roman and other NASA scientists were eager to support suchresearch; however NASA realized that evaluating these proposals required input from scientists and engineerswith highly specialized knowledge in this field. At Roman’s initiative, a NASA-sponsored conference onexperimental tests of relativity was held at <strong>Stanford</strong> under the chairmanship of the distinguished relativist H. P.Robertson of Caltech, on July 20-21, 1961, with a large attendance of physicists and aerospace engineers,including Schiff and Cannon.Also present from <strong>Stanford</strong>’s Aero-Astro Department were two of Cannon’s graduate students: Daniel DeBra,who was finishing his Ph.D. while heading up the Dynamics & Controls Analysis Group at Lockheed Missiles &Space Company (LMSC, now Lockheed Martin), and Benjamin Lange, also from Lockheed, who was juststarting his graduate studies in the <strong>Stanford</strong> Aero-Astro Department. Lange independently proposed theconcept of a drag-free satellite during the course of the meeting, and it became the subject of his doctoraldissertation. DeBra, now a Professor Emeritus in <strong>Stanford</strong>’s Aero-Astro Department, has been a Co-PI on <strong>GP</strong>-Bsince the late 1960’s. Separately, in the early 1970s, he led the development, in collaboration with Johns Hopkins<strong>Gravity</strong> <strong>Probe</strong> B — <strong>Post</strong> <strong>Flight</strong> Analysis • Final <strong>Report</strong> March 2007 27
Applied Physics Laboratory, of the first-ever drag-free satellite—the Disturbance Compensation System(DISCOS) drag-free controller for the U. S. Navy’s TRIAD transit navigation satellite, successfully launched inJuly 1973. It achieved 5x10 -12 g throughout a one-year orbital test.In 1962, Fairbank met Francis Everitt, then a research associate at the University of Pennsylvania, andencouraged him to come to <strong>Stanford</strong> as the first full-time academic staff member in the relativity gyroscopeexperiment, some graduate student research having already begun. NASA support commenced in March 1964,retroactive to November 1963, along with a supplemental grant from the U.S. Air Force, following receipt of aproposal “To develop a zero-G drag-free satellite and perform a gyro test of general relativity in a satellite,” withCannon and Fairbank as Co-Principal Investigators and Schiff as Program Advisor. In 1968, Cannon left<strong>Stanford</strong> and <strong>GP</strong>-B to become Chief Scientist of the U. S. Air Force, and at this time, DeBra and Everitt wereappointed Co-PIs, along with Fairbank.NASA’s research funding lasted through July 1977—the longest running single continuous grant ever awardedby NASA. Initial funding was direct from NASA Headquarters to <strong>Stanford</strong>; in 1971, oversight was transferred toNASA Marshall Space <strong>Flight</strong> Center (MSFC) where some engineering collaboration had already begun. In 1971,in parallel with the technology development, MSFC funded an in-depth Mission Definition Study by BallBrothers Research Corporation (BBRC, now Ball Aerospace), performed in close collaboration with <strong>Stanford</strong>,the starting point of all future flight studies. Two smaller follow-up studies by BBRC were performed later in the1970’s. Between 1977 and 1984, the experiment was re-structured as a NASA flight program, following in-housePhase A and Phase B studies at MSFC, the latter being completed in 1982. The essential step between 1982 and1984 was the definition of a ~$70 M technology development program for <strong>GP</strong>-B to be performed on theShuttle—the Shuttle Test Of the Relativity Experiment (STORE). In 1981, Everitt became Principal Investigator.In 1984, Bradford Parkinson, who had obtained his <strong>Stanford</strong> Ph.D. on <strong>GP</strong>-B-related gyroscope work in 1965,joined <strong>GP</strong>-B as Program Manager (later also a Co-PI) and concurrently as Professor of Aeronautics &Astronautics. Parkinson was previously program manager through successful deployment of the U.S.GlobalPositioning System (<strong>GP</strong>S). Also in that year, <strong>Stanford</strong> physicist John Turneaure was appointed HardwareManager of <strong>GP</strong>-B, and two years later he also became a Co-PI.28 March 2007 Chapter 2 — Overview of the <strong>GP</strong>-B Experiment & Mission
Figure 2-3. Clockwise from top left: <strong>GP</strong>-B Principal Investigator, Francis Everitt, and Co-PIs Brad Parkinson,John Turneaure and Dan DeBra.Coincident with the transfer from NASA HQ to MSFC, the HQ manager, C. Dixon Ashworth, coined the names<strong>Gravity</strong> <strong>Probe</strong> A (<strong>GP</strong>-A) for the Smithsonian Astrophysical Observatory relativity H-maser clock comparisonexperiment, headed by Dr. Robert Vessot and <strong>Gravity</strong> <strong>Probe</strong> B for the relativity gyroscope program. <strong>GP</strong>-A, like<strong>GP</strong>-B, became an MSFC program, performed with a sub-orbital Scout launch in 1976.NASA initiated funding of STORE in FY 1985, following receipt in November 1984 of a <strong>Stanford</strong> proposal, withLMSC as sub-contractor. In this proposal, Lockheed held principal responsibility for developing the unique650-gallon dewar and probe—the cryogenic chamber that houses the telescope and four gyroscopes. Theoriginal notion of STORE was a two-stage process:1. Construct the complete <strong>GP</strong>-B payload, and perform a ten-day rehearsal on Shuttle.2. Bring the payload back, address any issues, mount it on a space vehicle, to be deployed into polar orbitvia a Shuttle launch from the Western test range (Vandenberg AFB, SL-6).After the Challenger disaster in 1986 and the subsequent closure of SL-6, it was necessary to re-think themission as a satellite launch from an expendable launch vehicle, without losing the technology funding. In a visitto <strong>GP</strong>-B, James Beggs, then the NASA Administrator, decided that NASA would make <strong>Stanford</strong> University theprime contractor for the mission. Eventually, after extended NASA review and two competitive industrial PhaseB studies, <strong>Stanford</strong> then selected LMSC to build the space vehicle and associated control systems that wouldhouse the dewar and probe in orbit.<strong>Gravity</strong> <strong>Probe</strong> B — <strong>Post</strong> <strong>Flight</strong> Analysis • Final <strong>Report</strong> March 2007 29
William Fairbank once remarked: “No mission could be simpler than <strong>Gravity</strong> <strong>Probe</strong> B. It's just a star, atelescope, and a spinning sphere.” However, it took the exceptional collaboration of <strong>Stanford</strong>, MSFC, LockheedMartin and a host of others almost two more decades to finally bring this “simple” experiment to the launch padin April 2004. Over this period, as construction of the payload and spacecraft commenced, the <strong>GP</strong>-B teamexpanded, reaching a peak of approximately 100 persons at <strong>Stanford</strong>, and eventually some 200 persons atLockheed Martin. Six scientists, each with a different area of specialization, became Co-Investigators: Saps(Sasha) Buchman, George (Mac) Keiser, John Lipa, James Lockhart, Barry Muhlfelder, and Michael Taber. In1998, Bradford Parkinson stepped aside as Program Manager, to be succeeded first by John Turneaure, and thenin turn, Sasha Buchman, Ronald Singley, and Gaylord Green for the flight program, and William Bencze for thedata analysis phase of the mission. Throughout this period, Tom Langenstein served as the Deputy ProgramManager, with responsibility for resources and procurements.As Brad Parkinson recently noted: “Optimism was rampant [in 1960, when <strong>GP</strong>-B began]. We didn’t have anyidea how hard this was, and I would contend it was probably not until 30 years later that we brought [intoexistence] the technology to make perfect spheres, the coating technology, the readout technology, thecryogenic technology, the [telescope] pointing technology… None of this was possible in 1960.”On April 20, 2004 at 9:57:24 AM PDT, Everitt, Parkinson, Rex Geveden, the MSFC Program Manager for <strong>GP</strong>-B,and a crowd of over 2,000 supporters and former <strong>GP</strong>-B team members watched and cheered as the <strong>GP</strong>-Bspacecraft lifted off from Vandenberg Air Force Base. That emotionally overwhelming day, culminating withthe extraordinary live video of the spacecraft separating from the second stage booster meant, as <strong>GP</strong>-B ProgramManager Gaylord Green put it, “that 10,000 things went right.”Once in orbit, the spacecraft first underwent a four-month Initialization and Orbit Checkout (IOC) phase, inwhich all systems and instruments were initialized, tested, and optimized for the experimental data collection tofollow. The IOC phase culminated with the spin-up and initial alignment of the four science gyros early inAugust 2004. Beginning on August 28, 2004, the spacecraft began collecting science data. During the ensuing 50weeks, the spacecraft transmitted over a terabyte of science data to the <strong>GP</strong>-B Mission Operations Center (MOC)at <strong>Stanford</strong> University, where it was processed and stored in a database for analysis. On August 15, 2005, the<strong>GP</strong>-B Mission Operations team finished collecting science data and began a planned set of calibration tests ofthe gyros, telescope, and SQUID readouts that lasted six weeks, until the liquid helium in the dewar wasexhausted at the end of September.In October 2005, the <strong>GP</strong>-B science team began a three-phase data analysis process. As of the final editing of thisreport in March 2007, the team has progressed through Phase I, Phase II, and much of Phase III, and ispreparing to announce preliminary results on April 14-15, 2007 at the American Physical Society (APS) meetingin Jacksonville, Florida. In April-May, the team will be releasing the science data and a complete archive of <strong>GP</strong>-B documents to the National Space Sciences Data Center (NSSDC) at the Goddard Space <strong>Flight</strong> Center.Subsequently, the science team plans to spend several more months refining the analysis in order to achieve themost precise result possible. The analysis and results will then undergo a careful and critical review by the <strong>GP</strong>-Bexternal Science Advisory Committee (SAC) and other international experts. During the latter part of 2007, the<strong>GP</strong>-B team will also be preparing scientific and engineering papers for publication, as well as working withNASA in planning an announcement of the final results of this unprecedented test of General Relativity.If there is one person who, along with William Fairbank has proved to be the driving force of <strong>GP</strong>-B since hisarrival in 1962, it is Francis Everitt. His leadership has markedly advanced the state of the art in the areas ofcryogenics, magnetics, quantum devices, telescope design, control systems, quartz fabrication techniques,metrology and, most of all, gyroscope technology. The fact that <strong>GP</strong>-B survived no fewer than seven potentialcancellations, finally launched in April 2004, successfully completed a 17-month flight mission, and is now inthe final stages of analyzing the relativity data is a direct tribute to Everitt’s leadership, tenacity, and doggedpursuit of the experimental truth. It was in recognition of these seminal contributions that, in April 2005, NASAawarded Everitt the Distinguished Public Service Medal—the highest award that NASA can confer upon a nongovernmentemployee.30 March 2007 Chapter 2 — Overview of the <strong>GP</strong>-B Experiment & Mission
Figure 2-4. <strong>GP</strong>-B Principal Investigator, Francis Everitt, receiving the NASA Distinguished Public Service Award atan awards ceremony at NASA Headquarters in April 2005.2.1.2 Einstein Stands on Newton’s ShouldersIn a letter of 1676, written to his lifelong enemy, Robert Hooke, Isaac Newton made the now famous remark: “IfI have seen farther, it is by standing on the shoulders of giants.” In 1687, Newton published his three-volumePhilosophiae Naturalis Principia Mathematica—universally regarded as the most important work in the historyof science—in which he fused the work of Copernicus, Galileo, Kepler, and others into the first comprehensivetreatise on theoretical physics. In the Principia, Newton defined the three laws of motion and derived theformulae that, for practical purposes, describe the motion of celestial bodies, as well as the motion of everydayobjects (e.g., apples falling from trees). Newton believed that space and time are distinct and absolute entities,and although he could not explain the mechanism by which it works, he thought that gravity is an attractiveforce, somehow acting instantaneously at a distance between bodies, as illustrated in Figure 2-5 below.Figure 2-5. Newton’s universe: Space and time are absolute or fixed entities. <strong>Gravity</strong> is a force that actsinstantaneously between objects at a distance, causing them to attract one another.About two centuries later, in 1905, Einstein published his special theory of relativity, which is based on thepremise that the speed of light is a universal “speed limit”—nothing can travel or propagate faster than the speedof light. Realizing that Newton’s idea of gravity violated this basic premise of his special theory of relativity,Einstein spent the next 11 years developing his general theory of relativity—his theory of gravity—whichutilized the equivalence principle to go beyond the concepts of inertia and weight to describe how gravity makesthings fall.<strong>Gravity</strong> <strong>Probe</strong> B — <strong>Post</strong> <strong>Flight</strong> Analysis • Final <strong>Report</strong> March 2007 31
In Einstein’s view, space and time are relative entities, inextricably woven together into a “fabric” which Einsteincalled “spacetime.” Furthermore, spacetime and matter interact—spacetime tells matter how to move, andmatter tells spacetime how to curve and twist. Thus, in Einstein’s universe, gravity is not an attractive force, butrather the interaction of bodies moving through curved spacetime. This concept is illustrated in Figure 2-6below.Figure 2-6. Einstein’s Universe: Space and time are relative entities, interwoven into a spacetime fabric whosecurvature we call gravity. Objects follow the straightest possible lines, called geodesics, through curvedspacetime.2.1.3 Why perform another test of Einstein?With the general theory of relativity, acclaimed as one of the most brilliant creations of the human mind,Einstein forever changed our Newtonian view of gravity. However, even though it has become one of thecornerstones of modern physics, general relativity has remained the least tested of Einstein’s theories. Thereason is, as Caltech physicist Kip Thorne once put it: “In the realm of black holes and the universe, thelanguage of general relativity is spoken, and it is spoken loudly. But in our tiny solar system, the effects ofgeneral relativity are but whispers.” And so, any measurements of the relativistic effects of gravity around Earthmust be carried out with utmost precision. Over the past 90 years, various tests of the theory suggest thatEinstein was on the right track. But, in most previous tests, the relativity signals had to be extracted from asignificant level of background noise. The purpose of <strong>GP</strong>-B is to test Einstein’s theory by carrying out theexperiment in a pristine orbiting laboratory, thereby reducing background noise to insignificant levels andenabling the <strong>Probe</strong> to examine general relativity in new ways.<strong>Gravity</strong> is the most fundamental force in nature; it affects all of us all the time. But, gravity is still an enigma—wedon’t completely understand it. Einstein’s 1916 general theory of relativity forever changed our notions of spaceand time, and it gave us a new way to think about gravity. If the <strong>Gravity</strong> <strong>Probe</strong>-B experimental resultscorroborate the geodetic and frame-dragging predictions of general relativity, we will have made the mostprecise measurement of the shape of local spacetime, and confirmed the theory of general relativity to a newstandard of precision. If on the other hand, the results disagree with Einstein's theoretical predictions, we maybe faced with the challenge of constructing a whole new theory of the universe’s structure and the motion ofmatter.32 March 2007 Chapter 2 — Overview of the <strong>GP</strong>-B Experiment & Mission
Such rigorous experimental verification is essential to furthering our understanding of the nature of ouruniverse, particularly about massive objects in space, such as black holes and quasars. As <strong>GP</strong>-B Physicist JohnMester puts it,“General relativity is our current theory of gravitation, and it has wide-ranging implications for ourunderstanding of the structure of the cosmos. At present, Einstein’s theory of gravitation lies outsidethe other three forces of nature (the strong force, the weak force and the electromagnetic force),which are explained within a unified framework called The Standard Model. Attempts to unify allfour forces of nature have eluded physicists from Einstein to the current day. Testing theories to highprecision will help define their range of validity or reveal where these theories break down.”Whatever the result, <strong>Gravity</strong> <strong>Probe</strong> B will provide us another glimpse into the sublime structure of our universe.2.1.4 The Geodetic and Frame-dragging Effects<strong>Gravity</strong> <strong>Probe</strong> B was designed to test, through a direct, controlled experiment, two predictions of Einstein’sgeneral theory of relativity. The first, known as the geodetic —or as it is sometimes called, deSitter— effect,measures the size of the very small angle by which our Earth warps its local spacetime. One way to visualize thiseffect is to think of local spacetime as a trampoline and the Earth a bowling ball lying in the middle. The heavyball warps or puts a dent in the trampoline, so that a marble (another celestial body) moving along thetrampoline surface will be inexorably drawn down the warped slope towards the massive ball.Another, and perhaps more useful way to visualize the geodetic warping of spacetime is the so-called “missinginch” shown in Figure 2-7 below.Figure 2-7. The Missing InchIf you were to draw a circle with the same diameter (D) as the Earth (~7,900 miles) in empty space, thecircumference of this circle, calculated using standard Euclidian geometry, would be πD (~24,000 miles).Furthermore, a gyroscope following this circular path in empty space would always point in the same direction,as illustrated in the left side of Figure 2-7. However, if you were then to slip the Earth inside this circle, Earth’smass warps the spacetime inside the circle into a shallow cone, thereby shrinking the circumference of the circle<strong>Gravity</strong> <strong>Probe</strong> B — <strong>Post</strong> <strong>Flight</strong> Analysis • Final <strong>Report</strong> March 2007 33
y a mere 1.1 inches. You can see this effect (not to scale) by cutting out a pie-shaped wedge from the circle andthen closing the gap. The circumference of the resulting cone is slightly diminished, and the orientation of agyroscope will now shift as it moves around the circular edge of the cone, as shown in the right half ofFigure 2-7. This shifting orientation of a gyroscope’s spin axis as it moves through warped spacetime is theessence of the <strong>GP</strong>-B experiment.The other effect being measured by <strong>GP</strong>-B, known as “frame-dragging,” was postulated by Austrian physicistsJosef Lense and Hans Thirring two years after Einstein published his general theory of relativity. It states that asa celestial body spins on its axis, it drags local spacetime around with it, much like a spinning ball in bowl ofmolasses would drag around some of the molasses as it spins. This concept is illustrated in Figure 2-8.Figure 2-8. Illustration of frame-draggingParticularly intriguing, the frame-dragging measurement probes a new facet of general relativity—the way inwhich spacetime is dragged around by a rotating body. This novel effect closely parallels the way in which arotating electrically charged body generates magnetism. For this reason it is often referred to as the“gravitomagnetic effect,” and measuring it can be regarded as discovering a new force in nature, thegravitomagnetic force.2.1.5 The Significance of the <strong>GP</strong>-B ExperimentPhysics advances experimentally in two ways: 1) by measuring known effects with higher accuracy and 2) byinvestigating previously untested phenomena. The geodetic effect has previously been determined to ~1% incomplex studies of the Earth-Moon system around the Sun. <strong>GP</strong>-B aims to measure it to about 0.01%. Theframe-dragging effect, on the other hand, is so minuscule around a planet the size of our Earth that until <strong>GP</strong>-B,it has not been possible to measure this effect directly. However, the frame-dragging effect is of particularinterest to physicists and cosmologists who study black holes, because like the air in a hurling tornado, thehurling space around a black hole has enormous destructive potential.34 March 2007 Chapter 2 — Overview of the <strong>GP</strong>-B Experiment & Mission
Figure 2-9. Frame-dragging around a black holeAt the <strong>GP</strong>-B press conference held at NASA Headquarters in April 2004, just prior to the <strong>GP</strong>-B launch, Caltechphysicist Kip Thorne, one of the world’s leading experts on black holes, made the following comments on thesignificance of the frame-dragging effect:“The black dot in the center [of Figure 2-9 above] represents a black hole. It is surrounded by anaccretion disc of gas, shown in yellow, that we believe is forced into the equatorial plane of the blackhole by the dragging of spacetime in that vicinity. Jets of energy [blue light in the figure] shoot out inboth directions along the spin axis produced by frame-dragging around the black hole. Furthermore,the interaction of the frame-dragging around black holes with magnetic fields is responsible for theenormous and destructive power generation that produces the jets of energy streaming out of theseobjects.”Thorne then concluded:“The results of the <strong>GP</strong>-B experiment will enable us to verify that the frame-dragging effect doesindeed exist, and that it is directly proportional to the angular momentum of our spinning Earth.Physicists and cosmologists will then be able to extrapolate these frame-dragging measurementsaround the Earth to much more massive celestial objects, such as black holes and quasars.”2.1.6 The Basic <strong>GP</strong>-B Experimental DesignConceptually, the <strong>GP</strong>-B experiment is simple: Place a gyroscope and a telescope in a polar-orbiting satellite,about 642 km (400 mi) above the Earth. (<strong>GP</strong>-B actually uses four gyroscopes for redundancy.) At the start of theexperiment, align both the telescope and the spin axis of the gyroscope with a distant reference point—a guidestar. Keep the telescope aligned with the guide star for a year, as the spacecraft makes over 5,000 orbits aroundthe Earth, and measure the change in the spin axis alignment of the gyros over this period in both the plane ofthe orbit (the geodetic drift) and orthogonally in the plane of the Earth’s rotation (frame-dragging drift).Figure 2-10 below shows a conceptual diagram of the <strong>GP</strong>-B experimental design.<strong>Gravity</strong> <strong>Probe</strong> B — <strong>Post</strong> <strong>Flight</strong> Analysis • Final <strong>Report</strong> March 2007 35
Figure 2-10. Schematic diagram of the <strong>GP</strong>-B experimentAccording to Einstein’s theory, over the course of a year, the geodetic warping of Earth’s local spacetime shouldcause the spin axis of the gyroscope to drift away from its initial guide star alignment by a tiny angle of 6,606milliarcseconds (0.0018 degrees). Likewise, the twisting of Earth’s local spacetime should cause the spin axis todrift in a perpendicular direction by an even more minuscule angle of 39 milliarcseconds (1.1x10- 5 degrees),about the width of a human hair viewed from 1/4 mile away.<strong>Gravity</strong> <strong>Probe</strong>-B’s measurement of the geodetic effect has an expected accuracy of better than 0.01%—far moreaccurate than any previous measurements. The frame-dragging effect has never directly been measured, but<strong>Gravity</strong> <strong>Probe</strong>-B is expected to determine its accuracy to better than 1%.2.1.7 The <strong>GP</strong>-B SpacecraftAll of the <strong>Gravity</strong> <strong>Probe</strong> B technologies are integrated into one of the most elegant and sophisticated satellitesever to be launched into space. The <strong>GP</strong>-B spacecraft is a marvel of engineering and truly a beautiful sight tobehold. From it largest to smallest parts, it is filled with the cutting edge technologies and materials describedthroughout this report, many of which were invented specifically for use in the <strong>Gravity</strong> <strong>Probe</strong> B mission.2.1.7.1 Inside the DewarThe spacecraft is built around a 650-gallon dewar, one of the largest and most sophisticated ever flown in space.The dewar is nine-feet tall and forms the main structure of the spacecraft. The vacuum area just inside thedewar’s shell contains multiple reflective surfaces that cut down on heat radiation. The dewar also containsvapor-cooled metal shields that help maintain its internal cryogenic temperature, and slosh baffles helpsuppress tidal motions in the superfluid helium inside. When cooled to nearly absolute zero temperature, liquidhelium transforms into a state called “superfluid,” in which it becomes a completely uniform thermalconductor. Only helium exhibits this, and other special properties of superfluidity.Figure 2-11 shows the dewar’s location in the center of the spacecraft, along with an exploded view of the mainpayload components inside the dewar.36 March 2007 Chapter 2 — Overview of the <strong>GP</strong>-B Experiment & Mission
Figure 2-11. Exploded diagram of the <strong>GP</strong>-B spacecraft & payloadThe Science Instrument Assembly (SIA) containing the quartz block and telescope forms the pristine spacebornelaboratory for making the measurements of the <strong>GP</strong>-B experiment. The SIA is located at the center of massof the spacecraft/dewar, along its main axis. It is mounted inside a cigar-shaped vacuum canister called the<strong>Probe</strong> (described below).The quartz block houses the four spherical gyroscopes and SQUID readout instruments (Super ConductingQuantum Interference Devices—the magnetometers that read the gyroscopes’ spin axis orientation). Eachspherical gyroscope rotor is enclosed in an elegant, two-piece cylindrical quartz housing, mounted in the quartzblock and surrounded by antimagnetic shielding. The gyro rotors are electrically suspended by six roundelectrode pads—three in the top half of the housings and three in the bottom half—with only 32 microns(~0.001 inch) clearance from these pads, which are embedded in the housing walls. The average spin rate of thegyro rotors during the science phase of the mission was approximately 4,300 rpm.Bonded to the top of the quartz block using a hydroxide catalyzed optical bonding process, is the quartzreflecting Cassegrain astronomical telescope, which focuses on the guide star, IM Pegasi. Hydroxide catalyzedbonding is a patented method of fusing together quartz parts, without the use of any glue or fasteners to ensurethat the SIA did not distort or break when cooled to cryogenic temperatures. The line of sight of the telescope isrigidly aligned to the SQUID readout loop of each gyroscope. As such, the quartz telescope provided the frameof reference for measuring drift in the spin axes of the gyroscopes.The SIA is mounted in a two-meter long cigar-shaped canister, called the “<strong>Probe</strong>,” which was inserted into thedewar prior to launch. The <strong>Probe</strong> is an amazing feat of cryogenic engineering, designed by Lockheed Martin inPalo Alto, California. It provided both mechanical and structural stability for the SIA. The <strong>Probe</strong> was designedto provide a free optical path for the telescope to view distant space through a series of four preciselymanufactured windows, mounted in its upper section. Three of these windows served to reduce thermalconductivity into the dewar, and the fourth, which is made of sapphire, also forms the vacuum seal at the topend of the <strong>Probe</strong>.<strong>Gravity</strong> <strong>Probe</strong> B — <strong>Post</strong> <strong>Flight</strong> Analysis • Final <strong>Report</strong> March 2007 37
Figure 2-12. Final assembly of the <strong>Probe</strong>During the entire <strong>GP</strong>-B mission, the inside of the <strong>Probe</strong> was maintained at an extremely high vacuum—muchgreater than the vacuum of the thermosphere at the 642 km (400 mi) orbiting altitude of the spacecraft. Theprobe is surrounded by a superconducting lead bag, inserted between it and the dewar. The superconductinglead bag provided an impenetrable shield from electromagnetic signals that could disturb the gyroscopes. Takentogether, all of these measures created an ultra-pristine cryogenic environment, free of any external forces ordisturbances, in which the gyroscopes spun during the science phase of the mission.At the upper end of the <strong>Probe</strong>, capping off the dewar, is the “top hat.” The top hat served as a thermal interfacefor connecting over 450 plumbing and electrical lines, that run from various electronics and control systems,mounted on the space vehicle’s truss system outside the dewar, to the cryogenic vacuum chamber inside the<strong>Probe</strong> and dewar.38 March 2007 Chapter 2 — Overview of the <strong>GP</strong>-B Experiment & Mission
Figure 2-13. Looking inside the top hat down into the <strong>Probe</strong>Before the <strong>Probe</strong> was completely integrated into the dewar, each component went through years of testing andconstruction. Some parts even had to be de-constructed and rebuilt. The entire <strong>Probe</strong> was assembled in a Class-10 clean room, as any particles larger than a single micron would disrupt the precise structure.2.1.7.2 Outside the DewarOutside the dewar are all of the systems that provide power, navigation, communication, and control of thespace vehicle. Figure 2-14 below shows a model of the spacecraft in orbit, with some of its key componentslabeled.Figure 2-14. The <strong>GP</strong>-B spacecraft<strong>Gravity</strong> <strong>Probe</strong> B — <strong>Post</strong> <strong>Flight</strong> Analysis • Final <strong>Report</strong> March 2007 39
Sun Shield. The sun shield is a long, conical tube that kept stray light from entering the telescope during themission. Inside the sun shield are a series of black, metal baffles that absorb incoming stray light before it canreach the telescope. In addition to blocking out stray light from the Sun, the sun shield also blocked stray lightfrom the Earth, Moon, and major planets.Proportional Micro Thrusters. Until the helium in the dewar was expended at the end of the mission in lateSeptember 2005, the proportional micro thrusters on the spacecraft provided a very precise means ofcontrolling its attitude or orientation in space. For the <strong>GP</strong>-B experiment, an unprecedented amount of on-orbitcontrol was required for the vehicle to maintain its drag-free orbit. This was accomplished by harnessing thehelium gas that continually evaporates from the dewar’s porous plug and venting it as a propellant througheight pairs of opposing or balanced proportional micro thrusters.Throughout the mission, these micro thrusters continually metered out a flow of helium gas—at the rate ofabout 1/100 th the amount of a human “puff ” exhalation that one might use to clean eyeglasses. This meteredflow of helium kept the space vehicle’s center of mass balanced around one of the gyroscopes, called a “proofmass.” During the flight mission, the spacecraft “chased” the proof mass, thus permitting the proof mass tofollow a “free-fall” trajectory without the need for any support force. The thrusters are arranged in pairs, so thatthey counterbalanced each other. As long as the same amount of helium was flowing from two opposingthrusters, the space vehicle would not change its position relative to the proof mass along that axis. However, ifthe SQUID readout for the drag-free gyroscope or the telescope readout required the spacecraft’s position orattitude to change, it was simply a matter of unbalancing the flow, ever so slightly, in the appropriate thrusterpair to move the vehicle in the desired direction. These proportional micro thrusters also controlled thespacecraft’s roll rate.Now that the helium is exhausted from the dewar, these micro thrusters are no longer functional. Also, the onboardscience telescope has much too narrow a focus to be used for determining the spacecraft’s pointingdirection. Instead, two star trackers mounted on the spacecraft frame, along with two magnetometers andstandard navigational rate-sensing gyroscopes are used to determine the correct orientation of the spacecraft,and a set of magnetic torque rods are now used to control its attitude by pushing against the local magnetic fieldof the Earth.Solar Arrays. These four arrays convert energy from the Sun into electrical power that is stored in thespacecraft’s two batteries and then used to run the various electrical systems on board. The position of eachsolar array was precisely canted to maximize the power output as the spacecraft rolled and changed positionwith respect to the Sun over the course of a year. (The orbit plane of the spacecraft always contains the guidestar.)<strong>GP</strong>S Sensors & Antennae. Four <strong>GP</strong>S (Global Positioning System) antennas on-board the spacecraft—two at theforward end of the spacecraft and two at the aft end—transmit information about the spacecraft’s position andattitude. The <strong>GP</strong>S system on the <strong>GP</strong>-B spacecraft provides positioning information that is better than 100 timesmore accurate than traditional ground-based <strong>GP</strong>S navigation systems. For example, a high quality handheld<strong>GP</strong>S receiver on Earth can locate your position to within about a meter, whereas the <strong>GP</strong>S receiver onboard the<strong>GP</strong>-B space vehicle can locate its position to within a centimeter. (This occurs because the <strong>GP</strong>S signals used donot have to travel through the Earth’s lower atmosphere.)Telemetry & Communications Antennae. These antennae enable both inbound and outboundcommunications with the space vehicle, including communications with ground stations and with orbitingcommunications satellites in the Tracking Data Relay Satellite System (TDRSS). Telemetry data from the spacevehicle and science data from the experiment are transmitted to ground stations using these communicationssystems. These systems also enable the <strong>GP</strong>-B Mission Operations Center (MOC) to send batches of commandsto the space vehicle. Communications between the space vehicle and orbiting satellites is limited to a 2K dataformat, whereas communications with ground stations use a 32K data format, enabling far more data to betransmitted per unit of time.40 March 2007 Chapter 2 — Overview of the <strong>GP</strong>-B Experiment & Mission
Star Trackers. A star tracker is basically a telescope with a camera and pattern matching system that usesconstellations and stars to determine the direction in which a satellite is pointing. The <strong>GP</strong>-B spacecraft containstwo star trackers (also called star sensors) for redundancy. The star trackers have a field of view on the order ofeight degrees, and they can focus to a position within 60 arcseconds (0.017 degrees)—about the same as thewhole field of view of the on-board telescope, which can pinpoint the guide star’s position to within amilliarcsecond. With such a small field of view, it would be nearly impossible to locate the guide star using onlythe onboard telescope, so the star trackers functioned like “spotting scopes” for initially pointing the spacecrafttowards the guide star. During the mission, once the star tracker had oriented the spacecraft within 60arcseconds of the guide star, the onboard telescope then took over the job of maintaining the precise alignmentrequired for measuring gyroscope drift.Control Gyroscopes. <strong>GP</strong>-B contains two pairs of standard, flight-qualified rate-sensing gyroscopes, equivalentto those found on other spacecraft (and also airplanes, ships, and other vehicles). These gyroscopes are part ofthe general Attitude & Translation Control System (ATC) of the spacecraft.Electro-mechanical Control Systems. Surrounding the dewar, is a lattice of trusses that forms the structure ofthe space vehicle. Attached to these trusses are a number of electrical and mechanical systems that control theoperation of the spacecraft and enable the relativistic measurements to be carried out. These control systemsinclude the following:• Attitude & Translation Control System (ATC)—Uses feedback from the gyro suspension system(GSS), the SQUID readout system (SRE), the telescope readout system (TRE), the star trackers,magnetometers, and rate-sensing navigational gyroscopes to controls the proportional micro thrustersand magnetic torque rods that determine and maintain the spacecraft’s precise attitude and position.• Magnetic Torquing System (MTS)—A set of long electromagnets that push or pull against the Earth’smagnetic field to orient the spacecraft’s attitude. During the <strong>GP</strong>-B flight mission, the magnetic torquerods were used in conjunction with 16 proportional micro thrusters to control the spacecraft’s pointingwith extreme precision. Following the mission, with no helium propellant remaining to operate themicro thrusters, these magnetic torque rods are the only means of controlling the spacecraft’s attitudeand position in orbit.• Mass Trim Mechanism (MTM)—A system of movable weights that can be adjusted during flight torestore rotational balance of the space vehicle (similar to spin balancing the tires on an automobile)• Gyro Suspension System (GSS)—The electronics that levitate and precisely control the suspension ofthe four gyroscopes at the heart of the <strong>Gravity</strong> <strong>Probe</strong> B experiment. The GSS control boxes are mountedin the truss work, outside the dewar. The wiring goes through the top hat section of the <strong>Probe</strong> and downto each gyroscope.• Gas Management Assembly (GMA)—A very complex set of valves, pipes, and tubing, that runs from atriangular assembly on the truss work, through the top hat and down the <strong>Probe</strong> to each of thegyroscopes. The critical job of the GMA is to spin up each of the four gyroscopes by blowing a stream of99.99999% pure helium gas over them, through a channel built into one half of each gyroscope’s quartzhousing.• Experiment Control Unit (ECU)—The ECU controls many of the systems onboard the space vehicle,including the GMA, the UV system, and various thermal devices.<strong>Gravity</strong> <strong>Probe</strong> B — <strong>Post</strong> <strong>Flight</strong> Analysis • Final <strong>Report</strong> March 2007 41
2.1.8 The Broader Legacy of <strong>GP</strong>-BWhen the <strong>GP</strong>-B experiment was first conceived in late 1959- 1960, the United States had just created NASA,launched its first satellite, and entered the space race. Landing men on the Moon was still nine years away. Atthe time, this experiment seemed rather simple, but it has taken over four decades of scientific and technologicaladvancement to create a space-borne laboratory and measurement instrument sophisticated and preciseenough to carry out these minuscule measurements of relativistic effects around the Earth.At least a dozen new technologies had to be invented and perfected in order to carry out the <strong>Gravity</strong> <strong>Probe</strong> Bexperiment. For example, the spherical gyroscopes have a stability that is more than a million times better thanthe best inertial navigation gyroscopes. The ping-pong-ball-sized gyroscope rotors in these gyroscopes had to beso perfectly spherical and homogeneous that it took more than10 years and a whole new set of manufacturingtechniques to produce them. They’re now listed in the Guinness Database of Records as the world’s roundestman-made objects.The magnetometers, called SQUIDs (Super-Conducting Quantum Interference Devices), monitor the spin axisdirection of the gyroscopes and can detect—digitally—a change in spin axis alignment to an angle ofapproximately 1/40,000,000 th of a degree. These advances were only possible through <strong>GP</strong>-B’s uniquecombination of cryogenics, drag-free satellite technology, as well as totally new manufacturing and measuringtechnologies.Similarly, it took two years to make the flawless roof prisms in the <strong>GP</strong>-B science telescope that tracks the guidestar. Some scientists have mused about how Einstein, himself once a patent clerk, would have enjoyed reviewingthese extraordinary technologies. See Chapter 3, <strong>GP</strong>-B’s Unique Technological Challenges and Solutions fordescriptions of 12 key <strong>GP</strong>-B unique technological innovations.Over its 40+ year life span, spin-offs from the <strong>Gravity</strong> <strong>Probe</strong> B program have yielded many technological,commercial, and social benefits. For example, optical-bonding and fused-quartz technologies pioneered for <strong>GP</strong>-B have subsequently been applied to commercial products, and photo-diode detector technology developed foruse in the <strong>GP</strong>-B telescope has had ramifications for digital camera improvements. Another example is <strong>GP</strong>-B'sporous plug for controlling helium in space. This cryogenic technology was essential to several other vital NASAmissions, including IRAS (Infrared Astronomical Satellite) and COBE (COsmic Background Explorer).One interesting <strong>GP</strong>-B spin-off story is the evolution of precision guidance control technology from testingEinstein to plowing fields. Under the supervision of <strong>GP</strong>-B Co-PI, Brad Parkinson, centimeter-accurate GlobalPositioning Satellite (<strong>GP</strong>S) technology, originally developed for attitude control of the <strong>GP</strong>-B spacecraft, was repurposedfor other automated guidance control applications in the early 1990’s by Clark Cohen and a group ofhis fellow <strong>GP</strong>-B/<strong>GP</strong>S graduate students at <strong>Stanford</strong>. After receiving his Ph.D., Cohen founded a company, nowNovariant Corporation, to develop precision <strong>GP</strong>S guidance control applications, such as an automatic aircraftlanding system and automated precision farming.Figure 2-15. <strong>Stanford</strong> <strong>GP</strong>-B/<strong>GP</strong>S graduate students and a faculty member pose next to a <strong>GP</strong>S-controlled tractor;Clark Cohen (left) and Brad Parkinson (right) receive awards from the Space Technology Hall of Fame.42 March 2007 Chapter 2 — Overview of the <strong>GP</strong>-B Experiment & Mission
In May 2005, Novariant’s Autofarm technology was inducted into the Space Technology Hall of Fame, andindividual awards were given to Cohen and several colleagues at Novariant, along with Parkinson and<strong>Stanford</strong>’s <strong>GP</strong>-B and Hansen Experimental Physics Lab (HEPL) for their role in supporting this technologydevelopment.Less tangible, but perhaps most important, the <strong>Gravity</strong> <strong>Probe</strong> B program has had a profound effect on the livesand careers of numerous faculty and students—both graduate and undergraduate, and even high schoolstudents, at <strong>Stanford</strong> University and other educational institutions. Nearly 100 Ph.D. dissertations have beenwritten on various aspects of this program, and <strong>GP</strong>-B alumni include the first woman astronaut, the CEO of amajor aerospace company, professors at Harvard, Princeton, <strong>Stanford</strong> and elsewhere, and a recent NobelLaureate in Physics.2.2 Spacecraft LaunchFigure 2-16. Photos of the <strong>GP</strong>-B Launch on April 20, 2004The <strong>GP</strong>-B Space Vehicle launched on Tuesday, 20 April 2004, at 09:57:24 PDT. Following a smooth countdown,with excellent meteorological conditions, the <strong>GP</strong>-B spacecraft launched from the Launch Pad SLC-2W atVandenberg Air Force Base (VAFB) in California aboard a Delta II 7920-10 rocket into a polar circular orbit of640 km (400 mile) altitude. The Command/Control Computer Assembly (CCCA), Command and DataHandling (CDH) subsystem, and Attitude & Translation Control (ATC) electronics were powered on prior tolaunch, and command and telemetry links were established from the Mission Operations Center (MOC) at<strong>Stanford</strong> University when the fairing separated, five minutes after launch.<strong>Gravity</strong> <strong>Probe</strong> B — <strong>Post</strong> <strong>Flight</strong> Analysis • Final <strong>Report</strong> March 2007 43
2.3 Spacecraft SeparationThe Solar arrays deployed right on schedule, 66 minutes after launch, and the Boeing Delta II Launch Vehiclesecond stage released the Space Vehicle at the desired attitude, within 100 meters of a perfect orbit. Two onboardvideo cameras treated everyone watching the launch to a spectacular view of the spacecraft separatingfrom the second stage rocket. The orbital insertion was indeed so precise that no orbit trim was required duringthe Initialization and Orbit Checkout (IOC) phase of the mission.Figure 2-17. On-board video camera shows separation2.4 Initialization & Orbit Checkout (IOC)This section provides an overview of the IOC mission phase, a summary, week-by-week list of IOCaccomplishments, and a discussion of the main tasks accomplished during IOC. A complete chronicle of theIOC mission phase, based on the weekly reports sent out via email and posted on the <strong>GP</strong>-B Web site by the <strong>GP</strong>-B Public Affairs Coordinator, is included in Appendix C, Weekly Chronicle of the <strong>GP</strong>-B Mission.2.4.1 Overview of IOCDuring the IOC phase of the mission, the spacecraft underwent a complete initialization and shakedown ofsystems and subsystems.2.4.1.1 IOC Task SummaryFollowing is a list of the main tasks accomplished during IOC:1. All subsystems that were not running during the launch were powered on and verified.2. The spacecraft’s ATC system was used for three main purposes:• To properly orient the spacecraft, enabling the science telescope to lock onto the guide star, IMPegasi.• To establish and maintain the desired spacecraft roll rate.• To fly the spacecraft in a drag-free orbit around one of the science gyros.3. The science gyros were digitally suspended, and the SQUID magnetometer gyro readouts were tested.4. The spacecraft was balanced about its center of mass using the Mass Trim Mechanisms (MTMs) on theoutside frame or shell of the spacecraft.5. The spacecraft’s roll rate was increased for a short time to uniformly wrap the bubble of superfluid liquidhelium around the inside of the dewar wall.44 March 2007 Chapter 2 — Overview of the <strong>GP</strong>-B Experiment & Mission
6. Using the Gyro Suspension System (GSS), many tests were made to calibrate the positions of the fourscience gyro rotors in their housings.7. In three spin-up stages, spread over a period of about a month, the spin rates of the gyros were graduallyincreased to their final science experiment levels, with many tests and calibrations performed at eachstage.8. A Low-Temperature Bakeout (LTB) procedure was performed to remove stray helium molecules fromwithin the gyro housings and science probe.9. The spin axes of the four gyros were aligned with the guide star,10. Electrostatic charging of each gyroscope was controlled throughout the period using an ultraviolet lightdischarge system.2.4.1.2 The Need to Extend The IOC Time LinePrior to launch, the estimated time line for the IOC phase, based on many tests and simulations conducted at<strong>Stanford</strong> University and Lockheed Martin, was between 42 and 60 days—42 days of tasks, plus 18 dayscontingency. An additional 15 days contingency, if needed, was also budgeted into the overall mission time line.In the actual mission, IOC required a little over twice the amount of time originally anticipated—the IOC phaseofficially concluded on Mission Day #129 (27 August 2004), with gyros #1, #2, and #3 in science mode, and gyro#4 continuing to undergo alignment of its spin axis. spin axis alignment of gyro #4 was completed on MissionDay #149 (16 September 2004), and it too then began collecting relativity data, along with the other three gyros.Two main factors were responsible for most of the extension of the IOC phase of the mission:1. Tuning the ATC system to perform correctly—complicated by the loss of two micro thrusters and acommanded increase in the spacecraft roll rate to more than twice its originally anticipated value2. Full-speed gyro spin-up and gyro spin axis alignment—complicated by the gyros spinning at less thanhalf the anticipated full-speed rates2.4.1.3 Tuning The ATC System<strong>GP</strong>-B is the first spacecraft ever launched with a requirement to control all 6 degrees of freedom of the vehicle. Itrequires three axes of rotational control—pitch, yaw, and roll—and it requires three axes of translational dragfreepositioning. Many other spacecraft, like the Hubble Space Telescope, control pitch, yaw, and roll, but theydo not roll continuously. Also, <strong>GP</strong>-B is only the second satellite ever launched to achieve 3-axis drag-freecontrol. In retrospect, these requirements were more difficult to achieve on orbit than had been anticipated.2.4.1.4 Micro Thruster & Star Tracker IssuesThe initial IOC time line called for locking onto the guide star within the first four days in orbit. Successfullocking onto the guide star was somewhat delayed due, in part, to the unexpected malfunction of twoproportional helium-gas thrusters, which had to be identified, isolated, and taken out of service. These thrustersfailed individually after two separate events 1) launch, and 2) Science Instrument Assembly (SIA) flux flushingoperations. The likely root cause for both these failures has been identified as foreign particle contamination ofthe thruster mechanism. This problem was mitigated by revising the ATC software programming to performwith 14, instead of 16 thrusters and then uploading the revised software to the spacecraft’s on-board computer.(The remaining 14 thrusters performed flawlessly throughout the entire experiment.)The two conventional star trackers and associated processing software had difficulty properly identifying starfields while the spacecraft was rolling from the first day in orbit and this was formally declared Anomaly #5 bythe Anomaly Review Board (ARB). (For a description of this anomaly, see Appendix D, Summary Table of<strong>Gravity</strong> <strong>Probe</strong> B — <strong>Post</strong> <strong>Flight</strong> Analysis • Final <strong>Report</strong> March 2007 45
<strong>Flight</strong> Anomalies.) Furthermore, a decision to reduce noise in the experimental data signal by increasing thespacecraft’s roll rate from 0.52 rpm to 0.75 rpm (and ultimately, 0.774 rpm) made the ATC’s star fieldidentification more difficult.2.4.1.5 Full Speed Gyro Spin-up IssuesThe team, using a very thorough process, successfully completed the full-speed spin-up of the four sciencegyroscopes. Gyro #4, which showed the greatest spin-up helium leakage rate during low-speed testing was spunup to full speed first. The full-speed spin-up process, which lasted most of the day on 13 July 2004, wentsmoothly and resulted in a final spin rate of 105.8 Hz (6,348 rpm) for gyro #4. This rate was quite acceptable forcollecting relativity data. Three days later, gyro #2 was spun up to full speed, also without incident. It reached afinal spin rate of 87 Hz (5,220 rpm). Helium leakage from its spin-up caused gyro #4 to spin-down from 105.8Hz to 91 Hz.While both of these spin rates were acceptable for the science phase, the team decided to postpone the full-speedspin-up of gyros #3 and #1 for a little over a week in order to run both ground-based and on-orbit tests, in anattempt to both increase the spin rates of the final two gyro rotors and also reduce the helium leakage during thespin-up process. During the last week in July, gyros #3 and #1 were spun up to full speed. Each of these gyrospin-ups caused approximately a 15% decrease in spin rate of the other gyros, resulting in the final spin ratesshown in Table 2-1 below.Table 2-1. Final gyro spin ratesGyro # Final Spin Rate (Hz) Final Spin Rate (rpm)1 80 48002 62.3 37383 82.7 49624 65.5 39302.4.1.6 Gyro Spin Axis AlignmentThe final gyro spin rates were smaller than originally anticipated, but they were more than adequate for meetingour science requirements. However, these slower spin rates affected the process of spin axis alignment towardsthe end of the IOC period. Before beginning to collect spin axis precession data from the gyros, their spin axesmust initially be aligned with the guide star. This alignment is accomplished by the Gyro Suspension System(GSS), in conjunction with the SQUID magnetometer readouts, by applying small torques to the gyro rotors to“nudge” their spin axis positions into alignment with the direction of the guide star, as indicated by thetelescope readout.The spin axis alignment algorithm was designed with the assumption that the gyros would be spinning in therange of 120-170 Hz (7,200-10,200 rpm). At these very high spin rates, the gyro develops a significantcentrifugal bulge, and the GSS uses this bulge as a “handle” for applying the torque to nudge the rotor’s spinaxis. However, at slower spin rates, this centrifugal bulge is smaller than the natural out-of-round shape of therotor, so the SQUIDs and GSS must apply the spin axis alignment torques to the natural, polhode modulated,shape of the rotor, rather than the more predicable centrifugal bulge of fast spinning rotor. The torquesgenerated under these circumstances are very small, and they require ground processing of rotor informationand manual adjustment of the phasing and timing of the torque commands. Thus, it takes more time to alignthe spin axes of the gyros when they are spinning slowly. In fact, the smaller the level of imperfections in therotors, the longer it takes the GSS to complete the alignment. As an example, gyro #4 is apparently so perfectlyspherical that it took over two weeks longer than the other three gyros to align its spin axis.46 March 2007 Chapter 2 — Overview of the <strong>GP</strong>-B Experiment & Mission
2.4.1.7 Proton Bombardment & Other ContingenciesWhile ATC tuning, gyro spin-up, and spin axis alignment accounted for most of the IOC time extension, othercontingencies contributed as well. One of the most serious anomalies of the mission occurred in the secondweek, when the spacecraft was passing over the Earth’s south magnetic pole and it was bombarded by protonradiation from the Sun. This radiation caused data errors in the spacecraft’s primary (A-side) computer, whichexceeded its capacity for self-correction. By design, the spacecraft automatically switched over to the backup (Bside)computer, placed the spacecraft in a safemode, and put the planned timeline of events on hold. Theautomatic switch-over from primary to backup computer worked flawlessly. The <strong>GP</strong>-B mission operations teamre-booted and re-loaded the A-side computer and then switched back to it, using up a few days of contingencytime in the IOC time line.Another unexpected issue that required a few days of contingency time to work through occurred at the veryend of the IOC period. The spacecraft had entered back-up drag-free mode in preparation for the transition tothe science phase of the mission. However, the team noticed that excess helium was being expended by themicro thrusters to maintain drag-free flight, and this ultimately led to the discovery of an unexpected forcealong the roll axis of the spacecraft. This force was analyzed over a period of approximately two weeks and somecomponents of this force, which were attributed to thruster bias were countered. Ultimately, the ATC was tunedto work around this force without excess expenditure of helium.2.4.1.8 Science Phase Trade-off DecisionBecause the dewar was launched with enough superfluid helium to support a total mission time line of 16-18months, the extra time required by IOC resulted in a trade-off decision: More optimization/calibration of theinstrument prior to entering science, with a shorter data collection period; or, less optimization/calibration,with a longer data collection period. At that time, we concluded that the best overall accuracy would be achievedby ensuring the science instrument was optimally calibrated from the start, even if this meant collecting data fora shorter period than hoped. An added benefit of this decision is that we gained a considerably betterunderstanding of the spacecraft subsystems and science instrument than was originally anticipated at that stageof the mission.2.4.2 Weekly Summary of IOC AccomplishmentsTable 2-2 below provides a week-by-week list of the tasks and activities accomplished during the IOC phase. Amore detailed chronicle of the entire <strong>GP</strong>-B flight mission, based on weekly updates/highlights sent out via emailand posted on the <strong>GP</strong>-B Web site from 2 April 2004 through 30 September 2005 by the <strong>GP</strong>-B Public AffairsCoordinator, is included in Appendix C, Weekly Chronicle of the <strong>GP</strong>-B Mission.Table 2-2. Weekly summary of IOC accomplishmentsWeekly Summary of IOC AccomplishmentsWeek Activities CompletedWeek 1 Launch/Orbit InjectionTurn on PayloadSQUIDs (meet noise spec)Operate science gyroscopes in analog modeOperate science telescope electronicsTurned off a stuck-open (but redundant) micro thrusterWeek 2 Operate gyroscopes 1,2 and 4 in digital modeSun-radiation-induced switch to B side computer and flawless recovery<strong>Gravity</strong> <strong>Probe</strong> B — <strong>Post</strong> <strong>Flight</strong> Analysis • Final <strong>Report</strong> March 2007 47
Table 2-2. Weekly summary of IOC accomplishments (Continued)Weekly Summary of IOC AccomplishmentsWeek Activities CompletedWeek 3 All 4 gyroscopes digitally suspended for over 1 weekPracticed Low Temperature Bakeout (Reduces residual He gas pressure)Resulted in 0.001-0.010 Hz science gyroscope spinsWeek 4 Flew position drag-free for 1 st time (gyro 1)ATC system used roll stars to roughly align to guide starBegan series of small maneuvers (dwell scans) to locate guide starWeek 5 Completed magnetic flux reduction: all gyroscopes have very low trapped magnetic flux(desirable situation)A second thruster was turned off due to stuck thruster caused indirectly by the magnetic fluxreductionWeek 6 Sent a low flow of spinup gas (2 sccm for 90 seconds duration) to each gyroscopeEach gyro spun to approximately 0.3 HzMicroHz/Hr spindown rates confirm clean gyroscopesWeek 7 Locked onto IM Pegasi with the science telescopeBegan performing science calibration testsSuccessfully demonstrated the ability to discharge the science gyroscopes to spec (15 mV)Week 8 Verified IM Pegasi by visiting two neighboring starsSuccessfully tested the control effort based drag-free system for 1 orbitWeek 9 Increased the spacecraft roll rate from 0.1 to 0.3 rpm allowing mass trimPerformed updates on gyro biases to improve science performanceWeek 10 Increased the spacecraft roll rate from 0.3 to 0.9 rpm (the maximum for the mission) for liquidhelium bubble wrapApplied 120% of science gyro spinup voltages as a stress/health test: all gyroscopes workedperfectlyCompleted practice of science calibrations of gyroscopesWeek 11 Uploaded new ATC software to provide improved drag-free performance with the turned offthrustersRequired turning off the flight computer and rebootingProcedure was perfectly executedWeek 12 Spun the 4 science gyroscopes to approximately 3 HzFull flow rate of spinup gas for 90 secondsReduced roll rate to 0.5 rpmSelected science roll rate to be 0.52 rpmWeek 13 Successfully demonstrated extended drag-free operationFull Speed Spin of Gyro #4 to 106 HzFull Speed Spin of Gyro #2 to 88 HzWeek 14 ATC Filter TuningCoarse Spin Axis Alignment Gyros #2 and #448 March 2007 Chapter 2 — Overview of the <strong>GP</strong>-B Experiment & Mission
Table 2-2. Weekly summary of IOC accomplishments (Continued)Weekly Summary of IOC AccomplishmentsWeek Activities CompletedWeek 15 Spinup of gyro 3Spinup of gyro 1Week 16 Coarse Spin Axis Alignment - all gyrosdrag-free and Science Mode TestingWeek 17 Roll up to 0.75 rpmATC AdjustmentsWeek 18 ATC AdjustmentsFine Spin Axis AlignmentWeek 19 Roll up to .77419 rpm ( 77.5 sec period)Fine Spin Axis AlignmentATC AdjustmentsGyros #1, #2, and #3 transition to science modeWeek 20 Spacecraft flying drag-free around gyro #3Gyros #1, #2, and #3 in science mode, collecting dataGyro #4 continuing spin axis alignmentWeek 21 Spacecraft flying drag-free around gyro #3Gyros #1, #2, and #3 in science mode, collecting data.Gyro #4 spin axis slowly moving towards target alignment orientationWeek 22 Spacecraft flying drag-free around gyro #3Gyro #4 completes spin axis alignment and transitions into science modeGyros #1, #2, and #3 continue collecting data in science modeWeek 23 Gyro #3 transitioned out of drag-free mode to analog back-up;Drag-free flight re-established around gyro #1All four gyros in science mode, collecting data.Heat pulse meter test on dewar indicates remaining mission lifetime of 9.9 months, or a totalestimated dewar lifetime of 15.2 months. (The actual dewar lifetime was17.3 months.)2.4.3 Overview of Main IOC TasksFollowing are descriptions of the main tasks accomplished during the IOC phase of the mission.2.4.3.1 Orbit Trim ManeuverThe insertion of the <strong>GP</strong>-B spacecraft into orbit by the Boeing Delta II launch vehicle was so perfect that no orbittrim was required during IOC. Prior to launch, it was anticipated that orbit trim could have potentially been thelongest running task during the IOC period. Instead, all of the superfluid helium that would have been requiredfor trimming the spacecraft’s orbit was available for IOC contingencies.<strong>Gravity</strong> <strong>Probe</strong> B — <strong>Post</strong> <strong>Flight</strong> Analysis • Final <strong>Report</strong> March 2007 49
2.4.3.2 Guide Star AcquisitionAbout 24 hours after launch, the flight software, and specifically the ATC system, automatically began theprocess of acquiring the guide star, which, for a number of reasons, turned out to be more difficult and timeconsumingthan anticipated. As noted in section “Micro Thruster & Star Tracker Issues” above, it becameapparent shortly after launch that the conventional star trackers, located on either side of the spacecraft, werenot properly identifying reference stars, resulting in erratic spacecraft attitude control. This problem was loggedby the ARB as anomaly #5 on Mission Day #1, and it was assigned a medium level of severity. (See Appendix D,Summary Table of <strong>Flight</strong> Anomalies.)This problem persisted throughout the first month of the mission. Through considerable analysis and testing,the ATC and ARB teams determined that space vehicle conditions (mass imbalance, alignments, and startracker settings) were generating data that the star tracker processing algorithm was unable to successfullyprocess. Actions taken to correct this problem included all of the following:1. Switching to a magnetometer-based attitude determination algorithm.2. Adjusting magnitude and error gate thresholds.3. Tuning control gyro biases.4. Updating star tracker alignment matrices.5. Updating the guide star acquisition procedure based on ATC performance in orbit.In addition, the process of locking onto the guide star was delayed by various other issues that arose on orbit,such as proton radiation that caused a switch over to the B-Side on-board computer, mechanical problems withtwo of the 16 micro thrusters, and thruster instability resulting from a pressure build-up in the dewar followinga flux reduction procedure.By the beginning of June 2004, the pointing error of the spacecraft had been reduced to within 385 arcseconds(0.11 degrees) of the guide star, allowing the science telescope to track IM Pegasi over a portion of a spacecraftroll cycle. Further fine tuning of the ATC continued over the following two weeks, and during the second weekin June, the telescope finally locked onto IM Pegasi.The process of locking the science telescope onto IM Pegasi started with star trackers on either side of thespacecraft locating familiar patterns of stars. Feedback from the star trackers was used to adjust the spacecraft'sattitude so that it was pointing to within a few degrees of the guide star. The telescope's shutter was then opened,and a series of increasingly accurate “dwell scans” were performed to home in on the star. Since the spacecraftwas rotating along the axis of the telescope, imbalance in the rotation axis could cause the guide star to move inand out of the telescope's field of view. Feedback from the telescope was sent to the ATC system, which adjustedthe spacecraft's attitude until the guide star remained in view of the telescope throughout multiple spacecraftroll cycles. The ATC was then commanded to “lock” onto the guide star.Finally, to verify that the telescope was locked onto the correct guide star, the spacecraft was pointed at a knownneighboring star, HD 216635 (SAO 108242), 1.0047 degrees north of IM Pegasi. When the telescope waspointed at this location, the neighboring star appeared with anticipated brightness, and there were no otherstars in the immediate vicinity. Thus, the sighting of the star, HD 216635, confirmed the correct relationshipbetween the locations of the two stars, ensuring that the telescope was indeed locked onto the correct guide star.In a similar maneuver, the star HR Peg (HR 8714), a brighter and redder star, located less than half a degree tothe west of IM Pegasi, was also seen in the telescope, further confirming that we had properly locked onto IMPegasi.During the week of 20 June 2004 (Mission Week #10), we increased the spacecraft roll rate from 0.3 rpm to 0.9rpm in order to carry out mass trim and liquid helium bubble wrap procedures that balance the spacecraftaround its center of mass. (See the following two sections for descriptions of these procedures.) Primarily as aresult of the significantly increased spacecraft roll rate, the telescope came unlocked from the guide star, as50 March 2007 Chapter 2 — Overview of the <strong>GP</strong>-B Experiment & Mission
eported in the Anomaly Review Board (ARB) Observation #71. (See Appendix D, Summary Table of <strong>Flight</strong>Anomalies.) In analyzing this situation, the ATC team, in consultation with the ARB, identified three factorsthat most likely contributed to the star trackers renewed failure to correctly identify star patterns:1. Gyro bias errors—at the time we had rolled up to 0.9 RPM, roll and attitude errors are greatly magnifiedat this high roll rate, making the precise setting of control gyro hardware biases difficult. We did notspend enough time collecting data at this roll rate, in order to obtain an accurate prediction of gyrobiases.2. Incorrect gate strategy—this involves setting a software “gate,” in the flight database, that tells the startrackers (in degrees) how large a “window” to put around a potential star, and how big a region to searchin the star catalog. At 0.9 rpm, it appears we had too large a gate.3. Star attitude correction weighting gain—this sets how far the vehicle's attitude reference “steers” awayfrom a misidentified star, thereby preventing further star updates. Basically, the gain was set too low.During IOC, the vehicle was in mode 2A, using star trackers to help update the attitude error estimate.During the science mission, the star trackers update only the spacecraft roll; they have no effect on X/Yattitude. This is not an issue for the science mission, where the science telescope alone provides X/Yattitude error estimates.Following the mass trim and liquid helium bubble wrap operations, the spacecraft’s roll rate was decreased to0.52 rpm, and revised ATC software that addressed both star tracker and malfunctioning thruster issues wasuploaded to the spacecraft and installed on the on-board computer. The revised software resulted in asignificant improvement in attitude control, and on 3 July 2004, the science telescope re-locked onto the guidestar, with the spacecraft rolling at 0.52 rpm.Throughout the month of July, the ATC team continued to fine tune the ATC parameters in an attempt tooptimize drag-free performance at 0.52 rpm, and also to decrease the amount of time required for the telescopeto re-lock onto the guide star each time the spacecraft emerged from its eclipsed state behind the Earth. By thelast week in July, ATC parameter tuning had reduced the time required to re-lock onto the guide star from asmuch as 15 minutes to less than one minute. In addition, the number of reference stars “seen” by the startrackers was increased from three to eight.Finally, during the second week in August 2004, the spacecraft roll rate was increased from 0.52 rpm to 0.75rpm (and eventually to 0.7742 rpm) in order to improve the signal-to-noise ratio of the science data with thegyros spinning more slowly than anticipated. This final increase in spacecraft roll rate was well tolerated by therevised ATC parameters, and since they were implemented, the telescope was more consistently able to re-lockonto the guide star as it emerged over the North Pole each orbit for the remainder of the mission.2.4.3.3 Mass Trim SequencesAfter launch, the center of mass and products of inertia of the space vehicle can be corrected by moving some orall of the seven mass trim mechanisms (MTM). The process to operate the MTMs includes analysis on theground of ATC data (to see what forces and torques are required to hold attitude), generation of commands,and then execution of special mass trim sequences. The mass trim procedures were conducted during the thirdweek in June.The mass trim procedure is somewhat similar to dynamically spin balancing an automobile tire. Weightsmounted on long screw shafts are attached in strategic locations around the spacecraft frame, and small motors,under control of the spacecraft’s ATC, can turn these screw shafts in either direction, causing the weights tomove back and forth by a specified amount. Based on feedback from the GSS, the spacecraft’s center of mass canthus be precisely positioned to place the vehicle’s center of mass on the desired vehicle roll axis. (A very limitedcapability exists to position the fore/aft mass center, but none of this trimming was performed)<strong>Gravity</strong> <strong>Probe</strong> B — <strong>Post</strong> <strong>Flight</strong> Analysis • Final <strong>Report</strong> March 2007 51
A second mass trim operation had been scheduled after the spacecraft was placed in drag-free mode for thescience phase of the mission, but this was not necessary. In fact, no further mass trim refinements were everrequired.2.4.3.4 Space Vehicle Roll Up / Liquid Helium Bubble WrapThe space vehicle separated from the launch vehicle rolling at 0.1 rpm. During IOC the roll rate wasincrementally increased to 0.9 rpm for two reasons:1. To get better insight into adjusting the Mass Trim Mechanisms (MTM)2. To mass balance the space vehicle by wrapping the liquid helium bubble uniformly around the inside ofthe dewar wall.In addition to the mass trim operation performed mid-June, the so-called “bubble wrap” procedure wasperformed at the same time. During the bubble wrap procedure, the spacecraft’s roll rate was increased inincremental steps, from 0.3 rpm to 0.9 rpm. The increased roll rate begins to rotate the liquid helium, effectivelypushing it outwards by centrifugal force. This process is intended to wrap the liquid helium uniformly aroundthe inner wall of the dewar shell. Distributing the liquid helium uniformly along the spacecraft’s roll axis helpsto ensure that the science telescope can remain locked on the guide star while the spacecraft is rolling.Following the bubble wrap and mass trim procedures, the spacecraft’s roll rate was decreased incrementallyfrom 0.9 rpm back to 0.5 rpm. During the first roll-down decrement to 0.7 rpm, we discovered that thedistribution of the liquid helium in the dewar is less predictable during roll-down than it is during roll-up.When the spacecraft’s roll rate is slowed too quickly, the liquid helium begins to slosh around. The resultingdisplacement of the center of mass from the sloshing helium affects the micro thrusters, resulting in a significantincrease in the time required to complete the roll-down.2.4.3.5 Drag-Free OperationsDrag-free operations were first practiced during the third week of IOC. The term, “drag-free,” means that theentire spacecraft literally flies in its orbit around one of the gyros; this compensates for friction or drag in orbit.Signals from the Gyro Suspension System (GSS) are used by the ATC system to control the position of thevehicle, via the output of the micro thrusters, to fly the spacecraft around the selected gyro.The <strong>GP</strong>-B spacecraft can fly using either a primary or a back-up drag-free mode. In primary drag-free mode, theGSS suspension control efforts are turned off on one of the gyros, so that no forces are applied to it. The ATCuses feedback from the position of the designated drag-free gyro in its housing to “steer” the spacecraft, keepingthe gyro centered. Back-up drag-free mode is similar, but in this case the GSS applies very light forces on thegyro to keep it suspended and centered in its housing. The ATC uses the GSS to “steer” the spacecraft so that therequired GSS forces are made very low.The initial Drag-Free Control (DFC) checkout used the back-up drag-free mode and lasted 20 minutes, asplanned. Then, a two-hour DFC session was tested, during which the spacecraft roll rate was increased and thenreturned to its initial rate, maintaining drag-free status throughout the test. Then, three weeks later in mid June2004, after turning off the two malfunctioning micro thrusters, primary drag-free mode was successfully tested.Both drag-free modes continued to be tested periodically throughout July and August for varying lengths oftime. When the gyros were spinning slowly, back-up drag-free mode yielded more stability.Though primary drag-free control would be preferred due to the absence of forces acting upon a gyro andresulting in a data source free of any outside disturbance, analysis of on-orbit data confirmed that eitherprimary or back-up drag-free mode would meet the science needs of the mission. Towards the end of IOC,exhaustive testing demonstrated that primary drag-free required more helium mass flow than desired, whileback-up drag-free was both robust and reliable, and thus it was chosen to be used during the science phase.52 March 2007 Chapter 2 — Overview of the <strong>GP</strong>-B Experiment & Mission
2.4.3.6 Spinning Up the GyrosSpinning up the <strong>Gravity</strong> <strong>Probe</strong> B gyroscopes is a delicate and complex process that required over half the IOCperiod to complete. Each of the science gyros underwent a series of incremental spin-up and testing sequences,gradually increasing its speed to the final spin rate for the science phase of the mission. Following is a summaryof the whole process, as it actually happened during IOC.Within the first three days of the mission, all four Gyro Suspension Systems (GSS) were activated, and each ofthe gyros underwent a “lift check” to ensure that the suspension systems were working properly. These were thefirst suspensions of the <strong>GP</strong>-B gyros in orbit, and all were successful. Within the first two weeks in orbit, thegyros were first suspended in analog mode, and then, one by one, they were digitally suspended. The analogsuspension mode is used primarily as a backup suspension mode. With digital suspension, the GSS uses acomputer to provide the primary gyro suspension.Approximately one month into the mission, the team began spinning up the gyros. In preparation for spin-up,the digital suspension system for each gyro was first tested. This was accomplished by suspending each gyro inthe center of its housing, electrically “nudging” it slightly off center in one of eight directions (the corners of acube), and monitoring its automatic re-centering. This checkout was first performed under low-voltageconditions (fine control) and then under high-voltage conditions (secure hold).To begin the actual spin-up process, ultra-pure helium gas was flowed over gyro #1 and gyro #4 for 15 seconds,which started them spinning at approximately 0.125 Hz (7.5 rpm). While these gyros were slowly spinning, thesuspension test was repeated under high voltage conditions on gyros #2 and #3. During this high-voltagesuspension test on gyro #3, the team discovered an error in its command template, which turned off the highvoltageamplifier to gyro #1 and caused it to lose suspension. There was no damage to gyro#1.At this point in the mission, more than 1,000 commands had been sent to the Gyro Suspension System (GSS),and this was the first error found. Discovering an error in these numerous, intricate command templates wasexactly the kind of situation that the painstaking gyro spin-up process was designed to identify; it enabled theteam to correct the command template for gyro #3 without serious consequences. Also, as a further precaution,the team thoroughly reviewed the command templates for the remaining three gyros. By the end of May 2004,gyros #2 and #3 were spinning at 0.26 Hz (15 rpm) and 0.125 Hz (7.5 rpm) respectively, and gyro #1 was in theprocess of being spun-up.The first week in June, the team started performing a highly methodical and painstaking series of calibrationtests on the four science gyroscopes. These tests began at very low gyro spin rates of 0.333 Hz (20 rpm) or lessand involved briefly applying voltages asymmetrically to the suspension electrodes on a given gyro, causing thatgyro rotor (sphere) to move off center by a few micrometers -or less, and then re-centering it.Carrying out these tests at very slow spin rates enabled the team to check out the software command templatesthat control the tests, without risk of damage to the gyro rotors or housings, which could occur at higher speeds.In fact, during these initial calibration tests, the team discovered that the performance characteristics of thegyros on orbit are slightly different from the simulator predictions on which the original command templateswere based. As a result of these differences, during one of the initial tests, gyro #4 touched one of its electrodesand stopped spinning. A simple modification to the spin-up command templates corrected the problem.Calibration testing of the gyros at spin rates less than 1 Hz (60 rpm) continued throughout the month of June.By the third week in June, the performance characteristics of each of the gyros was understood, and the resultsof this testing were used to fine-tune the GSS for each gyro. This significantly improved the suspensionperformance of all the gyros, especially gyro #2.<strong>Gravity</strong> <strong>Probe</strong> B — <strong>Post</strong> <strong>Flight</strong> Analysis • Final <strong>Report</strong> March 2007 53
On Friday, 2 July 2004, the spin rates of gyros #1 and #3 was increased to 3 Hz (180 rpm), by streaming purehelium gas through their spin-up channels for 90 seconds each, and a few days later, gyros #2 and #4 werelikewise spun-up to 3 Hz (180 rpm). Note that the exact spin rate of the gyros cannot be controlled. Rather, wecontrol the length of time that ultra-pure helium gas flows through the spin-up channel for each gyro, and thenthe SQUID readouts tell us the resulting spin rates—which may differ slightly from one gyro to another.During the week of July 4 th , helium gas was flowed over gyro #4 for another 90 seconds, increasing its spin rateto approximately 6 Hz (360 rpm), and a number of tests were subsequently performed to ensure that gyro #4and its suspension system were functioning properly in preparation for full-speed spin-up. Then, on 13 July2004, <strong>Gravity</strong> <strong>Probe</strong> B achieved a major milestone with the successful spin-up of gyro #4 to a science-readyspeed of 105.8 Hz (6,348 rpm). Second to the launch, the full-speed spin-up of the gyros was the next most longawaitedevent in the history of <strong>GP</strong>-B. Members of the team were very attentive at their stations in the MissionOperations Center (MOC) here at <strong>Stanford</strong> for 3 hours and broke into applause when the final announcementcame over the MOC intercom that the gyro #4 full spin-up had been completed successfully.On July 16 th , gyro #2 underwent the same spin-up procedure, reaching a final spin rate of 87 Hz (5,220 rpm).Spinning up the gyros to science-ready speed is a complex and dynamic operation that exercises the fullcapabilities of the Gyro Suspension System (GSS) and requires a high level of concentration and coordinationon the part of the <strong>GP</strong>-B Team. Following is an overview of the full-speed spin-up process.First, commands are sent to the GSS to move the gyro rotor (sphere) very close to the spin-up channel (about1/100th of the edge of a sheet of paper) in one half of the gyro’s housing. Ultra-pure (99.999%) helium gas isstreamed from the Gas Management Assembly (GMA), mounted in a bay on the spacecraft frame, throughtubing that enters the “top hat” (the thermal interface at the top of the <strong>Probe</strong>) and travels down to the gyrohousings in the Science Instrument Assembly (SIA) at the lower end of the <strong>Probe</strong>. As the helium gas descendsinto the <strong>Probe</strong>, which is at a temperature of approximately 2.7 Kelvin, the gas cools down from 273 Kelvin toaround 12 Kelvin.Before entering the spin-up channel in one of the gyro housings, the gas is passed through a combinationfilter/heater. The filter, which is made of sintered titanium, removes any particles that may have been carried bythe helium on its journey into the <strong>Probe</strong>. The heater enables the helium to be warmed slightly, which increasesits adhesion to the ultra-smooth surface of the gyro rotor. The filtered and warmed helium then passes throughthe spin-up channel in one half of the gyro housing, and most of the gas evacuates into space through anexhaust system. However, some of the helium gas leaks into the housings of the other gyros, causing their spinrates to decrease up to 20% over a full spin-up period of 2-3 hours.For this reason, the order in which the gyros are spun up is very important. Earlier in the IOC phase, the 3 Hz(180 rpm) spin-up provided information on the helium leakage rate of each gyro. Gyro #4, which had thehighest leakage rate, was spun-up to full speed first, so that helium leaked from its spin-up would not affectother gyros that were already at science mission speed. The remaining gyros are then spun-up in decreasingorder of their helium leakage rates—gyro #2, gyro #1, and finally, gyro #3.Each full-speed spin-up takes most of a day. In the morning, helium gas is flowed over the gyro for 90 seconds,and tests are run to ensure that the helium leakage rate for that gyro corresponds to previous measurements. Ifeverything checks out, the full-speed spin-up, in which helium gas is flowed over the rotors for 2-3 hours,commences early in the afternoon. The <strong>GP</strong>-B team controls the spin-up process by sending commands from theMission Operations Center (MOC) here at <strong>Stanford</strong> to the spacecraft in real-time. For example, they sendcommands to open or close the GMA valves to flow helium through the gyro’s spin-up channel. They alsocontrol the amount of heat applied to the gas before it enters the gyro spin-up channel, and they controlopening and closing of exhaust valves. Real-time telemetry provides immediate feedback on the progress of thespin-up so that various parameters can be adjusted as necessary.54 March 2007 Chapter 2 — Overview of the <strong>GP</strong>-B Experiment & Mission
The successful spin-up of gyro #4 to full speed enabled us to spin-up gyro #2. Gyro #2 topped out at 87 Hz(5,220 rpm). Also, the helium gas leakage from the Gyro 2 spin-up slowed gyro #4 down to 91Hz (5,460 rpm).Based on these results, the team postponed the full-speed spin-up of gyros #3 and #1 for over a week, in order torun both ground-based and on-orbit tests, in an attempt to both increase the spin rates of the final two gyrorotors and also reduce the helium leakage during the spin-up process. From the results of these tests, the teamdetermined that the gyro rotors could be positioned up to 30% closer to their spin-up channels during the spinupprocess and still maintain a safe margin of clearance from the suspension electrodes and housings.Using this finding, during the last week in July, gyros #3 and #1 were spun up to full speed. Each of these gyrospin-ups caused a 15% decrease in spin rate of the remaining gyros, resulting in the final spin rates ranging fromapproximately 60 – 80 Hz (3,600 – 4,800 rpm). Table 2-3 below shows the history of the spin rates for all fourgyros over the course of the entire spin-up process.Table 2-3. Spin-up history of the <strong>GP</strong>-B gyros<strong>GP</strong>-B's Gyro Spin-up Results (Hz)Date 13-Jul 16-Jul 28-Jul 30-JulGyro # Gyro 4 Spinup Gyro 2 Spinup Gyro 3 Spinup Gyro 1 SpinupCumulative AvgSpin-down1 1.6 1.2 0.3 80.02 1.6 87.0 75.7 62.33 1.6 1.4 100.4 82.74 105.6 90.5 79.5 65.5Spin-up Impact on other Gyros1 na na na na2 na na -13.0% -17.7%3 na na na -17.7%4 na -14.3% -12.2% -17.6%Average Spindownna -14.3% -12.6% -17.7% -15.4%Although all four gyros ended up spinning at less than half the spin rates initially anticipated, their spin rateswere more than adequate for collecting relativity data. Furthermore, several other accomplishments achieved bythe <strong>GP</strong>-B subsystems during IOC—especially extremely low SQUID noise and higher than planned spacecraftroll rate—effectively reduced the error factor in the <strong>GP</strong>-B science experiment, thereby partially compensatingfor the reduced spin rates of the gyros.2.4.3.7 Low Temperature BakeoutFollowing gyro spin-up was the low temperature bakeout (LTB) process. The gyro spin-up process leavesresidual helium gas in and around each of the science gyros. If not removed, this helium gas could reduce theaccuracy of the experimental data collected during the Science Phase of the mission by providing a higher thandesired gas pressure in the <strong>Probe</strong>, and thus causing the gyroscopes to spin down faster than requirements. Thelow temperature bakeout process involved applying a very mild heat cycle to the Science Instrument Assembly,briefly raising its temperature from 1.8 kelvin to approximately 7 kelvin. The net effect of this procedure was toremove nearly all of the residual helium. A cryogenic pump, comprised of sintered titanium, collected theremaining helium from the gyro housings. After low temperature bakeout, the SIA temperature was restored to1.8 kelvin.<strong>Gravity</strong> <strong>Probe</strong> B — <strong>Post</strong> <strong>Flight</strong> Analysis • Final <strong>Report</strong> March 2007 55
Low temperature bakeout was first practiced in May, during the third week of the mission. This practice LTBprocedure had the added benefit of imparting a very small amount of spin-up helium gas to the gyros. Followingthe practice LTB, the SQUID gyro read-out data revealed that gyro #1, gyro #3, and gyro #4 were slowlyspinning at 0.001, 0.002, and 0.010 Hz, respectively (1 Hz = 60 rpm). The Gyro Suspension Systems (GSS) wereable to measure gas spin-up forces at the level of approximately 10 nano-newtons. This meant that the <strong>GP</strong>-Bscience team is able to interpret data from gyro spin rates four to five orders of magnitude smaller than whatwas planned for the <strong>GP</strong>-B science experiment.The final low temperature bakeout procedure was performed during the first week in August, following the finalhigh-speed spin up of all four gyros. This process yielded a post-LTB pressure inside the vacuum probe of1x10 –11 Torr, or 100,000 times less than 1x10 -6 Torr in the external space vehicle low Earth orbit (LEO)environment.2.4.3.8 Spin Axis AlignmentAfter gyro spin-up, the spin axis direction of each gyro had to be closely aligned to the guide star. This wasperformed using the Gyro Suspension System (GSS) in a special mode to slowly align each gyro spin axis to bein a certain orientation nearly parallel to the line of sight to the guide star. The gyroscopes were oriented anumber of arc-seconds away from the apparent line of sight to the guide star so that over the mission, with thepredicted relativistic precession and expected annual pointing aberration taken into account, the averagemisalignment of the gyroscopes would be zero. This minimized the possibility of disturbance torques on therotors and enhanced the accuracy of the spin axis measurement process.There were two phases to this alignment process—coarse and fine. During the coarse alignment, as much as onedegree of spin axis orientation correction was achieved. The fine axis alignment then provided the finalorientation accuracy of better than 10 arcseconds relative to the target orientation.At the end of July 2004, after all four gyros had been spun-up to full speed, coarse spin axis alignmentcommenced. As noted in section 2.4.1.6 above, the lower than anticipated spin rates of the gyros, coupled withthe nearly perfect sphericity of the gyro rotor surfaces, made the process of aligning the spin axes of some of thegyros—particularly gyro #4— more difficult and more time consuming.Coarse spin axis alignment was completed on gyros #1 and #3 during the first week in August 2004, and the spinaxes of gyros #2 and #4 were coarsely aligned by the middle of August. Fine spin axis alignment thencommenced on all four gyros. Gyros #1, #2, and #3 completed their alignment and transitioned into science(data collection) mode during the last week in August. Gyro #4 required a little over two extra weeks tocomplete fine spin axis alignment and transition to science mode.2.4.3.9 Electrostatic Discharge of the Gyro RotorsAn ongoing concern during the <strong>Gravity</strong> <strong>Probe</strong> B mission has been to minimize the build-up of electrostaticcharges on the gyro rotors. The rotors build up a charge in two ways: 1) the process of suspending the rotorstransfers some change between the housing and rotor surface, and 2) protons from the sun are constantlybombarding the spacecraft, especially over the South Atlantic Ocean—the so-called “South AtlanticAnomaly”—and some of these protons strike the rotors and leave a deposit charge on them. Furthermore,various tasks such as gyro spin-up may impart a charge to the rotors.Thus, periodically during the IOC phase, the team exercised an electrostatic discharge procedure, which usesultraviolet light to reduce the electrostatic charge on the rotors. Each gyro housing is fitted with two fiber-opticcables that run from the gyro housings, up through the top hat of the <strong>Probe</strong> and out to an ultraviolet light sourcein the Experiment Control Unit (ECU) box, mounted on the spacecraft frame. UV light was beamed throughthe fiber optics onto the gyro rotors to discharge them. As a result of the light shining on metal surfaces in therotor housing, electrons are liberated from the surface of the metal and create a cloud of electrons between the56 March 2007 Chapter 2 — Overview of the <strong>GP</strong>-B Experiment & Mission
housing and rotor surface. A charge control electrode, controlled via the Gyro Suspension System is biased to acertain voltage level to either drive electrons onto or off of the rotor surface, thus affecting the overall charge onthe rotor. The suspension system then measures the charge on the rotor via a force balance technique, and thecharging/discharging process stops when the rotors are within 15 mV of zero. Typically, the rotor charge is heldto within 5 mV of ground potential during normal science operations. Reducing the level of charge wasimportant because it increased the sensitivity and accuracy of the Gyroscope Suspension System (GSS) andreduced some disturbance torques on the rotors.2.5 Science PhaseThis section provides an overview and summary of the 5-week science phase of the mission which began on 27August 2004 and ran through 14 August 2005.2.5.1 Overview of the Science PhaseFollowing IOC, the mission transitioned into the science phase, where the essential science data were collected.This phase officially began on 27 August 2004 (Mission Day #129, Mission Week #20) with the transition ofgyros #1, #2, and #3 into science mode. The gyroscopes were fully configured for the science phase once theiraxes had been aligned with the guide star, as described in section 2.4.3.8 and their rotors had beenelectrostatically discharged as described in section 2.4.3.9. Gyroscopes #1, #2, and #3 were all discharged andaligned by 27 August, 2004. However, gyro #4 required an additional 2 1/2 weeks to complete its spin axisalignment, which occurred on 16 September 2004 (Mission Day #149). Since each of the gyroscopes isindependent of the others, gyros #1, #2, and #3 began providing science data at the end of August, and gyro #4followed in mid-September.2.5.1.1 Mission Lifetime DeterminationsDuring the week of 20 September 2004 (Mission Week #23), we performed a heat pulse meter operation on thedewar to determine its cryogenic lifetime, and in turn, the anticipated length of the science and subsequentinstrument calibration phases of the mission. The results of this test, and several more performed at varioustimes throughout the science phase, indicated that the helium remaining in the dewar would supportapproximately 10 months of science data collection and one month of instrument calibrations.In fact, all of the heat pulse meter helium lifetime predictions that we made during the science phase of themission turned out to be based on an incorrect assumption about the thermal connection between the liquidand gas phases of helium inside the dewar, leading to overly conservative helium lifetime predictions. We wereactually able to collect science data for 11.5 months, followed by 1.5 months of instrument calibration testing.2.5.1.2 Transitioning from IOC to Data CollectionUpon commencement of the science phase, the science team began storing data with a “SCI” prefix so that itwould be clear to all users this was valid science data. The anomaly team also separated its IOC record keepingfrom the new science documentation. Our daily 10 am meeting was moved to 11 am to allow the science teamextra time to analyze the data, thereby making the meeting more meaningful.The science phase was much quieter than the very busy IOC phase, although there still was important work eachday requiring completion in a timely manner. The daily work load generally decreased as the science phaseprogressed. By the end of this phase, operations ran very smoothly, and were punctuated only by the occasionalanomaly.<strong>Gravity</strong> <strong>Probe</strong> B — <strong>Post</strong> <strong>Flight</strong> Analysis • Final <strong>Report</strong> March 2007 57
2.5.1.3 Lockheed Martin Team Phase-OutAn important shift in personnel took place when the IOC was completed. The Lockheed Martin team, whichhad supported the program as a very major contributor prior to launch, and as a co-contributor during IOC,phased out as IOC neared completion. Some of the subsystems, such as power, software, thermal, and othershad been transitioned to <strong>Stanford</strong> personnel as IOC progressed. These systems were performing flawlessly, andrequired little or no commanding to maintain. The most challenging of the LM subsystems, the ATC system didrequire daily attention and very regular commanding. In this system, LM did remain on board with full-timesupport for a few months after the completion of IOC. In this very challenging system, <strong>Stanford</strong> was ramping upa 3-4 person team. Although the team members were young and less experienced than the LM team, theirenthusiasm and capabilities of a <strong>Stanford</strong> Master’s degree were quickly recognized. In addition to their innatestrengths, the IOC period had been an exceptional training ground for the team.2.5.1.4 Science Phase Routine ActivitiesAfter entering the science phase the team continued to monitor the gyroscopes and spacecraft very closely.Although all of the systems were working well, there were a small number of important updates required eitheron a weekly or more frequent basis. The biases on the spacecraft control non-science rate gyroscopes thatrequired updating approximately twice a week. This process was important to minimize the guide star capturetime for each acquisition. (It was thereby held to less than a minute.)The spacecraft's stored program computer loads were transitioned from daily products to three uploads perweek. This transition was possible because of the increasingly routine nature of the operations. This change wasalso important because of the reduced team size, and the need to allow adequate team rest. It should be repeatedthat the team had worked extremely long hours during IOC. It was important to provide a more reasonablework environment once the space vehicle no longer required intensive care.2.5.1.5 Science Phase AnomaliesDuring the science phase, 3 major anomalies, 3 medium anomalies, 3 minor anomalies, and 65 observationswere logged by the <strong>GP</strong>-B Anomaly Review Team. The relatively rare true anomalies that occurred during thescience phase required immediate attention. The anomaly resolution process used during IOC was continued inthe science phase. A discussion of the anomaly resolution process is described in Chapter 5, ManagingAnomalies and Risk , and a complete summary of all on-orbit anomalies and observations is available inAppendix D, Summary Table of <strong>Flight</strong> Anomalies. During IOC, a significant effort was expended to minimizethe recovery time from anomalies in order to expedite the overall IOC schedule. For some anomalies thatoccurred during the science phase, there was additional motivation to minimize anomaly recovery time,because mis-pointing, non-standard drag-free performance, and other non-science configurations not only putthe validity of the data at risk, but also increased the risk of causing higher than nominal gyroscope torques.Thus, during the science phase, the team worked hard to minimize the recovery process, and these efforts paidoff.2.5.1.6 Early Calibration Tests During the Science PhaseIt will be seen in the next section that like IOC, the calibration phase was on a very tight schedule and thereforewas tension-packed. To help reduce the scope of work required for the calibration phase, and ultimately toimprove the overall experimental error, many SRE tests were performed during the final month of the sciencemission. These tests were performed at this point in the mission for two main reasons:1. These tests were of low technical risk.2. The science data were not impaired by the impact of these tests.58 March 2007 Chapter 2 — Overview of the <strong>GP</strong>-B Experiment & Mission
In other words, the gyroscopes were maintained such that they could be returned to their science configurationafter the SRE testing was complete. Although the science analysis of these tests is still ongoing at the time of thewriting of this report, from an operational perspective no issues or problems arose.2.5.2 Monthly Science Phase HighlightsTable 2-4 below provides a month-by-month overview of the science phase of the mission. For a more detailed,weekly description of activities that occurred during the science phase, see Appendix C, Weekly Chronicle ofthe <strong>GP</strong>-B Mission.Table 2-4. Monthly highlights of the <strong>GP</strong>-B Science PhaseMonthly Highlights of the <strong>GP</strong>-B Science PhaseMonth Activities & EventsSeptember 2004 Gyros #1, #2, and #3 generating science data.Continued tuning of the ATC system.Drag-free gyro #3 transitions to analog suspension. Drag-free control transferred to gyro #1;identified cause as data spike in GSS, and re-suspended gyro #3 digitally.Gyro #4 completes spin axis alignment and begins collecting science data.Heat pulse meter test indicates ~10 months of helium available for the science phaseSympathetic resonance observed in drag-free controller due to sloshing wave on surface ofhelium in the dewar.October 2004 All four gyros continue generating science data.Gyro #3 again transitions to analog suspension; bridge setting changed to increase signal-tonoiseratio. Cause determined to be GSS noise spikes that exceeded preset limits.Reduced gain on drag-free controller to mitigate harmonic coupling between ATC drag-freesystem and sloshing helium in the dewar.Drag-free gyro #1 transitions to analog suspension mode, just as gyro #3 had done. Switcheddrag-free control back to gyro #3 and changed bridge setting on gyro #1.November 2004 All four gyros continue generating science data.Large geo-magnetic storm increases solar activity, with a corresponding increase in highenergyproton radiation.Proton strike causes the GSS computer to re-boot, sending all four gyros into analog backupsuspension mode.Memory locations in SRE computer sustains multi-bit errors, causing the SRE to re-bootSpacecraft enters its second 15-day “full-sun” period of the mission towards the end of Nov.December 2004 All four gyros continue generating science data.Dewar’s helium flow rate adjusted for full-sun period.Warming of the Attitude Reference Platform (ARP) causes spacecraft pointing problems.Full-sun period ends.ATC adjusted to re-lock the telescope on the guide star after each GS-Invalid period.<strong>GP</strong>S triangulation problem causes computer overflow, triggering safemodes.January 2005 All four gyros continue generating science data.Worst solar storm since 2003 results in saturation of telescope detectors, causing temporaryloss of guide star and non-critical MBE in SRE computer.Proton monitor stops working properly.<strong>Gravity</strong> <strong>Probe</strong> B — <strong>Post</strong> <strong>Flight</strong> Analysis • Final <strong>Report</strong> March 2007 59
Monthly Highlights of the <strong>GP</strong>-B Science PhaseMonth Activities & EventsFebruary 2005March 2005April 2005May 2005All four gyros continue generating science data.Problematic sun spots from January return, but this time with no geo-magnetic storm; overthe course of the month, solar activity returns to normal.ATC fine-tuning enable science telescope to lock onto guide star at the beginning of GSVperiods in less than one minute.Another heat pulse meter test run to check helium life time; results consistent with previoustest.Brief communications outages at Poker Flats and Wallops Ground Stations; data laterrecovered from Poker flats, but not from Wallops. Total data loss to date < 1%.Star sensor magnitude tables updated.All four gyros continue generating science data.Proton radiation strikes over South Pole, resulting in multiple MBEs in main CCCA computerand triggering automatic switch-over to B-Side (backup) computer.Experience from prior switch-over during 2nd week of mission, plus rehearsals enableMission Ops team to cut recovery time from a week down to a weekend.3 MBEs in
Monthly Highlights of the <strong>GP</strong>-B Science PhaseMonth Activities & EventsJune 2005July 2005August 2005All four gyros continue generating science data.Preliminary non-torquing SRE calibrations tests continue.Spacecraft full-sun period ends.Gyro #2 transitions to analog backup suspension mode and is subsequently re-suspended indigital mode.Benign MBEs discovered in SRE are patched via ground commands.Forward feed term of drag-free controller updated to improve accuracy based on 13 monthsof flight data.Another heat pulse meter test is run; results continue to indicate late August-early Septemberhelium depletion date.Switched drag-free control from gyro #3 to gyro #1 as part of ongoing calibration tests.All four gyros continue generating science data.With sun now shining on aft section of spacecraft, ATC performance now most stable ofentire science phase.Benign MBEs in GSS computer patched via ground commands.Calibration tests on drag-free gyro #3 cause it to switch to analog suspension; gyro #3 issubsequently re-suspended digitally.Visit from Tony Lyons & Tony Lavoie from NASA MSFC; off-site management meeting held todiscuss end-of-mission trade-offs between length of science and calibration phases.Poker Flats, AK ground station communication problems require temporary switch toMcMurdo ground station at South Pole.UV light used once again to remove electrostatic charge from al four gyro rotors;Dr. Anne Kinney, Director of Universe Division in the Science Mission Directorate at NASA HQspends a day visiting <strong>GP</strong>-B.All four gyros continue generating science data.Preliminary instrument calibration tests continue.A final heat pulse meter test is run and again confirms previous predictions of late August -early September helium depletion date.Based on the results of the heat pulse meter tests, as well as other helium lifetime estimates,science data collection concluded on August 12. In total, the mission collected science datafor 352 days (11.6 months) during 7,000+ orbits, with a 99% data capture rate.Dr. Nancy Roman, retired Chief of Astronomy & Relativity Programs at NASA Headquartersfrom 1960-1979, who oversaw the early development of <strong>GP</strong>-B visited <strong>Stanford</strong> for two days.Rex Geveden, former MSFC Program Manager for <strong>GP</strong>-B was appointed Associate NASAAdministrator at NASA Headquarters.Final instrument calibration tests, which required pointing the <strong>GP</strong>-B telescope & spacecraft atneighboring stars in the vicinity of guide star IM Pegasi commenced.2.6 Calibration PhaseThis section provides an overview and summary of the activities that occurred during the final 6-weekcalibration phase of the mission.<strong>Gravity</strong> <strong>Probe</strong> B — <strong>Post</strong> <strong>Flight</strong> Analysis • Final <strong>Report</strong> March 2007 61
2.6.1 Overview of the Calibration PhaseThe purpose of the post-science calibration phase was to perform tests to allow the placing of tight limits onsystematic errors and gyroscope torques. A natural tension existed in choosing the correct moment to end thescience phase and to begin the calibration phase. The technical underpinnings of this tension can be understoodas follows. The total experiment error is the sum of three different types of error (plus the exact knowledge ofthe proper motion of the guide star). These three error sources are:1. Statistical measurement error,2. Systematic errors3. Gyroscope torques.The overall experiment measurement error improves as the duration of the science data taking is increased.Systematic errors, however, do not. Furthermore, some systematic errors and gyroscope torques may not bedirectly evident from the science data and may require on-orbit tests to set upper limits on their effect.Therefore a longer calibration phase reduces the impact of systematic errors and gyroscope torques at theexpense of statistical measurement error. The purpose of the calibration phase was therefore to enhance variouspossible systematic error sources so that tighter limits could be placed on each, thereby reducing the overallexperiment error. This technical balance had to be blended with an important programmatic issue; riskmanagement.During the science phase each of the gyroscopes had a spin rate of more than 60 Hz. or a stored kinetic energyof more than 1 joule. Based upon years of ground test, there was a concern that a de-levitation of a gyroscopewould damage not only that gyroscope, but put the other gyroscopes at some risk as well. Since the calibrationphase required a number of new commands to be performed, the sequence of testing was adjusted to performthe low risk operations first. Another risk involved the possibility that calibration phase would not be completedprior to the depletion of the liquid helium. The final schedule for this phase involved performing a number ofGSS tests followed by a 2 week break. The purpose of the break was to allow the team to assess the adequacy ofthe tests and to allow time to generate new commands that were determined to be needed to support the scienceteam.In choosing to perform the GSS tests first, some of the gyroscopes could be kept in science mode while theothers were GSS tested. Gyroscopes 2 and 3 entered the post-science calibration phase on July 7, 2005.Gyroscopes 1 and 4 entered the post-science calibration phase on August 15, 2005.A series of ATC tests followed the GSS tests. (GSS tests on gyroscopes 1 and 4 were also completed during thisfinal stage of the mission.) The most important of these ATC tests involved intentionally mis-pointing the spacevehicle to allow investigation of resulting gyroscope torques. A series of these tests were performed. These testswere not believed to be of high hardware risk (i.e. the risk of a gyroscope de-levitation was thought to be low,there was a consensus that the risk of schedule slippage was significant. For many of the mis-pointingoperations, the vehicle was to acquire a star other than IM Pegasi. There was a very real concern that findingthese other stars could be problematic and time consuming. In practice, just like the GSS phase which precededit, the operations went off without a hitch. By the end of this period, moving back and forth between stars hadbecome almost routine. The team had learned a tremendous amount during the IOC and science phases.2.6.2 Weekly Calibration Phase HighlightsTable 2-5 below provides a month-by-month overview of the science phase of the mission. For a more detailed,weekly description of activities that occurred during the final calibration phase, see Appendix C, WeeklyChronicle of the <strong>GP</strong>-B Mission.62 March 2007 Chapter 2 — Overview of the <strong>GP</strong>-B Experiment & Mission
Table 2-5. Weekly highlights of the 7-week final instrument calibration phaseWeekly Highlights of the <strong>GP</strong>-B Final Calibration PhaseWeek Activities & EventsWeek ending 8/19 Final calibration phase begins on Monday, August 14th when drag-free control on gyro #1was turned off, and gyro preloads were set to IOC levels of 10 volts.The telescope & spacecraft were maneuvered to point a the star HD216235, 1 degree awayfrom IM Pegasi.The spacecraft returned to its guide star orientation, and drag-free control was restored for aday.The calibration excursions to HD216235 were repeated four more times over the course ofthis week.Week ending 8/26 On Monday, the telescope & spacecraft were maneuvered to the star Zeta Pegasi (HR 8634),located 7 degrees away from IM Pegasi. This pointing orientation was maintained for ~30 hrs.On Wednesday, the spacecraft’s orientation was returned to IM Pegasi.On Thursday and Friday, DC mis-centering tests were performed on gyros #1, #2, and #4.At the end of the week, GSS torque calibrations were performed on gyros #1 and #4.Week ending 9/2 Although heat pulse meter tests had suggested that the helium would be depleted by thisday, some amount of liquid helium still remained in the dewar, and thus calibration testscontinued this week.On Wednesday, the telescope & spacecraft were maneuvered to point to the star HR Pegasi, 4degrees away from IM Pegasi in the east-west plane (all previous slewing tests had been inthe north-south plane).On Thursday & Friday, several slewing tests were made to “virtual stars” less than one degreeaway from IM Pegasi in various directions. (Virtual stars don’t actually exist; they are simplyposition markers at pre-determined distances from the guide star, IM Pegasi.)Tony Lyons, <strong>GP</strong>-B Program Manager from MSFC, joined the team at <strong>Stanford</strong> for this week ofcalibration tests.Various other slewing tests, in which the telescope/spacecraft was pointed at locations in thevicinity of IM Pegasi continued throughout the weekend.Week ending 9/9 Heat pulse meter tests had predicted that the helium in the dewar would be depleted by thebeginning of this week, but like the Energizer Bunny that keeps on running, the helium in thedewar kept on flowing. Thus, planned calibration tests continued.Over the weekend, we visited virtual stars located 0.1 degrees away from star HD216635, aneighbor of IM Pegasi, remaining pointed at the virtual star for 24 hours and then returningto IM Pegasi for 16 hours. We then repeated this procedure with a virtual star located 0.1degrees in the opposite direction.On Tuesday, we visited a virtual star located halfway to the star HR Pegasi (HD216672),located to the West of IM Pegasi and remained pointed there for 24 hours. We then slewedthe telescope/spacecraft back to IM Pegasi.On Thursday, we visited a virtual star 0./3 degrees towards HD216635 and remained there for24 hours.We continued these “slewing” tests during the weekend, visiting virtual star locations withina 4 degree radius of IM Pegasi.<strong>Gravity</strong> <strong>Probe</strong> B — <strong>Post</strong> <strong>Flight</strong> Analysis • Final <strong>Report</strong> March 2007 63
Weekly Highlights of the <strong>GP</strong>-B Final Calibration PhaseWeek Activities & EventsWeek ending 9/16 The virtual “helium level gauge” in the dewar was clearly in the “red zone,” but when thehelium would actually run out was now anyone’s guess. So, planned calibration testscontinued.Over the weekend, after running more slewing tests, we locked back onto IM Pegasi andswitched drag-free control from gyro #1 to gyro #3 in order to perform calibration tests ongyro #1.During the gyro #1 calibration test, the pressure in the dewar dropped, causing thrusterinstability. To mitigate this situation, we switched the thrusters to “open-loop,” and theyremained in this state for the duration of the calibration tests.On Tuesday, we slewed the telescope/spacecraft to the very bright star, Alpha Pegasi (Markabor HD 218045), located 3.25 degrees South of IM Pegasi. We remained locked on Alpha Pegasifor 12 hours, before returning to IM Pegasi and switching drag-free control back to gyro #1.On Wednesday, we sent commands to the spacecraft to decrease its roll rate from 0.7742 rpmto 0.4898 rpm and changed the frequency of a SQUID calibration signal that was causinginterference at this slower roll rate. The spacecraft was then able to perform nominally at thenew roll rate.On Friday, we initiated procedures to remove electromagnetic flux from the SQUIDs.Week ending 9/23 Because the helium in the dewar had now exceeded its expected lifetime by more than 3weeks, the dewar team re-calculated the helium lifetime tests based on a new assumption—that there was weak, rather than strong thermal contact between the liquid and gas layers ofhelium in the dewar. This new assumption put an upper bound on the helium lifetime thatwas 5-6 weeks longer than the initial assumptions. Thus, it now appeared that the heliumcould last up to 3 weeks longer.Over the weekend, we completed the process of removing electromagnetic flux from theSQUIDs.On Tuesday, we visited a virtual star 0.1 degrees east of IM Pegasi and remained locked in thatposition for 48 hours. While the telescope was locked in this position, we performed somedark current calibration tests on the telescope.During this week, we twice attempted to switch from backup to primary drag-free mode.Both attempts failed, and in each case, we returned to backup drag-free control, which hadbeen used throughout the science phase of the mission. Analysis indicated that these failedswitch-overs were due to configuration issues.Week ending 9/30 This turned out to be the last week of the mission—the day the dewar “died.”On Monday, we once again attempted to switch from backup to primary drag-free control,and once again, the attempt failed—but for a different reason than the two attempts madethe previous week. Preliminary analysis indicated that this failed switch-over was similar toones that occurred during IOC and was probably due to “un-modeled” forces between thegyro rotor and its housing.On Tuesday and Wednesday, the team returned the spacecraft to its nominal science mode,pointing at IM Pegasi, and collected gyro data, later to be compared with similar datacollected during the science phase of the mission.On Thursday, 29 September 2005, at 1:55 pm PDT, the last of the liquid helium in the dewartransitioned to the gas phase, and the Science Instrument Assembly began to warm up.The team correctly assessed the status of the dewar, based on a set of pre-approvedindicators, and they initiated a planned helium depletion procedure.On Friday morning, we held our last daily “all-hands” meeting, took a group photo of theteam, and the <strong>GP</strong>-B flight mission was thus concluded.64 March 2007 Chapter 2 — Overview of the <strong>GP</strong>-B Experiment & Mission
3Accomplishments & Technology Innovations<strong>Gravity</strong> <strong>Probe</strong> B — <strong>Post</strong> <strong>Flight</strong> Analysis • Final <strong>Report</strong> March 2007 65
66 March 2007 Chapter 3 — Accomplishments & Technology Innovations
This section contains three main sub-sections: Goals & Accomplishments, Extraordinary Technology of <strong>GP</strong>-B,and <strong>GP</strong>-B Technology Transfer.3.1 Goals & AccomplishmentsThis sub-section begins with a description of seven “near zeroes” that form the basis of the <strong>GP</strong>-B experimentalmethod. The latter half of this sub-section lists a number of noteworthy accomplishments that <strong>GP</strong>-B hasachieved during its flight mission, from launch in April 2004 through the final instrument calibrations inSeptember 2005.3.1.1 <strong>GP</strong>-B’s Seven Near ZeroesDesigning a physics experiment involves a basic choice: maximize the effect to be measured, or minimize the“noise” that obscures it. For the <strong>Gravity</strong> <strong>Probe</strong>-B experiment, however, that choice was moot because Einstein'srelativistic effects, that literally “roar” near black holes and neutron stars, whisper almost inaudibly here onearth. Thus, <strong>GP</strong>-B had to turn the volume of the extraneous babble down as close to zero as possible in order tohear the whisper. It's like asking everyone in a football stadium to sit quietly to hear a bird sing.The noise affecting near-earth relativistic effects comes. From the slightest amount of heat or pressure, theinfluence of any magnetic field, any kind of gravitational acceleration, or the tiniest amount of atmosphericturbulence or solar radiation, to the smallest imperfections in the instruments themselves, the tolerances mustbe at or very “near zero.”It's hard to picture the precision of the <strong>Gravity</strong> <strong>Probe</strong> B instruments. The four gyroscopes, housings, andtelescopes were all carved out of a single purified quartz block, grown in Brazil, refined in Germany, anddelivered to <strong>GP</strong>-B as a trash-can-size crystal. From side to side, the crystalline structure of the quartz is identicaland homogenous to within three parts per million. The gyroscope spheres are less than 40 atomic layers from aperfect sphere, the most perfectly round objects ever made by man, so they could spin for literally severalthousand years without any significant drift. To put that in perspective, if the gyroscopes were enlarged to thesize of the Earth, the highest mountain or the deepest ocean trench would be only 8 feet. The electrical charge atthe gyroscopes' surfaces, known as the electric dipole moment, were likewise vanishing small, held to less thanfive parts in ten million.The isolation of the instruments from their surroundings is equally impressive. For 17 months, from prior tolaunch until the helium in the dewar was depleted at the end of the post-science instrument calibration phase ofthe mission, the entire <strong>GP</strong>-B science instrument was maintained in a near-perfect vacuum, surrounded bysuperfluid liquid helium, cooled to a temperature of ~1.8K (-271.4° celsius or -456.4° fahrenheit). The helium'stemperature was held constant, just above absolute zero, by the 650-gallon dewar, with its unique <strong>GP</strong>-B porousplug providing a controlled escape for the helium gas that boiled off continuously during the mission.To zero out unwanted magnetic fields, the <strong>Probe</strong> was encased in a cascading succession of four lead bags withinbags. After each of the first three bags was inserted, the outside bag was removed. Inside the remaining lead bag,remaining residual magnetic fields had been reduced to a negligible level, approximately 10 -11 of Earth’smagnetic field. In other words, there was almost a total absence of any magnetic fields inside the probe thatmight affect the results.Finally, and perhaps most impressive of all, is that throughout the flight mission, the <strong>GP</strong>-B spacecraft rolledcontinuously at a rate of 0.7742 rpm, pointing at the guide star, IM Pegasi, all the while maintaining a drag-freeorbit. Using the helium gas that continuously sweated out through the dewar’s porous plug as a propellant, eightopposing pairs of proportional micro thrusters enabled the spacecraft to precisely control its attitude andcontinually chase one of the science gyros, which was effectively circling the Earth in a perfect free-fall orbit.<strong>Gravity</strong> <strong>Probe</strong> B — <strong>Post</strong> <strong>Flight</strong> Analysis • Final <strong>Report</strong> March 2007 67
It was in this pristine, near-zero disturbance environment, that the <strong>GP</strong>-B gyroscopes spun in lonely isolation for50 weeks, collecting the data that has, at long last, put Einstein’s general theory of relativity to a rigorous andprecise experimental test.Table 3-1. <strong>GP</strong>-B Seven Near ZeroesExperimental Variable Tolerance Requirements Tolerances Achieved During MissionGyroscope Rotor Near ZerosMechanical Sphericity 50 nanometers (2 micro inches)
• In November 2005, the entire <strong>GP</strong>-B team was awarded a NASA Group Achievement Award “Forexceptional dedication and highly innovative scientific and engineering accomplishments leading to thesuccessful execution and completion of the <strong>Gravity</strong> <strong>Probe</strong> B Science Mission.”3.2 Extraordinary Technology of <strong>GP</strong>-BThis sub-section describes the extraordinary technologies, redundancy, and unique technological innovationsthat enabled the <strong>GP</strong>-B experiment to come to fruition.3.2.1 An Overview of <strong>GP</strong>-B TechnologyTo test Einstein's theory of general relativity, <strong>Gravity</strong> <strong>Probe</strong> B must measure two minuscule angles withspinning gyroscopes, floating in space. While the concept of <strong>Gravity</strong> <strong>Probe</strong> B is relatively simple in design, thetechnology required to build it is some of the most sophisticated in the world. Scientists from <strong>Stanford</strong>University, NASA's Marshall Space <strong>Flight</strong> Center, and Lockheed Martin Space Systems have drawn from adiverse array of physical sciences, and have invented much of the technology that made the mission possible. Infact, much of the technology did not even exist when the experiment was first suggested in late 1959 - early1960.3.2.1.1 World’s Most Perfect GyroscopesTo measure the minuscule angles predicted by Einstein’s theory, 6,614.4 milliarcseconds (6.6 areseconds) peryear and 40.9 milliarcseconds per year, <strong>Gravity</strong> <strong>Probe</strong> B needed to build a near-perfect gyroscope—one whosespin axis would not drift away from its starting point by more than one hundred-billionth of a degree each hourthat it was spinning. This was an especially stiff challenge, given that the spin axes of all gyroscopes tend to driftslightly while they are spinning. Even the spin axis drift in the most sophisticated Earth-based gyroscopes,found in missiles and jet airplanes, is seven orders of magnitude greater than <strong>GP</strong>-B could allow.Figure 3-1. <strong>Gravity</strong> <strong>Probe</strong> B gyroscope rotor, with quartz housing halves.<strong>Gravity</strong> <strong>Probe</strong> B — <strong>Post</strong> <strong>Flight</strong> Analysis • Final <strong>Report</strong> March 2007 69
Each quartz rotor is coated with a sliver-thin layer of niobium, a superconducting metal. Inside each housing,six electrodes electrically suspend the gyroscope, allowing it to spin freely at up to 10,000 rpm. Channels are cutin the quartz housing to allow helium gas to start the rotor spinning. A wire loop, embedded in the housing, isconnected to a SQUID (Superconducting Quantum Interference Device) magnetometer to detect any change indirection of the gyroscope’s spin axis.Three physical characteristics of any gyroscope can cause its spin axis to drift, independently of the generalrelativity precession predicted by Einstein’s theory:1. An imbalance in mass or density distribution inside the gyroscope2. An uneven, asymmetrical surface on the outside of the gyroscope3. Friction between the bearings and axle of the gyroscope.This meant that a <strong>GP</strong>-B gyroscope rotor had to be perfectly balanced and homogenous inside, had to be freefrom any bearings or supports, and had to operate in a vacuum of only a few molecules.After years of work and the invention of new technologies and processes for polishing, measuring sphericity,and coating, the result was a homogenous 1.5-inch sphere of pure fused quartz, polished to within a few atomiclayers of perfectly smooth. In fact, the <strong>GP</strong>-B gyro rotors are now listed in the Guinness Database of WorldRecords as being the roundest objects ever manufactured, topped in sphericity only by neutron stars.The spherical rotors are the heart of each <strong>GP</strong>-B gyroscope.They were carved out of pure quartz blocks, grown inBrazil and then fused (baked) and refined in a laboratory in Germany. The interior composition of each gyrorotor is homogeneous to within two parts in a million.On its surface, each gyroscope rotor is less than three ten-millionths of an inch from perfect sphericity. Thismeans that every point on the surface of the rotor is the exact same distance from the center of the rotor towithin 3x10 -7 inches.Here are two ways to imagine how smooth this is. First, compare the <strong>GP</strong>-B gyro rotor’s smoothness withanother smooth object—a compact disk. CD's and DVD's both appear and feel incredibly smooth. The pits onthe compact disk's surface, which carry the digital information, are less than 4/100,000ths of an inch deep (onemillionth of a meter). However, compared to the <strong>GP</strong>-B gyroscope, the surface of a CD is like sandpaper. Thebumps and valleys on the surface of the <strong>GP</strong>-B gyroscope are 100 times smaller than those on a CD. Viewed atthe same magnification, one could barely see any imperfections on the gyroscope's surface.Alternatively, imagine a <strong>GP</strong>-B gyroscope enlarged to the size of the Earth. On Earth, the tallest mountains, likeMount Everest, are tens of thousands of feet high. Likewise, the deepest ocean trenches are tens of thousands offeet deep. By contrast, if a <strong>GP</strong>-B gyroscope were enlarged to the size of the Earth, its tallest mountain or deepestocean trench would be only eight feet!Finally, the gyroscope is freed from any mechanical bearings or supports by levitating the spherical rotor withina fused quartz housing. Six electrodes evenly spaced around the interior of the housing keep the rotor floating inthe center. A stream of pure helium gas spins the gyroscopes up to 4,000 rpm or faster. After that, and with allbut a few molecules of the helium spin-up gas evacuated from the housings, each gyroscope spins, a mere 32microns (0.001 inches) from its housing walls, free from any interfering supports.3.2.1.2 Spinning SuperconductivityEach <strong>Gravity</strong> <strong>Probe</strong> B gyroscope is nearly perfectly spherical and nearly perfectly homogenous. While thisensures that the gyroscope will spin with near-perfect stability, its “near-perfectness” creates a dauntingchallenge—we cannot mark the gyroscope to see exactly which direction its spin axis is pointing.70 March 2007 Chapter 3 — Accomplishments & Technology Innovations
For <strong>GP</strong>-B to “see” the shape and motion of local spacetime accurately, we must be able to monitor the spin axisorientation to within 0.5 milliarcseconds, and locate the poles of the gyroscope to within one-billionth of aninch.How can one monitor the spin axis orientation of this near-perfect gyroscope without a physical markershowing where the spin axis is on the gyroscope? The answer lies in a property exhibited by some metals, called“superconductivity.”Superconductivity was discovered in 1911 by the Dutch physicist H. Kammerlingh Onnes. He found that attemperatures a few degrees above absolute zero, many metals completely lose their electrical resistance. Anelectric current started in a superconductor ring would flow forever, if the ring were permanently kept cold. But,superconductors also have other interesting properties. In 1948, the theoretical physicist Fritz London predictedthat a spinning superconductor would develop a magnetic moment—created by the electrons lagging the latticeof the superconducting metal—which is therefore exactly aligned with its instantaneous spin axis. In 1963, threedifferent groups, including a <strong>GP</strong>-B graduate student, demonstrated the existence of this London momentexperimentally.What is remarkable about this phenomenon (and most fortunate for <strong>Gravity</strong> <strong>Probe</strong> B) is that the axis of thismagnetic field lines up exactly with the physical axis of the spinning metal. Here was the “marker” <strong>Gravity</strong><strong>Probe</strong> B needed. We coated each quartz gyroscope with a sliver-thin layer of a superconducting metal, calledniobium (1,270 nanometers thick). When each niobium-coated gyroscope rotor is spinning, a small magneticfield surrounds it. By monitoring the axis of the magnetic field, <strong>Gravity</strong> <strong>Probe</strong> B knows precisely whichdirection the gyroscope's spin axis is pointing, relative to its housing.Figure 3-2. SQUID detector package, with housing coverThe magnetic field axis is monitored with a special device called a SQUID (Superconducting QUantumInterference Device). The SQUID is connected to a superconducting niobium pickup loop, deposited on the flatsurface at the outer edge of one half of the quartz housing in which the gyro rotor spins. Thus, the loop, whichsenses the gyro’s spin axis orientation, is located on the planar surface where the two halves of the gyro housingare joined. When the gyroscope precesses or tilts, the London moment magnetic field tilts with it, passingthrough the superconducting loop. This causes a current to flow in the loop—a quantized current. The SQUIDdetects this change in magnetic field orientation. The SQUID magnetometers are so sensitive that a field changeof only one quantum—equivalent to 5 x 10 -14 gauss (1/10,000,000,000,000th of the Earth's magnetic field) andcorresponding to a gyro tilt of 0.1 milliarcsecond (3x10 -8 degrees)—is detectable.<strong>Gravity</strong> <strong>Probe</strong> B — <strong>Post</strong> <strong>Flight</strong> Analysis • Final <strong>Report</strong> March 2007 71
Figure 3-3. Functional diagram of a SQUID pickup loop measuring the London Moment around a <strong>GP</strong>-B gyrorotor (left) and four SQUID readouts—one for each gyro (right).Using the London moment to monitor the gyroscope's orientation was the perfect readout scheme for <strong>Gravity</strong><strong>Probe</strong> B—it is extremely sensitive, extremely stable, applicable to a perfect sphere, and-most important, it exertsnegligible torques (forces) on the gyroscope.3.2.1.3 The Dewar: A 9’ Tall, 8’ Wide ThermosOne of the greatest technical challenges for <strong>Gravity</strong> <strong>Probe</strong> B was keeping the science instrument just aboveabsolute zero, at approximately 2.3 Kelvin (-270.9 celsius or -455.5 fahrenheit) constantly for 16 months orlonger.Figure 3-4. The <strong>GP</strong>-B dewar—one of the largest and most sophisticated dewars ever flownThe science instrument is kept at this supercold temperature, by placing it in a special 2,441 liter (645-gallon)dewar, or thermos, about the size of a mini van, that is filled with liquid helium in a superfluid state. This ninefoottall Dewar is the main structure of the <strong>GP</strong>-B satellite itself. In its 640-kilometer (400-mile) high polar orbit,the <strong>GP</strong>-B satellite is low enough to be subjected to heat radiating from the Earth's surface, and it is also subjectedto alternating hot and cold cycles, as it passes from intense sunlight into the Earth's shadow every ninety-sevenminutes. Throughout the life of the mission, key portions of the science instrument had to be maintained at aconstant temperature to within five millionths of a degree centigrade.72 March 2007 Chapter 3 — Accomplishments & Technology Innovations
Figure 3-5. Cross sectional schematic of the dewarDuring the mission, the dewar's insulating chamber remained a vacuum, which limited the amount of heatpenetrating through the outside wall into the inner chamber containing the science instrument. In addition, itincludes several other devices for maintaining the necessary cryogenic temperature:1. Multilayer insulation—multiple reflective surfaces in the vacuum space to cut down radiation2. Vapor-cooled shields—metal barriers, suitably spaced, cooled by the escaping helium gas3. Porous Plug—invented at <strong>Stanford</strong>, and engineered for space at NASA Marshall Space <strong>Flight</strong> Center inHuntsville, AL, Ball Aerospace in Boulder, CO, and the Jet Propulsion Laboratory in Pasadena, CA. Thisplug allows helium gas to evaporate from the Dewar's inner chamber, while retaining the superfluidliquid helium inside. See section 3.2.3.1for a more complete description of the porous plug.When there was still helium in the dewar, virtually no heat could penetrate from the outside wall through thevacuum and multilayer insulation inside. However, a small amount of heat (about as much as is generated bythe message indicator lamp on a cell phone) did leak into the Dewar from two sources:1. Conduction of heat flowing from the top of the Dewar into the liquid helium2. Radiation leaking down through the telescope bore into the liquid helium.The porous plug controls the flow of this evaporating helium gas, allowing it to escape from the Dewar, butretaining the superfluid helium inside. The plug is made of a ground-up material resembling pumice. Theevaporating helium gas climbed the sides of the inner tank near the plug and collected on its surface, where itevaporated through the pores in the plug, much like sweating in the human body.The evaporating helium provided its own kind of refrigeration. As the helium gas evaporated at the surface ofthe porous plug, it drew heat out of the liquid helium remaining in the Dewar, thereby balancing the heat flowinto the Dewar. You can feel this effect on your skin when you swab your skin with water. As the liquidevaporates off your skin, it draws heat energy with it, leaving your skin a tiny bit cooler than before.The helium gas that escaped through the porous plug was cycled past the shields in the outer layers of theDewar, cooling them (thus the name, “vapor-cooled shields”), and then it was used as a propellant for eightpairs of micro thrusters that are strategically located around the spacecraft.<strong>Gravity</strong> <strong>Probe</strong> B — <strong>Post</strong> <strong>Flight</strong> Analysis • Final <strong>Report</strong> March 2007 73
Based on data from the on-board telescope and the gyroscope that was used as a proof mass for maintaining adrag-free orbit, the flow of the escaping helium gas was carefully metered through these thrusters in order toprecisely control the spacecraft's position. In fact, the position of the entire spacecraft was balanced around theproof mass gyroscope by increasing or decreasing the flow of helium through opposing thrusters, creating adrag-free orbit. Thus, the Dewar and liquid helium served two critically important functions in the mission:1. Maintaining a supercold temperature around the science instrument.2. Providing a constant stream of gas propellant for precisely controlling the position and attitude of theentire satellite.3.2.1.4 The Realization of Drag-Free Technology<strong>Gravity</strong> <strong>Probe</strong> B is the first spacecraft ever launched requiring six degrees of freedom in active attitude control—three degrees of freedom in pointing control to maintain its guide star pointing orientation and constant rollrate (pitch, yaw, and roll) and three degrees of freedom in translational control (up-down, front-to-back, andside-to-side), to maintain a drag-free orbit throughout the 17-month flight mission.The term “drag-free” refers to a body that is moving without any friction or drag, and thus its motion is affectedonly by gravity. Here on Earth, and even 642 km (400 miles) above the Earth where the <strong>GP</strong>-B satellite is in orbit,there is always some drag caused by the Earth's atmosphere, solar pressure, and other forces. However, a bodycan achieve drag-free motion if it is shielded by another body. A drag-free satellite, therefore, refers to afeedback system consisting of a satellite within a satellite. The inner satellite, often called a proof-mass, istypically a small homogeneous object, such as a spherical <strong>GP</strong>-B gyroscope. The position of the outer shieldingsatellite must be tightly controlled to prevent it from ever touching the proof mass. This is accomplished byequipping the outer satellite with sensors that precisely measure its position relative to the proof mass and a setof thrusters that automatically control its position, based on feedback from the sensors. Through this feedbacksystem, the satellite continually “chases” the proof-mass, always adjusting its position so that the satelliteremains centered about the proof mass, which is orbiting the Earth in a constant state of free fall. The drag-freefeature of the <strong>GP</strong>-B spacecraft is critically important to the experiment because orbital drag on the spacecraftwould cause an acceleration that might obscure the minuscule relativistic gyro precessions being measured.Figure 3-6. Proportional micro thrusters used for <strong>GP</strong>-B spacecraft attitude control<strong>GP</strong>-B needs extremely sensitive thrusters to re-orient the satellite and keep it on its proper path. Here's wherethe escaping helium gas that slowly boils off from the liquid helium comes in handy. Minute amounts of gas,1/10th of a human breath or a few millinewtons of force, provide just the right amount of thrust necessary toadjust the satellite's position.74 March 2007 Chapter 3 — Accomplishments & Technology Innovations
The first, and only other 3-axis drag-free controller ever flown was called DISCOS (DISturbance COmpensationSystem). It was developed in the late 1960s as an offshoot of <strong>GP</strong>-B under the leadership of Professor Dan DeBra,then head of the Guidance & Control Laboratory in the <strong>Stanford</strong> Aero-Astro Department, and a Co-PrincipalInvestigator on <strong>GP</strong>-B. DISCOS was the central drag-free control module in the three-module TRIAD I satellite,a test vehicle developed to improve the accuracy of the U. S. Navy’s Transit satellite navigation system. Transitsatellites enable ships to locate their positions on the Earth's surface by reference to orbit data stored on boardthe satellite, but earlier ones had been limited by uncertainties in orbit prediction arising from atmosphericdrag. The DISCOS module was specifically designed to address this problem. The other two modules in theTRIAD I satellite were developed by the Applied Physics Laboratory (APL) at Johns Hopkins University, underthe leadership of Robert Fischell. The TRIAD I satellite, with its central DISCOS module, was launched onSeptember 2, 1972 and flew in a polar orbit at 750 km for a little more than a year and achieved drag-freeperformance of 5x10 -12 g for the entire mission. Subsequently, the Navy built two more satellites in the TRIADseries, followed by three satellites in the NOVA series. All of these subsequent satellites contained only singleaxisdrag-free control, the development of which also included significant contributions by <strong>Stanford</strong> faculty andgraduate students.3.2.1.5 Telescope & Guide StarIn the <strong>GP</strong>-B science instrument, enclosed within the <strong>Probe</strong>, along the central axis of the dewar, a 36 centimeter(14 inch) long Cassegrain reflecting astronomical telescope, with a focal length of 3.8 meters (12.5 feet), isbonded, using a hydroxide catalyzed bonding process, to the end of the quartz block that houses the gyroscopes.Together, the telescope and the quartz block form the Science Instrument Assembly (SIA). Hydroxide catalyzedbonding is a method of fusing together quartz parts, without the use of any glue or fasteners, that was developedand patented by the <strong>GP</strong>-B team at <strong>Stanford</strong>. This was necessary for the SIA not to distort or break when cooledto the cryogenic temperatures required for superconductivity used by the gyroscopes. The telescope's line ofsight provided a reference for measuring any drift in the gyroscopes' spin axis over the life of the experiment.During the science phase of the mission, the telescope had to remain focused on a distant stable referencepoint—a guide star. Furthermore, it had to remain fixed on the center of this guide star within a range of +/- 20milliarcseconds throughout the science phase of the mission. The resulting telescope signal was continuouslysubtracted from the gyroscope signal at the 0.1 milliarcsecond level to determine the amount of spin axisprecession of each gyroscope.Figure 3-7. A pre-flight prototype of the Cassegrain telescope on-board the <strong>GP</strong>-B spacecraft<strong>Gravity</strong> <strong>Probe</strong> B — <strong>Post</strong> <strong>Flight</strong> Analysis • Final <strong>Report</strong> March 2007 75
Ideally, the telescope should have been aligned with a distant quasar (massive bodies, located in the most distantreaches of the universe, which put out powerful radio emissions), because they appear to be fixed in theirposition and would thus provide an ideal, stable reference point for measuring gyroscope drift.However, quasars are too dim for any optical telescope this size to track. So, instead, the telescope was focusedon a brighter, nearby “guide star.” But, like the Sun, nearby stars move relative to the other stars in our galaxy,and their light diffracts or scatters as it travels through the universe. This situation posed two difficult challengesto the experiment:1. Choosing a guide star whose motion could be mapped relative to quasars separately, so that the <strong>Gravity</strong><strong>Probe</strong> B gyroscope measurements can ultimately be related to the distant universe.2. Creating a means for the telescope to find and remain focused on the exact center of a star whose light iswidely diffracted.3.2.1.5.1 Choosing a Guide Star and mapping its proper motionIn order to precisely map the motion of a star relative to a quasar, it was necessary to find a star that met all ofthe following criteria:• Correct position in the heavens for tracking by the on-board telescope (for example, the sun never gets inthe way)• Shines brightly enough for the on-board telescope to track• Is a sufficiently strong radio source that can be tracked by radio telescopes on Earth• Is visually located within a fraction of a degree from the reference quasarIt so happens that stars that are radio sources belong to binary star systems. Because almost half the star systemsin the universe are binary, it initially seemed that there would be many good candidates for the guide star.However, out of 1,400 stars that were examined, only three matched all four of the necessary criteria. The starthat was chosen as the <strong>GP</strong>-B guide star is named IM Pegasi (HR 8703).Figure 3-8. Tracking the guide star, IM Pegasi, with the <strong>GP</strong>-B telescopeLike all stars in our galaxy, the position of IM Pegasi as viewed from Earth and our science telescope changesover the course of a year. In fact, IM Pegasi moves around its binary partner in a spiraling pattern, rather than alinear path. The total motion of IM Pegasi in one year alone is 100 times larger than the smallest gyroscope spin76 March 2007 Chapter 3 — Accomplishments & Technology Innovations
axis precession measurable with <strong>Gravity</strong> <strong>Probe</strong> B. Thus, throughout the science phase of the mission, the <strong>GP</strong>-Bscience telescope was tracking a moving star, but gyros were unaffected by the star's so called “proper motion;”their pointing reference was IM Pegasi's position at the beginning of the experiment. Consequently, in the gyroprecession data for each orbit, it is necessary to subtract out the telescope's angle of displacement from itsoriginal guide star orientation so that the angular displacements of the gyros can be related to the telescope'sinitial position, rather than its current position each orbit. For this reason, a very accurate map of the propermotion of IM Pegasi is required in order to complete the <strong>GP</strong>-B data analysis.Because IM Pegasi is a radio source, its proper motion can be tracked by a sophisticated system of radiotelescopes, operating in conjunction with each other. This system is called Very Long Base Interferometry orVLBI. Using radio telescopes from New Mexico to Australia to Germany, acting as a single radio telescope thesize of the Earth, a team at the Harvard-Smithsonian Center for Astrophysics (CfA) led by astrophysicist IrwinShapiro, in collaboration with astrophysicist Norbert Bartel and others from York University in Canada andFrench astronomer Jean-Francois Lestrade have now mapped the motion of IM Pegasi with respect to areference quasar over a number of years to an unprecedented level of accuracy. With these measurements themotions of the <strong>GP</strong>-B gyroscope spin axes can now be related to the reference quasar in the distant universe.However, to ensure the integrity of the <strong>GP</strong>-B experiment, we added a “blind” component to the <strong>GP</strong>-B dataanalysis by requesting that the CfA withhold the proper motion data that will enable us to pinpoint the orbit-byorbitposition of IM Pegasi until the rest of our <strong>GP</strong>-B data analysis is complete. Therefore, the actual precessionangles of the <strong>GP</strong>-B gyros with respect to the distant universe, will not be known until the end of the data analysisprocess.3.2.1.5.2 Dividing the Guide Star ImageDiffraction is a light-scattering phenomenon that spreads the image of a distant star when viewed through atelescope. Any finite sized telescope, even one with perfectly polished mirrors, focuses the light from a distantstar to a non-zero spot size, known as the diffraction limit of the telescope. For the precision pointingmeasurements being made by <strong>GP</strong>-B, it was necessary to locate the optical center of the guide star image in thetelescope to an accuracy of 0.1 milliarcsecond (0.001arcsecond or 3x10 -8 degrees). The diffraction limit size ofthe <strong>GP</strong>-B telescope is ~1.4 arcseconds, which is about 14,000 times larger than the required pointing accuracy,and this presented a formidable challenge to the <strong>GP</strong>-B team. The solution was to precisely split the image intoequal x-axis and y-axis components, and then to divide each of the axis components into two half images whosebrightness values can be compared.<strong>Gravity</strong> <strong>Probe</strong> B — <strong>Post</strong> <strong>Flight</strong> Analysis • Final <strong>Report</strong> March 2007 77
Figure 3-9. Schematic diagram of starlight image division in the <strong>GP</strong>-B telescopeAs shown in Figure 3-9, <strong>GP</strong>-B accomplishes this task by focusing the mirror-reflected starlight in the ImageDivider Assembly (IDA) at the telescope's front end, and passing it through a beam-splitter (a half-silveredmirror). The beam-splitter forms two separate images, each of which falls on a roof-prism (a prism shaped like apeaked rooftop). The prism slices the star's image into two half-disks, which are focused onto two silicon photodiodes at opposite ends of the Detector Mount Assemblies (DMA), shown in Figure 3-9.On the DMA sensors, the light signals of each half-disk are converted to electrical signals and then compared. Ifthe signals are not precisely equal, this means that the roof-prism is not splitting the image precisely in half. Theposition of the entire spacecraft is then adjusted until the signals are equal and the image is split right down themiddle. When this is accomplished in both sensors for each (x and y) axis, then the telescope is locked on theexact center of the guide star. The flight telescope on-board the <strong>GP</strong>-B spacecraft was capable of pointing to thecenter of the guide star with an accuracy of 0.5 milliarcseconds (1.4x10 -7 degrees) per orbit.3.2.2 Redundancy in <strong>GP</strong>-B Systems and TechnologyUnderlying the entire <strong>GP</strong>-B experiment is a philosophy of redundancy that has been built into the <strong>GP</strong>-Bspacecraft and all of its subsystems. Following is a description of this redundancy.3.2.2.1 Gyroscope RedundancyAt the highest level of the <strong>GP</strong>-B experiment, redundancy begins with the four gyroscopes. We actually need onlyone gyroscope to perform the <strong>GP</strong>-B experiment, but since it is unlikely that this experiment will ever berepeated, it seemed prudent to build redundancy into the experiment itself. Having four gyros obviouslyprovides backup in case one, two, or even three gyros should fail during the mission. More important, however,having multiple gyroscopes provides built-in crosschecks on the relativity data. In other words, a high degree ofcorrelation in data collected from four independent gyros provides greater confidence in the results than datacollected from a single gyro, or even two gyros—especially if the results should differ from the predictions ofgeneral relativity.78 March 2007 Chapter 3 — Accomplishments & Technology Innovations
3.2.2.2 Gyro Suspension System RedundancyAn independent Gyro Suspension System (GSS) computer controls each of the gyros. Each GSS computer isconnected to a single gyro, so they cannot be used interchangeably. Each of the GSS computers has two gyrosuspension modes—analog and digital—that provide a form of redundancy in the gyro rotor suspension. Theanalog suspension mode is used primarily as a backup or safe mode for suspending the gyros. The digitalsuspension mode is computer-controlled; it puts less torque on the gyros than analog mode and enables theirposition to be controlled with extremely high precision. A failsafe mechanism, called the arbiter, is hard-codedinto the GSS firmware (programming at the chip level) that automatically switches the suspension system fromdigital to analog mode under certain pre-set conditions.3.2.2.3 Computer RedundancyThe GSS computers comprise four of the eight computers on-board the spacecraft. In addition there are twoflight computers and two SQUID Readout (SRE) computers. The main flight computer and its twin backup arecalled the A-Side (main) and B-Side (backup) CCCA (Command & Control Computer Assembly). Only one ofthese computers is running at any given time. If the A-side computer fails certain safemode tests, the B-sidecomputer automatically takes over, as was the case in March 2005. However, when the backup computer failedthese safemode tests, it was rebooted. We can only switch back to the main computer through manualcommands.3.2.2.4 SQUID Readout RedundancyEach of the twin SRE computers can control all four SQUID readouts, showing the spin axis orientations of allfour gyros. Like the main computers, only one of the SRE computers is running at any given time. When themain CCCA computer automatically switched over to the B-side in March 2005, the SRE computer did notswitch with it. However, in order to synchronize the timing between the B-side CCCA computer and the A-sideSRE computer, we commanded the SRE computer to reboot. Also, to ensure that we remained on the A-sideSRE computer, we disabled the safemode response that automatically switches from the A-side SRE computer tothe B-side SRE computer.3.2.2.5 Telescope Readout RedundancyRedundancy is also built into the Telescope Readout Electronics (TRE). The science telescope has two sets ofdetectors, designated A-side (primary) and B-side (backup). These detector packages, which are about thediameter of a dime, are comprised of pairs of silicon photo diodes that basically count photons from each half ofthe telescope's split beam, in both the X-axis (side-to-side) direction and the Y-axis (top-to-bottom) direction.Beam splitters and mirrors are used to redundantly direct all of these split light beams to the B-side detectors aswell as the A-side detectors. For comparison sake, we collected the data from both the primary and backupdetectors during telemetry communications passes, although we only used the data from one set of detectors tocontrol the spacecraft's pointing direction through the ATC system.3.2.2.6 Attitude Control System RedundancyThe ATC uses the navigation control gyros (called “rate” gyros), star trackers, and magnetometers to control thespacecraft's attitude when the telescope detectors are not controlling the spacecraft's attitude (e.g., the portion ofeach orbit when the spacecraft moves behind the Earth, eclipsed from view of the guide star). The spacecraftcontains two pairs of rate gyros, two star trackers, again designated A-side (primary) and B-side (backup), andtwo navigational magnetometers. The two rate gyros in each pair work together, independently controlling theX-axis and Y-axis position of the spacecraft; the redundant Z-axis position control from one of the gyros is not<strong>Gravity</strong> <strong>Probe</strong> B — <strong>Post</strong> <strong>Flight</strong> Analysis • Final <strong>Report</strong> March 2007 79
used. The star trackers are essentially pattern-matching cameras, located on opposite sides of the spacecraftframe. The payload magnetometers are like three-dimensional compasses that determine the spacecraft’sorientation with respect to the Earth’s magnetic field.During the 17-month <strong>GP</strong>-B flight mission, all of the above systems, in addition to data from the GyroSuspension Systems were used to “steer” the spacecraft in its orbit. Moment to moment changes in thespacecraft’s position were controlled by a combination of 16 micro thrusters (see below) and a set of magnetictorque rods—long electromagnets that push or pull against the Earth’s magnetic field to change the spacecraft’sorientation. After the helium was depleted from the dewar at the end of September 2005, these torque rods,controlled by feedback from the star trackers and magnetometers, are the only means of re-orienting thespacecraft in the post-mission phase.3.2.2.7 Star Tracker RedundancyBoth star trackers were turned on and have been running since the beginning of the mission, but only one pairof rate gyros was in use. During the science phase of the mission, we activated the other set of rate gyros, as well.Data from one set was sent to the ATC to control the spacecraft's position; data from the other set was collectedduring telemetry communications sessions and used for precise roll attitude calibrations to the science data. TheB-side switch-over of the CCCA computer in March 2005 also triggered a switch to the B-side rate gyros andstar tracker. We subsequently commanded the spacecraft to switch back to the A-side rate gyros and the A-sidestar tracker, both of which had been fine-tuned during the Initialization and Orbit Checkout (IOC) phase of themission and were performing slightly better than their backup counterparts.3.2.2.8 Micro Thruster RedundancyThe final redundant spacecraft system is the micro-thruster system. The spacecraft is outfitted with 8 pair ofopposing micro-thrusters, arranged in four clusters—two at the top of the spacecraft frame and two at thebottom. One thruster in each cluster is redundant, and a set of valves in the thruster system enables individualthrusters to be isolated and effectively disabled. This is precisely what we did early in the mission with twomicro-thrusters, whose nozzles became stuck open, apparently due to particle contamination shortly afterlaunch. The remaining 14 thrusters performed flawlessly throughout the science and post-science instrumentcalibration phases of the mission.3.2.3 <strong>GP</strong>-B’s Unique Technological Challenges and SolutionsWhen the <strong>GP</strong>-B experiment was conceived late in 1959-1960, much of the technology had not yet been inventedto accomplish this exacting test. Here are the some of <strong>GP</strong>-B’s unique technology inventions and clever solutionsto difficult challenges.80 March 2007 Chapter 3 — Accomplishments & Technology Innovations
3.2.3.1 Porous Plug: A <strong>Stanford</strong> University/<strong>GP</strong>-B InventionFigure 3-10. The porous plugChallenge: On Earth, Dewars (Thermos bottles) function because of gravity. The liquid and gas naturallyseparate. In the zero gravity of space, a different method of separation is needed.Solution: Release the evaporating helium while retaining the superfluid liquid helium.Superfluidity is a characteristic of liquid helium that appears only when it is 2.18 kelvin or colder (during themission, the temperature of the liquid helium in the dewar was held at 1.8K). When liquid helium is superfluid,it has no viscosity. This allows it to move about on a surface or through a porous substance without friction. Aremarkable effect of this state is that if superfluid helium is left in an open beaker in a supercooled environment,the liquid will crawl up the inside of the beaker and down the outside until the beaker was empty!The role of the porous plug was to control this flow of superfluid helium just enough to let some of it evaporatewithout letting the liquid leak out. A simple vent would not work because in a zero-g environment, thesuperfluid helium would simply migrate out of any opening in the Dewar, no matter how small we made it orhow quickly we opened and closed it. Instead, we needed to make a porous plug.The plug itself is made of stainless steel, but it has gone through a sintering process that makes it slightly porous(like a sponge). Sintering is a process of powdering a material into tiny granules and then heating the granulesuntil they coalesce into a porous mass, without heating them so high that they melt together. The pores in theresulting mass are extremely small (in fact, invisible to the naked eye), but they are large enough for thesuperfluid helium to find its way through the plug.Before the oozing superfluid helium leaks completely through the plug, it reaches a point where it begins toevaporate (called the liquid-vapor interface). When it evaporates, the helium vapor takes heat energy out of theliquid helium. Now the liquid helium near the outside of the plug is colder and it sinks back into the Dewar. Atleast, this is how it was supposed to work.Choosing the right size for the porous plug was tricky. If the plug had been made too small, the liquid-vaporinterface would have remained below it, choking the plug and preventing the release of helium vapor. If the plughad been made too large, the interface would have been above it, and the liquid helium would have oozed out ofthe plug before it had evaporated and would been lost. The proper size turned out to be a 6.9 cm disk, 0.635 cmthick with a permeability of 3.8 x 10 -10 cm squared. The material for the plug is a low-carbon version of stainlesssteel provided by the Mott Corporation in Connecticut (which also produced our sintered titanium filters topurify the helium gas and the sintered titanium blades for the cryopump).<strong>Gravity</strong> <strong>Probe</strong> B — <strong>Post</strong> <strong>Flight</strong> Analysis • Final <strong>Report</strong> March 2007 81
Result: By using the porous plug, we were able to maintain a steady pressure and temperature inside the Dewar.The liquid helium stayed within a few millikelvin of 1.8K throughout the mission. In turn, this allowed thescience instrument to operate properly at superconducting temperatures and enabled us to collect 11.5 monthsof relativity data to test Einstein.Historical Note: The porous plug was developed at <strong>Stanford</strong> specifically for the <strong>GP</strong>-B experiment, but it flew onboth the NASA IRAS (Infrared Astronomical Satellite) and COBE (Cosmic Background Explorer) spacecraftprior to the launch of <strong>GP</strong>-B.3.2.3.2 Nested Expanding Lead BagsFigure 3-11. Lead bag magnetic shield in <strong>GP</strong>-B flight probeChallenge: Earth’s magnetic field interferes with the hyper-sensitive magnetometer (SQUID), which reads eachgyroscope’s orientation to within 0.5 milliarcseconds (1.4x10 -7 degrees).Solution: Block out the ambient magnetic field by surrounding the science instrument with a “lead bag.” Fourlead bags are actually used. The first one is inserted and expanded, partially reducing the magnetic field (by theratio of final to initial volume.) Another bag is then inserted inside the first one and expanded, further reducingthe magnetic field inside the second bag. The outer bag is then cut away. This process is repeated two moretimes, all but eliminating the magnetic field within the innermost bag. At this point the <strong>Probe</strong>, containing thegyroscopes and SQUIDS is inserted inside the final remaining lead bag.Result: The series of four nested and expanded lead bags reduces the magnetic level to less than 10-6 gauss.Then, magnetic shields surrounding each individual gyroscope and other local magnetic shields attenuate themagnetic variation down to 10 -14 gauss.82 March 2007 Chapter 3 — Accomplishments & Technology Innovations
3.2.3.3 Proportional Micro ThrustersFigure 3-12. <strong>GP</strong>_B proportional micro thruster assemblyChallenge: <strong>GP</strong>-B satellite’s path is altered, ever so slightly, by solar radiation and atmospheric “wavetops”.Solution: Re-orient the satellite with an extremely sensitive gas thruster system. Helium gas constantly flowsout of eight pairs of opposing thrusters in balanced amounts. To alter the satellite’s attitude, the gas flow in oneor more pairs of opposing thrusters is unbalanced by 1/100 th of a “puff ” exhalation that one might use to cleaneyeglasses, providing just a few millinewtons of force.Result: These proportional micro thrusters precisely maintain the <strong>GP</strong>-B space vehicle’s position to within 10milliarcseconds (3x10 -6 degrees) of a perfect Earth orbit, and pointing to within 1 milliarcsecond (3x10 -7degrees) of the exact center of the guide star.Bonus Fact: This is the ultimate in recycling...the helium gas that continually evaporates through the porousplug from the superfluid liquid helium inside the Dewar, is harnessed as the propellant used by the proportionalmicro thrusters.3.2.3.4 Polishing the Perfect SphereFigure 3-13. Polishing a gyro rotorChallenge: Polishing a fused quartz sphere with standard methods creates “hills and valleys,” destroyingsphericity.<strong>Gravity</strong> <strong>Probe</strong> B — <strong>Post</strong> <strong>Flight</strong> Analysis • Final <strong>Report</strong> March 2007 83
Solution: Create a tetrahedral lapping and polishing machine that brushes the sphere with micro-inch abrasiveslurry in random variations.Result: Each fused quartz sphere deviates less than one micro-inch from peak to valley (25 nm), making themthe roundest objects ever created on Earth.Bonus Fact: In September 2004, <strong>GP</strong>-B received a certificate from Guinness World Records Limited,acknowledging that the <strong>GP</strong>-B gyroscope rotors had been entered into the Guinness Database of World Records.The certificate reads as follows: “The most spherical man-made objects are the fused quartz gyroscopic rotorsonboard the <strong>Gravity</strong> <strong>Probe</strong> B Spacecraft operated by NASA and <strong>Stanford</strong> University. Their average departure frommathematically perfect sphericity is only 1.8 x 10 -7 of their diameter.”3.2.3.5 Precisely Measuring Sphericity (Roundness)Figure 3-14. Measuring the roundness of a gyro rotor and mapping the contours on its surfaceChallenge: How to measure the roundness of a sphere at the precision level of 1/10th of one millionth of aninch? The British instrument company, Rank, Taylor, and Hobson, created the Talyrond instrument formeasuring the sphericity or roundness of <strong>GP</strong>-B gyroscope rotors using a stylus mounted on a round spindle toencircle a gyroscope rotor. However, they could not produce a spindle that was itself perfectly round, and thusthe spindle introduced error into the measurement.Solution: Combine the errors in the spindle’s roundness with the errors in the sphere being measured. Then,rotate the sphere to a new position and repeat the measurement. The measurement errors in the roundness ofthe spindle remain constant, while the measurement errors in the sphere change with each new position. Afterrepeating this process several times, it is possible to separate out the constant spindle error. (The spindleroundness must be checked from time to time, to ensure that it has not changed.)Result: The spindle roundness errors were calculated and stored in a computer, so they could be reused withdifferent spheres. For each rotor, 16 great-circle measurements were made in the perpendicular plane and onefinal measurement was made around its equator, tying all the vertical measurements together. The spindleerrors were subtracted out of the sphericity measurements, and then the sphericity measurements weretranslated into contour maps.84 March 2007 Chapter 3 — Accomplishments & Technology Innovations
3.2.3.6 Gyroscope Suspension SystemFigure 3-15. A gyro rotor and both halves of its quartz housingChallenge: Suspend each spinning gyroscope in the exact center of its housing, a mere 32 microns or 1/1000 thinch from the side of the housing.Constraint 1: The suspension mechanism must be able to react instantly to misalignments, withoutoverreacting and sending the gyroscope crashing into the side.Constraint 2: The gyroscopes must maintain a spin rate greater than 3,500 rpm.Solution: Six electrodes placed evenly around the gyroscope create a charge that electrically suspends thegyroscope. The charge attracts the gyroscope’s niobium surface. Using a few millivolts, the gyroscopes areconstantly balanced in the center of the housing with every electrode reacting dynamically to any adjustmentsby the other electrodes.Bonus Fact: While in space it takes less than 100 millivolts to suspend the gyroscopes, whereas on Earth it takesnearly 1,000 volts to raise and balance the gyroscopes against the force of gravity.3.2.3.7 Gas Management AssemblyFigure 3-16. Top view of the Gas Management Assembly (GMA)Challenge: Spin up an ultra-smooth gyroscope as fast as possible without crashing it into the sides of thehousing with an electrical spark.Constraint 1: Gas flowing into housing chamber can exit only as fast as the exhaust tube will allow.<strong>Gravity</strong> <strong>Probe</strong> B — <strong>Post</strong> <strong>Flight</strong> Analysis • Final <strong>Report</strong> March 2007 85
Constraint 2: The exhaust tube must be very small (< 1/16th of an inch) to prevent outside heat from reachingthe housing chamber and the gyroscope.Constraint 3: If more gas flows into the chamber than flows out, the pressure inside the chamber will rise. Asthe pressure rises, the helium will ionize and possibly arc. The electrical spark could knock the electricallysuspended gyroscope out of position and into the side of the housing.Solution: A gas management system was designed specifically for spinning up the <strong>GP</strong>-B gyroscopes. It usesmore than two dozen valves and numerous levels of redundancy to send ultra-pure helium gas into the chamberat 725 sccm (standard cubic centimeters per minute).Result: The gyroscopes spin up to full speed, greater than 3,500 rpm, in less than three hours.3.2.3.8 The IDA and DPA Inside the Telescope(Image Divider Assembly & Detector Package Assembly)Figure 3-17. The telescope Image Divider Assembly (IDA) and Detector Package Assemblies (DPA)Challenge: <strong>GP</strong>-B’s telescope must locate the center of the guide star to within 0.1 milliarcseconds (3x10 -8degrees). No existing telescope is accurate enough to accomplish this task.Solution: Split the incoming light with a roof-prism (inside the IDA) and direct each half toward two sensors(inside the DPA). When each sensor registers an identical amount of electrical flux, the telescope is centered.Result: Each sensor can detect the amount of light hitting it to within a few photons. The telescope can beadjusted to remain focused on the exact center of guide star, thereby precisely maintaining its originalorientation.86 March 2007 Chapter 3 — Accomplishments & Technology Innovations
3.2.3.9 Gyro Readout: Marking the UnmarkableFigure 3-18. Schematic diagram and photo of a SQUID gyro readoutChallenge: How does one measure the direction of spin of a perfect unmarked sphere to 0.1 milliarcseconds(3x10 -8 degrees) without disturbing it?Solution: The answer comes through the phenomena of superconductivity. Superconductivity provides a spinpointer which is neither optical nor mechanical as in conventional gyroscopes but magnetic. It also provides asensitive non-interfering instrument to read the pointer, the Superconducting Quantum Interference Device(SQUID).Superconductors have the property that when cooled below a specific temperature they completely lose theirelectrical resistance, hence their name. They become not just great conductors, but for steady currents, perfectones. Additionally, when a superconductor—niobium, for example—spins, it generates a magnetic field (knownas the London moment after physicist Fritz London) which is exactly aligned with its spin axis. Each circlingpositive charge bound in the metal lattice generates a magnetic field parallel to the rotation axis. The total fieldproduced would be very large if not for the superconducting electrons themselves responding to it. Nearly allare forced to keep up with the lattice, generating a cancelling field of their own except in a shallow surface layerabout 100 atoms thick. In this layer they lag slightly behind the charged lattice leaving a small difference field—the London moment—proportional to spin rate and exactly aligned with the spin axis. Here is our pointer.To measure the spin direction, the rotor is encircled with a thin superconducting loop connected to a SQUID(Superconducting QUantum Interference Device) magnetometer. As the orientation of the spin axis of the gyrochanges, the London moment follows, changing minutely the contribution of the London moment to themagnetic field through the loop. So sensitive is the SQUID that a field change of 5 x 10 -14 gauss(1/10,000,000,000,000 of the Earth's magnetic field), corresponding to a gyro tilt of 1 milliarcsecond, should bedetectable within 10 hours, and a 0.1 milliarcsecond deflection should be detectable in 42 days. Feedbackelectronics in the SQUID readout system allow for cancellation of reaction currents in the pick-up loop, thusreducing reaction torques on the gyro to an absolutely negligible level.The London moment readout scheme is well suited to <strong>Gravity</strong> <strong>Probe</strong> B. It is sensitive, stable, applicable to aperfect unmarked sphere and does not exert any significant reaction force on the gyroscope.<strong>Gravity</strong> <strong>Probe</strong> B — <strong>Post</strong> <strong>Flight</strong> Analysis • Final <strong>Report</strong> March 2007 87
Result: The on-orbit gyroscope spin rates were lower than baselined—70 Hz or 4,200 rpm on average, ratherthen 130 Hz or 7,800 rpm— which increased the integration time necessary to estimate the gyroscope spindirection to the desired precision. Partially in response to the low gyro spin rates, the final vehicle roll rate wasset higher than baselined (12.9 mHz or 0.77 rpm rather than 5.5 mHz or 0.33 rpm) which decreased theintegration time necessary. The net result is a decrease in measurement time needed. On-orbit noise floor datashows that the SQUID readout system is capable of measuring the gyro spin axis to a precision of 1milliarcsecond in 6 hours, and to a precision of 0.1 milliarcseconds in 4 weeks.3.2.3.10 Dual-Sided Solar ArraysFigure 3-19. Checking the <strong>GP</strong>-B solar arrays on the spacecraft at Lockheed Martin & solar arrays deployed on ascale model of the spacecraftChallenge: How do you provide continuous solar power to a spacecraft that has the unique requirements ofalways pointing at a single distant star, rather than the sun, while rolling continuously in orbit for 16 months orlonger?Solution: Most satellites are designed to face the sun year around, or they have moveable solar panels that canbe re-oriented to face the sun, thus maintaining positive power throughout each orbit. This is not the case with<strong>GP</strong>-B. Due to the nature of the <strong>GP</strong>-B science mission, <strong>GP</strong>-B always points at the guide star, IM Pegasi; it neverpoints directly at the Sun, because sunlight could overwhelm the telescope's ultra-sensitive photon detectors.Furthermore, the <strong>GP</strong>-B spacecraft itself must be as free as possible from any motion disturbances that couldaffect the gyros and SQUID readouts. Thus, once opened, the solar arrays on the <strong>GP</strong>-B spacecraft had to belocked into fixed positions. For these reasons, <strong>GP</strong>-B's solar arrays are unique, both in their design and in theirpositioning on the spacecraft.<strong>GP</strong>-B is equipped with four fixed, double-sided solar array panels, canted at such angles as to always be able toreceive some solar power regardless of the season. Additionally, these double-sided panels were designed tominimize the thermal effects of the spacecraft entering and exiting eclipses, when the Earth blocks the Sun'slight for up to 36 minutes per orbit. Each <strong>GP</strong>-B array contains 9,552 individual single-junction GalliumArsenide (GaAs) solar cells that convert sunlight into electrical power with 18.5% efficiency, the standard forthis type of eclipsing satellite. As sunlight is absorbed by the solar cells, its photons, or bundles of energy, are88 March 2007 Chapter 3 — Accomplishments & Technology Innovations
transferred to the electrons of the superconductive photo voltaic (PV) cells. The electrons in the PV cellsbecome excited enough to escape their atoms and begin flowing, producing the current that powers the <strong>GP</strong>-Belectronics.Because the <strong>GP</strong>-B spacecraft always points at the guide star, rather than at the Sun, the angle between thespacecraft's main axis (also the telescope axis) and the Sun—called the gamma angle—varies throughout theyear. Thus, the solar arrays do not receive consistent direct sunlight, and this is the reason for the unusual anglesat which the solar arrays are canted.Figure 3-20. <strong>GP</strong>-B’s annual orientation patterns with respect to the sunEngineers at Lockheed Martin, who designed and built the <strong>GP</strong>-B solar arrays, had to ensure that the arrayswould produce sufficient electricity in the worst-case gamma angle of approximately 22 degrees, whichoccurred once during the mission, on 12 September 2004. The Lockheed Martin engineers also had to designand mount the solar arrays in such a way that there would be sufficient power during the maximum 36-minuteeclipse times, which occur when the gamma angle is at its maximum and minimum values (158 degrees and 22degrees, respectively). At these angles, <strong>GP</strong>-B's orbit plane directly faces the sun—in other words, the Sunappears directly below the guide star, instead of off to one side or the other. This alignment only happened twiceduring the actual mission—on 12 September 2004 and 20 March 2005—and the greatest power usage anddeepest depth of discharge (DOD) by the batteries occurred at these times.Taking these worst-case alignments into account, the Lockheed Martin designers arranged the orientations ofthe solar panels on the spacecraft to optimize the amount of incident sunlight. Looking down on the spacecraftfrom the top of the telescope (that is, looking down the spacecraft's z-axis), the arrays are arranged 90 degreesapart, forming an “X” pattern. Panels 1 and 3 are canted 90 degrees into the Z-plane of the spacecraft, so thatyou can only see their edges looking down on the spacecraft. Panel 2 is canted 25 degrees forward in the Z-plane, towards the top of the spacecraft, and Panel 4 is canted in the opposite direction, 25 degrees backwards inthe Z-plane, towards the bottom of the spacecraft. Because of this asymmetry, the spacecraft is free to rotateabout the Z-axis of the telescope with minimal perturbations due to the dragging or torquing of the solar panels.<strong>GP</strong>-B maintains a Low Earth Orbit (LEO) at an altitude of only 640 km (400 miles) about the Earth's poles. Atthis altitude, it has an orbital period of 97.5 minutes, eclipsing behind the Earth 14-16 times a day--almost 5,000times a year. While in these eclipses, <strong>GP</strong>-B relies on its Super NiCAD batteries to provide power for all of the<strong>Gravity</strong> <strong>Probe</strong> B — <strong>Post</strong> <strong>Flight</strong> Analysis • Final <strong>Report</strong> March 2007 89
spacecraft's subsystems for the duration of each eclipse, lasting up to about 36 minutes during the peak eclipseseasons. This constant cycle of charging and discharging puts a large amount of strain on the batteries. Becauseof this high discharge and recharge rate, NiCAD batteries, which have been the standard in space since the1960s, were chosen due to their extensive space heritage and robustness in high eclipse-cycle missions. <strong>GP</strong>-B'sbatteries have an expected lifetime of five years, and data analysis of battery performance throughout themission has been consistent with this prediction.Result: The solar arrays and batteries are capable of providing almost three times more power than the entirespacecraft requires, demonstrating the robustness of the system. The EPS has performed flawlessly since launchand has exceeded all expectations—not only by supporting all mission operations, but also doing so with morethan ample margin.Bonus Fact: In 1921, Einstein was awarded the Nobel Prize for his 1905 paper explaining the photoelectriceffect, which is the principle on which the <strong>GP</strong>-B solar arrays function. Last year, 2005, was the 100th anniversaryof Einstein's “Miracle Year”—the year in which he wrote not only his photoelectric paper, but also the specialtheory of relativity, and two other seminal papers.3.2.3.11 Heat-Absorbing, Hermetically Sealed Outer <strong>Probe</strong> WindowFigure 3-21. Window #4—the outer vacuum seal of the <strong>Probe</strong>Challenge: Design a window at the outer end of the <strong>Probe</strong> that would meet all of the constraints listed below.Constraint 1: This window forms the vacuum seal at the end of the <strong>Probe</strong>, and thus it had to be made of amaterial that was strong enough to withstand the pressure differential between the ultra high vacuum inside the<strong>Probe</strong> and normal atmospheric temperature and pressure outside the <strong>Probe</strong> without lensing or bulging.Constraint 2: This window had to be a very good thermal conductor that would conduct heat uniformly in alldirections from its center outward, with very little temperature rise in the center.Constraint 3: The window had to be optically transparent, allowing the light from the guide star to enter the<strong>Probe</strong> and telescope undistorted, while at the same time, blocking electromagnetic radiation.Constraint 4: This window had to satisfy all of the above constraints both in orbit and in extensive testing hereon Earth, where the temperature and pressure differential inside and outside the <strong>Probe</strong> is much greater than inspace.90 March 2007 Chapter 3 — Accomplishments & Technology Innovations
Solution: That kind of window material meets all of these requirements? The answer is sapphire. Sapphire isextremely strong, it has very high thermal conductivity, it is an electrical insulator, and it is opticallytransparent. Sapphire has a crystalline structure, that could cause a phenomenon called birefringence or doublerefractions of a single light beam. However, due to the sapphire's strength, Window #4 could be made relativelythin, and birefringence was not a problem. In addition to an anti-reflective coating, which was also applied tothe three fused quartz windows, Window #4 was treated with an electromagnetic interference (EMI) coating toattenuate the ambient low-frequency and microwave electromagnetic radiation leaking into the <strong>Probe</strong> throughthe wide open optical aperture, both in space and on the ground. Because EMI coatings use metal, which isopaque, they reduce the optical transmission of the window. Thus, there was a trade-off between theeffectiveness of the EMI shield and optical transmission requirement. Finally, Window #4 also included athermal emissivity or “low e” coating that reduced the amount of heat it transmits into the <strong>Probe</strong>.Perhaps the greatest challenge with Window #4 was its hermetic vacuum seal, which took many designiterations to arrive at a working solution. At the time Window #4 was constructed, rubber O-rings weretypically used to create vacuum seals, but they would not have been able to withstand temperatures down to 200K, which was a requirement for <strong>GP</strong>-B. Another option was to braze (very high temperature soldering) a metallicseal onto the outer edge of the sapphire window. However, brazing was deemed too risky, given thermalexpansion issues and the very high cost of sapphire. Ultimately, the <strong>Stanford</strong>-Lockheed Martin engineeringcollaboration came up with a unique seal that had never before been tried: Window #4 was surrounded by anIndium-coated “C” seal, lined with a thin layer of gold against the sapphire, and held in place by a ring ofspringy nickel-chromium-iron alloy called Incline that is more typically used in formula race car exhaustsystems.Result: Window #4, along with its unique hermetic vacuum seal, was an engineering tour de force—a synergyof design constraints, ingenuity, and engineering prowess. This window and its hermetic vacuum seal havefunctioned flawlessly throughout months of pre-launch testing, and two years in orbit.3.2.3.12 Precision Pointing TechnologyFigure 3-22. <strong>GP</strong>-B—The first spacecraft with 6 degrees of freedom in position and attitude controlChallenge: Develop a spacecraft attitude and position control system that could meet the precision pointingand drag-free flight requirements of the <strong>GP</strong>-B experiment, including all of the following constraints:Constraint 1: Provide precision attitude control for a minimum of 16 months on-orbitConstraint 2: Maintain a continuous spacecraft roll at a selected rate, in a range of 0.1- 1.0 rpm.<strong>Gravity</strong> <strong>Probe</strong> B — <strong>Post</strong> <strong>Flight</strong> Analysis • Final <strong>Report</strong> March 2007 91
Constraint 3: Keep the spacecraft pointed at a selected guide star (IM Pegasi) to within 50 milliarcsecondswhenever the spacecraft has an unobstructed view of the guide star (Guide Star Valid periods). When thespacecraft moves behind the Earth so that the guide star is eclipsed from its view (Guide Star Invalid periods),maintain its pointing orientation so that when the guide star comes back into view, the spacecraft’s pointing canlock back onto the precise guide star pointing orientation within 1-2 minutes or less. This constraint requiresvery precise attitude control (pitch, yaw, and roll).Constraint 4: Fly the entire spacecraft drag-free around one of the science gyroscopes, which have a clearanceof only 32 micrometers (~0.001 inches) between the gyro rotor and its housing. In other words, the spacecraftmust continuously “chase” this gyro in orbit without ever allowing the rotor to touch its housing wall. Thisrequires that the attitude control system also have 3 degrees of translational control—thus the name Attitudeand Translation Control System or “ATC.”Solution: Many of the unique technologies described earlier in this section were combined to meet thischallenge. The actual precision attitude control was provided by the 8 pairs of proportional micro-thrusters,described in section 3.2.3.3. These thrusters were arranged so that they could control the spacecraft in all threetranslational degrees of freedom, as well as three additional degrees of freedom attitude control.The helium gas that constantly boiled off from the liquid helium in the dewar yielded a clever solution toproviding the propellant for powering these micro-thrusters, and the porous plug, described in section 3.2.3.1provided a means of controlling this helium gas as it escaped from the dewar. The design of the dewar, itself, wasalso part of the solution. It had to be large enough to hold the 650 gallons of liquid helium that would maintainthe cryogenic environment for the gyros to spin for at least 16 months; yet the dewar had to be physically smallenough to fit in the fairing of a Boeing Delta II rocket.The science telescope, with its Image Divider Assembly, described in section 3.2.3.8, was also an important partof the solution, since it provided the precise pointing reference for the spacecraft throughout the mission.Likewise, the Gyro Suspension System (GSS) provided feedback on the rotor position of the “proof mass” gyro,around which the spacecraft was flown drag-free.Finally, a number of more traditional spacecraft orientation and control devices, including the star trackers,navigational rate gyros, magnetometers, magnetic torque rods, and <strong>GP</strong>S receiver were all components ofspacecraft’s attitude control system. (See section 2.1.7.2 for a description of these components.) Notably absentfrom the ATC system were reaction wheels and momentum wheels. The concern to the experiment was thatthese wheels could have a mass imbalance, which could interfere with the zero-g gyroscope performance.Result: The attitude and translation control system (ATC) designed by Lockheed Martin for the <strong>GP</strong>-Bspacecraft was truly an engineering “tour-de-force.” It took a considerable amount of time during IOC, and partof the science phase of the mission for the <strong>GP</strong>-B and Lockheed Martin Mission Operations Team to master allthe subtleties of this complex system. But once it was properly tuned up, the <strong>GP</strong>-B ATC system was able to meetthe mission requirements, and it enabled the <strong>GP</strong>-B program to collect over a terrabyte of data during the sciencephase of the mission.92 March 2007 Chapter 3 — Accomplishments & Technology Innovations
3.3 <strong>GP</strong>-B Technology TransferThis section has outlined <strong>GP</strong>-B technologies demonstrated for the first time in space applications ortechnologies with novel and significant improvements over previous implementations. We summarize in thefollowing chart these flight-proven technologies that are available for future missions.Technology Category Specific Implementation RealizationPrecision quartz fabricationand metrologyRoundness fab & metrology20nm peak to valleyDensity homogeneity parts in 10 7Surface orientation1 arc secFlatness better than λ/20Quartz stable reference Mechanical stability Strain less than 1 part in 10 10Robust precision bondingOptoBond TM hydroxide catalyzed bondingLarge Scale Cryogenic Systems Superfluid flight dewar 2441 liters, 17.3month hold timeGuard Tank90 day post-conditioning superfluid maintenancePorous plug phase separationFlawless on-orbit operation. Also flown on IRAS andCOBE after original <strong>GP</strong>-B developmentCryogenic ElectronicsSuperconducting thin film circuit technologies:No on-orbit failurespatterning, contacting, multilayer transformersDC SQUIDsNoise PSD 2x10 -5 Φ 0 /√Hz at 13 mHzCryo JFET photo detectors 0.8 fA/√Hz noise currentMagnetics Control AC shielding (superconducting) 1 part in 10 12Attitude and Translation ControlDC field reduction (Expanded superconductingshields)Precision field measurementNon magnetic material control, and fab techniquesComprehensive fight part testing< 10 -11 TeslaAbsolute dc fields
Technology Category Specific Implementation Realization<strong>GP</strong>S system Orbit determination MilliNewton force residuals in 30 hr integrationTime transfer< 0.1 millisec uncertainty in science signal timerelative to UTCAdvanced Vehicle Control SimulationSuccessful on-orbit setup and control parameteroptimization94 March 2007 Chapter 3 — Accomplishments & Technology Innovations
4<strong>GP</strong>-B On Orbit<strong>Gravity</strong> <strong>Probe</strong> B — <strong>Post</strong> <strong>Flight</strong> Analysis • Final <strong>Report</strong> March 2007 95
96 March 2007 Chapter 4 — <strong>GP</strong>-B On Orbit
4.1 Overview of On-Orbit OperationsThe preparation for on-orbit operations began long before launch. A series of simulations, generated bycomputer in the <strong>GP</strong>-B ITF (see “The Integrated Test Facility (ITF)” on page 121) were carried out to prepare theteam. In preparation for launch, a number of changes were made to the program structure. The team wasrestructured to support the on-orbit needs. A number of additional capabilities were added in the final few yearsleading up to launch. The elements of the program included data processing, orbit determination, computerhardware, the Integrated Test Facility (ITF), anomaly resolution and risk management, and all of the technicalpayload and spacecraft subsystems. Although the program manager maintained overall responsibility for thevehicle, day to day responsibility for the vehicle was delegated to the mission directors. This clear and efficientprogram reporting and responsibility structure was a critical component of on-orbit operations and allowed fortimely response to vehicle needs.4.1.1 Three Mission PhasesThe top level view of <strong>GP</strong>-B on-orbit consists of three phases: the initialization phase, the science phase, and thecalibration phase. During the 4+ month initialization phase the vehicle was configured for science. This phasewas extremely busy and at times very stressful for the team. Each part of the <strong>GP</strong>-B organization needed toperform efficiently, yet without error. Re-tasking of the spacecraft was carried out as needed and was basedupon events on-board the vehicle. Large amounts of data were fed to the ground to provide information onthese events. The computer hardware and data processing systems operated 24 hours a day, 7 days a week.Although the team had been through a series of very helpful pre-launch simulation exercises, the initializationphase was, in-effect, a 4+ month-long simulation. Many days of this period, many members of the team worked60 or more hours per week. There were few easy days. In retrospect it is accurate to say that the team rose to theoccasion, they remained focused on the vehicle throughout, and they succeeded in a very challenging task.The initialization phase was followed by an 11 month science data taking phase. In comparison to IOC, thisperiod was straightforward to implement. In addition, the team was very well trained by the start of science.Each team member knew well his or her responsibilities, thus further easing the effort. Most days wereuneventful, although the daily “all-hands” meeting was maintained to ensure that the team remained focused onthe vehicle status. The all-important science data were transmitted to the ground four times a day. Theengineering and science teams reviewed the data on a daily basis and provided top level feedback on theprevious day's data at the daily meeting.The science mission concluded with a 1.5 month long calibration phase. The purpose of this phase was to helpevaluate sources of systematic experiment error and to allow the team to place limits on gyroscope torques.Although many operations were performed during this period, the implementation was performed nearlyflawlessly.4.1.2 Daily Operations RoutineAlthough a clear decision making process and clear definitions of personnel responsibilities are important inany organization, these aspects are particularly critical in an on-orbit environment. The overall description ofthe program can be described as follows: The Mission operations center was the lifeline to the vehicle. Personnelin the MOC were always focused on the current vehicle status. Typically, the vehicle would be “green” and theMOC would verify this status with a real time monitoring system. In a typical “green” day, a daily 10 am “allhands”meeting would inform the team of the previous day's events and planned future operations. Followingthe all-hands meeting, mission planners would meet with subsystem specialists to develop the detailed plan forthe next day. In practice, much of the planning already had been developed long before, and onlyrearrangement of the order of tasks was required. When new products were required, the ITF was used forverification prior to use on the vehicle.<strong>Gravity</strong> <strong>Probe</strong> B — <strong>Post</strong> <strong>Flight</strong> Analysis • Final <strong>Report</strong> March 2007 97
Any significant deviation from “green” would immediately “trump” other program activities. An efficientelectronic communication-information system allowed for rapid response. Telemetry information from theMOC and information determined from off-line analysis were in near constant review. Deviations from a“green” or expected result would cause the initiation of our in-house anomaly resolution process. This process,which was developed and practiced prior to launch had the responsibility to determine root cause and to makerecommendations to the mission director and program manager for an action plan/correction. The anomalyresolution team was comprised of a team lead, technical experts, NASA representation, Lockheed Martinrepresentation, and anomaly support staff. The system worked extremely well. A more complete description ofthis process, as well as all of the other program elements described in this introduction, can be found in thesections and chapters following this one.4.1.3 NASA Group Achievement AwardBy the end of mission, the <strong>GP</strong>-B team had become very skilled at both operating the spacecraft and handlinganomalies. Thus, there was some sadness when the mission ended and members of the mission operations teamhad to move on to new jobs and other missions.Figure 4-1. NASA <strong>GP</strong>-B Program Manager, Tony Lyons, from the Marshall Space <strong>Flight</strong> Center in Huntsville, AL,presents a NASA Group Achievement Award to the entire <strong>GP</strong>-B team in November 2005.At the end of November 2005, shortly after the successful completion of the <strong>GP</strong>-B flight mission, NASA’s <strong>GP</strong>-BProgram Manager, Tony Lyons from the Marshall Space <strong>Flight</strong> Center, presented a NASA Group AchievementAward to the entire <strong>GP</strong>-B science mission team, including people from both <strong>Stanford</strong> and Lockheed Martin.The award reads: “For exceptional dedication and highly innovative scientific and engineeringaccomplishments leading to the successful execution and completion of the <strong>Gravity</strong> <strong>Probe</strong> B Science Mission.”The award is signed by NASA Administrator Michael Griffin, and individual copies were given out to each andevery member of the team.4.2 Mission PlanningThis section discusses the Mission Planning function, which is part of the Mission Operations group.4.2.1 Function Charter: What is Mission Planning?The charter of Mission Planning at <strong>Gravity</strong> <strong>Probe</strong>-B is to program the spacecraft’s operations through aspacecraft-executable timeline, and to provide communications between it and the operators on the groundthrough a communications schedule.98 March 2007 Chapter 4 — <strong>GP</strong>-B On Orbit
4.2.1.1 The Operations Concept for Mission PlanningPart of the overall Operations Concept for the <strong>Gravity</strong> <strong>Probe</strong>-B was to divide the work of the crucial In-OrbitCheckout, or IOC phase of the mission into daily cycles. This is what a typical day would look like.1. The overall plan for what the spacecraft would d—detailed down to the individual instruction—wascreated over years before the mission launched, and was called the Baseline Timeline.2. Each day, project engineers, scientists, and managers would submit changes to the Baseline in the formof Timeline Change Requests, or TCRs.3. Mission Planning would spend every morning receiving these TCRs and readying its products for reviewat the upcoming meeting.4. Every day at 11:00 AM local time, a Timeline Meeting immediately after the Daily Status Meeting. At thetimeline meeting, overall timeline strategy would be discussed, and TCRs would be dispositioned. Agraphical version of the load for the day would be displayed to the group via laptop projection, andAdobe Acrobat software was used to mark up the timeline with requested changes in real time.5. Also, at the Timeline Meeting Mission Planning would present the loads for the next day, and review thestrategy for the next several days, so that major changes could be caught as early as possible—at least aday in advance. In any case, at the end of the meeting, Mission Planning would have its marching ordersfor the day in the form of TCRs, and also a visual representation of the changes.6. Mission Planning would then begin the work of building the two loads for that day. Spacecraft memorywas partitioned into two areas capable of holding executable instructions—what we called storedprogram command (SPC) loads, each of which could consist of several hundred SPC commands, eachcarefully timed down to the second. These two memory areas were called Ping and Pong.• The Ping load would carry out the bulk of the instructions designed to check out the payload andready the experiment.• The Pong load would be the place where attitude and thruster control (ATC) initialization wouldoccur, and other spacecraft systems would be initialized and fine-tuned.7. Changes to the spacecraft SN and GN schedules would be implemented on a “best possible” basis. Since<strong>GP</strong>-B’s priority among other extant missions was middling, this often took a great deal ofcommunication with elements at White Sands which manage the overall TDRSS and GN schedules.Furthermore, any change to the schedule had implications to the timeline, so once the final changes weremade to the schedule, the revisions would need to be applied and accounted for by the Planner workingon building the loads.8. Once Mission Planning had a working draft of the Ping and Pong loads, they would be published to theOperations web site, “gpbops”, and a notification page would be sent to all the engineers, scientists, andmanagers responsible for approving the load so they could review the load as soon as possible, and reportproblems and errors.9. At 4:30 PM local time (or whenever possible), a Final Review Meeting involving MP, mission managers,engineers, and scientists would occur. In this meeting, the final product was graphically reviewed, andcompared to the TCRs and to the visually-marked-up baseline shown in the morning meeting. Inaddition, complete load packages would have been assembled and presented for approval. These printed<strong>Gravity</strong> <strong>Probe</strong> B — <strong>Post</strong> <strong>Flight</strong> Analysis • Final <strong>Report</strong> March 2007 99
packages, one for each Ping load and one for each Pong load, were several hundred pages in length, andcontained every MP product associated with that load, including the actual instructions (in humanreadablecode form) sent to the spacecraft.10. Once the load packages are approved and signed off by all the sub-system engineers and missionmanagers, the loads could be sent to the Real-time Operations team in the MOC. Mission Planningwould deploy the load products to both PODs (computer clusters capable of commanding thespacecraft) in the MOC, and would also deploy the final products to the web site for common availabilityto the entire mission.11. Finally, an abbreviated load package would be produced containing high-level products. This smallpackage would be photocopied and made available as the Ping and Pong loads were executing, so thatanyone on-site could easily determine what the spacecraft’s timeline and objectives were for the day. As acapstone to the day’s events, a thematic and clever cartoon would be harvested from a book or theinternet, and placed on the load package’s cover sheet to provide much-needed levity.12. Mission Planning was scheduled to leave for the day at 5pm.In the Science Phase of the mission, things were planned to get a lot simpler – with only a few loads per week.And in the Calibration phase, we would have one load per day.4.2.1.2 Success CriteriaOur success depends on three critical factors: (1) efficiency in the face of complex requirements, (2) flexibility ina dynamic environment, and (3) error-free results. Furthermore, the measure of our success is the quality of ourtwo sets of products – the Timeline and the Schedule – which closely interlock and co-evolve throughout theircreation on a daily basis. Mission Planners must:• Coordinate all the essential input from mission researchers, spacecraft engineers, and program managers– even as situations change from morning to night• Operate a rigorous set of quality assurance processes – to verify that the instructions received areprecisely implemented as intended• Operate a complex set of support software which facilitates the creation of timely, correct timelines andschedules – to meet the dynamic needs of spacecraft operations• Deliver its output into production: the timeline must be delivered to the spacecraft, and thecommunications schedule must be synchronized between the <strong>Stanford</strong> Mission Operations Center(“MOC”) and the NASA communications elements around the world4.2.1.3 Coordination: the Primary ChallengeMission Planning drives the development of the timeline and the schedule through its contacts with all theoperations, engineering, management, and NASA elements. The coordination required to develop a coherentproduct set – a spacecraft timeline and schedule – is extensive. The primary challenge of Mission Planning is tocapture, coordinate and properly understand all the various inputs from these sources.4.2.1.4 Mission Planning in a University SettingOf special significance is <strong>Gravity</strong> <strong>Probe</strong>-B’s implementation in a university setting. The Mission Planning teamcomprised a core group of two professional Mission Planners, supplemented by students. The coreprofessionals were subject matter experts in the timeline, schedule, and software tools, while the studentsmaintained expertise in niches and specific functions.100 March 2007 Chapter 4 — <strong>GP</strong>-B On Orbit
Three critical factors were essential to Mission Planning’s success, and these are described in the three mainsections that follow.4.2.2 Critical Factor: EfficiencyThe first critical factor was efficiency, and this section discusses the breadth of material that the MissionPlanning team had to master in order to achieve maximum efficiency.4.2.2.1 Subject Matter ExpertiseFor speed of product delivery, both general information and subject-matter expertise were required fromMission Planners at <strong>Gravity</strong> <strong>Probe</strong>-B. The following table illustrates the Mission Planning material that had tobe mastered:Table 4-1. Mission Planning Mastery IndexMission Planning Mastery IndexSpacecraft Sub-Systems All the commandable sub-systems of the spacecraft must be understood.SafemodesClear understanding of the safemode scheme, with its tests, masks, and macros iscritical.CARDInternalizing the Constraints And Restrictions Document (CARD).Spacecraft SoftwareThe operating system and applications model of the spacecraft.Communications Systems Expertise with both the Space Network and Ground Network.4.2.2.2 Software ExpertiseIn addition, Mission Planning had to master a great deal of software in order to implement its functions.Internally, we viewed software in two categories: externally-supplied software, including commercial software,and government software.Table 4-2. Mission Planning Commercial SoftwareCommercial SoftwareGREAS for STK 4 From Analytical Graphics, this software is used to build the spacecraft timeline and providebasic visualization.STK 4 (Unix)STK 6 (Windows)STK VOSWSIMission Planning are able to perform a wide variety of orbit analysis functions through theuse of STK products.Advanced, real-time three-dimensional visualization of the spacecraft in orbit wasdeveloped by Mission Planners through the use of the VO product from Analytical Graphics.NASA’s interface to the Space Network scheduling system.<strong>Gravity</strong> <strong>Probe</strong> B — <strong>Post</strong> <strong>Flight</strong> Analysis • Final <strong>Report</strong> March 2007 101
In addition to these software packages, Mission Planning used and developed many internal products:Table 4-3. Mission Planning software developed by <strong>GP</strong>-BInternally-Developed SoftwareTISISoftware which provides SN and GN schedule visualization, timeline analysis,constraint checking, and reporting. Developed by Mission Planning itself.MP ToolkitAutomation toolkit which automates almost every phase of product delivery.Developed by Mission Planning itself.Timeline ViewerSoftware which provides advanced timeline visualization. Developed by MissionOperations.Command Generation Developed by Lockheed-Martin for the <strong>GP</strong>B mission, this software compiles thetimeline into spacecraft executable files.Parameter Generation Developed by Lockheed-Martin for the <strong>GP</strong>B mission, this software maintains adatabase of parameters which configure the spacecraft’s sub-systems.4.2.2.3 Showcase: TISITISI was the keystone software developed by Mission Planning to automate hours-long workflow and toprovide features not available to Mission Planning through any other software available.Early on, it was recognized that Mission Planning didn’t have all the tools it needed to achieve its successcriteria. We faced problems on all fronts of our workflow:Table 4-4. Pre-TISI Mission Planning ChallengesMission Planning Challenges Pre-TISILong Load TimeBuilding a single load was a long process, taking many hours.GenerationSchedule/TimelineSynchronizationSN SchedulingGN SchedulingConstraint Checking<strong>Report</strong>sKeeping the spacecraft schedule and the timeline in sync, as both are changing, proveda serious challenge requiring many hours of work, and was prone to human error.The raw work involved in space network scheduling using the SWSI interface madescheduling the number of contacts we required incredibly time consuming, and proneto human error.NASA does not provide any tools to create a properly-formatted GN schedule, and thesewere done by hand. Incredibly prone to human error.Something as simple as making sure we scheduled contacts within proper view periodswas done by hand, and very prone to human error.Our collaborators needed reports in a variety of formats, and all these were assembledby hand. Prone to human error!In short, we faced a lack of tools which made our daily process long and error-prone. TISI was our answer. Itwas created in under 6 months prior to mission launch, and was validated in simulations and ProficiencyExercises. TISI simplified and automated vast stretches of workflow by delivering on a few key design objectives:102 March 2007 Chapter 4 — <strong>GP</strong>-B On Orbit
Table 4-5. Addressing mission planning needs with TISITISI – Addressing Mission Planning’s NeedsEasy Visualization TISI graphically displays planning data in a customizable viewer which can drill down toany time frame.STK ImportTISI imports data from STK reports, providing it access to all the spacecraft views desired.Visual Scheduling The viewer window is interactive. Scheduling Space and Ground Network passes is a visualexercise, driven by simple clicking.Constraint Checking TISI analyzes both the spacecraft schedule and the current timeline for conformance toconstraint rules.<strong>Report</strong>ingTISI creates a wide variety of reports, from those used by human operators, to GREAS,WOTIS, and SWSI bulk import formats. These reports are validated and error-free.BlackoutsTISI can provide schedule avoidance through the use of blackout periods. In the case of<strong>GP</strong>B, we avoided JPL/DSN views to mitigate a transponder frequency problem.TISI constantly evolved to meet changing needs. Since launch, TISI was upgraded over 30 times to add newfeatures and to make more gains with automation.4.2.2.4 Showcase: Web DeliveryFigure 4-2. Example TISI visualization.Based on the volume and frequency of delivering products to a large number of interested parties, MissionPlanning developed a web-based product delivery system as part of its MP Toolkit. This system replaced apaper-based delivery system which was used in early simulations. The implementation of this system wasinstrumental in automating an entire section of mission planning workflow.<strong>Gravity</strong> <strong>Probe</strong> B — <strong>Post</strong> <strong>Flight</strong> Analysis • Final <strong>Report</strong> March 2007 103
Table 4-6. Features & benefits of Web deliveryWeb Delivery — Features and BenefitsAutomationThis software automated countless hours of photocopying and paper wrangling.Instant AccessProducts are available throughout the day in draft form so our collaborators canexamine them before it’s too late.Version Control All versions of the products are available to our customers.Global AccessProducts are available to all our customers around the world via a secure web site.Digital Formats By providing our products in digital form (rather than paper), our customers can(and have!) write tools to post-process the data.4.2.3 Critical Factor: FlexibilityHaving solved the problem of efficient product generation, the second challenge was how to adapt to theoperational reality of planning a spacecraft, in which plans are made, scrapped, re-formed, and updated asinformation becomes available. The challenge here was planning for the next day’s load, the next week’sschedule, and trying to forecast weeks of schedule in advance, as well!4.2.3.1 On-Orbit Operations: Change is ConstantDuring early IOC, Mission Planning was required to re-implement its operations concept due to the demandson daily workflow, and problem mitigation strategies implemented by mission managers. The following tablehighlights the changes we made to adapt our concept to the reality of on-orbit operations:Table 4-7. Re-inventing the mission operations conceptRe-Inventing the Operations ConceptFrom Baseline toSequence LibraryFrom Change Control toMarkupFWD Antenna AnomalyMitigationExtensive CoverageRequirementsCoverage RebuildingAs the 40-day baseline timeline experienced early deviations, Mission Planningtransformed it into a “sequence library” which could be used in any day’s load, withminor customization.As we moved into the sequence library model, the highly structured change controlprocess designed to capture slight deviations no longer made sense. Weimplemented a “markup” model using Adobe Acrobat, which was much more suitablefor the kinds of changes we experienced.The anomaly which resulted in a reduced-efficiency forward spacecraft antennaresulted in significant challenge to operations. Mission Planning had already laid thegroundwork for solving this problem in the timeline, and was ready when operationsneeded the help!The coverage requirements from engineering and scientists far exceeded missionspecifications. But with tools like TISI in place, Mission Planning was able to absorb theadditional burden easily.Mission Planning was required to rebuild already-build spacecraft timelinesconstituting weeks of time, on many occasions. Mission needs were impossible topredict, and we needed to not only work on the day’s loads, but also consistentlyrework and replan for the future.4.2.3.2 Commitment to the MissionMission Planning is proud of its performance during IOC, and nothing quite communicates this as well as thechart showing just how many hours we spent building our loads and schedules every day. The followingdiagram’s vertical bars illustrate the number of hours our planners stayed late to get the job done during theheavy load days of IOC:104 March 2007 Chapter 4 — <strong>GP</strong>-B On Orbit
Figure 4-3. Number of hours of re-planning required per day during IOC.In addition, these same mission planners were on-call 24 hours a day, 7 days a week during both the IOC andscience phases of the mission, to support emergency changes in the SN and GN schedules, as well as on-orbitconditions which required middle-of-the-night load re-building.4.2.3.3 Flexibility Showcase: Timeline AutomationDuring the Calibration phase of the mission, MP designed and deployed a macro language for TCRs, buildingon our extensive experience with timeline design in the IOC and Science phases. The operations concept wassimple:• A Calibration baseline was created. This is a very simple, repeating structure where every week is thesame.• A TCR for each calibration activity was created – one per day. These TCRs were designed and discussedfor months prior to use.• The TCRs were “marked up” using a macro language developed by MP. These macros were also humanreadableand intuitive.• The macro TCR would be approved, and on the day of its use, it would be run through the processingsoftware which would produce a GREAS file which contained the timeline instructions necessary toimplement the TCR.• A MP would then incorporate this GREAS file into the baseline GREAS file and massage thecomponents into agreement. Some human work is still required, but hours of grunt work waseliminated, and human error removed!<strong>Gravity</strong> <strong>Probe</strong> B — <strong>Post</strong> <strong>Flight</strong> Analysis • Final <strong>Report</strong> March 2007 105
This software added considerable efficiency to the MP workflow, but its real win was in the flexibility it gave us.Experience shows that timeline changes occurred often and late in the load design process, as operators andmanagers reacted to late-breaking spacecraft changes and results. By removing hours of planning and replanningfrom this picture, the Timeline Automation software allowed us to incorporate bigger changes muchlater in the day than we could during the IOC or Science mission phases.4.2.4 Critical Factor: Error-FreeThe third factor critical to Mission Planning’s success was delivering products that were completely error-free,and that met the intentions and operational objectives of the mission. To this end, Mission Planning set out agoal and a key mechanism to achieve it. Our goal was “no data loss”, and our quality assurance mechanism was“timeline verification.” This section discusses these elements.4.2.4.1 No Data Loss!Our customers in the Science Group cared most about one thing: getting their data. And in this area, the goal ofthe Mission Planning team was simple: “Do everything we possibly could to ensure that no data loss occurredfrom anything we could control.” And, throughout the IOC and Science phases of the mission, we weresuccessful! No data loss resulted from our scheduling and load generation products. This achievement was theresult of solid processes that minimized the possibility for human error by employing direct human oversightand double-checking every step of the way.The volume of the task was substantial. Consider:Table 4-8. Mission Planning workload volume—IOC & ScienceWorkload Volume over the Course of IOC and ScienceMonths On-Orbit 17.3 (April 20, 2004 – September 29, 2005)Space Network Passes 9,000Ground Network Passes 2,100Templates Executed during IOC 34,8561,891 templates per week (average)Templates Executed during Science 89,2071,774 templates per week (average)Total Number of Loads 4324.2.4.2 Timeline VerificationDuring IOC, each spacecraft load was custom-built from the library of tasks and blocks of tasks MissionPlanning created. This was a departure from our planned process of working from a constant, controlledbaseline, and this meant that risk was injected into the load development process.106 March 2007 Chapter 4 — <strong>GP</strong>-B On Orbit
Mitigating that risk during IOC became critical, and our solution to this problem was in several parts:• Implement software like TISI to do constraint checking among telemetry-critical tasks.• Direct sub-system engineer panel review on each and every load, every day• <strong>Flight</strong> Director and Mission Director oversight on each and every load, every day• Complete load presentation sessions at the end of the day, visually charting the timeline, contactschedule, and orbital geometry variables such as Guide Star visibility, South Atlantic Anomaly presence,Sun-Eclipse periods, and so forth• Rigorous version control of all load products, with hardcopy product sign-off of precisely the versionswhich would be sent to the spacecraftDuring the Science phase of the mission, daily workflow became much more streamlined, to the point where wewere able to have a baseline for each load during the week. This critical milestone allowed us to implement ourTCR (“Timeline Change Request”) process, which we’d specified prior to launch. Using this systemimmediately resulted in a number of benefits:• Web-based design: use anywhere, cut-and-paste from other electronic products eliminatestypographical errors• First-hand input: written directly by sub-system engineers• Approval from managers: all TCRs must be approved by a Mission Director• Peer review among all other sub-system engineers: eliminates unanticipated impacts in other subsystems• <strong>Post</strong>-implementation review during load sign-off to assure that each and every off-baseline change wasas-intendedThese safeguards proved to be very effective during both the IOC and Science phases of the mission. Timelinesgenerated by the Mission Planning team never created a spacecraft emergency and never put the spacecraft in adegraded state.In summary, the Mission Planning team was able to consistently deliver high quality products that:• Met engineering specifications,• Were thoroughly cross-checked for accuracy by software and a panel of engineers• Were generated with increasing rapidity as the mission progressed• Were available to our user community anywhere they might have been.Mission accomplished!4.3 Data Processing4.3.1 GeneralData processing greatly surpassed its nominal requirement of 95% data capture. The Data Processing teamsupported all vehicle operations and retrieved data in challenging situations, sleuthing out any additional dataconcerns. Data processing team members are currently addressing the task of archiving <strong>GP</strong>-B data for longtermaccess.<strong>Gravity</strong> <strong>Probe</strong> B — <strong>Post</strong> <strong>Flight</strong> Analysis • Final <strong>Report</strong> March 2007 107
It is said that “an experiment is only as good as its data.” So, one might ask, “How useful are the actual data thatwere collected during the 50-week science phase of the <strong>GP</strong>-B experiment? Was it sufficient? For <strong>Gravity</strong> <strong>Probe</strong>B, the best gyro precession data were collected when the telescope was precisely pointing at the guide star, whenthe spacecraft was in Guide Star Valid (GSV) mode (that is, when the spacecraft was “In front” of the Earth, witha direct line of sight to the guide star), and when the spacecraft’s orbit was outside the South Atlantic Anomaly(SAA) region, located in the vicinity of the lower tip of South America. Since the Earth eclipses the guide starevery orbit, these optimal conditions occurred only about 54% of the time. Data collected during the remaining46% of the time was still useful to the experiment, but these data are not directly being used to calculate the gyroprecession due to general relativity.The data processing software and team can only process data that they actually received from the spacecraft.There are many reasons why data may not arrive. For example, ground-based experiments can lose data due tofaulty collection techniques, decommutation errors, or inadequate storage methods. Satellites are prone to allthese factors, and additionally, they can lose data because of temporary on-board data storage problems in thesolid state recorder, communication problems or ground station errors. Fortunately, barring anomalies, manyof these factors can be managed to minimize the amount of data this is lost.For example, during ground contacts, streaming of data was re-routed from the solid state recorder to thetransmitter, during which time the solid state recorder was not recording data. During the interval after thesolid state recorder stopped recording, but before the ground station locked up with the transmitter, data waslost. By careful management of operational parameters, such as accurate vehicle position knowledge and groundstation mask angle, data loss during that transition was minimized. Data was also lost whenever the spacecraftchanged its data stream from the forward antenna to the aft antenna. For the <strong>GP</strong>-B spacecraft, loss of dataduring these antenna-switching periods was typically minimized to less than 40 seconds. These periods couldnot be managed by <strong>GP</strong>-B, since they were a function of the slew rate of the ground dish and the speed of thevehicle. By scheduling ground contacts during guide star invalid periods, we further minimized science dataloss. Unfortunately, given the geometry of the <strong>GP</strong>-B orbit with respect to the ground stations, schedulingground passes during Guide Star Invalid (GSI) periods (the period during each orbit when the spacecraft was“behind” the Earth, eclipsing its direct view of the guide star) was not always possible.Management of the solid state recorder itself also mitigated data loss. Some ground station passes resulted in anunacceptably high number of data gaps— three or four is typical and acceptable, but occasionally ground passesgenerated more than 100 gaps. When data gaps were unacceptably high, the solid state memory location writerpointer had to be moved to prevent data from being over written. On these occasions, data processing workedwith the operations team to prevent data loss.For the <strong>Gravity</strong> <strong>Probe</strong> B mission, data loss was minimal. Mission specifications mandated that 95% of the dataretrieved by the ground station had to be decommutated and stored in the <strong>GP</strong>-B L1 database. In fact, 99.62% ofall 32K data, and 97.47% of 32K data collected during GSV periods was recovered and processed. Table 4-9summarizes the data capture statistics.Table 4-9. Summary of Data CaptureSampling PeriodData RecoveredPre-launch Specification 95.00%Total 99.62%Guide Star Valid, outside SAA (“Optimal Science Data”) 97.47%108 March 2007 Chapter 4 — <strong>GP</strong>-B On Orbit
4.3.1.1 Automated Telemetry Data ProcessingIn addition to decommutation of the L0 data, an important function of the <strong>Gravity</strong> <strong>Probe</strong> B data processingalgorithms was to clean up incoming data. Data had to be thoroughly vetted to remove redundant points andfiller packets, along with noisy data caused by interference or antenna problems. While data integrity wasparamount, high priority was also given to efficiency in this cleanup process. The data processing group isproud of its capability to process ten hours of spacecraft data is less than an hour—well within the specification.A tremendous effort was made to automate data processing—to the extent possible—so that data was madeavailable as quickly as possible. After data from the <strong>GP</strong>-B satellite was telemetered to the ground station, the fileswere sent to SAFS at Goddard Space <strong>Flight</strong> Center in Maryland. Data files were transferred via the NASA IOnetinto the MOC, and detected by the automated data processing less than five minutes after arrival. TDPautomatically checked for errors, filler packets and redundant data points, placing the cleaned data into the L0database, and the decommutated data into the L1 database. L1 data could then be called by the various IDL andMatlab analysis tools used by the <strong>GP</strong>-B science and engineering team. All daily web plots, SAFS confirmationemails, user notification emails and data processing logbook entries were automated. More importantly, thesystem was designed with error handling in mind. For example, if data was expected at <strong>Stanford</strong> but had notarrived in a specified time, automated software alerted personnel on the data processing team. Furthermore,data with problems were rejected automatically before entering the Telemetry Database and staff was alerted viaemail.Figure 4-4. Data flow through the <strong>GP</strong>-B’s automated data processing.4.3.1.2 Data CaptureData capture was excellent. The data processing group was able to process 100% of all the data received by theground stations, keeping verifiable good data and not allowing corrupted or suspect frames. Since day 111,2004, ~85 hours of data in total were not present. However, this was non-recoverable data—places where therecorder was not on or commanding wasn’t possible. All data gaps over 10 seconds have been accounted for aseither spacecraft antenna switch activity, or they have been correlated to a specific vehicle or commandanomaly. Approximately 1,680 vehicle data files were processed between launch in April 2004 and the end of thepost-science calibration phase in September 2005. Over 300 gigabytes of raw data was stored, in addition todatabase storage. Table 4-9 lists events and sources of lost data.<strong>Gravity</strong> <strong>Probe</strong> B — <strong>Post</strong> <strong>Flight</strong> Analysis • Final <strong>Report</strong> March 2007 109
Table 4-10. Significant Events/Sources of Data LossEvent/SourceTime (Hrs)Anomaly 34 (CCCA Switch on 5/3/04) 0.76 **08:49:19.7Day 125, 5/4/04 03:44:47.1Day 130, 5/9/04 01:34:30.0Anomaly 73 (MSS Reload on 6/30/04) 0.58Day 240, 8/27/04 01:37:30.0Day 260, 9/16/04 01:55:30.0Day 268, 9/24/04 01:35:09.8Anomaly 148 (CCCA Switch on 3/4/05) 7.09 **13:34:29.8Anomaly 152 (CCCA Reboot on 3/15/05) 6.36 **08:13:57.2Anomaly 156 (CCCA Reboot on 3/18/05) 3.11 **06:23:06.4**Couldn’t command to turn on recorder 2/22/05 2.6Ground Station initial capture, antenna switch, and loss of 17.25signal (Typically 4 times per day)Other –Please add cycle 13 data of 42h:28m:06.2s – partly inA34, 148, 152 & 156.Total ~37.64.3.1.3 TCADThe main tool for viewing L1 data was TCAD, a program originally written by University of Colorado’sLaboratory for Atmosphere and Space Physics (LASP), and modified for <strong>Gravity</strong> <strong>Probe</strong> B by the data processinggroup. Since launch, TCAD had only one major upgrade to version 2.4.1, incorporating many unanticipatedfeatures desired by the engineering staff. The software, based on IDL version 5.4, was version controlled andunderwent extensive regression testing prior release on February 11, 2005. Feedback to LASP is planned.4.3.2 Data ArchivingPlans are currently underway to archive the <strong>Gravity</strong> <strong>Probe</strong> B data in the National Space Science Data Center(NSSDC), located at Goddard Space <strong>Flight</strong> Center in Greenbelt, Maryland. Data archival is a contractualagreement, as described in S0331, Mission Data Management Plan.4.4 Orbit DeterminationThere were two basic orbit requirements imposed by <strong>Gravity</strong> <strong>Probe</strong>-B science objectives. The first was toprecisely align the initial orbit plane with respect to the guide star such that non-relativistic torques on each ofthe four gyroscopes would nearly average out during the science mission. The second was to determine theposition and velocity with high accuracy continuously during the mission.<strong>GP</strong>-B science requirements placed very strict limits on the placement and evolution of the <strong>GP</strong>-B orbit planeover the life of the mission. Over the course of a 10 - 14 month science mission, the average deviation of the lineof-sightto the guide star from the orbit plane was required to be under 0.025 degrees. Through proper design oflaunch vehicle insertion conditions, careful consideration of expected orbit perturbations, and plans tocompensate for any launch dispersions with a limited capability to trim orbit inclination errors, the <strong>GP</strong>-Bproject has ensured that the established <strong>GP</strong>-B orbit will satisfy all science requirements.110 March 2007 Chapter 4 — <strong>GP</strong>-B On Orbit
At launch, <strong>GP</strong>-B’s inclination was just 5x10 -5 degrees away from the desired inclination, which corresponds toonly about 6 m of error assuming a planned 60-day Initial Orbit Checkout (IOC). This small error eliminatedthe need to carry out orbit trim maneuvers. Even without trimming, the average orbit plane errors over the lifeof the science mission are expected to remain under 0.020 degrees - well within requirements.<strong>GP</strong>-B operations also required accurate orbit determination (OD) in order to establish the <strong>GP</strong>-B position andvelocity to within 25 m and 7.5 cm/sec RMS throughout the mission. <strong>GP</strong>S observations available at 10-secondintervals were processed using the commercial Microcosm orbit determination program in daily 30-hour batchfits to satisfy those requirements.4.4.1 The <strong>GP</strong>-B Mission Orbit DesignThe <strong>GP</strong>-B altitude was planned to be approximately 650 km, based on launch weight considerations and a desireto be above the region in which atmospheric drag could overpower the Helium thrusting that maintains themission’s drag-free status. The specific mean semi-major axis was finally chosen to be about 10 km lower, at7018.0 km, in order to be between two repeat ground track resonances that would have complicated the IOCtrimming process. In addition, it was desired that the orbit be nearly circular in order to minimize dragfluctuations around the orbit. The target mean eccentricity and argument of perigee were chosen to be 0.00134and 90 degrees, the stable (“frozen”) values at <strong>GP</strong>-B mission altitude.The orbit plane was to have its descending node remain near the right ascension of the guide star, so that thespacecraft axis would remain nearly in the orbit plane to minimize gyroscopic torques. That implied a nearpolar orbit to minimize nodal precession and, after HR 8703 was chosen as the guide star, it implied a launchthat was timed to place the right ascension of the orbit’s descending node near 343 degrees.The specific inclination and nodal values for the <strong>GP</strong>-B orbit plane were derived from the requirement that:“[The] final target orbit shall be chosen such that the predicted angle between the line-of-sight to guidestar and the orbit plane, averaged over an interval longer that 10 months and less than 14 monthsstarting 2 months after launch, is less than 0.025 degrees.”The specified angle in the preceding requirement, commonly known as η (eta), is illustrated in Figure 4-5below. The η-angle is significant because of its relationship to gyroscopic torque. Outside disturbances likegyroscopic torque must be kept to a minimum to improve the accuracy of measurements obtained by the <strong>GP</strong>-Bscience experiment. Since gyro torque is proportional to the distance between the gyroscope and the orbit plane,gyro torque is also proportional to η. The science requirement that η be < 0.025 degrees when averaged over aninterval of 10 – 14 months, allows the effects of gyro torque on precession rate to nearly cancel.Mathematically, the angle η is obtained from the following equation:sin η = cos i sin δ* + sin i cos δ* sin(Ω - Ω*)η ≈ (90°- i) sin δ* - (Ω - Ω*+180°) cos δ*where δ* and Ω* are declination and right ascension of the guide star, corrected for aberration and propermotion and expressed in true-of-date coordinates. Errors in η-average arise from errors in the histories of theorbit’s inclination and right ascension of ascending node (i and Ω) during the mission, after the end of IOC.The key issue here is that there can be no corrective thrusting after the drag-free mission begins, so the orbitparameters at the end of IOC must be established very accurately. In particular, the inclination then must becorrect to within about ±0.00020 degrees, a value much more precise than needed for most missions. In order toobtain that inclination accuracy, the mission profile allowed for almost continuous cross-track thrusting(“trimming”) during the nominal 60-day IOC, using low-thrust Helium venting to remove the inclinationerrors made by the launch vehicle at insertion.<strong>Gravity</strong> <strong>Probe</strong> B — <strong>Post</strong> <strong>Flight</strong> Analysis • Final <strong>Report</strong> March 2007 111
Figure 4-5. Pictorial depiction of η. The circle represents the Earth, the vertical line is the orbit plane viewededge-on, and the asterisk represents the guide star. η is the angle between orbit plane and guide star atany point in the orbit plane.4.4.2 Launch RequirementsThe orbit plane parameters that satisfy the requirement above depend on the launch day. That is, they dependon the motions of the orbit plane, which depend on the positions of the sun and moon during the mission.For each potential launch day, an iterative process using semi-analytic integrations of orbit elements for 16months was used to determine initial i and Ω values that satisfy the η-average requirement. It was found thatacceptable i and Ω pairs filled a thin lens-shaped region. The center of the lens was chosen as the inclination andnodal target for each mission start day. (The lens boundaries are different for each start day, but the thinness ofthe lens is nearly constant, and that thinness limited the initial mission mean inclination values to ±0.00020degrees for maximum nodal launch errors). Launch vehicle requirements for each launch day were obtained bypropagating the mission target elements backward to launch time.Figure 4-6 illustrates an example of those computations. It shows the expected evolution of eta and eta-average(the pairs of curves with the same color) after a launch that takes place on 20 April 2004. The x-axis indicatestime in months and includes the nominal 2-month IOC period as well as the 10 - 14 month science period(yielding a total duration of 12 – 16 months). The three cases shown represent the optimum andmaximum/minimum allowable inclination limits, assuming in this case an ideal value of the right ascension ofthe ascending node. The max/min curves represent the worst-case initial inclination errors for which etaaveragewould just remain within the ±0.025° limits for a science mission lasting anywhere from 10 to14 months.112 March 2007 Chapter 4 — <strong>GP</strong>-B On Orbit
Figure 4-6. Eta and Eta-Average Histories (Degrees) Associated with <strong>GP</strong>-B4.4.3 <strong>Post</strong>-Launch Orbit EventsOn April 20, 2004, the Delta II 7920-10 launch vehicle injected the <strong>Gravity</strong> <strong>Probe</strong>-B satellite into an excellentorbit. The altitude, eccentricity, argument of perigee and ascending node were well within specifications and,most importantly, the inclination was almost perfect—within 5x10 -5 degrees of the target (a cross track error ofabout 6 meters!) That was well within the ±0.00020 degree inclination trimming goal, so it was decided that notrimming would be used during IOC.However, the target values for inclination had been based on a 2 month IOC span, so as the need to extend theIOC period beyond 2 months arose, estimates of η-average errors for the current <strong>GP</strong>-B orbit for longer IOCspans were required. Figure 4-7 illustrates <strong>GP</strong>-B’s computed eta-average histories for 60-, 90- 120- and 150-dayIOC periods as a function of science mission duration. The red lines delineate the ±0.025 deg limits onη-average imposed by science. It can be seen there that even with the actual 141-day IOC duration (forgyroscopes 1-3) and the 158-day IOC duration (for gyroscope 4), the <strong>GP</strong>-B orbit would satisfy the eta-averagerequirement for any science mission lifetimes lasting longer than two months. For the actual expected sciencemission lifetimes of 10 or 11 months the eta-average errors will be less than 0.020 degrees, well within the etaaveragerequirement.<strong>Gravity</strong> <strong>Probe</strong> B — <strong>Post</strong> <strong>Flight</strong> Analysis • Final <strong>Report</strong> March 2007 113
Figure 4-7. Eta-Average Error Associated with <strong>GP</strong>-B Orbit as a function of IOC duration and sciencemission lifetime4.4.4 Orbit Determination Calculations<strong>GP</strong>-B operations also require an accurate knowledge of the satellite ephemeris throughout the mission. Themost stringent requirements are for 25 m and 7.5 cm/sec RMS position and velocity accuracy, to permitaccurate relativistic drift scaling and allow the computed aberration signature to be used for science signalcalibration. There also is a looser requirement for regular three-week predictions for scheduling missionoperations.For those purposes, <strong>GP</strong>-B ephemeris segments have been generated every day using independent batch fits to30-hour data spans centered on Greenwich noon. That allows for 6-hours overlap before and after each segmentfor consistency comparisons.Global positioning system (<strong>GP</strong>S) measurements have been used as the primary means of orbit determinationwhile Satellite Laser Ranging (SLR) measurements have been used as an independent means since late-July2004. A similar procedure is used on both data sets to generate daily solutions.4.4.4.1 OD Using <strong>GP</strong>S Data<strong>GP</strong>S data points are taken once every 10 seconds. Duplicate points and points with impossibly large or smallradius values are removed from the data set before a <strong>GP</strong>S solution is generated. The result is a data set at around7500-8500 time points in each 30-hour segment (Figure 4-5). The decrease in usable points available after day66 reflects a switch from A-side to B-side <strong>GP</strong>S receiver.Next, the commercial software package Microcosm was used to fit an ephemeris to the data. The 35 x 35 gravitymodel jgm3 was used for these fits, along with lunar-solar and earth-tide effects, a constant (shadowed)radiation pressure model and a Jacchia 71 atmospheric density model, both with adjustable scale factors.114 March 2007 Chapter 4 — <strong>GP</strong>-B On Orbit
After some initial experimentation a decision was made to solve for 9 parameters during each fit. Initially thosewere the 6 state variables (position and velocity) plus a drag coefficient and two sinusoidal in-track accelerationsat orbital period to account for mis-modeled drag and eccentricity vector component rates. Because slowlyvarying constant and sinusoidal axial thrusting components persisted throughout the science mission, <strong>GP</strong>-Borbit determination continued to solve for those 9 parameters after IOC. The unconstrained drag coefficientabsorbed the dominant in-track effects of the slow semi-major axis variations due to the sinusoidal axialthrusting term, and the in-track sinusoidal parameters modeled the eccentricity vector rate errors due to theconstant axial thrusting term.Figure 4-8. Usable <strong>GP</strong>S Points per Day (2005)Daily residual plots (Figure 4-9) are generated to assess how well the ephemeris fits the data. Standarddeviations for cross-track residuals are typically less than 5 meters, in-track residuals less than 10 meters, andradial residuals around 15 meters. It can be seen from Figure 4-6 that, for this solution, RMS values areprimarily due to data noise – the ephemeris errors are far smaller. The corresponding overlap comparisonsbetween successive daily 30-hr solutions are a better indication of actual orbit errors. Those daily orbitcomparisons typically yield in-track and radial variations of just a few meters, and cross-track variations areoften less than a meter.There are exceptions to this general pattern of operations. On several days (for example, day 66 in Figure 4-5)there were gaps in the <strong>GP</strong>S data that prevented the use of a normal 30-hour fit span. When such gaps occurred,2 or 3 days of <strong>GP</strong>S data were used to create an ephemeris segment spanning the gap. Also, on some days whenthe sinusoidal axial thrusting interacted with the orbital motion so as to generate in-track perturbations with anearly daily period, the in-track effects could not be well approximated by fitting a drag coefficient alone. Forthose ephemeris segments, it is possible to reprocess the data with shorter fit spans and fit additional parametersas needed.<strong>Gravity</strong> <strong>Probe</strong> B — <strong>Post</strong> <strong>Flight</strong> Analysis • Final <strong>Report</strong> March 2007 115
4.4.4.2 OD Using SLR DataFigure 4-9. Typical residual plot from daily <strong>GP</strong>S solution.SLR data are available as a back-up to <strong>GP</strong>S data and also as an independent check of <strong>GP</strong>S ephemeris solutionaccuracy.SLR data consist of round-trip range measurements to the <strong>GP</strong>-B spacecraft from an international network oflaser ranging ground stations. Orbit determination accuracy from laser ranging measurements is dependent onthe number of passes and the spatial distribution of those passes over the solution interval. Due to <strong>GP</strong>-B'sinertial pointing attitude and the placement of its retro-reflectors (on only one end of the spacecraft) lasermeasurements can only be sampled on the portion of the orbit closest to the guide star and mostly only over theNorthern Hemisphere. Consequently, SLR solution accuracy is limited by both geometry and samplingfrequency.116 March 2007 Chapter 4 — <strong>GP</strong>-B On Orbit
There is significantly more variation in the amount of SLR data received each day than in the amount of <strong>GP</strong>Sdata received each day. Figure 4-10 shows a history of <strong>GP</strong>-B SLR passes to date. SLR tracking was initiated inlate-July of 2004, and passes have varied from 0 to17 passes per day (or 0 to 20 passes per day over the nominal30-hour <strong>GP</strong>-B orbit determination solution interval). To date an average of about 5 SLR passes are collected perday. A minimum of 3 or 4 passes are typically required to obtain a valid solution. An attempt is always made toobtain as many observations as possible, but it is impossible to control factors such as weather. It is estimatedthat at some sites, cloud cover is too great for laser ranging 50% of the time.Figure 4-10. SLR passes per dayFor comparison purposes, orbit determination using SLR data was performed in a manner identical to thatusing <strong>GP</strong>S data (i.e., Microcosm software is used along with a 35x35 jgm3 gravitational model, lunar-solar andearth-tide effects, a constant radiation pressure model and Jacchia '71 density model, and the solved-for stateconsisted of position, velocity, drag coefficient and two sinusoidal in-track accelerations at orbital period).Two checks were performed to assess the accuracy of SLR orbit solutions. The first check compares each 30-hour SLR solution with the corresponding 30-hour <strong>GP</strong>S solution for that day. These 30-hour comparisons haveyielded differences that ranged from ±0.5 meters to ±20 meters in the cross-track direction and from ±15 metersto more than ±150 meters in the in-track direction (although in rare cases of bad geometry and few passes theyhave been as large as ±1.5 km).The second check of SLR solutions consists of a 6-hour overlap compared with the previous day’s SLR solution.To date, the 6-hour SLR overlaps for cross-track vary from a couple of meters at best to about 400 meters atworst. In-track errors vary from about 5 meters to over 100 meters. Maximum daily cross track overlap errorsfor SLR and <strong>GP</strong>S ephemeris segments are compared during part of 2004 in Figure 4-11.Based on comparisons performed to date <strong>GP</strong>-B SLR orbit solutions have exhibited errors approximately 10times larger than those using <strong>GP</strong>S data. If necessary, those SLR results could be much improved by fittingseveral days of SLR data together into longer ephemeris segments.<strong>Gravity</strong> <strong>Probe</strong> B — <strong>Post</strong> <strong>Flight</strong> Analysis • Final <strong>Report</strong> March 2007 117
4.4.5 ConclusionsFigure 4-11. Comparison of <strong>GP</strong>S and SLR Cross-Track Errors.Detailed pre-launch planning for any launch day plus a precise launch on a Delta II 7920-10 allowed the <strong>Gravity</strong><strong>Probe</strong>-B satellite to attain an orbit that satisfied all mission control requirements even though the IOC periodwas considerably extended.Accurate and abundant <strong>GP</strong>S measurements used in the commercial Microcosm orbit determination programhave allowed the <strong>GP</strong>-B ephemeris to be constructed to within all accuracy requirements throughout themission.4.5 Computer HardwareThe stability of the ground hardware played a vital role during all operational phases of the <strong>Gravity</strong> <strong>Probe</strong> Bmission. The <strong>Stanford</strong> Mission Operations Center (MOC) computer network is a state of the art system used forground commanding and real time telemetry. The Science network is used primarily for science analysis. Bothnetworks are UNIX based and proved to be remarkably robust during all phases of the mission. Figure 4-12shows a block diagram of the hardware network118 March 2007 Chapter 4 — <strong>GP</strong>-B On Orbit
4.5.1 ReliabilityFigure 4-12. <strong>GP</strong>-B Computer Network.The computer hardware performed near flawlessly during the <strong>Gravity</strong> <strong>Probe</strong> B mission. The moc-server had anuptime of 290 days before a breaker was accidentally tripped during a routine cleanup causing a reboot.During the IOC phase of the mission, two hardware malfunctions occurred, both involving hard drives. ThePOD E5 client disk failed, as did the Science server boot disk. Both disks were replaced within 45 minutes, andno data were lost.During the science phase of the mission, several computer power supplies failed, but were replaced within 2hours (MOC specifications require 24 hour turn around time). The SUN blade computers, the main class ofcomputer on both the MOC and Science Networks, performed exceptionally well.No problems were reported during the calibration phase of the mission.Despite repeated attempts, neither network was ever compromised by hackers. Logs routinely showed hackerattempts on our clients connected to the open IONET. However, our firewall did an excellent job keepinghackers off our science net – not a single entry was recorded.4.5.2 Disk Storage IssuesDisk storage proved a particular problem during the <strong>Gravity</strong> <strong>Probe</strong> B mission, with space requirementsconsistently underestimated.The extension of the IOC phase did cause several problems for the hardware group, although more from amanagement standpoint than from equipment concerns. In particular, prior to launch, the decision was madeto lock down all hardware modifications, even though disk usage was close to maximum. Considering a 44 dayIOC, the decision to increase disk storage after IOC seemed reasonable. Unfortunately, increased storage needsdue to an extended IOC caused disk usage to max out several times. User disk storage space was increasedshortly after the end of IOC, and has been sufficient.The <strong>GP</strong>-B database was similarly stressed, as storage requirements increased and necessary databasemaintenance postponed. Fortunately the database was fully checked out several weeks prior to launch, andefficiently managed during IOC. Prelaunch predictions underestimated the amount of data to be stored,requiring the acquisition of significantly more data base storage space.<strong>Gravity</strong> <strong>Probe</strong> B — <strong>Post</strong> <strong>Flight</strong> Analysis • Final <strong>Report</strong> March 2007 119
Overall, the storage issues did not significantly affect users of the data, but serve as a valuable “lesson learned”for future missions.4.5.3 System Design – MOC LANThe MOC as configured provided reliable support throughout the <strong>GP</strong>-B mission. It easily fulfilled allrequirements; no systemic changes were needed. However, post launch two issues arose that would haveimpacted the system design had they been requirements: SN/GN desktop reconfiguration, and autonomousoperation of MOC. These issues fall into the category of lessons learned, and are covered below.4.5.3.1 SN/GN Desktop ConfigurationThe podD-podE design always assumed that should podD go down, the Mission Operations team would restartpodE as the prime pod and continue with only a ~5min downtime. However, it turned out that changing an SNor GN site from connecting with podD over to connecting with podE took much, much longer (on the order of30 minutes). Thus, the Mission Operations guideline was changed to fix podD, instead of attempting to swap inpodE in its place. In hindsight, a simple hardware design of adding a firewall that allowed the use of “pseudo” IPaddresses, so that the SN/GN stations would always connect to the same IP address, would have enabled aswitch between podD and podE, without the outside stations ever knowing the difference, allowing the “5 min”switch-over to podE to be accomplished.4.5.3.2 Autonomous MOC operations.In the present hardware design, for S/W on podD to send a page for a RTworks out-of-limit violation requires22 independent electronic boxes (over four separate LANs) be functional from the incoming T1 line to theoutgoing SU internet router. A completely different approach to the pod design would have allowed this to bereduced to ~6 boxes for autonomous operation—two of which are redundant servers.4.5.4 System Design – SCIENCE LANSybase servers are the only major components of the SCIENCE LAN that changed since launch, and this wasdue to the need to increase disk capacity by ~50%. The safest approach was to create an entirely new server(“sci-base”), and have the DBA run many regression/stress tests on it. After passing all the tests, the new server’sdata were synchronized and then the new server was made the production server. Hence, the mission went fromone server that had both NFS and Sybase responsibilities, to two servers—one with NFS server and the other asthe primary Sybase server. Since Sybase recommends running the Sybase application program on its own server,the new configuration is preferable4.5.5 PerformanceFor operations, only one performance-related issue was noticed during the <strong>GP</strong>-B flight mission: On launch day,podE went down due to an OASIS “overload” situation.All the MOC workstations were running 100Mbit/sec Ethernet. The highest real-time downlink rate from theS/V was 32Kbit/sec. So, the LAN had a maximum bandwidth ~3 orders of magnitude above the incoming bitstream. The incoming bit stream arrives at podE1, and from there it is sent to OASIS on podE2 and to RTworkson podE3. OASIS or RTworks displays can be “sent” to any MOC workstation, and this was accomplished viathe “Xterminal” protocol. This protocol can require very extensive LAN bandwidth.120 March 2007 Chapter 4 — <strong>GP</strong>-B On Orbit
On the day of the launch, many of the Responsible Equipment Engineers had opened multiple RTworksdisplays, in order to best monitor their equipment. Early on launch day, so many displays were “sent” to otherworkstations that OASIS fell so far behind keeping up in real-time that it crashed. The impact was immediatelynoticed, and the work-around quickly determined— simply close displays. The team was alerted, and throughcontinuing training, this problem never recurred.A better distributed processing solution would have been to run OASIS on any workstation that needed OASISdisplays, and simply pipe the low-bandwidth-telemetry to those workstations (i.e. do not use the Xterminalprotocol, run multiple instances of OASIS instead).4.6 The Integrated Test Facility (ITF)The Integrated Test Facility (ITF) is composed of flight-equivalent electronics boxes, software, and hardwaresimulators which model the <strong>GP</strong>-B space vehicle. The Pods in the ITF are computers designed to run and operatethe vehicle ground support software. In early phases of program development, the ITF is used to 1) test flighthardware for proper operation prior to being installed on the spacecraft, 2) test hardware interfaces, 3) resolvehardware discrepancies, and 4) develop and test flight software. Later in the program, the ITF is used to run testscenarios to verify software and operations sequences. The ITF also provides a flight-like space vehiclesimulation for the operations team to use during mission rehearsals. During the on-orbit phase of the program,the ITF is used to test sequences prior to being run on the vehicle and troubleshoot flight anomalies. The ITFhas been an important <strong>GP</strong>-B resource to reduce program riskThe electronic boxes in the ITF are listed in Table 4-11 below. Each unit is categorized as a Engineering Unit(EU) or Functional Equivalent Unit (FEU). A photograph of the ITF hardware is shown in Figure 4-13.Table 4-11. ITF equipment listEQUIPMENTTYPECommand / Control Computer Assembly (CCCA)FEUCommand and Telemetry Unit (CTU)FEUAttitude Control Electronics (ACE) ----------Aft Experiment Control Unit (Aft ECU)FEUFwd Experiment Control Unit (Fwd ECU)FEUInterface Unit (IU)FEUGlobal Position System Receiver A (<strong>GP</strong>S “A”)EUGlobal Position System Receiver B (<strong>GP</strong>S “B”)EUAft Gyro Suspension System 1 (AFT GSS1)EUAft Gyro Suspension System 2 (AFT GSS2)EUAft Gyro Suspension System 3 (AFT GSS3)FEUAft Gyro Suspension System 4 (AFT GSS4)EUFwd Gyro Suspension System 1 (Fwd GSS1)EUFwd Gyro Suspension System 2 (Fwd GSS2)EUFwd Gyro Suspension System 3 (Fwd GSS3) ----------Fwd Gyro Suspension System 4 (Fwd GSS4) ----------Aft Squid Readout Electronics A (Aft SRE A)FEUAft Squid Readout Electronics B (Aft SRE B)EUFwd Squid Readout Electronics A (Fwd SRE A)FEU<strong>Gravity</strong> <strong>Probe</strong> B — <strong>Post</strong> <strong>Flight</strong> Analysis • Final <strong>Report</strong> March 2007 121
Table 4-11. ITF equipment listEQUIPMENTTYPEFwd Squid Readout Electronics B (Fwd SRE B)FEUStar Sensor A (SS A) ----------Star Sensor B (SS B) ----------Solid State Recorder (SSR)EUTelescope Readout Electronics A (TRE A)EUTelescope Readout Electronics B (TRE B) ----------Transponder A (XPDR A)FEUTransponder B (XPDR B) ----------Figure 4-13. The Integrated Test Facility (ITF) flight simulator hardware in a Clean Room at Lockheed MartinA detailed description of the ITF can be found in Integrated Test Facility (ITF) User’s Guide (LM/P4808181/20/2004).122 March 2007 Chapter 4 — <strong>GP</strong>-B On Orbit
5Managing Anomalies and Risku<strong>Gravity</strong> <strong>Probe</strong> B — <strong>Post</strong> <strong>Flight</strong> Analysis • Final <strong>Report</strong> March 2007 123
124 March 2007 Chapter 5 — Managing Anomalies and Risk
5.1 The Spacecraft’s TaleWe begin this chapter with a <strong>GP</strong>-B Mission News story entitled “The Spacecraft’s Tale,” that was featured in ourWeekly Status Update, posted on our <strong>GP</strong>-B Web site and sent out to our email subscriber list on December 10,2004, following an anomaly with the spacecraft’s <strong>GP</strong>S system that occurred over the South Atlantic Anomalyregion of the Earth.Last Saturday began as a rather “ho-hum” California winter’s day. Orbiting the Earth every 97.5 minutes, the<strong>GP</strong>-B spacecraft passed directly over California around 6:30AM PST, but the Sun was already up, and the skywas too bright to see the satellite. In the <strong>GP</strong>-B Mission Operations Center (MOC), a skeleton crew, consistingof the on-duty Mission and <strong>Flight</strong> directors and one or two resident engineers, monitored several telemetrypasses (communications sessions) during the morning hours. Most were 25-minute satellite passes, duringwhich the spacecraft relays status information to the MOC through the NASA TDRS (Tracking and Data RelaySatellite) communications satellite system. And, during a 12-minute ground pass at 1:15PM PST, thespacecraft’s solid-state recorder relayed relativity data to the <strong>GP</strong>-B science database through a high-speedtelemetry connection with the Svalbard ground tracking station in Spitsbergen, Norway. All in all, it was anormal Saturday, and the atmosphere in the MOC was quite relaxed.Following the successful ground pass with Svalbard, the spacecraft continued on its southward route. Ataround 1:30 PM PST, Pacific time, the spacecraft was flying over South America—heading towards the SouthPole—when it entered the South Atlantic Anomaly (SAA). This is a region above the Earth where the fluxes oftrapped protons and other particles, emitted by the Sun, are much greater than anywhere else on Earth, due tothe asymmetry of the Earth’s protective Van Allen Radiation Belts. Thus, spacecraft are more vulnerable tobeing struck by protons when flying through this region.At 1:48PM, Pacific Time, an odd event silently occurred on-board the spacecraft, triggering four safemodes(pre-programmed command sequences designed to automatically place the spacecraft, its gyros, telescope, andother systems and instruments, in a stable and safe configuration in response to anomalous or out-of-limitsfeedback from various on-board sensors).Back in the MOC, the next telemetry pass was not scheduled until 3:16 PM, so the operations staff wascompletely unaware of this change in the spacecraft’s condition—for the time being. At 3:15PM, the MOC staffsettled into their seats for the upcoming satellite status telemetry pass. As the spacecraft’s antenna locked intothe TDRSS satellite and began transmitting, one-by-one, status monitors around the MOC began turning red,signaling the spacecraft had triggered its safemodes. There is a problem on-board.During the next 20 minutes, phones rang, pagers beeped, and soon, the MOC was teaming with activity. Anassessment of the safemodes that were triggered indicated that an error—never seen before--had occurred in amodule of the Attitude and Translation Control (ATC) computer system. The spacecraft’s <strong>GP</strong>S had registeredan off-the-scale velocity spike, which if correct, indicated that, for one brief moment, the spacecraft hadtraveled faster than the speed of light—or to use Star Trek terminology, it had “warped into hyperspace.” Infact, the <strong>GP</strong>S system had reported a single data point with an erroneously high velocity, which when squared,caused a computer overflow. The ATC computer module took exception to this data overflow and triggered asafemode test, which in turn activated a chain reaction response sequence.The MOC staff immediately scheduled several extra satellite communication passes so they couldcommunicate with the spacecraft more frequently. Then, over the ensuing 24 hours, they methodically workedthrough a series of tests and command sequences to return the spacecraft to its normal science operationmode. We initially assumed that the <strong>GP</strong>S receiver had suffered a proton hit in the SAA region, but furtheranalysis suggests that this was not the case. Rather, this anomaly was apparently caused by one of the fouraccessible <strong>GP</strong>S satellites being in the wrong position for proper <strong>GP</strong>S triangulation. The ATC system usuallycatches situations of this kind and disallows the data; but, this one was out of range before the data reached thefilter.The spacecraft has returned to normal operations. This incident was not detrimental to the <strong>GP</strong>-B experimentaldata. And, once again, the fact that an anomalous event occurred while the spacecraft was flying through theSAA region appears to be a coincidence—or is it?<strong>Gravity</strong> <strong>Probe</strong> B — <strong>Post</strong> <strong>Flight</strong> Analysis • Final <strong>Report</strong> March 2007 125
5.2 Overview of <strong>GP</strong>-B Anomalies in OrbitThe Spacecraft’s Tale above typifies the anomaly discovery, review, and resolution process that our MissionOperations Team and Anomaly Review Board worked through time and again during all phases of the <strong>GP</strong>-Bmission. The details were different in each case, but the discovery, analysis, and resolution process was alwaysthe same.Over the course of the flight mission, the <strong>GP</strong>-B Anomaly Review Board (ARB) successfully worked through 193anomalies/observations. Of these, 23 were classified at true “anomalies,” five of which were sub-classified as“major anomalies,” including the B-Side computer switch-over and the stuck-open valve problems with twomicro thrusters early in the mission, as well as subsequent computer and subsystem reboot problems due toradiation strikes. Of the remaining 18 anomalies, 12 were sub-classified as “medium anomalies” and 6 were subclassifiedas “minor anomalies.”The 170 other issues (88%) were classified—at least initially—as “observations.” These observations typicallydocumented various unanticipated events, sub-optimal parameter settings, and other odd results that weremonitored until their root cause was understood. In several cases, observations were escalated to anomalystatus, and then necessary actions were taken not only to understand, but also to correct the problem. In allcases, the established anomaly resolution process enabled the team to identify the root causes and providerecovery procedures.Section 5.3 Anomaly Review Process below provides a complete description of the <strong>GP</strong>-B anomaly reviewprocess that was used to work through all observations and anomalies. Appendix D, Summary Table of <strong>Flight</strong>Anomalies, shows the complete list and status of all 193 observations and anomalies that were workedthroughout the mission.Section 5.4 Risk Analysis below provides an overview of <strong>GP</strong>-B’s risk management strategy, including a summaryof current risk items and their planned mitigations.5.3 Anomaly Review Process<strong>Gravity</strong> <strong>Probe</strong> B uses a formal anomaly review process to assess, manage, and resolve vehicle or ground systemanomalies when they occur. Processes and training of team members are in place to ensure that all identifiedissues are addressed in a uniform manner and the entire team (<strong>Stanford</strong>/Lockheed-Martin/NASA) are keptapprised of the status of all anomalies and associated mitigation efforts.5.3.1 Anomaly DefinitionsAn anomaly is any unanticipated or undesired event, condition or configuration of the spacecraft or groundequipment. Anomalies are generally indicated by:• Timeline execution via pre-programmed failure paths• Safemode activations• Real-time monitoring of subsystem behavior• Off-line data analysis (engineering or science trending)126 March 2007 Chapter 5 — Managing Anomalies and Risk
Anomalies are classified into 4 categories:1. Major Space Vehicle Anomalies—Major Space Vehicle Anomalies endanger the safety of the spacecraftand/or the payload. These anomalies generally have contingency plans that have been pre-approved forimmediate identification and response within the MOC at the direction of the <strong>Flight</strong> Director. Responseto these anomalies is time-critical.2. Medium Space Vehicle Anomalies—Medium Space Vehicle Anomalies do not endanger the safety ofthe space vehicle but may impact the execution of planned timeline. These are the most probable type ofanomaly because the vehicle safing mechanisms are designed to allow the vehicle to be autonomous for72 hours given any single failure. The response to these anomalies is not time-critical if addressed withinthe 72 hour window.3. Minor Space Vehicle Anomalies—A Minor Space Vehicle anomaly does not endanger the safety of thespace vehicle and does not stop the execution of the timeline. These anomalies also do not have any longtermimplications to on-orbit operations. This category covers extremely low risk problems with thevehicle that are typically completely corrected by taking the appropriate corrective action.4. Space Vehicle Observations—In addition to formal anomaly categories, the space vehicle may exhibitoff-nominal or unexpected behavior that does not appear initially to be an operational or functionalissue and does not violate any limits, but may warrant attention over time. Any team member whonotices such issues contacts the anomaly room with the report. These items are designated an“observation” and will be reported daily to the Mission Director and the program on a daily basis, andare resolved on a time-available basis. Observation items may be elevated to an anomaly category if it isjudged to be serious enough to warrant a high-priority investigation.5.3.2 Anomaly Review OrganizationThe anomaly review process is organized into three different entities: the Anomaly Resolution Coordinator, theAnomaly Review Board, and a number of Anomaly teams and Engineering Analysis teams. The roles of theseentities are outlined in Figure 5-1 below.<strong>Gravity</strong> <strong>Probe</strong> B — <strong>Post</strong> <strong>Flight</strong> Analysis • Final <strong>Report</strong> March 2007 127
Figure 5-1. Anomaly Review Team Organization5.3.2.1 Staff: Anomaly Resolution CoordinatorThe Anomaly Resolution Coordinator function is staffed by a small team of system engineers to accomplish thefollowing management and control functions:• Receive, log, and track anomalies as reported by the Mission Director or Anomaly Review Board Chair• Receive, log, and track real-time vehicle commanding requests; convene the Anomaly Review Board forscreening and approval.• Form and manage Anomaly Teams under direction of the Anomaly Review Board chair.• Coordinate anomaly resolution activities with Anomaly Review Board.• <strong>Report</strong> anomaly status to the program via a daily written summary report.This position is a 7-day staffed position in a dedicated “Anomaly Room” near the Mission Operations Center(MOC) to enable rapid assessment of anomalies by the program. This position is staffed 24 hours by 7days/week early in the mission, 16 hours by 7 days/week during the in-orbit checkout period (IOC), and 10hours by 5 days a week during the science data gathering activities. Staffing levels are increased during criticalvehicle operations or during the assessment and resolution phases of major or medium anomalies.5.3.2.2 Staff: Anomaly TeamsAn Anomaly Team is a group of technical experts assigned to investigate a particular anomaly. These teamsreport their status to the Anomaly Resolution Coordinator and to the Anomaly Review Board when requested.The teams operate on an on-call basis and the membership is ad-hoc based on the needs of a particularanomaly.128 March 2007 Chapter 5 — Managing Anomalies and Risk
5.3.2.3 Staff: Anomaly Review BoardThe Anomaly Review Board, or simply the ARB, oversees the program-wide anomaly assessment and root causeinvestigation. This board is composed of senior <strong>Stanford</strong> University, Lockheed-Martin, and NASA technicalmanagers who have broad knowledge of the operation of the spacecraft, the payload, and the overall sciencemission.Each day, an anomaly board member is designated as the anomaly room chairperson. The anomaly reviewboard convenes during anomaly investigations; during non-anomaly periods the board members are generallyengaged with other program activities. This board:• Determines the membership of the anomaly teams.• Assesses the technical approach of the anomaly teams.• Oversees the progress of the investigations.• Prioritizes program resources for the various investigations.• Makes final recommendation to the program for anomaly resolution.Members of the board are available on an on-call basis and will be available on a 24 hour, 7 day/week schedule.5.3.2.4 Staff: Engineering Analysis TeamsThe Engineering Analysis Teams are the program technical experts who monitor and assess the health andperformance of the spacecraft and payload, but are not part of the real-time operations. These groups includeteams from <strong>Stanford</strong>, Lockheed-Martin, and NASA MSFC.All of these teams monitor the operation of the spacecraft and payload in both real time and through off-linedata processing and analysis. In the event that an anomaly or issue is noted by any of these teams, the team leadcontacts the anomaly room or the Mission Director to report the issue.5.3.3 Anomaly AssessmentUpon receipt of a new anomaly report, the Anomaly Coordinator and the Anomaly Review Board evaluates theanomaly using a detailed checklist. In summary, the board will:1. Assess vehicle safety issues.2. Assess dewar lifetime implications.3. Assess short and long term mission implications.4. Estimate response time requirement.5. Schedule an initial screening with the subsystem REs and Anomaly Board members.6. Identify priority among other anomaly team activities7. Identify near and long-term timeline flow implications.8. Determine anomaly team membership9. Develop fault tree to find root cause.10. Formulate investigation schedule and identify key decision points.<strong>Gravity</strong> <strong>Probe</strong> B — <strong>Post</strong> <strong>Flight</strong> Analysis • Final <strong>Report</strong> March 2007 129
5.3.3.1 Anomaly Investigation and ResolutionOnce the vehicle is in a safe configuration the Anomaly Team lead, in consultation with the Anomaly ReviewBoard and the Anomaly Resolution Coordinator, develops, tests, and implements a plan to isolate and correctthe anomaly.After an Anomaly Team has performed its analysis, they meet with the Anomaly Review Board and recommendany resolution options to correct the problem or any further investigative steps they feel need to be made tocome to a resolution method.The Anomaly Resolution Coordinator and the Anomaly Review Board then decides upon a resolution methodand grants approval to implement the mitigation.• If the resolution consists of an already-existing contingency procedure that the Anomaly Board approvesfor use as is, the procedure will be executed in the appropriate manner, usually by an SPC load• If the contingency procedure does not exist, the Anomaly Team will develop the appropriate procedure,soliciting whatever additional help they need via the Anomaly Review Board. The procedure willundergo off-vehicle testing prior approval.5.3.3.2 Management <strong>Report</strong>ingIn the event of a major space vehicle anomaly the <strong>Flight</strong> Director immediately notifies the <strong>Stanford</strong> UniversityProgram Manager in parallel with the Mission Director. The Mission Director and Program evaluates theanomaly and reports their findings to the MSFC Program Manager or his designee. Other classes of anomaliesare reported to Program Management through the Mission Director as soon as practical aft the board’s initialassessment.5.3.3.3 Anomaly ClosureOnce the root cause of the anomaly has been identified, and rectifying or mitigating activities are complete, theAnomaly Team and Anomaly Review Board will submit the anomaly for closure to the Mission Director. Afterreview, the Mission Director will close the anomaly in the ARB database.5.3.4 Anomaly RoomAn anomaly room has been setup outside the MOC as a common meeting area for review and analysis ofanomalies. The room has been designed to collect vehicle data from a variety of sources, act as a library of thekey vehicle technical schematics and operations documentation, and permit multi-mode communication withboth on-site and remote members of the <strong>GP</strong>-B team.Mission Operations Data:• Non-commanding ops console set (POD) to shadow PODs in MOC for real-time data display.• RTWorks display showing vehicle health and safety data.• Access to post-processed vehicle database with a variety of tools.• Copies of Lockheed-Martin SDRLs, engineering memos.• Copies of <strong>Flight</strong> Ops Handbook.• Safe mode logic, activation, and recovery plans.130 March 2007 Chapter 5 — Managing Anomalies and Risk
Space Vehicle Operations Data:• Schematics, specs for vehicle components.• Software listings for flight software modules.• Telemetry and telemetry formats lists.Communication and data analysis resources:• Conference phones.• Voice loops to MOC, engineering analysis area.• Secure network connections to <strong>Stanford</strong>, MSFC/VRC, and LM systems (via VPN).• Secure web publishing of notes and anomaly data.• Fast color scanner, photocopier, FAX machine.• Web-based access to radio pagers/cell phones.Figure 5-2 shows a photo of the anomaly room. Most of the information resources noted above can be seen.Figure 5-2. <strong>GP</strong>-B Anomaly Room Layout<strong>Gravity</strong> <strong>Probe</strong> B — <strong>Post</strong> <strong>Flight</strong> Analysis • Final <strong>Report</strong> March 2007 131
5.3.5 Anomaly Identification and Response PlanThe following is an outline of the steps to be followed in response to an anomaly. Note, iteration will likely berequired within this plan as an anomaly investigation proceeds:1. Any real-time operations team member that suspects an anomaly informs the current shift <strong>Flight</strong>Director.2. The <strong>Flight</strong> Director, Mission Director, or Anomaly Review Board member collects information andrecognizes it as a an anomaly.• In the event of a major anomaly, the <strong>Flight</strong> Director uses pre-approved contingency procedures tosafe the vehicle where possible.• In the event of a medium anomaly, the <strong>Flight</strong> Director consults with the Mission Director andAnomaly Review Board on a course of action.• In the event of a time minor anomaly, the <strong>Flight</strong> Director uses pre-approved contingency proceduresor flight rules to recover from the anomaly.• In the event of an observation, the Anomaly Review Board informs the Mission Director and thesystem RE of the observation for evaluation.3. The <strong>Flight</strong> Director notifies continues to assess the real-time operations issues and timeline impact of theanomaly.4. The Anomaly Resolution Coordinator convenes the Anomaly Review Board, briefs the board on theanomaly, commissions an Anomaly Team, and coordinates with the board for resources, schedule, andmilestones for investigation.5. The Mission Director works with the Anomaly Review Board to assess short and long-term implicationsto the mission timeline.6. The Anomaly Coordinator tracks the actions of the Anomaly Team and maintains the status documents(databases) for the program.7. The Anomaly Review Board manages Anomaly Team’s activities and augments the makeup of the teamas needed to successfully understand the anomaly.8. Once the anomaly is understood, the Anomaly Coordinator and the Anomaly Review Board proposes aplan for resolution. Should this anomaly require software changes or procedure changes, the AnomalyResolution Coordinator will work with the Anomaly Team and the <strong>Flight</strong> Software Team to generate theappropriate change paperwork.9. The Anomaly Review Board reviews and endorses recommended mitigations from the Anomaly Teamsand coordinates their insertion into the timeline with the Mission Director. The interface between theBoard and Mission Planning is via the Timeline Change Request (TCR) process. If real-timecommanding is required, a Pass Plan Change Request (PPCR) is coordinated with the <strong>Flight</strong> Director.10. The Anomaly Coordinator briefs the <strong>Flight</strong> Director of the chosen course of action.11. The Anomaly Team monitors and assesses the effects of the mitigations via flight telemetry and reportsresults to the ARB.12. The ARB and Anomaly Team assesses downstream implications of anomaly and possible operationalchanges to mitigate any negative effects.13. The Anomaly Resolution Coordinator completes the post anomaly report.14. The Mission Director closes the anomaly when mitigations are complete.132 March 2007 Chapter 5 — Managing Anomalies and Risk
These steps are used to address all issues, from simple observations to major anomalies. This ensures that allissues are addressed in a uniform manner, that open vehicle issues are communicated to entire team on aregular basis, and that the issues are properly documented.5.3.6 Overall Effectiveness of <strong>GP</strong>-B Anomaly Resolution ProcessThe anomaly resolution process described above was developed and perfected during seven pre-launch missionsimulations and proficiency exercises. Lessons learned from each simulation were incorporated into theanomaly plan to create an effective and efficient process for the <strong>GP</strong>-B mission.Since launch, 193 anomalies/observations have been identified (through 13 October 2005): 5 major anomalies,12 medium anomalies, 5 minor anomalies, and 170 observations. This process was used to deal with all of theseissues, and we have found that this anomaly resolution process is:Effective:Efficient:Transparent:Robust:Anomalies are understood and corrected with little long term mission impact. Thetechnical teams were able to use the tools and structure provided to identify the rootcauses of the issues and mitigate them as appropriate.Heavy staffing, extensive training, and good communications technology bringsteams together rapidly and allows for efficient communications. The concentratedinformation resources in the anomaly room allowed the vehicle state to bedetermined rapidly and hypotheses to be checked quickly during the assessmentphase of investigations.All anomaly data made available “instantly” to the entire <strong>GP</strong>-B team via a secure webserver. This allowed team members around the world to follow progress andcontribute their expertiseGood training of members allows team members to work a variety of ARB roles whennecessary. The process does not rely on a few “key” members; it allows a significantgroup of people to fill the individual roles effectively.In summary, the process has been very effective and may serve as a model for other spaceflight programs. Adetailed summary of all mission anomalies and observations is found in Appendix D, Summary Table of <strong>Flight</strong>Anomalies.5.4 Risk AnalysisThe <strong>GP</strong>-B Risk Management Plan (S-O423) documents the approach that was successfully implemented on<strong>GP</strong>-B.5.4.1 Forward to <strong>GP</strong>-B Risk Management PlanRisk management process involves open communication among our organizations, with the customer, oursuppliers and other external interfaces. It is imperative that management create an atmosphere which welcomesrisk identification without fear of personal consequence.5.4.2 PurposeThe establishment of a risk management process provides a disciplined approach to the identification, analysis,and resolution of risk factors which may adversely affect ultimate program success. The goal of the riskmanagement effort is to provide the proper balance between risk and the elements of cost, schedule, andtechnical performance thus assuring program success.<strong>Gravity</strong> <strong>Probe</strong> B — <strong>Post</strong> <strong>Flight</strong> Analysis • Final <strong>Report</strong> March 2007 133
5.4.3 Risk Management ApproachThe risk management process (Figure 5-3) is a continual process that assesses both the evolving state of theprogram (technical, cost, schedule) and the progress against active risk mitigation activities. The riskmanagement process begins by identifying potential program risks.Figure 5-3. For each risk, an assessment is completed by the identifying team or personRisk mitigation plans are developed and executed for risks comprised of one or more of the following strategies(1) avoidance: requirements relaxation and/or elimination; (2) control: testing, training, procedures, marginallocation, second source, parallel design; (3) acceptance: monitor only; and (4) transfer: move the risk toanother area. Mitigation plans are implemented by the affected team, who establish monitoring methods whichensure that new problems are identified and resolved.Program risk is monitored by the Risk Steering Group chaired by the <strong>Stanford</strong> program manager and includesparticipation from Lockheed Martin program manager, MSFC resident manager, and other senior managers onthe <strong>GP</strong>-B program.5.4.4 Risk Metric and ItemsFormal <strong>GP</strong>-B risk management was started in October 2000. A metric showing the rate at which risk items wereidentified and closed is shown in Figure 5-4. All risk items were either closed or accepted prior to launch.134 March 2007 Chapter 5 — Managing Anomalies and Risk
Figure 5-4. Metric of risk item closure prior to launch of <strong>GP</strong>-B. All risk items were either acceptedor closed prior to launch.During the on-orbit phase of the mission, we continued the risk management approach on <strong>GP</strong>-B. Table 5-1provides a summary of the open risk items at the end of the IOC phase. Figure 5-5, Figure 5-6, and Figure 5-7provide the open risk items at the end of the science mission phase.Risk management was successfully implemented on <strong>GP</strong>-B and provided a disciplined process to identifying andmanaging program risk.Table 5-1. Summary of Open <strong>GP</strong>-B risks at the end of IOCRisk # Subject Owner Mitigation5 B side switch impact to attitudeand recovery to star. SV rollsdown to 0.1 rpm on b-sideswitch.22 Maintain ATC attitude control forscience25 Loss of suspension due tountested post spin upoperations29 Roll Frequency Accelerations atRotor. SI at roll. Variation is sumof the squares of voltages onone electrode axis.BarryKirschenbaumFD,MD,ARBKeiserDraft B-side safemode recovery procedurecompleted. Walk-through scheduled for 9/14/04.Close risk when procedure and training arecompleted. On-call team available for recovery.Reassess the limits for DBE test activation. Plan B-sidetable top rehearsal and additional FD & MD trainingfor initial actions to stop roll down.Recent improvements made in pointingperformance. Roll phase variation improvementexpected by star tracker alignment implemented on9/10/04. Monitor ATC attitude performance. RTWorksupgrade in work for loss of star identification. Watch.Continuous mitigation - Increased vigilance onPPCR's and changes. Maintain constant MOCdiscipline. Minimize GSS commanding.Open – Watch – continue to monitor. Preliminarylook by Alex advises we are OK.<strong>Gravity</strong> <strong>Probe</strong> B — <strong>Post</strong> <strong>Flight</strong> Analysis • Final <strong>Report</strong> March 2007 135
Table 5-1. Summary of Open <strong>GP</strong>-B risks at the end of IOC33 Drag-free control. Bencze Open – Mitigation in work (obs 98 & 110). Mitigationis more on-orbit assessment and parameter tuning.On-going investigation into cause. Develop methodsto improve.35 Double bit errors Perry The following actions will be taken to mitigate andimprove response to MBE's:Colin Perry will lead the closure of the following andwill brief ARB and MD when complete:1. Obtain a complete memory dump of the freshlyrebootedMSS in the ITF, make that available at SU forrapid compairson.2. Expand upon MJ's email of 8 Sept to definesections of MSS memory to functionality, attempt toattach criticality to those sections.3. RTWorks limit checking of double bit diag monitorBC_TlmDiag06. MJ, could we use “set io_directive” towrite x#000000 to that location after clearing thiserror.4. Training of FD, MD personnel in the detection andrepair of this type problem. (Maggie to provide areasof MBE of concern). MD to be immediately notified ofMBE's. (Steve Larsen to look at MBE impact on GSS).Figure 5-5. (part 1 or 3). Open risk items during on-orbit science mission136 March 2007 Chapter 5 — Managing Anomalies and Risk
Figure 5-6. (part 2 or 3). Open risk items during on-orbit science missionFigure 5-7. (part 3 or 3). Open risk items during on-orbit science mission<strong>Gravity</strong> <strong>Probe</strong> B — <strong>Post</strong> <strong>Flight</strong> Analysis • Final <strong>Report</strong> March 2007 137
138 March 2007 Chapter 5 — Managing Anomalies and Risk
6The <strong>GP</strong>-B Management Experiment<strong>Gravity</strong> <strong>Probe</strong> B — <strong>Post</strong> <strong>Flight</strong> Analysis • Final <strong>Report</strong> March 2007 139
140 March 2007 Chapter 6 — The <strong>GP</strong>-B Management Experiment
The <strong>GP</strong>-B spacecraft was a total system, comprising both the space vehicle and its unique payload—anintegrated system dedicated as a single entity to making the measurements of unprecedented precision (eightorders of magnitude more accurate than the best navigational gyroscopes) required by the experiment. Toaccomplish this goal, it was necessary for the total, tightly-integrated system to be developed by a strong andcohesive team. This chapter provides an overview of some of the important issues, challenges, trade-offs andpractices that were involved in managing <strong>GP</strong>-B over a period of more than four decades to a successfulperformance of its mission.6.1 The Phases of <strong>GP</strong>-B Program ManagementNASA generally divides programs into six phases:• Phase A-Preliminary Analysis• Phase B-Definition• Phase C-Design• Phase D-Fabrication, Assembly and Testing• Phase E-Mission Operations• Phase F-Data Analysis & Results DeterminationTo some degree, all NASA programs progress through these phases. However, often-and especially in the caseof <strong>GP</strong>-B, NASA's oldest continuous research program, whose origins date back NASA's infancy—there is muchoverlap between phases, and it is difficult to assign these phase labels to distinct chronological periods. Instead,it is more useful to describe <strong>GP</strong>-B's development and program management in terms of the following five maintime periods:1. The Early Years (1959-1984). During this period, the relativity gyroscope experiment was conceived at<strong>Stanford</strong> and became a NASA-funded, university research program. The relativity gyroscope experimentevolved into a NASA mission, and was given the name “<strong>Gravity</strong> <strong>Probe</strong> B.”2. <strong>Flight</strong> Hardware Development (1984-1997). For reasons described in this section, NASA made<strong>Stanford</strong> its prime contractor in 1984, with NASA Marshall Space <strong>Flight</strong> Center provided the program’snominal oversight. This decision was dubbed “the <strong>GP</strong>-B Management Experiment” by James Beggs, theNASA Administrator at that time. Following a rigorous selection process, <strong>Stanford</strong> contracted withLockheed Missiles and Space Corporation (LMSC, now Lockheed Martin Space Systems Company orLMSSC 1 ) as principal subcontractor for constructing the integrated payload (dewar and probe). In alater, separate selection process, <strong>Stanford</strong> also selected LMMS for constructing the spacecraft. Towardsthe end of this period, <strong>GP</strong>-B made the challenging transition from maximizing research and technologydevelopment advances to minimizing risk as the payload and spacecraft were readied for launch.1.The aerospace division of Lockheed Martin Corporation has undergone a number of name changes over thelife of <strong>GP</strong>-B. In 1984, when <strong>Stanford</strong> first contracted with the company to build the <strong>GP</strong>-B dewar and probe,it was then called Lockheed Missiles and Space Company (LMSC). In 1995, the parent Lockheed Corporationmerged with the Martin Marietta Corporation to become the Lockheed Martin Corporation, and the aerospacedivision became Lockheed Martin Missiles and Space (LMMS). A few years later, the Lockheedaerospace division underwent yet another name change to the current Lockheed Martin Space Systems Company(LMSSC). Throughout the development of the dewar, probe and other payload systems, <strong>GP</strong>-B subcontractedwith the Lockheed Palo Alto Research Lab (LPARL), located next to <strong>Stanford</strong>. The spacecraftfabrication and assembly was carried out at the company’s nearby Sunnyvale, CA facility. For the sake ofsimplicity, we have chosen to use “Lockheed Martin,” or the acronym “LM” for all further references toLockheed Martin Space Systems Company in this chapter.<strong>Gravity</strong> <strong>Probe</strong> B — <strong>Post</strong> <strong>Flight</strong> Analysis • Final <strong>Report</strong> March 2007 141
3. Payload Integration, Testing and Repairs (1997-2002). During this five year period, a few criticalproblems surfaced during the integration and testing of the payload, including the dewar, probe, andScience Instrument Assembly. These problems were addressed, the payload was integrated into thespacecraft, along with several electronics systems, and the Gas Management Assembly. The presence ofthese problems caused NASA to significantly increase its management oversight of the program. This ledto communications issues between <strong>Stanford</strong>, NASA, and Lockheed Martin that were successfullyaddressed towards the end of this time period.4. Final Integrated Testing, Launch & Science Mission (2002-2005). During the pre-flight integratedtesting of the <strong>GP</strong>-B spacecraft, two final problems emerged which postponed the launch from 2002 to2003, and then to 2004. <strong>GP</strong>-B finally launched on April 20, 2004, followed by a successful 17.3-monthflight mission, which concluded on September 29, 2005.5. Data Analysis Period (2005-2007). Following the successful <strong>GP</strong>-B flight mission, focus shifted fromspacecraft operations to science data analysis and results determination. As planned, this shift resulted ina considerable reduction in staff, of which the spacecraft operations team was a large component, as wellas a final change in program management.These five time periods provide the main organizational structure for discussing <strong>GP</strong>-B program management inthis chapter.6.2 The Early Years (1959-1984)The early history of <strong>GP</strong>-B is covered in Chapter 2, Section 2.1.1 “A Brief History of <strong>GP</strong>-B” . To preserve context,parts of the current chapter are somewhat redundant to the history in Chapter 2; however this section focusesprimarily on the program management aspects of <strong>GP</strong>-B.6.2.1 Concept DevelopmentThe idea of testing general relativity by means of orbiting gyroscopes was suggested independently by twophysicists, George Pugh and Leonard Schiff, in late 1959-early 1960. Pugh's Proposal for a Satellite Test of the CoriolisPrediction of General Relativity appeared in an unusual location: the U.S. Department of Defense Weapons SystemsEvaluation Group (WSEG) Memo #11 (November, 12, 1959). Schiff 's Possible New Experimental Test of GeneralRelativity Theory was published in the March 1, 1960 issue of Physical Review letters. What was then called the<strong>Stanford</strong> Relativity Gyroscope Experiment (later dubbed <strong>Gravity</strong> <strong>Probe</strong> B) began in late 1959-1960 as a researchcollaboration among Schiff, a theoretical physicist and then Chairman of the Physics Department, and twoother professors at <strong>Stanford</strong> University—William Fairbank, a low-temperature physicist, and Robert Canon, agyroscope and guidance control expert, and later Chairman of the Aeronautics & Astronautics Department. InJune 1960, Schiff published an expanded paper, more completely defining the experiment, while Fairbank andCannon focused on the cutting-edge technological innovations that would be necessary to actually carry it out.What became apparent early on, and proved critical to the eventual success of the experiment, was the necessityfor collaboration—both inter-departmental collaboration within <strong>Stanford</strong> and also collaboration between<strong>Stanford</strong>, NASA, and eventually, Lockheed Martin. <strong>GP</strong>-B was a fundamental physics experiment that had to beperformed in a spacecraft. As such, it required cutting-edge knowledge and expertise from both physicists andengineers—especially aerospace engineers.6.2.2 Initial ResearchRealizing the need for such aerospace collaboration, Schiff and Fairbank approached NASA in 1961 with ashort, non-funding proposal outlining an experiment to be performed in an orbiting spacecraft. At that time,Dr. Nancy Roman was Chief of Astronomy and Relativity Programs in the NASA Office of Space Science at142 March 2007 Chapter 6 — The <strong>GP</strong>-B Management Experiment
NASA Headquarters. Roman was quite influential in creating astronomical research satellites such as theOrbiting Space Observatory (OSO), the Cosmic Background Explorer (COBE) and the Hubble Space Telescope(HST). In July 1961, under Roman’s direction, NASA sponsored a conference at <strong>Stanford</strong> on the topic ofexperimental tests of general relativity. This conference, which was attended by many of the leading relativisticphysicists and aerospace engineers of the day, helped crystallize various issues that needed to be addressed inorder to carry out the relativity gyroscope experiment.One important result of that conference was the idea of developing a “drag-free” satellite—a satellite that couldorbit the Earth exactly as if acted upon by gravity alone—not by solar pressure or atmospheric drag. This featurewas critical to the relativity gyroscope experiment because the effects of orbital drag on the gyroscopes wouldobscure the minuscule relativistic effects being measured. At the conference, Benjamin Lange, a <strong>Stanford</strong> Aero-Astro graduate student (and later a professor in the <strong>Stanford</strong> Aero-Astro Department) had an “aha moment,” inwhich he figured out how to create a “drag-free” satellite. This became the topic of his doctoral dissertation andseveral other dissertations to follow in the <strong>Stanford</strong> Aero-Astro department, under the supervision of ProfessorRobert Cannon.Meanwhile, William Fairbank and his graduate students had begun investigating various cryogenic topicsrelated to gyroscope composition, as well as gyro suspension, readout, and spin-up systems. In 1962, Fairbankinvited Francis Everitt to come to <strong>Stanford</strong> as the experiment's first full-time academic staff member. Workingwith Fairbank, Everitt proposed using the London Moment property of spinning superconductors as the basisof a gyroscope readout system, and he helped redefine several other aspects of the experiment, such as theelectrostatic gyro suspension system.During the years 1963-1967, <strong>GP</strong>-B grew slowly as a university research program, with William Fairbank andRobert Cannon each managing research teams in their respective departments. Late in 1963, <strong>Stanford</strong> submitteda proposal to NASA entitled: Proposal To Develop a Zero-G Drag Free Satellite and Perform a Gyro Test of General Relativity ina Satellite. In March 1964, NASA's Office of Space Science funded this proposal in the amount of $180,000, withRoman serving as NASA Program Manager. The proposal named William Fairbank and Robert Cannon as Co-Principal Investigators, with Leonard Schiff as Project Advisor. Once funded, the research program began toexpand rapidly. Pictured in Figure 6-1below are <strong>GP</strong>-B co-founders Leonard Schiff, William Fairbank, RobertCannon, and Nancy Roman, former Chief of Astronomy and Relativity Programs in the NASA Office of SpaceSciences.<strong>Gravity</strong> <strong>Probe</strong> B — <strong>Post</strong> <strong>Flight</strong> Analysis • Final <strong>Report</strong> March 2007 143
Figure 6-1. Clockwise from top left: <strong>GP</strong>-B Co Founders Leonard Schiff, William Fairbank, and Robert Cannonand former head of NASA's Office of Space Sciences, Nancy Roman.Furthermore, the U.S. Air Force was interested in the drag-free and guidance control portion of this researchand provided supplementary funding for this work. To further this effort, Robert Cannon invited Daniel DeBra,a recent <strong>Stanford</strong> Aero-Astro Ph.D., who was then heading up the Guidance and Control team for the LockheedDiscoverer spacecraft, to return to <strong>Stanford</strong> as a professor in the Aero-Astro Department. With DeBra, Lange,and two other researchers on his team and funding from NASA and the Air Force, Cannon helped lay thegroundwork for the development of the first successful drag-free satellite, as noted below.During this same period, Francis Everitt had become involved in all research aspects of the relativity gyroscopeexperiment, and his work, along with that of Fairbank and other physics faculty, graduate students, and staff,began to demonstrate that the relativity gyroscope experiment, as then defined, would be capable of reachingthe one-milliarcsecond accuracy desired.6.2.3 Technology Design and PrototypingFor the next decade from 1967-1978, the size of the research teams grew gradually, as the focus shifted fromconceptual design to the prototyping and development of various technologies required for the experiment. Inthe Physics department, this prototyping encompassed all of the technologies required to carry out theexperiment—the gyroscopes, the gyro readout and suspension systems, a pointing telescope and artificial starsimulator, ultra-low magnetic field technology, a helium dewar and porous plug and proportional thrusters forcontrolling the escaping helium, and other related technologies.144 March 2007 Chapter 6 — The <strong>GP</strong>-B Management Experiment
In parallel, a major focus of the Aero-Astro Department remained fixed on the development of a drag-freesatellite. In December, 1969, the <strong>Stanford</strong> Aero-Astro Department submitted a proposal to Johns HopkinsApplied Physics Laboratory (APL) for a subcontract to Develop and Build a [drag-free] Disturbance CompensationSystem (DISCOS) for the [U.S. Navy] TRIAD II and III Satellites. This important early space experiment was developed andmanaged jointly by Daniel DeBra of <strong>Stanford</strong> and Robert Fischell of the Johns Hopkins APL, who was grantedNavy funding for the project because it could (and did) make possible extreme accuracy at low cost forsubmarine navigation system updates which the transit satellite system provided. The TRIAD II transitnavigation satellite, with DeBra's drag-free DISCOS unit as its centerpiece, was successfully launched in 1972—the only 3-axis drag-free satellite to be operated successfully until the launch of <strong>GP</strong>-B in 2004. It achievedcontrol to 5x10 -12 g throughout a one-year orbital test flight.With the success of DISCOS, <strong>Stanford</strong> was able to procure funding for drag-free technology research fromsources other than NASA, and <strong>GP</strong>-B's NASA funding was thus refocused solely on development andprototyping of the technology and control systems needed to perform the relativity gyroscope experiment.In 1968, Robert Cannon left <strong>Stanford</strong> to become Chief Scientist for the U.S. Air Force. In the wake of hisdeparture, Fairbank promoted Daniel DeBra to the status of Co-Principal Investigator for the Aero-Astroportion of the <strong>GP</strong>-B program, and he promoted Francis Everitt to the status of Coordinating Co-PI for thewhole program. Leonard Schiff continued his role as Program Advisor, in frequent communication withFairbank, Everitt, and DeBra until his death in 1971.During these years, <strong>Stanford</strong> began collaborating on the development of several technologies with NASA'sMarshall Space <strong>Flight</strong> Center (MSFC), and MSFC provided oversight assistance on <strong>Stanford</strong> subcontracts toaerospace companies for the development and testing of prototype gyroscopes, telescope hardware, the dewar,and other key technology elements.NASA Headquarters formally transferred oversight responsibility for the relativity gyroscope program to MSFCin 1971. Coincident with this transfer, C. Dixon Ashworth, then the NASA HQ manager overseeing therelativity gyroscope experiment, renamed it “<strong>Gravity</strong> <strong>Probe</strong> B,” noting that it was to be the second NASAgravitational physics experiment. The first one, which he named “<strong>Gravity</strong> <strong>Probe</strong> A,” was a Hydrogen-maserclock comparison experiment, headed by Dr. Robert Vessot of the Smithsonian Astrophysical Observatory andalso overseen by MSFC. (The <strong>Gravity</strong> <strong>Probe</strong> A experiment was successfully performed with a sub-orbital Scoutlaunch in 1976.)In December 1971, MSFC funded an in-depth “Mission Definition Study” of <strong>GP</strong>-B, performed by Ball BrothersResearch Corporation (BBRC, Now Ball Aerospace), in close collaboration with <strong>Stanford</strong>—the starting point forall future flight studies. This study provided an initial spacecraft design and program plan. Two follow-upstudies by BBRC were performed in 1973 and 1975, respectively. The results of these studies indicated that <strong>GP</strong>-B was ready to make the transition from exploratory research and technology development to a NASA flightprogram.6.2.4 Transition to a NASA <strong>Flight</strong> ProgramIn January 1977, the original NASA research grant to <strong>Stanford</strong> was closed out—the longest running continuousresearch grant ever awarded by NASA—symbolically marking the end of the exploratory phase of the program,during which much of the key technology needed was developed. In its place, NASA's Office of Space Sciencesawarded a new contract for the purpose of defining a flight program. A year later, funding support at NASAHeadquarters for the program switched from the Office of Space Science under Nancy Roman to the AdvancedProgram Development Office under Jeffrey Rosendhal.<strong>Gravity</strong> <strong>Probe</strong> B — <strong>Post</strong> <strong>Flight</strong> Analysis • Final <strong>Report</strong> March 2007 145
MSFC conducted an in-house Phase A study of <strong>GP</strong>-B in preparation for defining a flight program in 1980. Laterthat year, under the chairmanship of Jeffrey Rosendhal at NASA Headquarters, NASA convened a specialcommittee to assess the technological readiness of <strong>GP</strong>-B for becoming a NASA flight mission. The RosendhalCommittee concluded that:…the remarkable technical accomplishments of the dedicated <strong>Stanford</strong> experiment team giveus confidence that, when they are combined with a strong engineering team in a flightdevelopment program, this difficult experiment can be done.By 1981, Francis Everitt had become the single person most knowledgeable about all aspects of the <strong>GP</strong>-Bexperiment. For this reason, he was promoted to the job of Principal Investigator, challenged with bringing theexperiment to fruition—a job that would ultimately take another 25 years to accomplish. Encouraged by theresults of the 1980 Phase A study, MSFC, with support from <strong>Stanford</strong>, undertook a much more in-depth PhaseB study in 1982. The Phase B study yielded a spacecraft that was too large and a program that was too expensive,with an unacceptable level of risk. Thus, in 1983, Everitt and the <strong>Stanford</strong> team, in collaboration with MSFC,undertook an extensive restructuring of the program, with a goal of reducing the weight and powerrequirements of the spacecraft, reducing overall costs, and reducing program risks to an acceptable level—allwithout sacrificing any essential science goals.The result of this restructuring effort was a two-phase Space Shuttle mission. The first phase was to be atechnology readiness demonstration called STORE (Shuttle Test of the Relativity Experiment). In this phase, thedewar and science instrument would be tested during a shuttle flight to be launched in 1989. At the end of thetest, this equipment would be brought back to Earth by the shuttle, refurbished, and then integrated into asatellite for performing the actual experiment. Two years later, the <strong>GP</strong>-B satellite would be placed in orbit by apolar-orbiting Shuttle, which could be launched only from NASA's West Coast Shuttle Facility at VandenbergAFB, in Southern California.6.2.5 <strong>GP</strong>-B Formalizes Program ManagementShortly after becoming Principal Investigator in 1981, Everitt realized that he was going to need a person withstrong aerospace engineering background to help him manage the unique technology development challengesfacing <strong>GP</strong>-B. In 1982, he began trying to recruit Bradford Parkinson (1966 <strong>Stanford</strong> Aero-Astro Ph.D whosedissertation research on spherical gyroscopes was carried out in the early <strong>GP</strong>-B labs) to return to <strong>Stanford</strong> fromprivate industry to serve as both a Co-PI and the first formal Program Manager of <strong>GP</strong>-B. Parkinson is creditedwith creating the U.S. Air Force Global Positioning System (<strong>GP</strong>S) and had previously been Program Managerfor its successful deployment. This experience, coupled with his aerospace background, ideally suited him forthis new position. Parkinson agreed to serve as a consultant to <strong>GP</strong>-B until NASA funding for the <strong>GP</strong>-B flightprogram was imminent, and then to come on board as Program Manager and Co-PI of <strong>GP</strong>-B. In the interimperiod, Everitt recruited Robert Farnsworth to move to <strong>Stanford</strong> from the University of California, San Diego,where he had been managing other aerospace engineering projects and to serve as Deputy/Acting ProgramManager until Parkinson arrived.By 1984, with the newly restructured two-phase Shuttle-based plan completed, the stage was set for NASA tofund the <strong>GP</strong>-B flight program and for Parkinson to assume the role of <strong>GP</strong>-B Program Manager and Co-PI.Concurrently, Cannon, then chairman of <strong>Stanford</strong>'s Department of Aeronautics and Astronautics, offeredParkinson a full professorship in that department—an equally strong incentive for Parkinson to return to<strong>Stanford</strong>. For about a year, Farnsworth served as Deputy Program Manager under Parkinson. He then accepteda new position as Associate Director of <strong>Stanford</strong>'s Hansen Experimental Physics Lab (HEPL), under whoseauspices the <strong>GP</strong>-B program was administered at <strong>Stanford</strong>. Farnsworth remained Associate Director of HEPLuntil his retirement some years later.146 March 2007 Chapter 6 — The <strong>GP</strong>-B Management Experiment
Parkinson's arrival at <strong>GP</strong>-B ushered in a 16-year period of flight hardware development that will be described inmore detail in the next few sections. The Calder-Jones independent report to NASA, pages 31-32, makes thefollowing comments about Parkinson's tenure as Program Manager:Professor Parkinson's tenure turned out to be one of the most influential and productivetimes of <strong>GP</strong>-B. Significant strides were made and a very high precedence was set despite thefact that some tremendous obstacles needed to be overcome. Again, technologically <strong>GP</strong>-B isan extremely difficult program; however, the [challenges] associated with ProfessorParkinson's tenure [extended far] beyond technical hurdles. It was under his purview thatLockheed Martin (LM) was selected as the subcontractor to help build and integrate thepayload and later selected again to build the spacecraft. Therefore, all original contractnegotiations between the university prime and their private-industry subcontractor wereperformed under his guidance.(See Section 6.8 <strong>Gravity</strong> <strong>Probe</strong> B: A Management Study for more information about the Calder-Jones <strong>Report</strong> toNASA.)To round out the new <strong>GP</strong>-B senior management team, Daniel DeBra continued as a Co-PI from the Aero-AstroDepartment, as did William Fairbank in the Physics Department, until his death in 1989. Furthermore, physicsProfessor John Turneaure was promoted to Hardware Manager (and two years later, he also became a Co-PI).In addition, after Farnsworth's move to HEPL, Tom Langenstein was hired as <strong>GP</strong>-B's new Deputy ProgramManager, with responsibility for the NASA contract, the Lockheed Martin subcontract, and resources. A full<strong>GP</strong>-B senior management team was now in place. Pictured in Figure 6-2 below are Principal Investigator,Francis Everitt and his three Co-PIs, Bradford Parkinson, John Turneaure, and Daniel DeBra.Figure 6-2. Clockwise from top left: <strong>GP</strong>-B Principal Investigator, Francis Everitt and Co-PIsBradford Parkinson, John Turneaure and Dan DeBra.<strong>Gravity</strong> <strong>Probe</strong> B — <strong>Post</strong> <strong>Flight</strong> Analysis • Final <strong>Report</strong> March 2007 147
It is important to note that from this point through 1998, <strong>GP</strong>-B was actually managed by a three-person team,comprised of Program Manager Parkinson, Hardware Manager Turneaure, and Principal Investigator Everitt.Each of these men had knowledge and skills complementary to the other two, so that together, the three formeda synergistic, and very effective management team. In terms of division of responsibility, it was often the casethat Everitt and Parkinson dealt with top-level program issues, while Turneaure managed the day-to-dayhardware development.Furthermore, during the 15-year period from 1985 through 2000, six <strong>Stanford</strong> experimental physicists, eachwith a different area of specialization, were promoted to the position of Co-Investigator, forming a strongsecond tier of management to aid in various aspects of hardware development and experimental design andtesting. Pictured in Figure 6-3 below are the six <strong>GP</strong>-B Co-Investigators: Sasha Buchman, George (Mac) Keiser,John Lipa, James Lockhart, Barry Muhlfelder, and Michael Taber.Figure 6-3. The six <strong>GP</strong>-B Co-Investigators. Clockwise from top left: Sasha Buchman, George (Mac) Keiser,John Lipa, James Lockhart, Barry Muhlfelder, and Michael Taber.The next few subsections provide a more detailed discussion of <strong>GP</strong>-B accomplishments, challenges, and issuesthat occurred during Professor Parkinson's term as Program Manager, which lasted until August 1998.6.2.6 NASA Makes <strong>Stanford</strong> Prime Contractor on <strong>GP</strong>-BIn the process of reviewing and preparing to fund the revised <strong>GP</strong>-B flight plan, Samuel Keller, then DeputyDirector of the NASA Office of Space Science Applications, decided to make <strong>Stanford</strong> NASA's PrimeContractor on the <strong>GP</strong>-B mission. This was one of the first NASA missions, and at that time, the largest, in whicha university was given the prime role of managing the development of an entire space flight mission—scienceinstrument, spacecraft, mission operations and data analysis.148 March 2007 Chapter 6 — The <strong>GP</strong>-B Management Experiment
Among the reasons for NASA’s decision to make <strong>Stanford</strong> the prime contractor on <strong>GP</strong>-B were the following:1. The payload and spacecraft were intimately interdependent. That is, the payload sensor was the keycontrol element to the space vehicle system. One of the four science gyros was also used as the drag-freesensor, and the helium gas escaping from the dewar was used by proportional micro-thrusters tomaintain drag-free and attitude control. The total-system mass center location was also critical.2. The development process and specification derivation were integrated. Because the payload drove mostof the spacecraft requirements, the specifications were linked. They were developed together and verifiedin an integrated fashion.3. Many of the technologies associated with the science Instrument Assembly—namely, the gyroscopes andtheir suspension systems, the SQUIDs, and the pointing telescope—were entirely new and uniquetechnologies that could only have been developed in a very advanced academic research environment.4. The Science Instrument Assembly had to be integrated into the probe, the probe was then integrated intothe dewar, and finally, the dewar-probe unit was integrated into the spacecraft, so that all of thesecomponents functioned together as a unified system. This total integration of payload and spacecraft wascrucial to the success of the mission.5. The scientists and engineers at <strong>Stanford</strong> understood points 1-4 above, and they were the logical peopleable to oversee the technical trade-offs associated with designing and constructing this unique spacecraft.In November 1984, following a by-the-book competitive bidding process, <strong>Stanford</strong> selected Lockheed Martin tobuild the flight dewar and probe that would house the Science Instrument Assembly, the heart of theexperiment being developed and constructed at <strong>Stanford</strong>. <strong>GP</strong>-B then sent MSFC/NASA Headquarters aproposal, with <strong>Stanford</strong> as the prime contractor and LM as <strong>Stanford</strong>'s subcontractor, for implementing therestructured flight plan and building the required flight hardware. In 1985, MSFC/NASA Headquartersaccepted the <strong>Stanford</strong>-Lockheed Martin STORE proposal and funded this technology development plan. Thefact that the technology plan included LM as <strong>Stanford</strong>'s industry subcontractor represented a significantincrease in management responsibility for <strong>Stanford</strong>. However, under Parkinson's experience and leadership,<strong>Stanford</strong> was prepared for this challenge, and “The Management Experiment” commenced.6.3 <strong>Flight</strong> Hardware Development (1984-1997)James Beggs, the NASA Administrator in 1985, concurred with Samuel Keller's decision to make <strong>Stanford</strong> thePrime Contractor on <strong>GP</strong>-B, and he remarked that in addition to being a physics experiment that needed to becarried out in space, <strong>GP</strong>-B was equally interesting as a “management experiment.”As stated in the Calder-Jones <strong>Report</strong> to NASA, page 7:The Management Experiment was an agreement between NASA Headquarters, NASAMSFC, and <strong>Stanford</strong> University that established <strong>Stanford</strong> as the prime contractor, managingthe entire program with minimal NASA oversight. The decision followed a recommendationfrom the Space Studies Board (SSB) to NASA Headquarters in mid-1983, after the SSB hadreviewed the MSFC Phase B Study. The view of the SSB, endorsed by NASA Headquarters,was that in a mission such as <strong>GP</strong>-B where the instrument and spacecraft are much moreclosely integrated than in typical space programs, separating the two would be gravelydetrimental. It was predicated on <strong>Stanford</strong> University's agreeing to set up a much strongermanagement structure than is typical in universities.The flight hardware development period continued for about 15 years, at which time it became necessary totransition <strong>GP</strong>-B from a research and development program with minimal NASA oversight to a classical NASAflight program that would culminate in a successful launch, on-orbit operations, and subsequent data analysis,leading to the determination of the experimental results.<strong>Gravity</strong> <strong>Probe</strong> B — <strong>Post</strong> <strong>Flight</strong> Analysis • Final <strong>Report</strong> March 2007 149
6.3.1 Incremental PrototypingThe period from 1985-1995 yielded significant advances in <strong>GP</strong>-B hardware development, due in large part toBradford Parkinson's decision to use a methodology called “incremental prototyping.” Incremental prototypinginvolved the rapid development and testing of increasingly more prototypical hardware. Developing <strong>GP</strong>-B'sunique and cutting-edge technology required an approach that would maximize the capability of the hardwareand software, while minimizing costs and development time. In the classical, aerospace hardware developmentapproach, a number of years would first be spent defining a requirements specification, and then an aerospacecontractor, such as Ball Aerospace, Lockheed Missiles and Space, Fairchild Aerospace, or General ElectricAerospace would spend more years designing and building hardware to meet the specifications. This would be atime-consuming and expensive process. Furthermore, this process would not necessarily yield the desiredresults, and more iterations would often be required.During the flight hardware development years, <strong>GP</strong>-B required technology development consistent with asuitable flight readiness level. Thus, rather than adhering to the classical development model, one of ProfessorParkinson's major contributions was to use incremental prototyping for developing the novel and complextechnology required by the experiment. Hardware was rapidly prototyped and tested in order to determine howclose it would come to meeting specified requirements and also to determine how difficult it would be tomanufacture and test. Incremental prototyping allowed the team to develop new technologies by building actualhardware, while learning valuable lessons in the process. When the time was right, the team knew what theycould build and how to build and test it. Eventually these “lessons learned” were applied to the development ofactual flight hardware, allowing the team to build flight hardware more efficiently, in less time, and moreaccurately than would have been possible using the classical “build-to-requirements” approach.Incremental prototyping was used to develop the technologies described in each of the five subsections below.6.3.1.1 <strong>Probe</strong>s A, B, and CFigure 6-4. <strong>Probe</strong> C: testing in clean room (left), ready for integration with dewar (center) and connectionsinside the top hat interface (right).The cryogenic Vacuum <strong>Probe</strong>, when inserted into the dewar, includes the science experiment. The <strong>Probe</strong> mustmaintain an internal temperature of 2.0K, while interfacing to external systems at ambient temperature. The<strong>Probe</strong> contains a sequence of four windows that enable the telescope to view the guide star. The <strong>Probe</strong> also hadto minimize heat leakage, while providing an interface for ~600 cables to the external ambient temperatureenvironment. Figure 6-4 shows various views of <strong>Probe</strong> C, the final flight probe.150 March 2007 Chapter 6 — The <strong>GP</strong>-B Management Experiment
6.3.1.2 Engineering Development Dewar & Science Mission DewarFigure 6-5. Left: Engineering Development Dewar (EDD); Middle & Right: Science Mission Dewar (SMD).The dewar is a thermos-like reservoir that holds the supply of liquid helium to maintain the <strong>Probe</strong> at a tightlyspecifiedcryogenic temperature for 16 months or more. Once filled, the dewar was never allowed to warm up,because it included a special lead-bag that formed a superconducting magnetic shield which was an integral partof the dewar well and was required for the experiment. The prototypical Engineering Development Dewar notonly allowed early integrated-system testing, but also was the vehicle for early development of the critical probedewarintegration procedure. Figure 6-5 shows various views of the Science Mission Dewar or SMD.6.3.1.3 Spherical Gyroscopes and Gyro Suspension SystemFigure 6-6. Gyroscope rotor development and precision sphericity measurement.Several types of gyros were prototyped, including ceramic, fused quartz engineering model, prototype/shuttle,and the final flight gyros. The gyros had to sustain heavy flight vibration environments, while maintaining theirperfect shape for the experiment. Figure 6-6 shows some of the gyro rotors in various stages of development andtesting.The Gyro Suspension System (GSS), that electrostatically suspends the science gyroscopes within their housingcavities and enables them to spin freely with minimal friction and torque. To perform its mission successfully,the GSS had to satisfy a number of requirements: Operate over 8 orders of force magnitude, suspend or levitatethe gyroscopes reliably, operate compatibly with the SQUID readout system, minimize electrostatic torquesduring science data collection, apply controlled torques to the rotor for calibration and initial rotor spin-axis<strong>Gravity</strong> <strong>Probe</strong> B — <strong>Post</strong> <strong>Flight</strong> Analysis • Final <strong>Report</strong> March 2007 151
alignment, and act as an accelerometer as part of the “drag-free” translation control system to further minimizeclassical torques on the rotors by another factor of 10 6 . See Section 6.3.5 below for a further discussion of theGSS development process.6.3.1.1 SQUID Magnetic Gyro ReadoutFigure 6-7. SQUID readout development prototypes and lithograph for SQUID chip.Several types of SQUID (Super-conducting QUantum Interference Device) readouts were prototyped,including Quantum Design DC SQUID, NIST DC SQUID, and DC <strong>Flight</strong> SQUID). The cryogenic SQUIDreadout system provides a gyro spin axis orientation readout, with a precision of 0.1 milliarcsecond operatingover a resolution range of ± 60 arc seconds. Figure 6-7 shows some of the SQUID prototypes, as well as thelithograph for a SQUID chip.6.3.1.2 Telescope, Image Divider Assembly, and Detector Package AssemblyFigure 6-8. An early development telescope prototype (left), the pre-flight #2 prototype telescope (center), anda close-up of the Image Divider Assembly and Detector Assembly Package from the #2 pre-flight prototype.Two early models of the science telescope were built in order to determine the technology requirements for theactual flight telescope. Later, three complete telescopes were incrementally prototyped, and 95% of the partswere manufactured for a fourth one. The first of the later prototype telescopes was manufactured primarily fortesting optical performance. The second and third flight prototypes were both completed to flight qualificationstandards, and the third was integrated into the SIA in <strong>Probe</strong> C and flown on the mission. Assembly was started152 March 2007 Chapter 6 — The <strong>GP</strong>-B Management Experiment
on a fourth flight-ready prototype, but halted when it was determined that the third met all necessary flightqualifications. Figure 6-8 above shows an early telescope prototype, plus the pre-flight #2 prototype telescopeand its IDA.6.3.2 Re-Thinking STORE <strong>Post</strong>-ChallengerIn the wake of the Challenger disaster in 1986, NASA closed its West Coast, polar-orbiting shuttle launchfacility at Vandenberg AFB in California, and it became necessary to re-cast the <strong>GP</strong>-B mission as a satellite to belaunched there by its own expendable rocket. Thus, in parallel with the incremental prototyping of <strong>GP</strong>-B flighthardware, the team also began redesigning the STORE experiment. In 1988, a new shuttle-based test of <strong>GP</strong>-Btechnology was proposed, designated Shuttle Test Unit (STU), and it was planned to take place in the mid-1990s. STU represented a substantial de-scoping of STORE. It was to be a room-temperature test of gyrosuspension and spin-up in a micro-gravity environment. There were no cryogenics, no read-out, and notelescope. Gaylord Green, a retired Colonel from the U.S. Air Force who had worked with Parkinson on the <strong>GP</strong>Sdevelopment, was brought on-board the <strong>GP</strong>-B team as the STU Project Manager. The STU experimentremained part of the <strong>GP</strong>-B plan until 1995, when NASA concurred with <strong>Stanford</strong>'s recommendation that aShuttle test of the technology was of limited overall value and would no longer be necessary. The testingperformed during incremental prototyping of the flight hardware had already demonstrated the flight readinessof several key hardware components, and thus the funds that had been designated for the STU Program couldbetter be used directly preparing <strong>GP</strong>-B for flight.6.3.3 Selecting a Spacecraft SubcontractorBy the early 1990s, it had become apparent that regardless of whether the STU Shuttle test of <strong>GP</strong>-B technologywas carried out, the final experiment would require a space vehicle (satellite) that would house the dewar andprobe as an integrated system, and that a subcontractor needed to be selected to develop this space vehicle. In1992, <strong>Stanford</strong> received approval from NASA to begin this selection process.<strong>Stanford</strong> sent out a Request For Proposal (RFP) and received preliminary proposals from three aerospacecompanies: General Electric, Fairchild Aerospace, and Lockheed Martin. During the initial round <strong>Stanford</strong>narrowed the selection to Fairchild Aerospace and Lockheed Martin. Then, in 1993-1994, <strong>Stanford</strong> funded bothcompanies to develop competing Phase A proposals. The two proposals were closely competitive, each havingsuperior aspects, and <strong>GP</strong>-B team members were divided as to which company should be awarded the contract.After a thorough review of both proposals, it was decided that LM's existing software for attitude control,inherited from the Hubble Space Telescope program, gave LM an advantage over Fairchild, and thus, <strong>Stanford</strong>selected LM to build the space vehicle. The contract gave LM responsibility for acquiring and building thespacecraft subsystems, integrating the spacecraft assembly, integrating the payload with the spacecraft upon thespace vehicle, performing integrated testing, supporting pre-launch operations and supporting missionoperations from initialization and on-orbit checkout (IOC) through the science data collection and post-scienceinstrument calibration phases of the flight mission. Pictured in Figure 6-9 below are members of the <strong>GP</strong>-BSpacecraft Development Team at Lockheed Martin circa 1995.<strong>Gravity</strong> <strong>Probe</strong> B — <strong>Post</strong> <strong>Flight</strong> Analysis • Final <strong>Report</strong> March 2007 153
Figure 6-9. The Lockheed Martin <strong>GP</strong>-B Spacecraft Development Team circa 1995. Key managers from LMincluded: Norman Bennett, Hugh Dougherty, Bill Reeve, Robert Schultz, and Jeff Vanden Beukel.6.3.4 NASA Funds <strong>GP</strong>-B as a <strong>Flight</strong> ProgramBy 1994, all of the pieces of a <strong>GP</strong>-B flight mission were at last coming together: flight-ready prototyping of thegyros, analog gyro suspension system, and gyro readout system at <strong>Stanford</strong>, development of the flight dewar andprobe at LM, and the competitive selection of LM to construct the space vehicle. During this time period,extensive exchanges took place between NASA/MSFC, NASA HQ and <strong>Stanford</strong> as to the most appropriatemethod of going forward. An earlier decision (1993) by the then Associate Administrator of the Office of SpaceSciences and Applications (OSSA) led to an unusual funding arrangement. In contrast to the standard NASAfunding profile for flight programs, where there is a substantial increase in annual budget during the two orthree years prior to launch to minimize risk and contingency, <strong>GP</strong>-B would receive a level funding of $50M/yearwith schedule as contingency. While this was recognized as non-optimal, it was deemed most acceptable optionin the constrained overall OSSA budget plan.Prior analyses, including the independently reviewed FY '95 Program Funding Plan (PFP), had provided for amission with an October 2002 launch and an overall program cost including the launch vehicle, full Phase E andtracking/data costs, and $147.8M already invested for technical development and STORE, amounting to$743.8M. The plan included fabrication of two flight dewars and four dewar probes. The $743.8M was thebottom line figure in the Program Commitment Agreement (PCA) signed August 23, 1994 by the NASAProgram Associate Administrator, the NASA Administrator, and NASA Comptroller. Prior to that (and notedin the PCA), MSFC, the Office of Space Sciences, and <strong>Stanford</strong> had recommended a de-scoped program,eliminating the Shuttle Test Unit (STU) and cancelling the development of a third flight dewar and a fourthprobe (having deemed that the second dewar and third prototype probe were satisfactory for flight), with atarget launch date of October 2000. By way of 'schedule contingency', an additional 15% (1 year) reserve (i.e. anOctober 2001 launch) was identified to be held at NASA HQ. The total runout costs to October 2001 includingmission operations and data analysis - but excluding the launch vehicle (~$62M), tracking/data (~$20M), and154 March 2007 Chapter 6 — The <strong>GP</strong>-B Management Experiment
any HQ costs - was $410.7M, or including the $147.8M prior sunk costs, a total $558.5M. (A footnote in thePCA identified this “recent re-baselining” and indicated an expected reduction of the “BTC and runout costs ofabout $90 million”.)Following the July 1994 letter exchange and signed PCA, <strong>GP</strong>-B went rapidly ahead with continuation of<strong>Stanford</strong>/Lockheed Martin payload activities and the release of the separate competitively selected space vehiclesubcontract to Lockheed Martin. Funding continued at the assigned PCA level of $50M/year (plus inflation)through FY '98. On November 16, 1996, however, the MSFC <strong>GP</strong>-B Program Manager (R. Geveden) found itnecessary to sound the alarm in a memorandum to NASA HQ headed “Impact of <strong>Gravity</strong> <strong>Probe</strong> B FundingCuts.” He noted that the NASA HQ budget submission to the OMB showed a $1M reduction in FY '98 and an$11M reduction in FY '99. The proposed budget cuts “jeopardize our ability to carry the program to thecommitted launch date and severely limit our ability to manage outyear contingencies.” The situation wasalleviated in July 1998 by the addition of some additional year-end funding ($10.3M) to compensate for theshortfall over FY '98/'99. But, heavily reduced funding in FY '00, '01, and subsequent years below the levelfunding commitment caused acute difficulties for <strong>GP</strong>-B. During the most critical phase of development, theprogram faced the shortfalls shown in Table 6-1 below.Table 6-1. <strong>GP</strong>-B Promised vs. Actual Funding History, FY '99 - FY '02$M to <strong>Stanford</strong> FY '99 FY '00 FY '01 FY '02Program Commitment 52.8 55.8 58.2 59.0♦Actual Funding 54.2* 36.4 35.6 48.2Annual Shortfall 19.4 22.6 10.8Cumulative Shortfall — 18.0 40.6 51.4*Includes $10.3M from the FY '98 year-end increment; ♦per PCAThe impact was a greatly delayed start on the payload electronics systems which in turn complicated thediagnosis of other probe and dewar issues (noted below), and ended by delaying the <strong>GP</strong>-B launch by at least twoyears.Issues of funding are not always within NASA's full control. Recognizing this, we judge that a critical evaluationof the level-funding concept is in order. The difficulties become far more acute when even level-funding is notmaintained. Given the circumstances, the MSFC/<strong>Stanford</strong>/Lockheed teams' performance was more thancommendable. It may be observed that after the large number of puts and takes for de-scoping, budgetshortfalls, and hardware challenges during development, the actual cost of the program to date ($767M) is veryclose to the estimate in the original PCA ($744M).6.3.5 <strong>Flight</strong> Hardware and Electronics DevelopmentStreamlining of the program scope in 1994 hastened the completion of the SMD (Science Mission Dewar), thesecond dewar developed for <strong>GP</strong>-B by LM, which was delivered to <strong>Stanford</strong> in November 1996. <strong>Probe</strong> C, thethird and final probe developed by LM was delivered to <strong>Stanford</strong> in 1998. Then, as planned, the developmenteffort on the spacecraft began to ramp up. Also at this time, development of three key electronics systems—TheSQUID Readout Electronics (SRE), the Telescope Readout Electronics (TRE) and Experiment Control Unit(ECU)—commenced as a collaboration between <strong>Stanford</strong> and LM. These electronics systems were originallyincluded in <strong>Stanford</strong>'s dewar/probe contract with LM, but since development of these electronics systems hadbeen postponed to hasten delivery of the dewar and probe, their development was now folded into the LMspacecraft contract.<strong>Gravity</strong> <strong>Probe</strong> B — <strong>Post</strong> <strong>Flight</strong> Analysis • Final <strong>Report</strong> March 2007 155
Furthermore, a fourth electronic system, the Gyro Suspension System (GSS), underwent a completetransformation in 1996. Development of what was originally called the Gyro Suspension Unit (GSU) had beguna number of years earlier under the leadership of Richard Van Patten at <strong>Stanford</strong>. The original design was basedon a laboratory gyro suspension system using analog, rather than digital electronics, and a number of issues,including weight, power consumption, adherence to <strong>GP</strong>-B torque requirements and compatibility with the <strong>GP</strong>-B SQUID readout electronics, needed to be addressed in order to use this system in a spacecraft. As a result, theanalog suspension system was becoming increasingly complex, and senior <strong>GP</strong>-B managers were concernedabout the reliability and accuracy of this mission-critical system on orbit. With the <strong>GP</strong>-B launch date only foursixyears away, the senior program managers made the difficult decision to start over—that is, they decided todesign and construct a digital, rather than analog suspension system. A new collaborative GSS team, includingengineers and scientists from <strong>Stanford</strong> and Lockheed Martin was assembled at <strong>Stanford</strong>, under the leadership ofBill Bencze (who became post-flight <strong>GP</strong>-B Program Manager in 2005).It is a testament to the immense dedication and collaboration of the <strong>Stanford</strong> and LM teams that the three mostmission-critical electronics systems—the GSS, SRE and TRE—all performed flawlessly throughout the entiremission.6.4 Payload Integration, Testing and Repairs (1997-2002)In addition to continued development of the spacecraft, the Gyro Suspension System, and three key electronicssystems described in the previous section, the years from 1997 through 2002 were primarily focused on payloadintegration and testing. This included integrating the gyros, SQUIDs, telescope, etc. into the Science InstrumentAssembly (SIA), the SIA into the probe, and the probe into the dewar. The whole payload was then tested as aunified system. These years represented a critical period for <strong>GP</strong>-B, in which engineering design came face-tofacewith the realities of technology fabrication. Not surprisingly, some unexpected design and assembly issuesbegan to surface during tests of the integrated payload system. Addressing these issues used up the savings intime and money gained from streamlining the scope of the program, postponed the launch date from 2000 to2002 (then to 2003 and ultimately 2004), and resulted in greater NASA management oversight during thisperiod.6.4.1 Devising a Work-around for the Dewar Axial LockThe first of these issues was a problem with the dewar's axial locks, a set of three deployable clamps locatedaround the circumference of a pair of mating flanges in the center of the dewar—one flange at the top of thecryogenic portion of the probe and the other at the top of the dewar's helium-filled main tank. Each axial lockclamp had a bolt, that when tightened down, compressed the probe and dewar flanges together, ensuringpositive thermal contact between the lower, cryogenic portion of the probe and the dewar main tank.When Lockheed Martin delivered the final SMD to <strong>Stanford</strong> late in 1996, work began in 1997 testing andpreparing it to accept <strong>Probe</strong> C, which was also nearing completion. Preparation activities included filling thedewar with liquid helium and a painstaking process of inserting a sequential series of four nested lead bags,three of which were removed as part of the process, leaving a single, very effective cryogenic, superconducting,magnetic shield lining the probe cavity. Once lead bag installation was completed in the summer of 1997, <strong>Probe</strong>B—the second prototype probe that had previously been delivered to <strong>Stanford</strong>—was inserted into the dewar as atest to ensure that the dewar-probe interface would function as expected when <strong>Probe</strong> C was delivered andintegrated into the dewar.In testing the SMD before delivery to <strong>Stanford</strong>, engineers at LM discovered some galling in the threads of one ofthe axial lock bolts, causing the bolt to seize up. At the time, LM engineers felt that this problem was isolated tothat individual bolt and that if it were not used, the remaining two axial locks could adequately hold the flanges156 March 2007 Chapter 6 — The <strong>GP</strong>-B Management Experiment
together. Thus, when the <strong>Stanford</strong> engineers inserted <strong>Probe</strong> B into the SMD for testing, they did not tighten thefaulty bolt, but they soon discovered that the same problem was occurring with the second axial lock, and theybecame concerned that if the bolts in either of the remaining two axial locks seized up completely, it would notbe possible to remove <strong>Probe</strong> B from the SMD.This was a critical issue, for which there were basically two solutions:1. Send the SMD (dewar) back to LMSC to be modified and re-built.2. Abandon the axial lock system entirely and modify <strong>Probe</strong> C, which was still at LMSC, to provide positivethermal contact between the two flanges using Belleville spring cup washers at the top (warm region) ofthe probe.It was clear that the latter solution, which became known as the Belleville Preload System (BPS), would be faster,less expensive, and less risky to implement. Thus, work began at LMSC to modify <strong>Probe</strong> C to use the BPS,delaying its delivery to <strong>Stanford</strong> by about eight months. This delay, and later others, required the dewar to bemaintained at a cryogenic temperature for over eight years, through the end of the mission—an amazing feat inits own right.6.4.2 <strong>Flight</strong> <strong>Probe</strong> C Integration & TestingThroughout Bradford Parkinson's tenure as Program Manager, Co-PI, John Turneaure, served as the <strong>GP</strong>-BHardware Manager, with responsibility for managing the day-to-day development of the <strong>GP</strong>-B flight hardware.In 1998, Parkinson decided to step aside as Program Manager to become acting CEO of Trimble NavigationLtd., a Silicon Valley navigation technology company, although still maintaining his position as a Co-PI, andalso a senior advisor to <strong>GP</strong>-B. Given his intimate knowledge about <strong>GP</strong>-B flight hardware and close workingrelationship with Parkinson, it was a natural transition for Turneaure to take over as Program Manager.Lockheed Martin delivered <strong>Probe</strong> C to <strong>Stanford</strong> in mid 1998, with Turneaure now serving as Program Manager,and immediately, testing began on the fit of <strong>Probe</strong> C into the SMD. The new BPS hardware was then used tospring-load the probe into the dewar, and tests were performed to verify thermal contact between the SIAportion of the probe and the dewar's main tank.Once it was established that the BPS dewar-probe locking interface was performing properly, it was necessary toextract <strong>Probe</strong> C and move it to a clean room at <strong>Stanford</strong>, where the Science Instrument Assembly (SIA),comprising the gyros, SQUIDs, and telescope, was then to be integrated into the lower, cryogenic cavity of theprobe. This work proceeded smoothly for several months, and by mid 1999, <strong>Probe</strong> C (also called the ScienceMission <strong>Probe</strong> or SMP) was ready to be inserted into the SMD for integrated payload testing.Testing of the integrated payload system commenced in August 1999, and during these tests, anotherunexpected thermal contact issue surfaced, as well as an unrelated problem with the pickup loop for gyro #4.Temperature measurements taken at various points in the probe and dewar revealed that a set of four copperbands, each attached to a corresponding window inside the neck of the probe, were not making thermal contactwith a matching set of copper bands on the outside of the probe neck, thereby preventing the probe windowsfrom intercepting thermal radiation propagating down the neck of the probe. The thermal interface between theinner and outer copper bands had worked well in the <strong>Probe</strong> A and B prototypes, but during the assembly of<strong>Probe</strong> C, there apparently had been problems with the epoxy tape that secured these bands in position. Becauseinterception of thermal radiation in the probe neck was essential for maintaining a cryogenic environment inthe SIA, failure of this thermal interface was a serious problem that had to be solved. Consequently, the probehad to be removed from the dewar once again, further delaying the launch and mission.Collaborating closely, Turneaure and LM Lead <strong>Probe</strong> Engineer, Gary Reynolds devised a solution. Theydetermined that carefully drilling a series of holes through the outer bands and probe wall, into—but notthrough—the inner bands and then cementing small copper pegs into these holes with epoxy, would yield<strong>Gravity</strong> <strong>Probe</strong> B — <strong>Post</strong> <strong>Flight</strong> Analysis • Final <strong>Report</strong> March 2007 157
positive thermal connections between the inner and outer bands, thus meeting the needs of the experiment.Rather than returning <strong>Probe</strong> C to LM for this modification, it was decided that the work would be done at<strong>Stanford</strong> so that members of the <strong>Stanford</strong> gyro team could replace gyro #4 at the same time.6.4.3 Repairing <strong>Flight</strong> <strong>Probe</strong> C & Replacing Gyro #4Having devised a conceptual solution for the repair of <strong>Probe</strong> C, Turneaure, who had been working tirelessly on<strong>GP</strong>-B hardware development since the mid 1980s decided to step back from the role of Program Manager.Everitt then appointed Sasha Buchman, a <strong>GP</strong>-B physicist and Co-Investigator who had been working closelywith Turneaure, as the new Program Manager, and Turneaure took a well-deserved sabbatical. Thus,Buchman's first task as <strong>GP</strong>-B Program Manager was to oversee the retrofitting of <strong>Probe</strong> C with copper pins tosolve the thermal contact problem, and to supervise the replacement of gyro #4 and the reintegration of <strong>Probe</strong> Cinto the dewar.At a <strong>Probe</strong> C repair review, held in March 2000, it was determined that the team was ready to implement theTurnearue/Reynolds copper pin solution, and the repairs to <strong>Probe</strong> C commenced. The repair work was carriedout in a <strong>Stanford</strong> clean room by the LM spacecraft team, under the supervision of Jeff Vanden Beukel. Inparallel, while the copper pins were being inserted in the upper portion of the probe, the vacuum cover wasremoved from the lower half of the probe, and gyro #4 was replaced by the <strong>Stanford</strong> gyro team. The copper pinthermal repairs were completed in May, and the replacement of gyro #4, along with some other minor repairs tothe probe were completed in September. Then, during the fall of 2000, <strong>Probe</strong> C was reintegrated into the SMDfor the last time.Parkinson’s transition in 1998 from Program Manager to Co-PI and Program Advisor resulted in his spendingmuch less time at <strong>GP</strong>-B thereafter, and this left the <strong>GP</strong>-B senior management team in need of an experiencedaerospace engineer on-site at <strong>Stanford</strong>. Early in 2000, a NASA Independent Review Team (IRT) mandated that<strong>GP</strong>-B acquire a management-level consultant with considerable aerospace experience. To this end, Ron Singley,who had worked for many years at Lockheed Martin, was hired by <strong>GP</strong>-B later that year to serve in this capacity,helping <strong>Stanford</strong> improve their interactions with LM and aiding in the efficient development of the spacevehicle.6.4.4 Moving Towards <strong>Flight</strong> ReadinessBy early 2001, all of the major <strong>GP</strong>-B flight hardware problems had been solved, except for the Gas ManagementAssembly (GMA). Realizing that its team lacked the expertise to build a flight-ready gas management system,<strong>Stanford</strong> (with strong support from NASA) decided to contract out the development of this hardware. <strong>Stanford</strong>conducted a brief, but thorough source-selection process, and in June 2001, selected Moog, Inc. in East Aurora,New York, to design and build a GMA system for <strong>GP</strong>-B. Moog had considerable experience building suchsystems, and they delivered a flight-certified GMA system just 13 months later, in August 2002. Much creditgoes to <strong>Stanford</strong>’s lead engineer, Chris Gray and to Lockheed Martin engineering manager, Jeff Vanden Beukel,for making this happen in an extremely responsive manner.Many other milestones were also accomplished in 2001-2002, including an acoustic vibration test of theintegrated payload, completion of the space vehicle at LM, and integration of the payload with the spacecraft. Inaddition, the payload electronics boxes—TRE, SRE, and ECU—were completed and installed in mid 2002, aswas the new GSS electronics system. Equally important, work had begun in 2000 setting up the <strong>GP</strong>-B MissionOperations Center at <strong>Stanford</strong>, from which the spacecraft and payload would be monitored and controlled onceit was in orbit. Likewise, work on mission operations procedures, training, and simulations commenced in 2000and continued through mid 2003.158 March 2007 Chapter 6 — The <strong>GP</strong>-B Management Experiment
In January 2002, Sasha Buchman had to step down as Program Manager due to health issues, and Ron Singleytook over as Interim Program Manager for most of 2002. Singley led the <strong>Stanford</strong>/Lockheed Martin team incompleting the payload-spacecraft integration and testing activities.6.4.5 Changing Focus from Maximizing R&D to Minimizing RiskDuring the years from 1995-1999, <strong>GP</strong>-B was in the process of making a critical program transition in which itwas necessary to shift focus from maximizing advances in research and development to minimizing the risks inproducing a flight-ready spacecraft. This was a difficult transition, exacerbated by the critical problems with thedewar and probe and the program delays resulting from addressing those issues.To address the risk issues in all facets of the program, a risk management system was developed by RobertSchultz of Lockheed Martin. Schultz served as the Chief Systems Engineer for both LM and <strong>Stanford</strong>, andhaving a “crossover” person in this position turned to be a great advantage to the <strong>GP</strong>-B mission. The <strong>GP</strong>-B RiskManagement Plan, which is described in more detail in Chapter 5, Section 5.4 “Risk Analysis” , was based on arisk management plan used at the Jet Propulsion Labs (JPL) in Pasadena, California on other NASA missions.The <strong>Stanford</strong>/LM risk management plan for <strong>GP</strong>-B was developed during the first half of 2000 and implementedin October of that year. Likewise, engineers at MSFC came up with a parallel and similar risk management planwhich they followed for <strong>GP</strong>-B. On page 19 of their report, Calder and Jones note:…A risk management system was finally implemented on <strong>GP</strong>-B around fiscal year 2000 andthe productivity of the program increased tremendously. Additionally, the nature of therelationship between SU/LM teams and their NASA colleagues improved. <strong>GP</strong>-B developed apredictable process of scaling the support based on the level of risk, i.e., the higher the risk themore support imparted by NASA. This ensured that the appropriate amount of support wasprovided and empowered the space vehicle team with the knowledge of what to expect fromNASA for any given problem.6.4.6 NASA/MSFC Management of <strong>GP</strong>-BDuring the early years, <strong>GP</strong>-B was a NASA-funded university research program, managed from NASAHeadquarters with minimal oversight, first by Nancy Roman and later by Jeffrey Rosendhal. In 1971, NASAHeadquarters formally transferred management oversight responsibility for <strong>GP</strong>-B to the Marshall Space <strong>Flight</strong>Center, where Richard Potter provided guidance and support through 1993. During the last 10 years of Potter’sterm as the nominal program manager for <strong>GP</strong>-B, other MSFC managers shared the managementresponsibilities, including Joyce Neighbors, then Rein Ise, and finally Steve Richards. From 1990-1993, <strong>GP</strong>-Bmanagement oversight transitioned from Potter to Ise, and then to Richards. Ise and Richards had jointresponsibility from 1993-1995, at which time Rex Geveden took over as the first formal program manager for<strong>GP</strong>-B. Towards the end of 1995, Tony Lyons joined the <strong>GP</strong>-B program as Chief Engineer from NASA/MSFC.Furthermore, Rudolph Decher provided guidance to the <strong>GP</strong>-B from 1965 until his death in June 2004, just a fewweeks after <strong>GP</strong>-B’s launch.Because <strong>GP</strong>-B was viewed as a “management experiment,” with <strong>Stanford</strong> University serving as NASA’s primecontractor, NASA Headquarters and MSFC provided minimal management oversight—essentially monthlyadvice and consent—to <strong>GP</strong>-B management at <strong>Stanford</strong> throughout the flight hardware development periodfrom 1984-1996. However, in monitoring the hardware issues and schedule delays that occurred from 1997-2002, as <strong>GP</strong>-B transitioned from an R&D program to a NASA flight mission, upper management at NASAHeadquarters became increasingly concerned about the viability of the <strong>GP</strong>-B mission, and this ultimately led toNASA taking a much more active role in the management of <strong>GP</strong>-B as it was readied for launch.In 1998, following a recommendation from one of the NASA independent annual reviews, Francis Everittassembled an external <strong>GP</strong>-B Science Advisory Committee (SAC), comprised of eight distinguished scientists,with expertise in various areas of relativistic and gravitational physics, low-temperature physics, and<strong>Gravity</strong> <strong>Probe</strong> B — <strong>Post</strong> <strong>Flight</strong> Analysis • Final <strong>Report</strong> March 2007 159
astrophysics/cosmology. Many of the committee members were associated with other NASA missions related to<strong>GP</strong>-B. Clifford Will, a world-renowned expert in relativity and gravitational physics, was invited to chair thiscommittee. The purpose of the SAC was to review and advise the <strong>GP</strong>-B management team on all aspects of themission, including the functioning of the probe and spacecraft, possible sources of error, as well as the final dataanalysis. As of the time this chapter was written, the SAC has met 16 times and is scheduled to meet again late in2007 to review the final experimental data analysis and results.Even before the <strong>Probe</strong> C thermal disconnect problem, it had become apparent that the <strong>GP</strong>-B launch date wouldneed to be pushed back. The discovery of the <strong>Probe</strong> C thermal problem and the pickup loop problem with gyro#4 in mid-1999 increased NASA’s concern about the program’s viability. As a result, Dan Golden, then theNASA Administrator, commissioned an independent review team (IRT) comprised of outside scientists andaerospace experts to examine the progress that had been made on the program to date, and to advise NASA as towhether the mission should be terminated or continue to proceed towards launch. <strong>GP</strong>-B senior managementsuccessfully defended the program, but there was an issue with the program funding. Because of budgetconstraints, NASA was unable to honor <strong>GP</strong>-B’s level-funding plan. (See Section 6.3.4, NASA Funds <strong>GP</strong>-B as a<strong>Flight</strong> Program.) Consequently, the program was never able to increase the electronics and spacecraftdevelopment efforts to desired levels, and the result was further delays in the completion of those systems.At the beginning of 2000, <strong>Stanford</strong> and Lockheed Martin management prepared a plan, including a revised timeline and budget, for addressing the issues with <strong>Probe</strong> C and gyro #4 and for moving <strong>GP</strong>-B to the launch pad. Thefollowing month, Golden, convened another top-level review of <strong>GP</strong>-B at NASA Headquarters. Everitt,Parkinson, Buchman and other senior management from <strong>Stanford</strong>, as well as senior management from LM andMSFC were all present at this meeting. At this point, NASA's main concern was the viability of the <strong>GP</strong>-Bmission, minimizing of risk, and constraining the remaining time and cost of completing the mission. Onceagain, Everitt, Parkinson, and Buchman prevailed, and <strong>GP</strong>-B was given a green light to proceed, with launchnow anticipated in May 2002. However, at this point, Ed Weiler, the head of the Science Mission Directorate atNASA Headquarters, under which <strong>GP</strong>-B was managed and funded, placed full responsibility for the successfullaunch and completion of the <strong>GP</strong>-B mission in the hands of Arthur Stephenson, then the Director of MSFC.Stephenson interpreted this directive as meaning that a team of MSFC managers, scientists, and engineers, ledby Geveden, needed to get actively involved in the day-to-day activities of <strong>GP</strong>-B.Thus began a difficult two-year period from 2000-2002, during which the three entities involved—MSFC,<strong>Stanford</strong>, and LM—had to figure out how to communicate and work together effectively and harmoniously.Each of these entities had its own “culture” and ways of doing things that were successful for each entityrespectively. These differences were an advantage in the early stages of the program when innovation andtechnology development were most important. However, in the focused environment of meeting a launchschedule while trying to minimize the risk of failure, these three divergent cultures collided. For example, the<strong>Stanford</strong> scientists and engineers, who excelled at innovating technology, were unaccustomed to the rigorous,methodical, procedural nature of the aerospace industry. Likewise, seasoned aerospace managers werefrustrated by the tendency of university researchers to continue tinkering with and perfecting technologies pasta stage that would be “good enough” to meet necessary milestones in a tight schedule.In addition to the differences in culture, the <strong>Stanford</strong> management team, particularly with Parkinson’s reducedinvolvement after 1998, had little collective experience with the intricacies of launching a satellite. At this stagein the program, they often needed help from NASA and from LM. The issue was that <strong>Stanford</strong> needed to learnhow and when to request help from MSFC and LM. Likewise, MSFC, in particular, needed to learn when andhow best to respond to such requests.Furthermore, unlike the Chandra Telescope mission in which MSFC was actively involved in every step of thedesign and development, MSFC scientists and engineers had minimal involvement in the development of <strong>GP</strong>-Bhardware and technology, since most of the development was done at <strong>Stanford</strong> and Lockheed Martin, under the160 March 2007 Chapter 6 — The <strong>GP</strong>-B Management Experiment
supervision of the <strong>Stanford</strong> <strong>GP</strong>-B management team. Thus, when Stephenson and Geveden began sendingteams of NASA personnel to <strong>Stanford</strong> to support the program, this proved to be problematic. As stated in theCalder-Jones <strong>Report</strong>, page 33:…The <strong>Stanford</strong> and Lockheed Martin teams were unprepared for this influx from NASA andinitially it slowed <strong>GP</strong>-B's progress even further. Engineers and scientists were now not onlyattempting to solve their own technical issues but were being forced to meet, brief, and reporttheir activities at a level [of detail] far beyond what they were accustomed to....The situation was also frustrating for the MSFC engineers, who originally felt that they had a mandate fromStephenson to gain as much insight into <strong>GP</strong>-B as they had with Chandra. Eventually Stephenson clarified thatwhile he recognized that Chandra-level insight was not possible, he still wanted MSFC to have an appropriatelevel of insight, and he directed Geveden to find a more productive solution. It fell to Lead Systems EngineerBuddy Randolph to devise a risk-based oversight system, based on a risk management system and a 5-levelinsight system developed by the MSFC Engineering Directorate.Other factors served to improve the working relationships, including the constant efforts of Resident ManagerEd Ingraham, a communications plan negotiated and signed by Geveden, Buchman, and Hugh Dougherty (LMProgram Manager), additional systems engineering personnel brought in by LM, and efforts by <strong>Stanford</strong>personnel, in many cases with LM support, to adopt such NASA and industry practices as risk managementsystems, fault tree analyses, and requirements verification. Others who contributed significantly to these effortsincluded LM Lead Systems Engineer Bob Schultz, LM systems Engineer Rich Whelan, and MSFC systemsengineer Brian Mulac.The Space Vehicle Acceptance Review (SVAR) in June 2003 was a significant, and much-improved, contrast tothe Payload Acceptance Review (PAR). While the PAR issues took a long time to close (almost until the SVAR,in some cases), the noticeably-fewer SVAR issues closed within weeks. The entire team had clearly stepped up tothe job of getting the space vehicle ready for transport to Vandenberg AFB for launch.Unfortunately, in late 2003 there was a need for one last launch delay, to April 2004. This meant one morereview with NASA Headquarters to establish a new launch date. The competence of the <strong>Stanford</strong>-LM-MSFCteam clearly showed, with convincing and viable plan being presented to NASA managers. The result was asmooth, non-controversial review that established April 17 as the target launch date. The <strong>GP</strong>-B teamsuccessfully held to this schedule throughout the pre-launch processing until launch vehicle delays moved thelaunch to April 20. (See Sections 6.5.2 and 6.5.3 for further discussion of this launch delay.)In July 2002, Geveden became Deputy Director of the MSFC Science Directorate, and in July 2003, he becameDeputy Director of MSFC, but he remained Program Manager for <strong>GP</strong>-B through August 2004, when <strong>GP</strong>-Bcompleted its Initialization and Orbit Checkout (IOC) phase. In October 2004, Geveden moved from MSFC toNASA Headquarters to become the NASA Chief Engineer, and in August 2005, he was promoted to the positionof NASA Associate Administrator. In September 2004, Tony Lyons became Program Manager for <strong>GP</strong>-B, aposition which he still holds. Arthur Stephenson stepped down as Director of MSFC in May 2003, and hesubsequently retired from NASA in January 2004.Pictured in Figure 6-10 below are eight persons as MSFC who guided and/or supported the <strong>GP</strong>-B program since1965, including: Rudolph Decher (1965-2004), Richard Potter (1971-1996), Joyce Neighbors (1981-1993), ReinIse (1985-1996), Steve Richards (1990-1995), Rex Geveden (1995-2004), Tony Lyons (1998-Present), and MSFCDirector, Arthur Stephenson (1998-2003).<strong>Gravity</strong> <strong>Probe</strong> B — <strong>Post</strong> <strong>Flight</strong> Analysis • Final <strong>Report</strong> March 2007 161
Figure 6-10. MSFC Program Managers/supporters of <strong>GP</strong>-B since 1995. Clockwise from top left: Rudolph Decher,Richard Potter, Joyce Neighbors, Rein Ise, Steve Richards, Rex Geveden, Tony Lyons, and Arthur Stephenson.In addition to the NASA/MSFC managers/leaders above, four other persons pictured below in Figure 6-11played important roles in the success of <strong>GP</strong>-B. They include NASA Resident Manager, Edward Ingraham,Integration Manager, Todd May, Chief Engineer/Lead Systems Engineer, Buddy Randolph, and ChiefEngineer/Subsystem Manager, Stephan Davis.Figure 6-11. MSFC resident and engineering managers. Left to right: Edward Ingraham, Todd May,Buddy Randolph, and Stephan Davis.Among many at NASA Headquarters who helped make <strong>GP</strong>-B happen, in addition to Nancy Roman and JeffreyRosendhal, were Dixon Ashworth, George Albright, Colleen Hartman, Samuel Keller, Anne Kinney, FrankMartin, Frank McDonald, Ernest Ott, and Charles Pellerin. The current <strong>GP</strong>-B program executive at NASAHeadquarters is Alan Smale.162 March 2007 Chapter 6 — The <strong>GP</strong>-B Management Experiment
6.5 Final Integrated Testing, Launch & Science Mission(2002-2005)In November 2002, Gaylord Green became Program Manager. During 2001-2002, Green, who had considerableprior spacecraft operations experience—including working with Parkinson on the development anddeployment of the U.S. Air Force’s Global Positioning Satellite System—had been responsible for organizing theground support operations for <strong>GP</strong>-B at the Vandenberg Air Force Base launch site on the southern Californiacoast. At the time he assumed the job of Program Manager, the spacecraft was being prepared at LockheedMartin for a thermal vacuum test—a ground simulation of the conditions that the spacecraft would encounterin orbit.6.5.1 The Thermal Vacuum TestBefore the thermal vacuum test began, the LM mechanical team inadvertently left some unshielded wires restingagainst the spacecraft. Then, on the next shift, when the electronics team powered up the spacecraft for theelectronics test, four fuses blew, preventing heater strips from being powered. Thus, during the thermal vacuumtest at the cold temperatures of space, the associated heaters were not turned on and certain parts of thespacecraft were too cold. Also, a vent on the dewar's guard tank leaked into the thermal vacuum chamber,degrading the vacuum.With the launch date now set for December 2003, and what appeared to be yet another possible problem withthe spacecraft, NASA Headquarters convened yet another program review to determine whether to proceedtowards launch or cancel the program. Both the NASA Independent Review Team and the <strong>GP</strong>-B ScienceAdvisory Committee recommended that <strong>GP</strong>-B continue with launch preparations. To ensure minimal risk,NASA decided to repeat the thermal vacuum test following a spin balance test early in 2003. The second thermalvacuum test was performed in May 2003 without issue. Shortly thereafter, in July 2003, the spacecraft wasloaded aboard a special truck and driven to the launch complex at Vandenberg Air Force Base.Back at <strong>Stanford</strong>, throughout the latter part of 2002 and most of 2003, the <strong>GP</strong>-B Mission Operations Center andthe mission operations team worked very hard, preparing for launch. Under Green's management, a total ofseven procedural simulations were held to rehearse the <strong>GP</strong>-B mission operations team both for launch and foran unusually sophisticated initialization and orbit checkout period. Rehearsals for dealing with a number ofpotential anomalies that could occur on orbit were included in these simulations.6.5.2 Six-Month Launch <strong>Post</strong>ponement for ECU RepairIn early November 2003, as part of a final spacecraft acceptance review, a grounding problem was discovered ina voltage converter on the Experiment Control Unit (ECU). The ECU was essential for gyro spinup and dewarmonitoring, but not for collecting experimental data. <strong>Stanford</strong>'s recommendation was to turn off the ECUduring the actual science experiment, but LM recommended repairing it. NASA Headquarters then had to makea difficult go/no-go decision. This was the ultimate risk management decision, and not wanting to possiblyjeopardize the experimental results, NASA Headquarters reluctantly decided to postpone the launch for 5-6months so that the ECU could be returned to LM for correction of the voltage converter problem.6.5.3 Successful Launch and <strong>Flight</strong> MissionModifications to the ECU were completed in March 2004, and the ECU was then shipped back to Vandenbergand reinstalled on the spacecraft frame. A new launch date was set for mid April, and a pre-launch pressconference was held at NASA Headquarters at the beginning of April. The <strong>GP</strong>-B team, which at that timeincluded people from LM and NASA and totaled close to 200 people was primed and ready when <strong>GP</strong>-B finallylaunched on April 20, 2004. It was a flawless launch.<strong>Gravity</strong> <strong>Probe</strong> B — <strong>Post</strong> <strong>Flight</strong> Analysis • Final <strong>Report</strong> March 2007 163
As described in Chapter 2, the flight mission lasted for 17.3 months, including a 4-month initialization and orbitcheckout (IOC) phase, a 50-week science (data collection) phase, and a 6-week post-science instrumentcalibration phase. During the flight mission months, Green organized the mission operations team withrotating Mission Directors and <strong>Flight</strong> Directors, so that the Mission Operations Center could be staffed 24hours a day, seven days a week. Every weekday, all-hands status meetings were held at 10:00 AM to brief theentire team on the status of the spacecraft and payload and to address any issues that may have arisen during theprevious day or weekend. A more detailed description of mission operations is included in Chapter 4, Section4.1.2 “Daily Operations Routine” . Green's management style was an excellent fit for the 17.3-month flightmission. He was able to achieve extraordinary performance from the <strong>GP</strong>-B mission operations team, which ledto the entire team being given a NASA Group Achievement Award, presented by Tony Lyons from MSFC, inNovember 2005, shortly after the mission concluded.6.6 Data Analysis Period (2005-2007)Throughout the flight mission, the <strong>GP</strong>-B team numbered approximately 150 people, a large percentage ofwhom were dedicated to mission operations activities. Naturally, as the flight mission began to wind down inAugust-September 2005, the focus of the <strong>GP</strong>-B began to shift from operating the spacecraft to analyzing theexperimental data that had been collected. Between August and November 2005, <strong>GP</strong>-B said farewell to all but ahandful of mission operations personnel. Some of the departing team members had worked on <strong>GP</strong>-B for tenyears or more, and thus the mood at farewell gatherings was a mixture of triumph and sadness.6.6.1 Final Management Transition at <strong>Stanford</strong>By the end of November 2005, the <strong>GP</strong>-B team had shrunk to approximately 30 full-time scientists, engineers,mathematicians, with a small management team and associated support personnel. Gaylord Green, whosestrong expertise was managing flight programs, had limited experience and little interest in managing the dataanalysis team, and thus he began reducing his involvement in the program, as did Deputy Program Manager,Tom Langenstein. Realizing that <strong>GP</strong>-B had reached another management transition point, Francis Everittannounced in March 2006 the appointment of Bill Bencze to assume the role of <strong>GP</strong>-B Program Manager for theduration of the data analysis period. Bencze had demonstrated his leadership skills as manager of the GSSdevelopment team. His strong organizational skills, coupled with his broad knowledge of the program and hisability to communicate effectively with scientists, engineers, and management, made him an excellent choice tomanage the final phase of <strong>GP</strong>-B. In his announcement of Bencze's promotion to Program Manager, Everitt alsopraised Gaylord Green for his superb leadership during the flight mission years:This is the moment to record our tremendous admiration and respect to Gaylord for thebrilliant job he did in the four and a half years as Program Manager since November 2002.As we look back, we will all agree that those have been the most stirring years in the history of<strong>GP</strong>-B. It is an immense tribute to Gaylord that we came through them so successfully. I amconfident that with Bill we will have corresponding success in the different, but no lessstirring, time leading to our final result.Bencze was one of the key architects of the <strong>GP</strong>-B three-phase data analysis plan, and thus he is intimatelyfamiliar with the process and the issues that the team is working through. His chief management challenge forthe remainder of the data analysis phase is to synthesize the various threads of the analysis process into acoherent picture, keep the team focused on the important issues, keep the analysis on track, and ensure that thefinal results will have the lowest margin of error possibly attainable within the time and budget constraints ofthe analysis phase.164 March 2007 Chapter 6 — The <strong>GP</strong>-B Management Experiment
6.6.2 Gallery of <strong>GP</strong>-B Program Managers/Deputies at <strong>Stanford</strong>Pictured in Figure 6-12 below are the six people who served as <strong>GP</strong>-B Program Manager over its 47-year history.Figure 6-12. <strong>GP</strong>-B Program Managers. Clockwise from top left: Bradford Parkinson, John Turneaure, SashaBuchman, Ron Singley, Gaylord Green, and Bill Bencze and <strong>GP</strong>-BPictured in and Figure 6-13 below are three of the <strong>GP</strong>-B Deputy Program Managers. (Other people who alsoserved as Deputy Program Manager are pictured elsewhere in different roles.)Figure 6-13. <strong>GP</strong>-B Deputy Program Managers. Left to right: Robert Farnsworth, Tom Langenstein,and Robert Brumley<strong>Gravity</strong> <strong>Probe</strong> B — <strong>Post</strong> <strong>Flight</strong> Analysis • Final <strong>Report</strong> March 2007 165
6.7 Some Observations on the Management ExperimentWe have strong and deep reason to believe that the <strong>GP</strong>-B management experiment concept—NASA withskillful oversight, university as prime contractor, aerospace company as major subcontractor—was absolutelycrucial to the success that the <strong>GP</strong>-B mission achieved. Following are some observations about the keyingredients that led to this success.NASA’s Oversight Role The management experiment concept enabled the building of a <strong>GP</strong>-B team that couldboth develop the many new and unique technologies required by the experiment—efficiently and effectively—and also take the mission through its full lifetime. <strong>Stanford</strong> and Lockheed Martin required only minimaloversight from NASA during the technology development phase. Then, as the program approached launch,NASA provided the increased oversight and assistance necessary to minimize risk and ensure flight readiness ofthe spacecraft and the team. Once the spacecraft was in orbit and the IOC phase completed, <strong>Stanford</strong> and LMonce again required only minimal NASA oversight in successfully completing the flight mission. Finally, duringthe equally-critical data analysis period, the LM team members moved on to other aerospace projects, as the<strong>Stanford</strong> team carried out the final phase of the <strong>GP</strong>-B program.Subcontractor Selection Following a thorough, by-the-book selection process to find the very best possibletalent, spacecraft experience, and matching team spirit in an aerospace subcontractor for integration with theuniversity’s science and engineering team was an essential ingredient in the success of <strong>GP</strong>-B through every stageof the program.Incremental Prototyping The incremental prototyping method enabled the development of uniquetechnologies—the very essence of <strong>GP</strong>-B—from initial conception to flight readiness much faster and moreefficiently than the traditional final-design specification-to-contractor approach would ever have been able todo.Highly Competent People and a Cohesive Team The first ingredient for program success was the forming of asynergistic senior management team. Next came the cultivation of knowledgeable and skilled second-levelmanagers for the various development areas and the selection of the best program manger for each phase of theprogram. It was concurrently essential to find and attract truly talented and competent people—including someoutstanding university students—to provide the deep expertise needed in so many first-time-ever areas ofresearch and technology development. Finally, it was essential to bond all these people—independent of theirhome groups—into a cohesive team, in which everyone knew each other well, and each respected the knowledgeand judgment of each other person. (When a team member speaks in a status review meeting, every otherperson in the room listens carefully. This was inspiringly true through every day of the seventeen-month flightmission.)NASA Personnel at <strong>Stanford</strong> The decision to place specific NASA personnel directly on the <strong>GP</strong>-B program at<strong>Stanford</strong> was both cost-effective and a win-win strategy for both NASA and <strong>Stanford</strong>. This practice enabled<strong>Stanford</strong> to assimilate at once team members having critical experience in areas ranging from management toscience without the long and involved process of university hiring. Conversely, this practice enabled key NASApeople to work in a cutting-edge flight mission—an invaluable experience that they could bring to their nextNASA program assignment.6.8 Sources and ReferencesFollowing are the main source and references consulted in writing this chapter.The <strong>GP</strong>-B Green Book A <strong>Report</strong> on a Program to Develop a Gyro Test of General Relativity in a Satellite andAssociated Control Technology, June 1980, pp. 1-10.166 March 2007 Chapter 6 — The <strong>GP</strong>-B Management Experiment
Near Zero: New Frontiers of Physics J. D. Fairbank et al., Editors. New York, W. H. Freeman and Company,1988, pp. 587-608.From the preface: [Near Zero is] a book detailing the work of a group of physicists associated with WilliamFaribank who explored the regions of physics opened up by making one or more of the variables of physics verynearly zero. The idea of the book was conceived in August 1981 during the 16th International Conference onLow Temperature Physics, at which time about twenty people, mostly former students and associates ofFaribank, met to plan a scientific conference to honor him on the occasion of his 65th birthday....The conference was held at <strong>Stanford</strong> in March 1982, with nearly 150 participants. This book, which includes anentire chapter on <strong>GP</strong>-B, was one of the outcomes of this conference.<strong>Gravity</strong> <strong>Probe</strong> B: Countdown to Launch by C.W.F. Everitt, S. Buchman, D.B. DeBra, G.M. Keiser, J.M.Lockhart, B. Muhlfelder, B.W. Parkinson, J.P. Turneaure and other members of the <strong>Gravity</strong> <strong>Probe</strong> B team.Included in Gyros, Clocks, Interferometers...:Testing Relativistic <strong>Gravity</strong> in Space (Lecture Notes in Physics),Edited by C. Lammerzahl, C.W.F. Everitt, F.W. Hehl, Springer, 2000, pp. 52-82.This paper provides a summary of the history of <strong>GP</strong>-B and a detailed progress report on the development andtesting of <strong>Probe</strong> C, as of spring 2000. An Adobe Acrobat PDF copy of this paper is available for downloadingfrom our <strong>GP</strong>-B Web server at: http://einstein.stanford.edu/content/sci_papers/papers/Everitt_et_al-Cntdwnlaunch-2000.pdf<strong>Gravity</strong> <strong>Probe</strong> B: A Management Study A report to NASA by Edward S.Calder and Bradley T. Jones, April 21,2006.Because some aspects of <strong>GP</strong>-B program management were unique among NASA programs, and because <strong>GP</strong>-Bwas viewed as a management experiment as well as a scientific experiment, in 2005, NASA Headquarterscommissioned two former <strong>GP</strong>-B team members, Ned Calder from the Engineering Systems Division at MITand Brad Jones, from the Aeronautics & Astronautics Department at <strong>Stanford</strong> University to research andprepare an independent study on the management of <strong>GP</strong>-B. In the spring of 2006, Calder and Jones presentedtheir finished report to NASA. An Adobe Acrobat PDF copy of the complete Calder-Jones <strong>GP</strong>-B ManagementStudy <strong>Report</strong> is available for downloading from the <strong>GP</strong>-B Web server at:http://einstein.stanford.edu/pao/pfar/cj_report-apr2006.pdf.Some of the information in this chapter—especially in the latter sections—was drawn, in part, uponobservations from this report, and a few excerpts from the report have been quoted directly. (The quotedexcerpts have been identified accordingly.) In addition, a summary of lessons learned from the <strong>GP</strong>-Bmanagement experiment, as described in the Calder-Jones report, is included in Section 16.3, ManagementLessons from the Calder-Jones <strong>Report</strong>.Personal Conversations In the process of writing this chapter, all of the following people were interviewed: BillBencze, Sasha Buchman, Robert Cannon, Daniel DeBra, Francis Everitt, Gaylord Green, David Hipkins, TomLangenstein, Barry Muhlfelder, Bradford Parkinson, Mike Taber, and John Turneaure.<strong>Gravity</strong> <strong>Probe</strong> B — <strong>Post</strong> <strong>Flight</strong> Analysis • Final <strong>Report</strong> March 2007 167
168 March 2007 Chapter 6 — The <strong>GP</strong>-B Management Experiment
7Attitude & Translation Control SubsystemAnalysis<strong>Gravity</strong> <strong>Probe</strong> B — <strong>Post</strong> <strong>Flight</strong> Analysis • Final <strong>Report</strong> March 2007 169
170 March 2007 Chapter 7 — Attitude & Translation Control Subsystem Analysis
7.1 ATC Background and OverviewThe Attitude and Translation Control System (ATC) controls all proportional micro thrusters and magnetictorque rods that determine and maintain the spacecraft’s precise position relative to the science gyro serving asthe drag-free proof mass and the spacecraft’s pointing direction. The position, acceleration, attitude androtation rates of the space vehicle are measured by several redundant sensors. These sensors include both thecontrol and science gyroscopes, star sensors, magnetometers, coarse sun sensors, <strong>GP</strong>S receivers, and the sciencetelescope. The choice of which set of sensors are used at a given time depends on the configuration of the ATCsubsystem. Feedback control logic takes the measured position, acceleration, attitude and rotation rates andcomputes commands sent to the thrusters and magnetic torque rods in order to maintain the space vehicle inthe desired position and attitude.The requirements for the Attitude and Translation Control subsystem are twofold. First, the position of thespace vehicle must be accurately centered about one of the Science Gyroscopes so that the forces (controlefforts) and torques applied to the science gyroscopes are rigorously minimized during the Science Mission.Second, the <strong>GP</strong>-B space vehicle must remain accurately pointed at the Guide Star IM Pegasi, during gyroscopespin up and throughout the Science Mission phase to provide the distant inertial reference and to minimizetorques due to mis-pointing.7.1.1 ATC HardwareThe ATC subsystem consists of a network of sensors, actuators, and computer/data management hardware andsoftware, with the purpose of maintaining the spacecraft’s pointing and position within the orbit to very stricttolerances. Of all the metrics to measure the ATC’s performance, the ability to maintain pitch/yaw attitude onthe guide star, the ability to maintain the spacecraft’s position in roll phase and roll rate, and helium gas massflow usage are of primary importance. In the table below is a list of the control system equipment used on orbit.Table 7-1. Control System Equipment List<strong>Gravity</strong> <strong>Probe</strong> B — <strong>Post</strong> <strong>Flight</strong> Analysis • Final <strong>Report</strong> March 2007 171
7.1.2 Vehicle ATC ModesThere are essentially 6 vehicle ATC modes (1A, 1B, 1C, 2A, 2B, 3A). Mode 1B is the science mode, withpitch/yaw attitude reference (“pointing”) supplied by the guide star and the TRE/Science Telescope package.Mode 2A is a telescope acquisition mode with pitch/yaw attitude reference updates supplied by reference startrackers. Mode 2A is also used when the telescope is unavailable such as during gyro spin-up and flux flush.7.1.2.1 ATC Mode 1B• Actuators – Thrusters (plus MTS optional)• Pitch/Yaw “pointing” attitude – Science Telescope• Pitch/Yaw rate – Control Gyros• Roll Attitude – Star Trackers updates Control Gyros• Roll Rate – Control Gyros7.1.2.2 ATC Mode 2A• Actuators – Thrusters• Pitch/Yaw “pointing” attitude – Star Trackers update Control Gyros• Pitch/Yaw rate – Control Gyros• Roll Attitude – Star Trackers updates Control Gyros• Roll Rate – Control Gyros7.1.3 GS Valid/InvalidDuring the science mission when the Guide Star is obscured by the Earth or other bodies (Guide Star Invalid,see Figure 7-1 below), ATC Mode 1B automatically reconfigures to Gyro Hold. In this mode, the vehiclepointing is held fixed by integrating the control gyros. Until such time that the obstruction to the Guide Star isgone, slight drift of the control gyros takes place. When line of sight to the Guide Star returns as predicted by theonboard ephemeris, the attitude reference is turned back on, and the ATC recaptures the Guide Star by usingpolarity information from the telescope.172 March 2007 Chapter 7 — Attitude & Translation Control Subsystem Analysis
Figure 7-1. Schematic of Guide Star Valid (GSV) and Guide Star Invalid (GSI) periods7.1.4 Guide Star VerificationGuide Star verification was performed by visiting two neighbor stars during IOC. On 2004/162, Neighbor Star 1(HD 216635) was acquired and held in the FOV for approximately 15 hours. On 2004/167, Neighbor Star 1 wasacquired again and held for approximately. 3 hours. On 2004/169, HR Pegasi was acquired and held in the FOVfor approximately. 1 hour. Additionally, the Science Team was able to confirm the identity of these neighborstars through inertial location in space, and by star brightness.7.2 He Thruster TechnologyTranslation and attitude control of <strong>Gravity</strong> <strong>Probe</strong>-B is achieved primarily through the use of sixteen thrusters.The thrusters use helium boil-off from <strong>GP</strong>-B’s dewar for propellant. Since the rate of boil-off in the dewar is onthe order of milligrams per second, each thruster is capable of imparting a very small amount of force on thespace vehicle (the requirement for maximum thrust is 8 mN per thruster using 6.9x10⁻⁶ kg/s or less of helium).The purpose of this section is to show the level of minuteness that the amount of thrust produced by thesethrusters can be controlled to. A quantitative measure for this is derived from on-orbit telemetry and groundtesting. Furthermore, several analogies are made between this numerical figure and figures commonlyencountered in everyday life in order to provide the reader with a qualitative feel for this parameter.The amount of thrust produced by each thruster can be linearly regulated. Ground testing has revealed adirectly proportional relationship between thrust and pressure in the restrictor of the thruster.Pressure in the restrictor is controlled by movement of the piston and measured by an Endevco Model 8510B-1sensor. The sensor is a piezoresistive type transducer with a range from 0 psig to 1 psig (or equivalently, 0 torr to51.706 torr).<strong>Gravity</strong> <strong>Probe</strong> B — <strong>Post</strong> <strong>Flight</strong> Analysis • Final <strong>Report</strong> March 2007 173
The output of the pressure transducer as read by the onboard computer and sent to the ground throughtelemetry is in mV. The conversion from mV to psig (or torr) varies from transducer to transducer, but isguaranteed by the manufacturer to fall in the range of 200±50 mV/psig. Thus, each mV measured by the sensorcorresponds to roughly 0.20684 torr to 0.34473 torr.Figure 7-2 is a plot of twelve hours of restrictor pressure data recorded on-orbit in Thruster 5.A prominent feature of this plot is a lower bound on the pressure (at roughly 1.4 mV), which is sustained fornearly the full duration of the time period examined (Note: this behavior can also be observed in Thruster 7).There are occasional dips below this bound due to noise and perhaps transient conditions, but the overallinference to be made is that the thrusters can consistently control the restrictor pressure to a reading of 1.4 mV.Figure 7-2. 12 hours of thruster pressure data from 2004 day 184Since people in general do not think in terms of mN it is helpful to draw several analogies to put the figure of 1mN of thrust into perspective. For instance, a 1 lb weight produces a force equivalent to 4,442.8 mN and theaverage American male in his twenties weighs 168 lbs. or roughly 745,000 mN. Furthermore, a male bodybuilder capable of bench-pressing 500 lbs. could be shrunk to 1/2,200,00 th of his normal size and still be able tobench press a 1 mN weight. Also, if everyone at a sold out game in 3 Com Park (which has a maximum capacityof 64,450) held a 1 mN thruster underneath a 15 lb bowling ball, they would still need an extra 2,300 thrusters tolift it off the ground.In summary, ground testing and flight data indicate that the helium thrusters on <strong>Gravity</strong> <strong>Probe</strong>-B can belinearly controlled down to roughly 1 mN of thrust. This is a number that is so incredibly small, that it takescreative use of analogies for one to truly appreciate it and its role in the demanding task of testing Einstein.174 March 2007 Chapter 7 — Attitude & Translation Control Subsystem Analysis
7.3 ATC PerformanceData gathered from the <strong>GP</strong>-B space vehicle throughout the mission shows that the ATC system is performedwell. The back up drag-free control mode, which minimizes gyro control effort, is used as the translation controlmode throughout the Science Mission phase. Drag-free operations have proven to reduce control forces appliedto the gyroscopes by a factor of 10 and generates a cross track control force on the order of a mere nanonewtonat the roll rate frequency. Also, the attitude control system has proven to maintain the pointing of the <strong>GP</strong>-BScience Telescope to within a few hundred milliarcseconds of the Guide Star IM Pegasi. More importantly, theScience Telescope signal is kept in the linear range roughly 95% of the time while the Guide Star is not eclipsedby the Earth. Finally, the roll rate component of the attitude error signal has generally been at or below 10milliarcseconds rms while the notch filter on the rate path error is enabled.7.3.1 Pitch/Yaw PointingAt the start of the science phase of the <strong>Gravity</strong> <strong>Probe</strong> B mission, the Science Telescope and gyroscope spin axesare aligned with the Guide Star IM Pegasi. Over the course of the Science Mission, the <strong>GP</strong>-B Science Telescoperemains precisely pointed at the Guide Star.If the predictions based on Eintsein’s theory are correct, the gyroscopes’ spin axes should slowly drift away fromtheir initial Guide Star alignment, in both the space vehicle’s orbital plane, due to the curvature of localspacetime, and perpendicular to the orbital plane, due to the frame-dragging effect. These relativistic effects inthe vicinity of a small planet like the Earth are barely noticeable. For example, the spin axis deflection due to theframe-dragging effect corresponds to the width of a human hair as seen from 100 mile away. In order to detectsuch minute deflections in the gyroscopes’ spin axes, the <strong>GP</strong>-B Science Telescope must remain pointed at theGuide Star with equivalent accuracy.The Guide Star pointing error is computed using the Science Telescope signals. The telescope measures theGuide Star position in the x and y orthogonal directions independently. The <strong>GP</strong>-B Science Telescope focuses thestarlight in the “lightbox” at the telescope’s front end. Figure 7-3 is a general schematic of the Science Telescopecomponents. Light from the Guide Star enters the telescope and is separated into two signals with a beamsplitter. One signal is used to measure the Guide Star position in the x direction, and the other is used tomeasure the Guide Star position in the y direction. In each direction, the Guide Star’s image is sliced into twohalf disks which are directed to hit opposite ends of a tiny sensor. The sensors convert each half signal intovoltages S + and an S – corresponding to each half disk image. The difference between these two signals is then ameasurement of how well the Guide Star image is centered on the roof prism, and hence provides the ATCsystem with attitude (pointing) error during Guide Star Valid periods. A Guide Star Valid period refers to theperiod of time when the view from the <strong>GP</strong>-B space vehicle to the Guide Star IM Pegasi is not blocked by theEarth.<strong>Gravity</strong> <strong>Probe</strong> B — <strong>Post</strong> <strong>Flight</strong> Analysis • Final <strong>Report</strong> March 2007 175
Figure 7-3. Science Telescope Components SchematicThe S + and S – telescope signals are differenced and normalized as follows.S NS=S++Here, w is a weighting coefficient that accounts for differences between the S + and S – telescope detector biases.The resulting quantity S N is the normalized telescope signal. S N varies from +1 to –1 where a zero valueindicates zero pointing error. In general, S N is a nonlinear function of pointing error. However, for small valuesof S N , the relation is nearly linear. Figure 7-4 shows qualitatively the relation between S N and pointing error.The onboard software also allows a constant to be used to minimize noise in the denominator, representing thedetector sum signal. A constant is used based on the measured data from the detectors, rather than calculatingthe denominator for each measurement. Since the denominator is essentially the total light entering on one axis,the value used onboard is the mean value of the total signal on each axis.−+wSwS−−176 March 2007 Chapter 7 — Attitude & Translation Control Subsystem Analysis
Figure 7-4. Normalized Telescope Signal vs Pointing Error7.3.1.1 Pointing Accuracy Requirements for Science Data AnalysisIn order to determine the direction of the spin axes of the Science Gyroscopes relative to distant space, theorientation of the <strong>GP</strong>-B space vehicle must be known accurately. The normalized telescope signal is used toprecisely determine the pointing error of the vehicle. The pointing error is subtracted from the gyroscope spinaxis direction, measured in the vehicle frame, to provide the spin axis orientation relative to the Guide Star.Therefore, the vehicle pointing error must be known at the same level of accuracy as the gyroscope spin axes.This can be accomplished when the normalized pointing signal is in the linear range.Also, the pointing error at the roll rate frequency must remain especially small. As we have already seen, anycross track control forces applied to the Science Gyroscopes at the roll rate frequency and cause the gyroscopesto precess or drift. Therefore, we require that the pointing error of the vehicle be especially small at the roll ratefrequency so that unwanted gyro suspension forces are not amplified.The attitude (pointing) control system requirements for science data analysis can be summarized as follows:• Vehicle pointing error must remain small enough so that the normalized telescope signal S N remains inthe linear range.• Pointing error at the roll rate frequency must be especially small so that gyroscope control forces at theroll rate frequency do not generate significant torques.7.3.1.2 Overall RMSFigure 7-5 below shows the individual pitch and yaw errors over the science mission. The data points arecalculated over each individual guide star valid period by taking the rms value of the attitude error, omitting theinitial data points (~2 minutes) corresponding to the time required to capture, and damp out accumulated gyrohold drift errors. The individual pitch and yaw pointing error standard deviations have ranged between 100-300milliarcseconds on the X-Axis and between 150-325 milliarcseconds on the Y-Axis. The corresponding estimateof the telescope noise during this time period using a method outlined by J. Turneaure, is approximately 150marcs per axis.<strong>Gravity</strong> <strong>Probe</strong> B — <strong>Post</strong> <strong>Flight</strong> Analysis • Final <strong>Report</strong> March 2007 177
Figure 7-5. Pitch and Yaw Pointing Performance during the science missionThere are several events throughout the mission where there is a discontinuity in the more slowly trending data.Most of these outlying points occur during safemodes, where the vehicle switches from mode 1B to mode 2A or3A in order to ensure a safe recovery from an unexpected error in memory.The slower trends in these plots are believed to be mostly due to the orbital geometry of the sun. They aresomewhat dependent on the gamma angle, the angle the sun vector makes with the boresight of the telescope.Evidence of this can be seen in the mirrored comparison of the pointing at corresponding gamma angles on thetwo sides of the telescope. Figure 7-6 below shows a comparison between corresponding gamma angles oneither side of the telescope. On March 12, the sun was directly in the orbital plane. After March 12, the pointingessentially retraces its behavior over the first half of the science mission as the sun moves away from thetelescope boresight.178 March 2007 Chapter 7 — Attitude & Translation Control Subsystem Analysis
Figure 7-6. X-Axis RMS pointing performance correlation with solar angleWhile it is difficult to exactly quantify the ATC pitch/yaw pointing performance and its relationship to T003requirements, the performance does meet the needs of the Science Team and is sufficient for the sciencemission.7.3.1.3 Roll component RMSAs the mission has progressed throughout the science part of the mission, the orbital geometry has yielded alarge disturbance at roll rate due to the roll rate thermal cycle of the ARP. Since the disturbance comes inthrough the rate gyroscopes and is precisely at the roll frequency, a notch filter on the rate error signal has beenvery effective at removing the roll rate disturbance from the attitude error. It appears that most of the error atroll rate is transferred to twice roll and higher harmonics. While the overall RMS value of the pointing errorincreases slightly with the notch filter on, it is the roll component that most heavily affects the science data. Theroll component of the pointing error is shown in the following chart, Figure 7-7.<strong>Gravity</strong> <strong>Probe</strong> B — <strong>Post</strong> <strong>Flight</strong> Analysis • Final <strong>Report</strong> March 2007 179
Figure 7-7. Magnitude of the roll rate component of pitch yaw pointing performanceFigure 7-8, again shows the correlation between pointing performance and the angle between the telescope axisand the sun vector. The notch filter was implemented in December 2004, and the roll component of thepointing error was only slightly affected by the sun’s position following that date.180 March 2007 Chapter 7 — Attitude & Translation Control Subsystem Analysis
Figure 7-8. Correlation of pointing roll rate component with telescope/sun angle7.3.1.4 SAA BehaviorThe configuration of the ATC has been slightly adjusted to allow for continued pointing toward the Guide Starduring periods of South Atlantic Anomaly (SAA). This was done at the request of the Science Team, and whileexcessive noise to the telescope detectors is noticed during these periods, much of the noise is filtered out byATC filters and limits. The remaining noise which does slightly effect high-precision pointing during SAA isfound to be a manageable risk as compared to the large benefit of greater mission duration in GSV (anadditional 70 minutes, approximately., per day of GSV). Further improvement of the pointing accuracy throughthe SAA has been achieved by setting the TRE gains and clamp settings to avert the effects of a compilation errorin the exception handling of the ATC slopes. This is discussed in more detail in a section below.7.3.1.5 Guide Star Capture TimesFigure 7-9 and Figure 7-10 below show yaw errors immediately at the beginning of a GSV period, taken fromtwo different dates (07 July 2004 and 27 Aug. 2004, respectively). First, one may note that the overall “capture”duration, the time required to damp out gyro hold errors accumulated during the previous GSI period, has beensubstantially reduced from approximately 13 minutes (07 July 2004) to about 3 minutes. This has beenaccomplished through the judicious selection of ATC controller gains and limits, and by removing the 7th orderpolynomial fit for ATC slope in favor of a truncated linear fit. The immediate benefit of this reduced captureduration (10 minutes shorter, approximately) is an additional 10 minutes of science data during a typical 55minute GSV period. This represents nearly a 20% gain in usable science data per GSV period.In addition to the gain and limit changes that have been made, we have also expanded the definition of thelinear range of the telescope to more heavily weight the proportional term even outside the linear range. Part ofthe reason the guide star captures were so long, was the rate capture mode was actually driving the telescopeaway from the guide star before the integrator caught up to the error in the rate gyros due to the motion of theARP.<strong>Gravity</strong> <strong>Probe</strong> B — <strong>Post</strong> <strong>Flight</strong> Analysis • Final <strong>Report</strong> March 2007 181
Changing the method by which the gyro biases are determined has yielded further improvement. Early in themission, the ATC system estimated the gyroscope biases onboard by averaging the signal measured whilepointed at the guide star. This is a robust, self-calibrating method that served its purpose well during the highlydynamic period of IOC, but is not the most effective way to capture the guide star. Setting the gyro biasesmanually so they are optimal at the beginning of the guide star valid period has decreased the transient attitudebehavior at the guide star valid transition and further shortened guide star captures.Figure 7-9. Guide star capture performance before capture method update182 March 2007 Chapter 7 — Attitude & Translation Control Subsystem Analysis
Figure 7-10. Guide star capture performance after capture method update7.3.2 Roll Phase Error RMSFigure 7-11 shows the Z-axis, or roll phase error (RF_AttErr_Z) estimate for a nominal period of 4 orbits (6.5hours). The computed RMS roll phase error is 30 arcs. Note that the prelaunch estimated science roll rate wasintended to be 0.3 RPM, and that final science roll rate is 0.7742 RPM. Furthermore, as roll rate increases,misalignments and gyro biases are greatly magnified. Throughout the science mission, the vehicle roll rate hasremained 0.7742 RPM.<strong>Gravity</strong> <strong>Probe</strong> B — <strong>Post</strong> <strong>Flight</strong> Analysis • Final <strong>Report</strong> March 2007 183
7.3.3 Drag-Free Control SystemFigure 7-11. Roll Phase Error over 4 orbitsControl forces applied to the science gyroscopes can generate unwanted torques on the gyros. The geometriccenter (C.G.) of the gyroscopes is slightly different (~10 nanometers.) than the center of mass (C.M.) of thegyros. As a result, control forces acting perpendicular (cross track) to the spin axis can generate unwantedtorques on the gyroscopes. These torques can cause the gyroscope spin axes to precess or drift, which couldcorrupt the relativistic signal. Figure 7-12, depicts the geometry of the gyroscope and control forces that couldgenerate torques.184 March 2007 Chapter 7 — Attitude & Translation Control Subsystem Analysis
Figure 7-12. Drag-Free system diagramSince the <strong>GP</strong>-B vehicle is rolling at 0.77 rpm, cross track control forces at the roll rate frequency (0.0128 Hz) arethe dominant long-term gyro drift contributor. Cross track forces at frequencies other than the roll ratefrequency will average out due to the vehicle roll and will not cause gyroscope drift. Cross track control forces atthe roll rate frequency must be small enough so that resulting torques do not cause significant gyroscopeprecession or drift.During the Science Mission phase of the <strong>Gravity</strong> <strong>Probe</strong> B mission, one of the four Science Gyroscopes inside thespace vehicle acts as a drag-free sensor. In primary drag-free, this gyroscope is following a near perfectgravitational free-fall orbit around the Earth, and is spinning inside its housing a mere millimeter from the edge.<strong>GP</strong>-B uses sensors inside the housing and proportional micro thrusters to keep the space vehicle perfectlyoriented around the spinning gyroscope therefore, following the drag-free sensor around the Earth in a nearperfectorbit.For the most part, the space vehicle stays on course by following the same free-fall orbit. However, outside thespace vehicle, two factors can alter its path: solar radiation pressure streaming from the Sun and atmosphericdrag.<strong>GP</strong>-B uses extremely sensitive proportional micro thrusters to reorient itself and keep it on its proper path. Thethrusters utilize escaping helium gas that slowly boils off from the liquid helium inside the dewar as propellant.This minute amount of gas, roughly equivalent to 1/10 th of a human breath or a few millinewtons of force,provides just the right amount of thrust necessary to adjust the space vehicle’s position.The <strong>Gravity</strong> <strong>Probe</strong> B drag-free control system has two control configurations. The first is primary drag-freecontrol which senses the science gyro’s relative position inside its housing, and the second is back up drag-freecontrol which measures the control forces, known as “control efforts” applied by the GSS.Since the back up drag-free control configuration attempts to minimize the gyroscope control efforts and notthe measured position of the gyroscope, drag-free performance must be based on the size of the forces appliedto the proof mass gyroscope instead of the proof mass’ position relative to its housing. Furthermore, controlforce levels are an especially relevant performance metric because the primary purpose of the <strong>GP</strong>-B drag-freecontrol system is to minimize gyro suspension forces that cause gyro torques.There has been one major change to the control algorithm used in the drag-free system. Since the controller iscoordinated in the nadir frame, the body-fixed roll components are shifted to lower frequency. By increasing thegain at orbit, improved performance has been observed.<strong>Gravity</strong> <strong>Probe</strong> B — <strong>Post</strong> <strong>Flight</strong> Analysis • Final <strong>Report</strong> March 2007 185
7.3.3.1 DFS – PerformanceThe <strong>GP</strong>-B drag-free control system has for most of the mission performed nominally. Drag-free control reliablyactivates and deactivates on command and has operated essentially without fail. Drag-free control has beenshown to reduce control forces by a factor of 10 or more. The rms control efforts applied to the proof massgyroscope are on the order of 10 nanonewtons, and the cross track control force at the roll rate frequency, whichcan generate gyro torques, is roughly 1 nanonewton. Figure 7-13 shows the control effort time history beforeand during a six hour drag-free run on August 15, 2004, with gyroscope 3 acting as the drag-free sensor.Gyroscope 3 and 1 were used as the drag-free sensor gyroscopes throughout the Science Mission phase. Thecontrol efforts are clearly reduced once drag-free control is activated.Figure 7-13. Drag-Free performanceBecause the performance of the back up drag-free control system has typically been superior to that of the primedrag-free control system at low gyro spin rates, the back up drag-free configuration was selected for use duringthe Science Mission phase.Since the science mission has started, the spacecraft was configured in backup drag-free on gyro 3 for most ofthe time. There is one stretch of time where the spacecraft used gyro 1 instead of gyro 3, due to an unexpecteddrop out of drag-free on gyro 3. There have also been several instances where the vehicle dropped out of dragfreeentirely to enter a safe mode, but the cause has been something external most of the time. Furthermore,most of these periods have lasted for only a matter of hours, short enough that negligible effects on the scienceresults are expected.7.3.4 Pressure Controller/Mass FlowThe helium mass flow rate from the dewar is set with the primary function of maintaining the dewar at aconstant temperature and pressure. That is, the flow rate is set to match the seasonal heat input to the dewar.The ATC uses mass flow as required to maintain attitude and a drag-free orbit. Short periods may exceed theaverage heat input do not appreciably change the tank temperature. Any excess mass flow output by the dewar,but not required for ATC control, is null dumped by adding equal flow to thruster pairs, thrusters aligned inopposite directions. Should the ATC require more flow than output by the dewar, the ATC may demand a briefadditional amount of gas flow beyond the dewar setpoint. This is termed “negative excess mass flow”.In Figure 7-14, mass flow data is shown starting on 2005/239. At this time, the commanded dewar flow rate is7.0 mg/s (although the dewar temperature controller can adjust this amount as needed by 10- 20%). In thefigure, the flow rate data spanning from 0-2 days, represents two days of testing drag-free on science gyro #3, ina 2-axis control mode (the Z-axis is not under drag-free control). During this time, the average ATC mass flowis approximately 3.0 mg/s, with the remaining 4.0 mg/s null dumped to space. The flow rate data spanning from186 March 2007 Chapter 7 — Attitude & Translation Control Subsystem Analysis
2-3.5 days represents the final Science Mission configuration of drag-free on science gyro #3, in a 3-axis controlmode (Z-axis is under drag-free control). Note occasional peaks exist where the ATC mass flow exceeds thebudget of 6.9 mg/s, and even the dewar set point of 7.0 mg/s. However, these durations of negative excess massflow are brief in duration, and on average do not contribute to an overall cooling of the dewar. Additionally,adjustments to a Z-axis force bias between the ATC and the GSS, have allowed for further reductions in netmass flow usage by the ATC. After 2004/251 the bias had been adjusted such that the ATC no longer dips intonegative excess mass flow usage, and the overall ATC mass flow usage was calibrated to be sufficient for theScience Mission.Figure 7-14. ATC Mass Flow Usage in drag-free ModeFigure 7-15 shows the effect of both a heat pulse meter test as well as augmenting the thrusters with themagnetic torque rods for torque control. Throughout the mission, the heat pulse meter tests were used tomeasure the amount of helium left in the dewar. The torque rods were used during the science mission to givethe vehicle more excess mass flow margin.<strong>Gravity</strong> <strong>Probe</strong> B — <strong>Post</strong> <strong>Flight</strong> Analysis • Final <strong>Report</strong> March 2007 187
Figure 7-15. Mass flow effects of a Heat Pulse Meter Test and the Magnetic Torquing System7.3.5 Calibration PhaseAfter the science phase of the mission ended, there was a period of data collection called the calibration phase ofthe mission. Several ATC operations were done during the calibration phase. The most intense operation wasmaneuvering the spacecraft to point at neighbor stars, other visible stars varying from 0.4 degrees away from IMPegasi to 7 degrees away. Over the course of a few weeks, three different stars were visited multiple times.Each maneuver consisted of a vehicle reconfiguration, a vehicle reorientation, and another vehiclereconfiguration that includes finding the new telescope target star. During the maneuver and neighbor starlocation, the star tracker was used for attitude reference. The planned neighbor star location procedure was tomaneuver to the expected location of the star, then dwell around in a spiral if the star was not seen in thetelescope field of view. However, during every neighbor star visit, the star was found and locked onto using onlythe predicted position. Thus, no costly time was used dwelling for the stars, and a more aggressive calibrationschedule was achieved.The other ATC calibration phase operations consisted of drag-free system testing. Drag-free biases were putinto the drag-free system in order to measure the torque effects on the gyroscope pointing.188 March 2007 Chapter 7 — Attitude & Translation Control Subsystem Analysis
7.4 Conclusions and Performance SummaryThe Attitude and Translation Control system of the <strong>Gravity</strong> <strong>Probe</strong> B space vehicle has performed well over theScience Mission phase. The drag-free control system operating in back up drag-free control mode has proven tomaintain control forces applied to the gyroscopes within acceptable limits for the Science Mission. Drag-freecontrol has been shown to reduce rms control forces by at least a factor of 10. During drag-free, the rms controlefforts applied to the proof mass gyroscope are on the order of 10 nanonewtons.The attitude control system has kept the pointing accuracy during Guide Star Valid periods within the limitsrequired for the Science Mission. The rms normalized telescope signal is consistently around 0.1, or at 10% ofthe total range of S N , and the telescope signal at the roll rate frequency is consistently around 0.01, or a mere 1%of the total range of S N . The attitude control system has proven to keep the normalized telescope signal withinthe linear range 95% of the time allowing for accurate pointing determination.7.5 <strong>Flight</strong> Challenges/Solutions and AdditionalAccomplishmentsThe following sub-sections of this chapter detail eight major accomplishments of the <strong>GP</strong>-B ATC system.7.5.1 Quick vehicle stabilization off Delta II w/ failed thrusterThe vehicle rotation rates were damped out quickly even with a failed thruster, shortly after separation from theDelta II. Figure 7-16 below is a plot of the vehicle pitch and yaw rates (RF_SensRate_X and RF_SensRate_Yrespectively).Figure 7-16. Vehicle rotation rate damping after separation from the Delta II<strong>Gravity</strong> <strong>Probe</strong> B — <strong>Post</strong> <strong>Flight</strong> Analysis • Final <strong>Report</strong> March 2007 189
7.5.2 Successful recovery from multiple CCCA rebootsFor several different reasons, the CCCA, the main processor for the satellite, has rebooted several times. Eachtime a reboot occurs, the vehicle attitude and translation control is off for a short time. Furthermore, all controlsoftware and parameter updates since the latest software installation on July 1, 2004 are cleared from thememory. All of the improvements and fixes are lost and must be reloaded. Through a series of automated loadcommands and manual commands, the vehicle is brought back to a nominal state over a period ranging fromone day to one week.A system of safemode operations has been developed that has left the vehicle in a predictable and recoverablestate for each reboot. The recovery time for a reboot has been reduced from approximately one week to less thanone day. More importantly, the vehicle is typically returned to drag-free operations and pointed to withinarcseconds of the guide star in a matter of hours. A quick recovery time is necessary not only to ensure the safetyof the spacecraft, but also the integrity of the science data.7.5.3 Supporting higher science roll rateOriginally, the <strong>GP</strong>B spacecraft was optimized for a nominal roll rate of 0.3 rpm. After a request by the scienceteam for a higher roll rate, the team determined that the vehicle could perform sufficiently at a higher roll rate.The team then developed an ATC configuration that supports a roll rate of 0.77 rpm, more than twice as fast asthe baselined roll rate prior to launch. However, the system has performed well and has shown no significantdeficiency due to the higher roll rate.7.5.4 Successful large-scale ditherFigure 7-17 below shows a plot of the large-scale dither operation from the IOC phase of the mission.190 March 2007 Chapter 7 — Attitude & Translation Control Subsystem Analysis
7.5.5 ARP Motion ChallengesFigure 7-17. Large Scale Dither Performance (2004/197)The Attitude Reference Platforms (ARPs) are the mounting location of the control rate gyroscopes, as well asthe roll star trackers. At one time, one set of gyroscopes and one star tracker are used in the control loop thatmaintains the attitude of the vehicle. While thermal effects were expected, the motion of the ARP and rategyroscope housing have introduced disturbances into the rate signal that have presented challenges throughoutmost of the mission. The ARP moves with components of motion at annual, orbit, and roll rates, and all three ofthese components have provided unique challenges to overcome to arrive at the pointing performance thevehicle now achieves.7.5.5.1 Mode 1A vs 1BOne of the most significant operational decisions resulting from ARP motion analysis is that Mode 1B (directmode) was chosen as the science configuration, instead of Mode 1A (observer mode) while pointing at the guidestar. The dependence on the gyroscope signal of the observer would lead to the telescope tracking the ARPmotion rather than keeping the guide star centered in the field of view.As the vehicle rolls around the telescope boresight (the z axis in the body frame), the ARP is heated and cooledin an almost sinusoidal fashion at precisely roll rate. As the ARP deforms, the orientation of the gyroscopehousing changes with respect to the z axis, causing the roll rate of the vehicle to project onto the pitch and yawaxes. This effect shows up in the gyroscope output and yields a fictitious sinusoidal rate signal in both the pitchand yaw axes.<strong>Gravity</strong> <strong>Probe</strong> B — <strong>Post</strong> <strong>Flight</strong> Analysis • Final <strong>Report</strong> March 2007 191
If the vehicle control system were in the observer mode (1A), the sinusoidal signal in the rate gyroscopes woulddominate the observer, and the vehicle would point in a sinusoidal pattern, rather than staying centered on theguide star. Pointing error in this setup would be much larger than the error resulting from the telescope noisethat enters the system in the direct pointing mode (1B).As a result, mode 1B has been used where no estimation is done on the proportional control term. The attitudeerror is sent straight from the telescope data to the controller with no signal processing other than a straightgain. Although this leaves the vehicle susceptible to the noise in the telescope signal, the overall pointingdisturbance is smaller. More importantly, the random telescope noise causes a disturbance much closer to whitenoise, rather than error at roll rate, the frequency that is most detrimental to science data.7.5.5.2 GS captures (rate capture mode)The method of capturing the guide star called the rate capture mode has also been more challenging thanoriginally thought due to the ARP motion. The rate capture mode, intended for guide star capture when the staris outside of the linear range of the telescope, is essentially a commanded rate in the direction of the guide star.In this case, the controller is commanded a constant rate in the correct direction, based on the telescope output.Once the star returns to the linear range of the telescope, the controller returns to PID control.A problem arises, however, when the gyroscope housing is misaligned with the telescope boresight, due to ARPmotion. There were cases where the ARP had moved so that when the gyros measured the commanded rate, thevehicle was actually moving in the wrong direction. This led to guide star captures in the worst case of over 20minutes.The solution to this problem has been to essentially stop using the rate capture mode. The implementation inplace is an expanded definition of the linear range of the telescope. It has been more successful to use theproportional term and modify the integral and rate path limits, even when the star is outside of the actual linearrange of the telescope.7.5.5.3 Roll rate disturbance/rate notch filterThe roll rate signal that enters through the gyroscopes causes another problem for the science data. The sameroll rate ARP motion that led to using mode 1B, still causes a problems in this mode, since the gyroscope signalstill enters the control law through the derivative term in the controller. Because the motion of the ARP is at rollrate, there is an artificial signal in the gyroscope output causing erroneous torque commands at roll frequency.This output is seen clearly in the spectral analysis of the attitude error and rate path error.The solution to this problem is to attack the roll rate signal in the gyroscope data directly. There is a filter on therate error path, between the gyroscopes and the control command generator. A notch filter at the roll rate hasbeen implemented to attenuate the signal at roll by 10X, basically throwing out as much of the false signal as isdeemed safe. Although the signal cannot be eliminated completely, this has been a very successful way ofreducing the roll rate output of the vehicle pointing.7.5.5.4 Gyro hold offsetThe orbit rate motion of the ARP has also provided challenges to the ATC system in the form of a large transienterror while the guide star is captured at the beginning of every guide star valid period. At the end of every guidestar valid period, the vehicle goes into gyro hold mode, where the telescope attitude error-nulling controller isoff. The vehicle controls its attitude using gyroscope data for rate and attitude.192 March 2007 Chapter 7 — Attitude & Translation Control Subsystem Analysis
Figure 7-18. GSV/GSI rate gyroscope bias offsetWhile the guide star is out of the field of view and the vehicle is nulling its rates using only gyroscope signals, thecontroller tries to null out the pitch and yaw rates. However, as the ARP moves at orbit rate, the projection ofthe roll rate onto the pitch and yaw axes changes over the orbit. If the orientation of the ARP at the end of oneguide star valid period does not match that of the beginning of the next, the vehicle effectively changes roll axesin order to keep the gyroscope signals nulled out. Thus, at the beginning of the next guide star valid period, thetelescope will not be pointed in the same direction, and it is this initial error that must be damped out to centerthe guide star in the telescope.The alignment of the ARP with the telescope axis can be corrected for by setting hardware bias settings. It hasbecome regular maintenance on the vehicle, often multiple times per week, to set the biases so that the ARP islined up correctly at the beginning of guide star valid. Bias errors on the order of one arcsec/sec can cause anincrease in the guide star capture time by as much as 100-500%.7.5.5.5 Effects of Dewar Shell Temperature Variation on ARP motionOne of the challenges of dewar design is to provide adequate mechanical support for the cryogenic region whilemaintaining low thermal conductance between the exterior and the interior. In the case of the <strong>GP</strong>-B dewar, thisis accomplished by means of twelve low-thermal-conductivity composite strut tubes (PODS), six forward, andsix aft. (See Figure 7-19 and Figure 7-20 for a depiction of the support system.) In the case of <strong>GP</strong>-B, there is anadditional complicating factor: In order to acquire accurate roll phase and pointing information for the ATCsystem and science, there are two external Attitude Reference Platforms (ARPs) located on opposite sides of thedewar shell, near the Y axis, which provide mounting surfaces for control gyros and star trackers. These ARPsshould maintain a stable angular relationship to the science instrument deep inside the dewar. In order to<strong>Gravity</strong> <strong>Probe</strong> B — <strong>Post</strong> <strong>Flight</strong> Analysis • Final <strong>Report</strong> March 2007 193
accomplish this, the ARPs are mounted on posts that, in turn, are mounted on a pair of very stiff graphite-epoxyrings that provide the warm termination points for the forward PODS. The graphite rings are mounted justinside the dewar vacuum shell at the top of the vacuum shell cylinder by means of nine titanium flexures (SeeFigure 7-20 below). Nominally, the flexures provide radial compliance to provide isolation from thermallyinduced expansion and contraction of the dewar vacuum shell, but are stiff in other directions. The graphiteepoxyrings, for their part, have a high modulus and are designed to have a coefficient of thermal expansion thatis near zero relative to that of aluminum. The aft end of the vacuum shell cylinder is bolted in turn to the dewarsupport ring, which provides the attach points for the spacecraft truss on the outside and termination points forthe aft PODS on the inside. The ARP posts pass through openings in the vacuum shell cylinder and are sealed tothe vacuum shell by flexible bellows.The foregoing arrangement is intended to meet the requirement that the drift of the boresight of the star sensorin the roll direction relative to the science instrument be less than 10 arcseconds per year and not be correlatedwith any periodic behavior of the satellite. Evidence from the ATC system (section 8.1.1) indicates, however,that significant relative motion does occur at roll, orbit, and annual rates. This motion is correlated with thetemperature of the dewar vacuum shell in a complex way: the short-term correlation (orbital period) has theopposite sign of the long-term correlation (seasonal time scale). Although other mechanisms may exist, itappears that the most likely explanation is that thermally-induced expansion and contraction of the dewarvacuum shell cylinder is being coupled to the graphite rings via the flexures and causing them to distort. Thedetails of the mechanism and, in particular, the mechanism underlying the time-scale-dependent nature of thecorrelation are currently not well understood.Figure 7-19. Side view of partially assembled dewar showing primary structural elementsexcept for forward PODS.194 March 2007 Chapter 7 — Attitude & Translation Control Subsystem Analysis
Figure 7-20. Cutaway top view of dewar showing forward PODS and ARP post locations and details of theARP post and flexure. (Representation of the ARP is schematic and not accurate.)7.5.6 Proton ActivityThe <strong>GP</strong>-B ATC system had to deal routinely with increased proton activity in the South Atlantic Anomalyregion, where protection by Earth’s magnetic field is weakest, and also from increased proton radiation due toseveral strong solar flares.<strong>Gravity</strong> <strong>Probe</strong> B — <strong>Post</strong> <strong>Flight</strong> Analysis • Final <strong>Report</strong> March 2007 195
7.5.6.1 South Atlantic AnomalyProton activity in the South Atlantic Anomaly (SAA) has provided challenges to the ATC configuration over awide range of areas from the telescope settings to the range of times where we can have the rate notch filterenabled. The telescope settings are affected by the presence of proton hits to the detectors that lead toabnormally large signal readings. The large data values are interpreted by the telescope as a very strong lightsource entering one side of the telescope. The offset of the signal in the telescope field of view looks, to thecontroller, like a mis-centering of the telescope axis with the guide star and causes erroneous control commandsto the thrusters. There is exception handling, a telescope sanity check and a sum magnitude limit in placeintended to filter out these signals, but due to an error in the Ada exception handling compiler, the signals arenot properly filtered. See ATC Slope Exception Handling section below for more details.A new telescope configuration has been implemented to eliminate the exception handling problem, but evenwith this fix in place, the telescope is still essentially blinded for several minutes while passing over the SouthAtlantic Anomaly. While traveling through the center of the SAA, up to 90-100% of the data is filtered out dueto proton activity corruption as shown in Figure 7-21 below. Thus, during this brief period of time, the ATCsystem is essentially controlling without any proportional term data that is generally used to keep the guide starcentered.Figure 7-21. Percentage of data corrupted by proton activity in the South Atlantic AnomalyDuring this period, the controller relies mostly on rate damping to keep from wandering too far off the guidestar. However, as discussed earlier, there is a rate notch filter that strongly attenuates the body roll rate, orinertial signal. It has been deemed too much of a risk to keep the filter on through the strongest parts of theSAA, because the system would be controlling without proportional or inertial rate damping data. Therefore,the notch filter is turned off just before entering the SAA, and the roll rate disturbance from the ARP motion isnot attenuated during passes through the SAA.196 March 2007 Chapter 7 — Attitude & Translation Control Subsystem Analysis
Furthermore, as a result of the transient behavior from the initial conditions while turning on the filter after theSAA, during parts of the year, the notch filter must remain off even after the SAA. This affects data on one ortwo orbits out of every day, or one or two out of every fifteen orbits. On orbit data has been used to map out thestrongest section of the SAA, where more than 50% of the attitude error data points are lost due to protonactivity, as shown in Figure 7-22 below.Figure 7-22. South Atlantic Anomaly Region produced from telescope proton hit data7.5.6.2 Solar FlaresSolar flares have increased the proton activity that the satellite has observed in much of its sensitive equipment.The ATC system has been affected most by solar activity in the telescope detectors. Specifically, the January 20,2005 solar flare charged up the north pole strongly enough to corrupt 90-100% of the telescope data. The dataloss lasted long enough for the satellite to drift far enough to lose the guide star. Several hours of science datawere lost while the team reacquired the guide star. Most other solar flare activity has been weak enough so thecontrol system performance has been unaffected. The telescope data corruption and subsequent spacecraftattitude error is shown in Figure 7-23 below.<strong>Gravity</strong> <strong>Probe</strong> B — <strong>Post</strong> <strong>Flight</strong> Analysis • Final <strong>Report</strong> March 2007 197
Figure 7-23. Effects on telescope pointing from the solar flare on January 20, 20057.5.6.3 ATC slope exception handlingThere appears to be an error in the proton filter in the telescope detectors that remained unexplained for almosthalf of the science mission. The error is now believed to be a compile-time error where the programmedalgorithm is correct and the compiled code is incorrect. The problem lies in the size of the largest numberallowed in the exception handling. Basically, numbers twice as big as the intended threshold pass through theexception handler without causing an exception. However, the ATC slope algorithm still runs on theassumption that the numbers can be no larger than the threshold.The resulting behavior is a “wrap-around” effect where negative numbers of larger magnitude than thethreshold wraps around and are interpreted as a very large positive number. Due to this error, proton activity isespecially potent in the SAA. The large data points getting through to the control system pushed it just about toits limits and resulted in large attitude error oscillations coming out of the SAA.This could have been fixed by changing the onboard code, but a much simpler solution was implemented. Thevehicle is now set up so that only half of the range of the telescope detectors is used. Since, we only use half of thedetector range, we are guaranteed that the largest negative number will still have a smaller magnitude than the“wrap-around” threshold.198 March 2007 Chapter 7 — Attitude & Translation Control Subsystem Analysis
7.5.7 Star Tracker Magnitude UpdatesThe star tracker has worked well after the initial setup and configuration. The majority of the updates to the startracker operations have been updates to the magnitudes in the onboard star catalog. The variation of themeasured magnitudes of the stars identified by the trackers is larger than the magnitude threshold that has beenchosen in order to minimize the probability of mis-identification. Some stars have been identified on the orderof once per day. Upon further investigation, it was determined that the magnitude in the catalog did not matchthe measured magnitude and the star was only identified when the outliers landed in the acceptable rangeaccording to the magnitude threshold. Updates to the magnitude in the onboard catalog have solved theproblem of infrequent star identifications for a number of the stars that were seen regularly, but infrequently.7.5.8 Dewar Slosh ControlThe drag-free control system and control efforts began to grow in an unstable manner at one point during themission. The cause of this behavior is believed to be slosh occurring in the liquid helium in the dewar. Thebehavior observed was a slowly growing magnitude in the control efforts at the estimated slosh frequency andwas likely caused by an attempt to change the roll rate of the vehicle too quickly. After a period of time out ofdrag-free and some changes to the drag-free controller, the system settled down, and the vehicle was returned todrag-free operations. Since the occurrence, a slower rollup/rolldown rate has been used, and no further sloshproblems have been observed.<strong>Gravity</strong> <strong>Probe</strong> B — <strong>Post</strong> <strong>Flight</strong> Analysis • Final <strong>Report</strong> March 2007 199
200 March 2007 Chapter 7 — Attitude & Translation Control Subsystem Analysis
8Other Spacecraft Subsystems Analyses<strong>Gravity</strong> <strong>Probe</strong> B — <strong>Post</strong> <strong>Flight</strong> Analysis • Final <strong>Report</strong> March 2007 201
202 March 2007 Chapter 8 — Other Spacecraft Subsystems Analyses
8.1 Commands & Data Handling (CDH)The Command and Data Handling subsystem (CDH) manages commands to and telemetry from the <strong>GP</strong>-Bspace vehicle as well as some communication on board the space vehicle. It consists of the <strong>Flight</strong> Computer(CCCA), Solid State Recorder (SSR), Command & Telemetry Unit (CTU), Watchdog Timer (WDT), and theInterface Unit (IU). These components are discussed in detail below The CDH also provides the interfacebetween the CCCA and the RF transponders, as well as the Control Gyro and <strong>GP</strong>S receiver. Figure 8-1 belowshows the physical locations of these boxes. The region in green shows the locations of the CCCA, SSR, IU, andCTU. The regions in blue show the transponders and antennas.Figure 8-1. Physical Location of CDH boxes on <strong>GP</strong>-BFigure 8-2 is a block diagram showing the interactions between various components. The blocks with a greenbackground belong to the CDH system.<strong>Gravity</strong> <strong>Probe</strong> B — <strong>Post</strong> <strong>Flight</strong> Analysis • Final <strong>Report</strong> March 2007 203
Figure 8-2. Block Diagram of CDH communications. Green blocks belong to the CDH subsystemThe CCCA communicates with the rest of the space vehicle via the 1553 bus, while the individual componentsof the CDH communicate via high-speed serial bus.The CDH subsystem provides the following:1. Verification and distribution of commands from the uplink data stream and the CCCA2. Acquisition of data in response to CCCA requests3. Generation of the downlink data stream4. Data management and routing between the CCCA, SSR, <strong>GP</strong>S and Control Gyros5. Receipt and distribution of 10 Hz synchronization6. Watch Dog Timer (WDT) redundancy management8.1.1 PerformanceThe CDH performance on-orbit has been nominal. All components have performed well without exception.8.1.1.1 CCCASee Section 8.5 for an in depth discussion of the CCCA.204 March 2007 Chapter 8 — Other Spacecraft Subsystems Analyses
8.1.1.2 SSRThe SSR stores telemetry for download to the ground. It has the capacity to store up to ~15 hours of data.During each ground contact the vehicle dumps approximately half its capacity, depending on the length of thecontact.8.1.1.3 CTU & IUOne of the functions of the CTU is to process commands received from the ground. Figure 8-3 shows thenumber of commands sent to the CTU. The total for the mission was approximately 106,000 commands. Thespike observed in March 2005 is related to the recovery from the CCCA reboots. After a fail-over to the B-side,more real time commanding is needed to reconfigure the space vehicle. The increase observed at the end of themission is due to calibration phase activities, starting in July 2005. Also note that after the IOC period, the needfor real time commanding dropped significantly.Figure 8-3. Commands sent by monthRoutine vehicle commanding is accomplished by loads; sequences of commands stored for later use. In mostcases, these sequences are run on the main flight computer. Figure 8-3 shows the number of loads sent to thespace vehicle per month—almost 450 loads total. The spike observed in March is related to the recovery fromthe main flight computer reboots (Anomalies 148, 152, and 156). After such a reboot, updates to the flightsoftware are uploaded, accounting for the spike. At the beginning of the mission, during the IOC phase, a newload was needed every day and sometimes more than once a day. Towards the end of the mission, a single loadspanned 2 or more than 2 days. During the calibration phase the number of loads increased, consistent withincreased vehicle activity.<strong>Gravity</strong> <strong>Probe</strong> B — <strong>Post</strong> <strong>Flight</strong> Analysis • Final <strong>Report</strong> March 2007 205
8.1.1.4 WATCH DOG TIMERFigure 8-4. Commanding loads sent to the vehicle by monthThe reboot of the CCCA associated with anomaly 156 has been attributed to the Watch Dog Timer (WDT). TheWDT does not receive a heartbeat from the flight computer, software forces a hard reboot. It is believed that thiswas the reason for anomaly 156, but there is some speculation that a well placed multi-bit error in the WDTrather than the CCCA could have also caused an unnecessary reboot of the CCCA. Testing is underway toconfirm the root cause.8.1.2 ConclusionThe CDH has performed nominally throughout the <strong>GP</strong>-B mission. The CDH system has supported andcontinues to support the <strong>GP</strong>B mission adequately.8.2 Thermal Control Systems (TCS)The temperatures of all <strong>GP</strong>-B space vehicle components are maintained within the minimum and maximumoperating/survival temperatures. A margin of at least 11°C is carried at the hot and cold extremes for eachcomponent. Components with survival heaters have a minimum command authority of 25%.206 March 2007 Chapter 8 — Other Spacecraft Subsystems Analyses
Throughout the mission, all essential elements performed nominally with one possible exception. Morespecifically:• All thermal systems have been and continue to be within tolerances.• The TCS thermal monitor limits were developed early and the used extensively during the pre-flighttesting of <strong>GP</strong>-B. All essential elements remained inside their limits for the duration of the mission.• The success of the TCS during the mission was due to a qualified, certified and highly motivated TCSteam. Notable contributions were made by Kevin Burns, as well as many others.• The TCS’s success can be directly attributed to extensive thermal modeling, limit development andthermal vacuum testing.• The dedication, ability and willingness of the LMMS TCS team to develop limit updates and thermalmodel additions throughout the mission was exemplary and contributed in no small part to the <strong>GP</strong>-Bmission success.The thermal system for the <strong>GP</strong>-B spacecraft has an extremely robust design. <strong>GP</strong>-B, more than any otherspacecraft, requires this robustness due to the large temperature swings the vehicle experiences during thedifferent seasons. The science mission mandates that <strong>GP</strong>-B point in a fixed direction at a distant guide starthroughout its mission. It is due to this fixed pointing in local inertial space that the spacecraft experiencesdifferent seasons as the sun appears to “walk” around the vehicle. The seasons of <strong>GP</strong>-B are illustrated inFigure 8-5 below.Figure 8-5. The Seasons of <strong>GP</strong>-BThis effect is also shown in the variation of the spacecraft’s gamma angle throughout the year. The gamma angleis defined as the angle to the sun from the bore sight of the telescope. Also adding to the thermal complexities ofthe spacecraft is the fact that <strong>GP</strong>-B is in a low Earth polar orbit; therefore the vehicle experiences a high number<strong>Gravity</strong> <strong>Probe</strong> B — <strong>Post</strong> <strong>Flight</strong> Analysis • Final <strong>Report</strong> March 2007 207
of eclipses each day (approximately 15-16 per day). Figure 8-6 graphically shows the annual variation of thegamma angle, in conjunction with the spacecraft’s corresponding time in eclipse. Accordingly the thermal datais highly cyclical and dependent on the eclipse cycle of the vehicle as well as the seasonal variations.Figure 8-6. The annual gamma angle and eclipse cycle of <strong>GP</strong>-BDespite the thermally complicated nature of <strong>GP</strong>-B’s mission, there were no unexplained thermal transients orlimit violations. It should be noted, however, that the dewar vacuum shell temperatures deviated 25–30 degreesfrom model predictions. Chapter 12, Cryogenic Subsystem Analysis explains the reason for this deviation indetail. However, it is important to note that although the temperatures are higher than predicted, the dewar metits mean-mission-duration requirement of 16.5 months.8.2.1 System PerformanceThe <strong>Gravity</strong> <strong>Probe</strong> B Thermal Control System has performed exceptionally well from launch through thecompletion of the mission. All major TCS elements have demonstrated flawless performance and stability sincelaunch. The following series of plots are intended to graphically display the thermal trending of the spacecraft’smajor components throughout the duration of the mission.The spacecraft batteries are located on the battery pallet at the aft end of the vehicle. Each battery has anassociated heater which keeps the temperature around 0 degrees Celsius. The battery temperatures are cyclicdue to the oscillation of the heaters turning on and off. Additionally, the batteries have some seasonal variationin their temperature. As the sun moves to the front of the vehicle, the batteries become more dependent on theirheaters to maintain their 0 degree average temperature. Where as, when the sun is on the aft end of the vehicle,the heaters turn off. Figure 8-7 below, graphically displays the both batteries temperatures for the duration ofthe mission along with their associated yellow and red limits. It can easily be seen that the average temperaturestayed around the desired 0 degrees Celsius and no limits were violated.208 March 2007 Chapter 8 — Other Spacecraft Subsystems Analyses
Figure 8-7. Battery 1 & 2 Temperature Trends for Mission DurationThe Gyro Suspension System (GSS) has maintained a steady range of temperatures. The largest variationoccurred when the GSS dropped out of high voltage. The box is located in the Forward Equipment Enclosure(FEE) and is therefore thermally protected. Although its location allows for some thermal protection thechanging of seasons is evident in the analysis of trended data. Figure 8-8 below, displays all the mission data forGSS1. The other three boxes (GSS2, GSS3 and GSS4) all performed in almost identical fashion to box #1. It isinteresting to note that temperature drops as the sun moves to the aft end of the vehicle and when science dataacquisition began (GSS dropped out of high voltage).<strong>Gravity</strong> <strong>Probe</strong> B — <strong>Post</strong> <strong>Flight</strong> Analysis • Final <strong>Report</strong> March 2007 209
Figure 8-8. GSS1 Temperature Trends for Mission DurationIn order to maintain positive power throughout the year, <strong>GP</strong>-B had to develop a very unique design for its solararrays. This design is discussed in much greater detail in the Electrical Power System (EPS) section of thisreport. However, the arrays are canted in such a manor to allow them to receive at least some sunlight yeararound. Due to similar canting, the array’s temperatures tend to track each other in pairs. In other words array 1& 3 have the same temperature as do arrays 2 & 4. Large temperature swings (~80 degrees Celsius) can be seenbetween full sunlight and eclipse. Figure 8-9 graphically displays all 4 array average temperatures throughoutthe mission as well as the associated gamma.210 March 2007 Chapter 8 — Other Spacecraft Subsystems Analyses
Figure 8-9. Solar Array (Average) Temperatures for Mission DurationThere are many thermal sensors located throughout the spacecraft; however, some of the most important onesfor estimating the lifetime of the mission are located on the dewar Vacuum Shell. A thermal model wasdeveloped by Lockheed Martin for the entire spacecraft. This model produced estimates for temperatures of keysystems for the different sun angles the vehicle would experience. During the mission these estimates werecontinually compared with the actual temperatures experienced on orbit. For the most part the actual andpredicted temperatures matched up quite well. The one exception lies in the dewar vacuum shell temperatures.As mentioned earlier, the differences between the thermal model and the actual on orbit values has beenextensively studied and is discussed in detail in Chapter 12, Cryogenic Subsystem Analysis. Figure 8-10 displaysthe actual temperature data taken over the course of the mission for the forward dewar vacuum shell, andFigure 8-11 displays the temperature data for the aft dewar vacuum shell.<strong>Gravity</strong> <strong>Probe</strong> B — <strong>Post</strong> <strong>Flight</strong> Analysis • Final <strong>Report</strong> March 2007 211
Figure 8-10. Forward Dewar Vacuum Shell Temperatures for Mission Duration212 March 2007 Chapter 8 — Other Spacecraft Subsystems Analyses
Figure 8-11. Aft Dewar Vacuum Shell Temperatures for Mission Duration<strong>Gravity</strong> <strong>Probe</strong> B — <strong>Post</strong> <strong>Flight</strong> Analysis • Final <strong>Report</strong> March 2007 213
The <strong>Gravity</strong> <strong>Probe</strong> B spacecraft has forward and aft thrusters to maintain attitude control and for drag-freeflight. The thrusters are mounted in clusters of four, with eight total thrusters on the forward and eight total onthe aft. Having sixteen thrusters was a robust design, which allowed for redundancy throughout the thrustersystem. During the Initial Operation and Checkout (IOC) Phase one of the thrusters failed. This failure,although unfortunate, had little effect to the overall attitude control due to the redundancy of the system. Adiscussion of this failure is thoroughly discussed in Chapter 7, Attitude & Translation Control SubsystemAnalysis. However, as a result of this failure, four thrusters became “single-string” thrusters. Meaning that if oneof these four thrusters were to now fail, some functionality in the attitude control system would be lost. All 16thruster temperatures were monitored throughout the mission and due to their single-string nature, four of thethrusters were monitored with special care and a little more visibility. The four single-string thrusters are:Thrusters 5, 7, 10, & 12. Figure 8-12, Figure 8-13, Figure 8-14, and Figure 8-15 display the forward and aftthruster temperatures for the duration of the mission. It can easily be seen that the yellow and red limits werenever violated and the seasonal variations in the thruster temperatures are evident as well. The forwardthrusters cool as the gamma angle increases and the aft thruster cool as the gamma angle decreases.214 March 2007 Chapter 8 — Other Spacecraft Subsystems Analyses
Figure 8-12. Forward +X Thruster Temperatures for Mission Duration<strong>Gravity</strong> <strong>Probe</strong> B — <strong>Post</strong> <strong>Flight</strong> Analysis • Final <strong>Report</strong> March 2007 215
Figure 8-13. Forward -X Thruster Temperatures for Mission Duration216 March 2007 Chapter 8 — Other Spacecraft Subsystems Analyses
Figure 8-14. Aft +X Thruster Temperatures for Mission Duration<strong>Gravity</strong> <strong>Probe</strong> B — <strong>Post</strong> <strong>Flight</strong> Analysis • Final <strong>Report</strong> March 2007 217
gaFigure 8-15. Aft -X Thruster Temperatures for Mission Duration8.2.2 QBS and SRE Temperature ControlBecause of the extremely precise nature of the <strong>GP</strong>B experiment there are several parts of the spacecraft thatrequire exact temperature control to eliminate any thermal biases in the experiment. These parts are the QuartzBlock Support and SQUID Brackets inside the <strong>Probe</strong> and the SQUID Readout Electronics outside the <strong>Probe</strong>.The temperature control of the parts inside the <strong>Probe</strong> is especially impressive: the QBS has 1 mK control whilethe SQUID Brackets have 5 μK rms thermal stability with a 1mK disturbance.218 March 2007 Chapter 8 — Other Spacecraft Subsystems Analyses
Precise temperature control is achieved through a several control loops that link heaters to temperature sensorsand increase or decrease the heater voltage according to the temperature readout. The QBS, SQUID Brackets,and SRE boards (FLL, DAC, DAS and a board controlling the SQUID Bracket temperature) all have their ownheater, temperature sensor and control loop. The temperature control on these parts of the spacecraft limits thethermal bias of the gyroscope readout to less than 12 μarcs—an extraordinary achievement.8.2.2.1 QBS Temperature ControlThe SQUID Bracket, which is thermally coupled to the QBS, requires the QBS to have a peak-to-peak thermalstability of 1 mK so that the SQUID Bracket will be able to meet it’s own thermal stability requirements.Thermal stability of the QBS is achieved through two PI (Proportional Band, Integral) control circuits thatoperate the QBS heaters: A-side controller (QBS heater A in conjunction with an A-side GRT located on theQBS) and B-side controller (QBS heater B in conjunction with a B-side GRT located on the QBS). Eachcontroller has three modes of operation:1. Analog closed-loop, 80 Hz sinusoidal AC excitation;2. Open-loop, 80Hz AC excitation;3. Open-loop, DC voltage excitation.However, under normal conditions only the analog closed-loop is used to achieve temperature control. It worksas follows:The desired QBS temperature (the heater set point) has a corresponding GRT resistance.GRT resistance X current source level X amplifier gain = GRT voltageA D/A Converter with 8-bit resolution is programmed to produce the desired GRT voltage. The analog PIcontroller heats the QBS to maintain the GRT voltage equal to the DAC voltage and thus control the QBStemperature.It is important to note that because the controller can only add heat to the system, the controller must bias theQBS to a small delta above its sink temperature in order to achieve temperature control.8.2.2.2 SQUID Bracket and SRE Temperature ControlSQUID Bracket and SRE temperature control is important because it is necessary to keep the electronic boardsat a stable temperature to ensure precise SQUID measurements with little error.As stated earlier, the SQUID Bracket requires a 5 μK thermal stability with a 1mK disturbance. This is achievedthrough a control circuit which is located on the SRE boards (outside the <strong>Probe</strong>) and is itself temperaturecontrolled.The SRE boards are located outside the <strong>Probe</strong> and have to overcome much greater thermal variations than theQBS and SQUID bracket do inside the <strong>Probe</strong>. The temperature controls for the SRE boards were built to handlethe following expected thermal environment variations (although they are capable of handling highervariations):1. Roll temperature variation: less than 30 mK (peak-to-peak).2. Orbital Temperature Variation: less than 0.5 K (peak-to-peak).3. SRE Annual Temperature Variation: less than 15 K (peak-to-peak).There is one DAS, FLL and DAC for each of the four gyros. Each of these has its own temperature controlcircuit that links its temperature sensor to a heater in order to provide temperature control.<strong>Gravity</strong> <strong>Probe</strong> B — <strong>Post</strong> <strong>Flight</strong> Analysis • Final <strong>Report</strong> March 2007 219
Because there are only two SQUID brackets inside the <strong>Probe</strong> (each one holding two gyros) there are also onlytwo boards outside the <strong>Probe</strong> where the control circuits for the SQUID bracket temperatures are. Each of theseboards has a primary and backup heater and sensor. A PI algorithm controls the heaters and attempts to keepthe temperature of the SRE bracket at its set temperature. There are two modes: Coarse Mode (750 ohms/volt)and Fine Mode (10 ohms/Volt).The specification for temperature control of the SRE is given only in terms of the FLL. It states that, “Thethermal-induced bias drift shall be less than 20 PPM of full scale per K for FLL ranges 1 and 2.” In other words,a 1 K temperature change of the FLL will result in less than a 0.4 mV change in the SQUID readout. This isroughly equivalent to 0.54 marcs, quite large by <strong>GP</strong>B’s standards. However, the average orbital temperaturevariation of the FLLs under temperature control is only 1mK so the thermal induced bias drift of the SQUIDsignal at orbital frequency is only 0.54 μarc. An astoundingly small effect.8.2.2.3 Verifying QBS Temperature Control SpecificationsAnalyzing a typical 24 hr. period of telemetry data from the monitor TE_QBS_a_GT10P (the QBS temperature)shows that 1mK temperature control is achieved a majority of the time. More specifically: 85% of the time theQBS temperature was within +/- 0.5 mK of the average temperature over the 24 hr period.65% of the time the temperature was within +/-.25 mK of the average temperature over the 24 hr period. 96% ofthe readings were within +/- 1 mK of the average temperature. 99.3% of the readings were within +/-1.5 mK ofthe average temperature.The QBS temperature control loop must overcome temperature fluctuations caused by orbital, annual and rollcycles. The most rapid and drastic change in temperature is caused by an orbital cycle and this prevents the QBSfrom maintaining its specified thermal stability of 1 mK 100% of the time.When the telescope shutter is open while the earth is between the guide star and <strong>GP</strong>B, light from the sun canreflect off the earth and travel down the telescope, heating the <strong>Probe</strong>. Areas of the earth covered in ice, snow orclouds reflect more light from the sun than other parts of the earth, so when the telescopes viewing field is overone of these areas, there is a larger increase in temperature of the QBS.The PI control loop cannot respond (change the heater voltage) quickly enough to keep the QBS temperaturewithin the control range when light reflecting off the earth travels down the telescope. Closing the telescopeshutter during Guide Star Invalid periods would solve this problem. However, this was deemed an unacceptablesolution as constantly opening and closing the shutter would cause vibrations in the <strong>Probe</strong> that could disturbthe gyros. Another possible solution would be to use a PID (Proportional Band, Integral, Derivative) controlloop that would be able to react fast enough to keep the QBS temperature within the desired range. However,this solution is not feasible as it is not possible to change the control loop after launch.8.2.2.4 Verifying SQUID Bracket and SRE Temperature Control SpecificationsThrough telemetry, it was easy to verify that the thermal stability of the SQUID bracket met its specificationsexcept during the time period when sunlight reflected off the earth traveled down the telescope, heating up theQBS. The chart in Figure 8-16 below shows the temperature from of the SQUID Bracket (top), the QBS(middle) and the Cryo Pump, which is not under temperature control but was included to contrast temperaturecontrol against no temperature control (bottom).220 March 2007 Chapter 8 — Other Spacecraft Subsystems Analyses
Figure 8-16. The temperature from of the SQUID Bracket (top), the QBS (middle) and the Cryo PumpThe thermal stability specification for the SRE was tested by purposely and individually modulating thetemperature of all the SRE boards and observing the effect this had on the readout of the SQUID associated withthat board. The temperature controller setpoint on the board being tested was alternated between 0 C and 75 Cwith a 90 second dwell at each value.The results were given as Bias Temperature Coefficients in mV/K (in other words, the amount that changing thetemperature of each board or bracket 1 K affected the readout of the SQUID associated with that board orbracket). The results are shown in Table 8-1 below.Table 8-1. SRE Temperature Coefficients (in mV/K)SQUID 1SQUID 2SQUID 3SQUID 4FLL1 FLL2 FLL3 FLL4 DAC1 DAC 2 DAC 3 DAC 40.47 +/-?0.200.39 +/-0.140.51 +/-0.080.72 +/-0.110.28 +/-0.18?0.54 +/-0.11DAS A SQ Br El A DAS B SQ Br El BSQUID 1 1. 30 +/- 0.08 1.03 +/- 0.43SQUID 2 no data (SQ railing) 1.40 +/- 0.04SQUID 3 0.32 +/- 0.09 (no corr., bad SQ signal)SQUID 4 0.24 +/- 0.05 0.54 +/- 0.67<strong>Gravity</strong> <strong>Probe</strong> B — <strong>Post</strong> <strong>Flight</strong> Analysis • Final <strong>Report</strong> March 2007 221
Because the specifications for SRE thermal stability only pertained to the temperature of the FLL, they are theonly Bias Temperature Coefficients necessary to verify that the specifications have been met. The average BTCfor the FLLs is 0.52 mV/K. This is slightly higher than the specification of 0.4 mV/K, but with the superbtemperature control of the FLLs the effect on the SQUID readout is minimal.Using these thermal coefficients it is possible to determine the bias of the SQUID readouts caused by thermalfluctuations of the SRE boards. To do this, the temperature variations of each board at orbital and roll frequencywere multiplied by that boards BTC to determine the bias that the thermal variation produced on the SQUIDreadouts. It was found that at roll frequency, the average effect on all the SQUIDS was 6 nV. This correlatesroughly to an angle of 8 μarcs.8.2.2.5 Tangible Comparisons to Understand <strong>GP</strong>B Temperature Control<strong>GP</strong>B is a macro project in terms of depth and importance yet the experiment itself is on a micro level and it canbe difficult to grasp some of extremely small numbers involved in the experiment. The following are a fewallegories that will hopefully enlighten the reader as to how precise temperature control on <strong>GP</strong>B truly is.8.2.2.5.1 QBS ComparisonsThere are two allegories that can be made to demonstrate the excellence of QBS temperature control. The first isby comparing it to the human body and the second is by comparing the temperature inside a room to the QBStemperature and the temperature outside the room to the Cryo Pump, which is near the QBS but not undertemperature control.1. The “nominal” range for an adult’s body temperature is 36.4 to 37.1° C (97.6 to 98.8° F).Control rangeof.7 °C (1.2° F). The QBS temperature control is 700 times more precise!2. Imagine the temperature outside the room you are in ranging from -63° C to 808° C (-81° F to 1486° F).To give you an idea, this ranges from the coldest temperature ever recorded in Canada (breathe hissesand turns to ice crystals) to the temperature of freely burning jet fuel. Now, if the room you are in had thetemperature control of the QBS, it would be a comfortable 24 +/- 0.5° C (75 +/- 0.9° F) 85% of the timeand 24 +/- 1° C (75 +/- 1.8° F) 96.5% of the time.8.2.2.5.2 SRE and SQUID Bracket Comparisons1. The SQUID Bracket temperature control is 140000 times as precise as the human bodies2. The disturbance in the SQUID readout at roll frequency due to the thermal variation of the SQUIDS wasextremely small. To be precise, it was 8 μarcs. To get a better idea of the size of this angle let’s project itonto the moon, which is 384,400 km away. The projection would only be 50 m on the moon. This is 1 /69520 of the moons diameter.8.2.2.6 ConclusionsThe temperature control technology aboard <strong>GP</strong>B is superb. It nearly meets the extremely rigid specificationsand ensures that thermal bias in the experiment will be minimal and easy to eliminate from the results, thusyielding a true test of Einstein’s Universe.222 March 2007 Chapter 8 — Other Spacecraft Subsystems Analyses
8.2.3 TCS Accomplishments• No major thermal limits violated throughout mission duration• Thermal model matched extremely well with on orbit temperatures• Robust designs allowed for harsh thermal environment to have little effect on spacecraft operations ormission lifetime• Well set limits can be attributed to extensive preflight testing and modeling• Outstanding mission operations team training for monitoring the system health and data trending• All thermal transients identified have been explained, as were any small limit violations8.2.4 TCS SummaryThe <strong>GP</strong>-B spacecraft is complex in many regards, the thermal control system is no exception. With seasonalvariations experienced by all subsystems combined with the high number of eclipses each day, made designing athermal system is no minor feat. With that in mind one can look back over the data from the mission and easilyconclude that the thermal design was indeed robust and a success. Very few thermal transients wereexperienced during the mission and even fewer limits were violated. Most importantly the thermal systemperformed almost exactly as expected with no effect to science data or data collection.8.3 Electrical Power Systems (EPS)The Electrical Power System (EPS) is one of the most critical subsystems on the <strong>Gravity</strong> <strong>Probe</strong> B space vehicleand performs vital functions essential to achieve the vehicle science objectives during vehicle on orbit lifetime.The EPS primary objective is to maintain positive power supplied to the vehicle bus elements throughout theorbital eclipse and sun periods and ensure the flight batteries are fully charged when exiting the orbit eclipses. Inaddition, the electrical power system provides functions for sustained communication and tracking with thevehicle during all mission orbits.8.3.1 System Features and CapabilitiesDue to the nature of the science mission, the <strong>GP</strong>B EPS design introduced unique technologies and methodsdeveloped to meet the vehicle requirement of pointing in a fixed direction at a distant guide star which requiresfor the satellite to be free from disturbances as possible. <strong>GP</strong>-B’s unique design includes four fixed double-sidedsolar array panels, canted at such angles to average solar power as a function of the orbital seasons. Mostsatellites that are designed to face the sun year around have moveable solar panels in order to maintain positivepower during orbit conditions (sun; eclipse; and gamma angle). The unique <strong>GP</strong>-B design also featured doublesidedpanels to minimize the thermal effects of entering and exiting eclipses with no noticeable effects ofthermal snapping.The EPS bus design demonstrated outstanding efficiency and stability showing little bus ripple levels beyond thevehicle requirements vital to mission science payloads and instruments and has proven reliability androbustness throughout the entire mission.The <strong>GP</strong>B EPS has met all requirements with flawless performance since launch supporting all missionoperations and objectives providing ample power margin necessary to plan and support any contingencyoperations, if required.<strong>Gravity</strong> <strong>Probe</strong> B — <strong>Post</strong> <strong>Flight</strong> Analysis • Final <strong>Report</strong> March 2007 223
8.3.2 Critical Mission RequirementThe <strong>GP</strong>B EPS primary function is to supply the required power to vehicle loads and science instrumentsnecessary to support mission Science Mode and precious data collection during mission lifetime with nointerruptions or dropouts. Additionally, the <strong>GP</strong>B science telescope must stay locked on the guide star IM Pegesito within 100 milliarcseconds with no disturbances to the science instruments. The <strong>GP</strong>B EPS designdemonstrated exceptional on-orbit performance with bus the ripple levels well below vehicle requirements of 2volts peak-peak. Figure 8-17 below, displays the daily peak bus ripple measurements for the duration of themission.8.3.3 System PerformanceFigure 8-17. Bus Ripple Metric (Ripple Value in Volts since Launch)The <strong>Gravity</strong> <strong>Probe</strong> B Electrical Power System has performed exceptionally well from launch through missioncompletion with all EPS elements demonstrating flawless performance and stability. Immediately afterspacecraft liftoff, the <strong>GP</strong>B EPS system delivered on-time exceptional performance with superb solar arraydeployment and continuous support to vehicle loads and mission operations during Initial and Orbit Checkout(IOC) phase. Successful on-orbit performance can be attributed to maintaining positive power to vehicle loadsduring vehicle mission operations and continuous system health and performance monitoring. It is alsoattributed to well-trained mission teams who effectively provided accurate data trending and comparison of realtime data to predicted analyses and models. At the completion of the mission, the EPS system was performingwell and continuing to support all science data collection and calibration activities. In fact over the missionlifetime, the system showed little degradation and could support extended missions if needed.8.3.4 EPS Accomplishments1. At vehicle launch, flawless solar array deployment in support of vehicle on-orbit initial operations2. Positive power to the space vehicle bus and its payloads during orbit seasonal periods3. Nominal and consistent performance during and post space vehicle Initial Operations and OrbitCheckout (IOC)4. Stable bus telemetry during all vehicle operations5. Very low bus ripple values better than specifications6. Successfully supported vehicle Science and Calibration Mode, and any required contingency operations7. Superb battery performance throughout all mission phases maintaining margin above minimum voltageand SOC thresholds for Safe mode.8. Consistent performance agreed and matched predicted analyses and models9. Outstanding mission operations team well trained to monitor system health and data trending224 March 2007 Chapter 8 — Other Spacecraft Subsystems Analyses
8.3.5 Eclipse Cycle<strong>GP</strong>-B has an eclipse cycle that ranges from a maximum eclipse of ~36 minutes per orbit to no eclipses during itssolstice season (full sunlight season). From launch through the end of mission, <strong>GP</strong>-B experience three (3)solstice seasons, all-lasting close to twenty one (21) days. Figure 8-18 below summarizes the variation of eclipselength for the entire mission. Additionally, it displays the associated depth of discharge on the batteries overthat same time frame.8.3.6 Bus PowerFigure 8-18. Eclipse Length and Depth of Discharge MetricThe space vehicle bus power performed nominally throughout the mission:• All bi-levels & analogs are nominal• SPRU was commanded to VT Level 4 prior to launch and has not changed since.• Bus voltage and current are well within limits• Very low bus ripple values better than specificationsPower generated by the solar arrays is regulated by the Standard Power Regulator Unit (SPRU) and distributed,through the Power Distribution Unit (PDU), to vehicle loads and two on-board 35 Amp-Hour (AH) SuperNiCad batteries. The SPRU sole function is to supply regulated power to the bus and ensure batteries are fullycharged. At eclipse exit, the SPRU provides the spacecraft with maximum power (peak power) to satisfy thevehicle loads and fully charge the batteries in preparation for the next eclipse orbit period. Throughout themission, the system power margin has been trended and monitored (system power margin is defined as theadditional power available from the system after satisfying vehicle loads and fully charge the two batteries).<strong>Gravity</strong> <strong>Probe</strong> B — <strong>Post</strong> <strong>Flight</strong> Analysis • Final <strong>Report</strong> March 2007 225
Figure 8-19 is a plot of the power margin over the entire mission. The calculation of this margin combines manyaspects of the EPS system, including the average power produced over 1 roll cycle immediately after eclipse, thepredicted average power over 1 roll cycle immediately after eclipse and the average actual power being used bythe vehicle load.8.3.7 BatteriesFigure 8-19. Space Vehicle Power Margin Metric<strong>GP</strong>-B maintains a Low Earth Orbit (LEO) at an altitude of only 640 km about the Earth’s poles. At this altitude,it has an orbit time of 98 minutes, completing 14.6 orbits per day. <strong>GP</strong>-B LEO orbit has two solstice seasons offull sun for approximately 21 days each. For remaining times of the year, <strong>GP</strong>-B experiences 14.6 eclipses per day,total of 4800 eclipses per year. Maximum eclipse duration is 36 minutes during peak of each eclipse season. <strong>GP</strong>-B’s batteries provide power for all of the spacecraft’s subsystems for duration of each eclipse. Total eclipsesrequired for the <strong>GP</strong>-B mission is approximately 7200.<strong>GP</strong>-B’s battery dominated bus is supported by two 35 Ah Super Nickel Cadmium batteries in parallel. Predictedpower levels before launch were approximately 700 Watts, corresponding to 20% DOD for nominal two-batterymission. Cycle Life Analysis for nominal mission with two batteries in parallel cycling to constant 20% DOD atworst case temperature results in a cycle life margin of 24,000 cycles. This is equivalent to >5 years of cyclingbeyond the 1.5 year mission requirement. For mission scenario with one failed battery, Cycle Life Analysis forone battery cycling to constant 40% DOD at worst case temperature predicts margin equivalent to >1.2 years ofcycling beyond the 1.5 year mission requirement.Extensive ground testing was used to determine charge control levels for flight and confirmed <strong>GP</strong>-B batterycapabilities. The nominal two battery-mission scenario was tested by subjecting test batteries to maximum 20%DOD mission eclipse profile over one year in real time. Minimum battery voltage observed from test was 26.4Volts at maximum eclipse. Battery capacity sustained by charge control levels for flight was > 32 Ah, which is226 March 2007 Chapter 8 — Other Spacecraft Subsystems Analyses
more than adequate to meet mission requirements. Ability of single battery to support <strong>GP</strong>-B was alsodemonstrated. Minimum battery voltage at 40% DOD was 26.1 Volts, and capacity to meet missionrequirements was also confirmed through worst-case eclipse season.Actual loads in flight have not been as high as those used for analysis and test. Highest battery DOD experiencedhas been about 16% throughout the first year of the mission. Figure 8-20 and Figure 8-21 below display thevariation (end of charge and discharge) of the battery voltage and state of charge over the entire mission.Figure 8-3 shows that both batteries exhibit minimum voltage = 26.8 Volts. This is higher than the 26.4 Voltsfrom ground testing due to the shallower DOD in flight. State of Charge for each battery is calculated fromintegration of measured currents. Both batteries exhibit same SOC throughout the mission. This is due toexcellent current sharing between the two batteries.Figure 8-20. Battery Voltage Metric<strong>Gravity</strong> <strong>Probe</strong> B — <strong>Post</strong> <strong>Flight</strong> Analysis • Final <strong>Report</strong> March 2007 227
Battery Performance Summary:Figure 8-21. Battery State of Charge Metric• Charge control determined by ground testing has proven to be satisfactory throughout the mission.• Battery Voltages in flight remain higher that from ground testing. This is due to lower DOD in flight(16% max) than was used in test (20% max).• Current share between batteries is excellent, as evidenced by identical Voltage and State of Chargeprofiles throughout the mission.• Spontaneous voltage rise at eclipse season exit indicates no degradation of the batteries since launch.8.3.8 Solar Array PowerAs previously mentioned, <strong>GP</strong>-B always points in a fixed direction at a distant guide star. Power source to the<strong>GP</strong>B spacecraft is supplied by the solar arrays that are designed and fixed positioned to receive average powerover seasonal gamma angles. Engineers at Lockheed Martin considered worst-case scenarios for the gammaangle—the angle of the sunlight to the Z-axis of the spacecraft. The worst-case gamma angle of ~22 o occursonce throughout the mission lifetime. Another consideration was the maximum 36-minute eclipse time, whichoccurs when the gamma angle is at its maximum and minimum values (158 o and 22 o ). At this angle, <strong>GP</strong>-B’sorbit plane directly faces the sun. While this only occurs a few times throughout the mission, it represents themost usage and deepest depth of discharge (DOD) by the batteriesThe orientations of the panels are arranged to optimize the amount of incident sunlight. Panels 1 and 3 arerotated 90 o with respect to the X-Y plane of the spacecraft. Panel 1 is located 45 o with panel 3 opposite it at 225 owith respect to the positive X-axis. Panels 2 and 4 are rotated 25 o and respectively located at 135 o and 315 o fromthe positive X-axis. Because of this asymmetry, the spacecraft is free to rotate about the Z-axis of the telescopewith minimal perturbations due to the dragging or torquing of the solar panels.228 March 2007 Chapter 8 — Other Spacecraft Subsystems Analyses
Additionally <strong>GP</strong>-B is in a low Earth polar orbit, which causes it to have a high eclipse cycle (~15 per day).Figure 8-22 and Figure 8-23 display the bus power generated through the Standard Power Regulator Unit(SPRU) and solar array voltage and temperature variations respectively. It is interesting to note the consistencyof the voltage input and current output as well as the consistent temperature tracking for each similarly cantedpair of arrays.Figure 8-22. Solar array voltage and bus power performance metric<strong>Gravity</strong> <strong>Probe</strong> B — <strong>Post</strong> <strong>Flight</strong> Analysis • Final <strong>Report</strong> March 2007 229
Figure 8-23. Solar Array Temperatures Variations vs. Gamma Angle8.3.9 Solar Array Power Degradation AnalysisA detailed power analysis was performed by a team of <strong>Stanford</strong> Analysts supported by the Lockheed Martinpower experts to determine the solar array power degradation over the mission lifetime and compare resultswith power margin calculation performed by the operation team using vehicle telemetry. The power analysismodeled the solar array panels including the panel temperature, solar intensity fluctuations, and the decay ofthe Gallium Arsenide (GaAs) cells. These factors have been added into the decay analysis and several efficiencyfactors have been determined to account for each of these effects. A formula to predict power generation in thecourse of the mission lifetime was developed and from which power values during 2004 and 2005 werecalculated from the vehicle telemetry. A detailed power analysis is available for interested parties.Results from analysis showed a drop of approximately 80 watts between 2005 and 2004, equating to 3.62%degradation in the power production over the mission lifetime (Figure 8-24 depicts the EPS peak power datacomparison between 2004 and 2005). The analysis also showed ample power margin produced by the EPSsystem which would be sufficient to support mission extension, if required.As mentioned, Figure 8-24 displays the peak power produced in 2004 and 2005. Additionally, the differencebetween the two curves was calculated and represents the power degradation of the arrays over the year.Figure 8-25, below, displays only the portion of the data prior to post science calibrations. During thesecalibrations the vehicle’s attitude was purposely adjusted, which in turn changed the perceived gamma angleand likewise the peak power generated. Additionally, the data from 2004 was eliminated which included avehicle anomaly resulting in an unplanned maneuver (gamma angle change) and roll down of the space vehicle.Therefore, Figure 8-25 provides the most consistent comparison of 2004 to 2005 and likewise the most accurateassessment of solar array degradation. Results from this analysis showed a decrease of approximately 86 watts,equating to 3.89% degradation in power production.230 March 2007 Chapter 8 — Other Spacecraft Subsystems Analyses
Figure 8-24. EPS Power Generation Capability Comparison 2004 Vs 2005Figure 8-25. EPS Power Generation Capability Comparison (minus attitude discrepancies)<strong>Gravity</strong> <strong>Probe</strong> B — <strong>Post</strong> <strong>Flight</strong> Analysis • Final <strong>Report</strong> March 2007 231
8.3.10 ConclusionThe electrical power system has performed superbly during all mission events, achieving all requirements andmission science data collection objectives, showing stability and robustness with lower than required ripplelevels. The system supported all mission phases with continuous positive power to all vehicle payloads during allorbital seasons. Exceptional and consistent battery performance with no required reconditioning or signs ofunexpected degradation. All vehicle telemetry demonstrated outstanding solar array performance with amplepower to the bus, sufficient to perform additional contingency operations, if required. Power analysesperformed revealed that a loss of approximately 4% of the available power is lower than the predicted analysesand models, which approximated a degradation of approximately 5%. In summary, the EPS system hasperformed exceptionally well with no errors during the entire mission lifetime.8.4 CommunicationsThe Communications subsystem provide the <strong>GP</strong>-B Mission the communications functions for command andcontrol using the TDRS Space Network and Ground Network. The TDRSS is used to upload Stored ProgramCommand (SPC) loads, which are stored in one of two buffers called ping and pong. The vehicle executes thedesired timeline of science and vehicle commands from one of these buffers. While the vehicle is executingcommands from one buffer, the other buffer is updated and the switch from one buffer to the other (ping/pong) occurs automatically.The Ground Network is primarily used for playing back (dumping) the Solid State Recorder (SSR), which canstore up to 15 hours of 32K data. Both TDRSS and GN are also used to command the vehicle using groundprocedures (real-time commanding) as required by the mission. The baseline schedule has the GN at intervalsof approximately six hours, which provides data playback overlaps and reduces data losses; the GN supports areabout 11 minutes in duration. The TDRSS supports are scheduled to view timeline events as required, and aregenerally 20 to 25 minutes in duration at approximately every orbit (96 min).Figure 8-26. <strong>GP</strong>-B Communications Block Diagram232 March 2007 Chapter 8 — Other Spacecraft Subsystems Analyses
The Aft and Forward mounted omni-directional transponder configuration provide communications capabilityfor all attitudes of the spacecraft with respect to the TDRSS and GN (except for the constraints imposed by thelocation of TDRS satellites and GN sites). The redundant receivers on both transponders are on active standbyand are on direct power (unswitched) from the Power Distribution Unit (PDU). Both receivers acquire andtrack the forward carrier and are actively ready to receive command data from the ground via Multiple Access(MA) or S-Band Single Access (SSA) TDRSS service.Figure 8-27. Location of antennae and transponder palette on spacecraft.The command decoders, part of the Command and Telemetry Unit (CTU) subsystem, receive the detector locksignal from the receivers and accept command data from the first receiver with the detector lock indication. Thenominal transponder and antenna configuration is with the Transponder-A on the Fwd (Z-Axis) OmniAntenna, and Transponder-B on the Aft Omni. However, in the event of a problem with the nominalconfiguration, the receiver/antenna configuration can be cross-strapped with a single command.<strong>Gravity</strong> <strong>Probe</strong> B — <strong>Post</strong> <strong>Flight</strong> Analysis • Final <strong>Report</strong> March 2007 233
8.4.1 TDRSS OperationsFigure 8-28. Remote controlled operation of GRST from WSCThe Space Network (TDRS) configuration is composed of various modes as shown below. Only one, safemodeis automatically configured by the safemode system, the others are operated via command templates orcommand macros that are executed via the SPCs or ground commands. Selection of the Antenna to use is madeby view angles based on spacecraft attitude and view angles (line-of-sight) to the various TDRS.Table 8-2. TDRS Command ModesCommand (bps)Telemetry (bps)Coherency Mode Service Type Antenna Used Condition125 1024 Non TDRS (MA/SSA) Fwd Safemode2000 2048 Coh TDRS (SSA/SMA) Aft Nominal2000 1024 Coh TDRS (SSA/SMA) Aft NominalFormat Loads125 2048 Coh TDRS (SSA/SMA) Fwd Transponder-Aanomaly234 March 2007 Chapter 8 — Other Spacecraft Subsystems Analyses
8.4.2 Ground Network OperationsuFigure 8-29. The Svalbard Ground Station Network.The transponder mode for the GN is only one, as shown below. In the event of a safemode, the GN cannot beused, as the transponder is switched into a TDRS mode. However, it is possible to command (uplink only)during a GN while the vehicle is in a safemode, but this has not been necessary. Ground sites are scheduled aspredicted by line-of-sight, based on the <strong>GP</strong>-B attitude (for antenna use), orbit and site location over the rotatingEarth.Table 8-3. Ground Station SetupGround Stations used by <strong>GP</strong>-BCommand(bps)Telemetry(bps)8.4.3 Communications AnomaliesAlaska, Wallops, Svalbard Ground StationCoherencyMode Service Antenna Used Condition2000 2.56 M Non All GN Sites Fwd/Aft NominalThe <strong>Gravity</strong> <strong>Probe</strong> B Spacecraft, when using the Forward Antenna Transponder-A has a reduced forward linkperformance on TDRSS contacts. In addition, during the mission various issues with ground communicationsalso occurred. To date, <strong>GP</strong>-B has experience no problems due to mutual interference with other spacecraft, butthis could potentially be an issue in the future, as discussed at the end of this section.8.4.3.1 Transponder-A Communication AnomalyThe anomalous behavior, which became apparent after <strong>GP</strong>-B began on orbit operations, effectively reduces thereceived Signal to Noise by 15 to 20 dB. It is believed that the reduced performance is due to an increase in thetransponder noise floor, which rises at temperatures below 30 degrees C and increases as the transponder cools.The most likely root cause is a low level out-of-band oscillation in the second Low Noise Amplifier, which wasinduced during the retrofit to a new assigned frequency in October 2002.<strong>Gravity</strong> <strong>Probe</strong> B — <strong>Post</strong> <strong>Flight</strong> Analysis • Final <strong>Report</strong> March 2007 235
Figure 8-30. Xpndr-A STDN (green), Xpndr-A TDRS (yellow), Xpndr-B STDN (red), Xpndr-B TDRS (white)The plots in Figure 8-30 above show a significant difference between Transponder-A (first and second plotsfrom top) and Transponder-B (third and fourth) raw Signal Level (AGC). The Transponder-A, STDN modeAGC shows large fluctuations and increased noise floor as compared to that of Transponder B.236 March 2007 Chapter 8 — Other Spacecraft Subsystems Analyses
Figure 8-31. Transponder B TDRS AGC (red) vs Transponder A TDRS AGC (green)Transponder A TDRS mode AGC is also very noisy, compared with Transponder B TDRS mode AGC, asshown in Figure 8-31 above.<strong>Gravity</strong> <strong>Probe</strong> B — <strong>Post</strong> <strong>Flight</strong> Analysis • Final <strong>Report</strong> March 2007 237
Figure 8-32. Plot of TDRS AGC vs Temperature over a 20-minute time frameFigure 8-32 above shows the increase in the signal level (better Signal to Noise) as transponder temperatureincreases. The sample above shows an improvement of AGC from –264.0 dBm to -171.0 dBm in a twentyminuteperiod.8.4.3.2 Transponder-A Anomaly MitigationTo mitigate the reduced SNR, the <strong>GP</strong>-B transponder configuration macros were modified to operate the FwdAntenna connected Transponder-A at the command data rate of 125 bps. This in turn provides an increase of12 dB above the nominal command rate of 2000 bps, which the Aft Transponder’s nominal command rate. Inaddition, the TDRSS supports that can provide high power on the forward link (SSA) are routinely operated inthat mode, providing an additional increase in the link margin (5 dB better than low power). With bothprocedures in place, the command ability and reliability with the use of the forward transponder has not been amajor issue during the <strong>GP</strong>-B science mission phase.8.4.3.3 Ground Network Communication AnomaliesThe Ground Network has had few problems with the transponder, as the transponder configuration (mode) isdifferent and the GN uplink is of higher power. During the month of April of 2005, the Svalbard Ground Stationwas shut down for Antenna work, so the schedule shifted to the Svalbard commercial site (SKS). In addition,during the same month, Poker Flat Alaska commercial site (PF1) began to be scheduled more frequently.During this time period, the project experienced noisy data from these sites. Because of the compressed datadump, one-minute of data, lost due to noise, results in the loss of one hour and twenty minutes of 32K data.Whenever this kind of problem occurs, the operations team has to reconfigure the Solid State Recorder to repeatthe playback during the next scheduled GN. Although, this was/is a good way to recover the data, it was not the238 March 2007 Chapter 8 — Other Spacecraft Subsystems Analyses
est solution. After a relatively short time however, the start and end time for the data dumps was changed toreduce the low elevation start and stop times (increased the masking); this reduced the dump time, but resultedin better quality data. <strong>GP</strong>-B is now using all sites without major concerns in the quality of the data.8.4.3.4 Mutual Interference Anomaly PotentialMutual Interference (MI) has not been a problem on <strong>GP</strong>-B. There are some incidences when another vehiclehas affected the TDRSS supporting <strong>GP</strong>-B, but the MI’s duration has not been very long and so are of noconsequence. However, <strong>GP</strong>-B does have MI potential to other projects (S-Band Frequencies) supported byNASA’s Deep Space Network (DSN). <strong>GP</strong>-B’s mission planning, with predictions provided by the DSN hassuccessfully managed the control of the <strong>GP</strong>-B downlink over DSN sites.8.4.4 Communications—Prime Mission and BeyondThe <strong>GP</strong>-B Communications subsystem provides the command and control reliability as per the pre-launchsystem requirements. With the exemption of the Transponder-A anomaly, the system has functioned asexpected, within or better than the expected link margins. The project has successfully sent approximately106,000 commands over the 17.3-month mission and has retrieved 99% of the SSR data.The management of the on-orbit problems, such as that of the transponder has given the project the ability tosuccessfully complete the mission and go beyond. The project would like to acknowledge the assistance inresolving many of the COM issues on <strong>GP</strong>-B; members from <strong>Stanford</strong>, NASA Goddard and Marshall, LockheedMartin and General Dynamics (with the issue of the transponder).8.5 <strong>Flight</strong> Software (FSW)The <strong>Gravity</strong> <strong>Probe</strong> B <strong>Flight</strong> Software (FSW) consists of all Mission Support Software (MSS) running on theCommand and Control Computer Assembly (CCCA). This software performs a wide range of duties, includingbut not limited to maintaining the spacecraft attitude and drag-free orbit, monitoring critical health and safetystatistics, and supporting the transfer of telemetry to the ground. This software is distinct from the codesrunning in the payload computers, namely the Gyroscope Suspension Software (GSW) and the SQUID ReadoutElectronics Software (SSW); these payload packages are described in their respective payload sections.This section will give an overview of the on-orbit performance of the flight software, as well as the steps taken bythe FSW team to both prepare for mission operations and make adjustments to the software and procedures asa result of on-orbit events. The discussion will show that the FSW proved to be an efficient and robust piece ofthe complicated <strong>GP</strong>B system, and that the FSW team successfully guided the software through pre-launchpreparations, on-orbit modifications, and several anomalous events.8.5.1 Requirements Satisfaction.The <strong>GP</strong>B <strong>Flight</strong> Software (FSW) played an important role in achieving mission success. The mission level roleof the FSW included the capability to provide functions to support all on-orbit activities of both the spacecraftand payload, perform autonomous health and safety monitoring of critical subsystems, and ensure properprocessing of telemetry data and ground commands. The <strong>Flight</strong> Software successfully performed these goals,configuring the vehicle and science payload to a state appropriate for data taking, safing the vehicle fromunexpected events on a number of occasions, and supporting the accurate transfer of > 95% of collected data tothe ground. The on-orbit performance of <strong>GP</strong>B, from system initialization through science data collection, is atestament to the satisfaction of high-level FSW requirements.<strong>Gravity</strong> <strong>Probe</strong> B — <strong>Post</strong> <strong>Flight</strong> Analysis • Final <strong>Report</strong> March 2007 239
The FSW also met its subsystem level performance specifications. A major requirement of the FSW was toprovide all mission level capabilities mentioned above, while allowing the spacecraft computer (CCCA) tooperate with acceptable usage margins. This requirement was stated in LM SCSE-15 (<strong>Flight</strong> SoftwareRequirements Specifications): “Computer timing margins shall be defined as: PDR is 60% or less usage; CDR is65% or less usage; vehicle acceptance review is 95% or less usage”FSW performance was measured by the time duration (or percentage of allotted time) required for 1Hz and10Hz task processing. Data for a typical week during science data collection are shown in Figure 8-33 andFigure 8-34. Processing times were averaged over ~4 hour periods for this plot. Red lines represent themaximum processing time over the averaging interval, blue lines represent the average processing time, andgreen lines represent the minimum processing time. The 1Hz processing times (Figure 8-33) show a maximumof about 35% (350 milliseconds), which exceeds the performance specification of both 60% (PDR) and 95%(vehicle acceptance). The 10Hz processing times (Figure 8-34) show maxima under 90% (90 milliseconds) withan average of just over 65% (65 milliseconds), also meeting performance specifications.Additionally, watchdog timers were used to ensure that 1Hz and 10Hz processing tasks finished within theallotted time. This provided a means of monitoring the software performance and tracking the number of cyclesthat “timed out” before the processing task was complete. Based on flight data analyzed near the end of the <strong>GP</strong>Bscience mission, the FSW incurred zero (0) 1Hz processing timeouts during the first 400 days of the <strong>GP</strong>Bmission. Eleven (11) 10Hz processing timeouts were recorded over this same time span (an average of ~36 dayson-orbit per 10Hz timeout). Processing overload caused negligible (if any) interruption to on-orbit activities orscience data collection.Overall, the design and implementation of the <strong>GP</strong>B <strong>Flight</strong> Software met or exceeded all high-level systemrequirements, and most importantly, contributed to the realization of mission goals.Figure 8-33. CCCA 1Hz CPU Usage (in %) averaged over ~4 hours. (Red = max; Blue = avg; Green = min):240 March 2007 Chapter 8 — Other Spacecraft Subsystems Analyses
Figure 8-34. CCCA 10Hz CPU Usage (in %) averaged over ~4 hours. (Red = max; Blue = avg; Green = min)8.5.2 <strong>Flight</strong> Software StatisticsThe Mission Support Software (MSS) implements the following applications on the space vehicle:1. Process uplink commands implementing CCSDS.2. Command handler processes real time and Stored Program Commands.3. CCSDS programmable telemetry, events, data base readout4. Spacecraft computer memory load / dump5. Attitude determination and control6. Translation and dewar pressure / temperature control7. Electrical power and thermal processing support8. Route validated payload commands to payload processors9. Route telemetry from payload processors to ground and mass memory device10. Mass memory device record and playback management11. Safemode (redundancy management and layered control modes)12. Memory scrubbingStart Up Software (SUS) extended boot loader1. Loads flight software from mass memory device2. Memory scrubbing<strong>Gravity</strong> <strong>Probe</strong> B — <strong>Post</strong> <strong>Flight</strong> Analysis • Final <strong>Report</strong> March 2007 241
Appendix E, <strong>Flight</strong> Software Applications SLOC lists the source lines of code (SLOC) for the various FSWapplications and their sub-components. 59,000 lines of ADA and 2.3 MB of memory were required toimplement the FSW features required by <strong>GP</strong>-B. At run time, the FSW expands to 3.5 MB in the CCCA SRAMafter heap, stack, an other dynamic storage is allocated.Detailed requirements and functional descriptions of the FSW components can be found in Lockheed MartinDocument #P086580: SCSE-15, <strong>Gravity</strong> <strong>Probe</strong> B <strong>Flight</strong> Software Requirements Specification.8.5.3 Test It Like You Fly ItAll of the <strong>GP</strong>-B software (Mission Support, Payload, and Ground) was tested in the Integrated Test Facility(ITF) during the Formal Qualification Test (FQT) phase of the mission; one of the requirements to pass the<strong>Flight</strong> Readiness Review prior to launch approval. The ITF is a static, on-ground spacecraft simulator thatcontained engineering models or flight equivalents of spacecraft and payload subsystem, a vehicle dynamicssimulator computer to test the attitude and translation control system, and a communications downlinkprocessor to permit the vehicle to communicate with the MOC our flight interfaces. Figure 8-35 shows a pictureof the ITF hardware as configured late in the mission.The FQT was performed using the flight approved command templates (except where ITF-specific versionswere required to account for differences between the ITF and the on-orbit Space Vehicle environment) in anapproved manner in a series of about 15 comprehensive tests. The testing process of loading a series ofcommand templates and executing them sequentially based on time-tags was the same process used during onorbitoperations. The same tools are used to construct the command loads for testing as for operations. Thesame ground station software is used to uplink commands and command loads, to start execution of thecommand loads, and to monitor and record the telemetry for testing as for operations.The ITF was used prior to launch to test the flight software and to test the command templates used for on-orbitoperations. After launch it was used to test any new or changed command templates as well as to check theoperation of all new real-time command scripts, such as those used to clear multi-bit errors. Also after launchthe ITF played a key role in the regression testing necessary to confirm that the post launch software changeworked as specified with no surprises. It also was used to test the process of loading and rebooting the flightsoftware prior to using the process on the space vehicle.242 March 2007 Chapter 8 — Other Spacecraft Subsystems Analyses
8.5.4 On-Orbit Software ChangesFigure 8-35. ITF Hardware and InterconnectsBetween launch and May 17, 2004 thruster 6 and then 8 had gone unstable and were shut off using the ThrusterIsolation Valves (TIVs). The existing thruster control software needed to be updated to provide proper controlwith some redundancy whilst using only 14 of the original 16 helium thrusters. Several Software ChangeRequests (SCRs) were written to address the control software changes plus related changes to the safemodeapplication. Since launch two software discrepancies had been identified and several more changes that wouldeither improve the spacecraft performance or its safemode response had been found, including some that wereonly to the ground system limits to improve recognition of anomalous behavior. Table 8-4 below lists the SCRsthat were addressed by the flight software team from mid-May 2004 to late-July 2004.Table 8-4. SCRs Addressed in On-orbit S/W ChangeSCR # Date Title Reason for Change3240 5/11/2004 Rtworks checksadditions for multi-bitupset3241 5/11/2004 <strong>Post</strong>-launch calibrationand limit update #13242 6/4/2004 Simultaneous use ofmag torquers andthrustersThe telemetry monitors in the attachments should be added tothe Rtworks checks page “CDH_C”. They should initially all beset to “skip”. Once in use operationally, the limits and “verify”will be adjusted to detect multi-bit upset events in the onboardcomputers.Update the real time system to reflect the attached calibrationand limit changes.See SCR3240 folder for change requests.At the request of <strong>Stanford</strong> because of the 2nd thruster failure,make the modifications necessary to provide the capability tosimultaneously use magnetic torque rods and thrusters for ATCcontrol.<strong>Gravity</strong> <strong>Probe</strong> B — <strong>Post</strong> <strong>Flight</strong> Analysis • Final <strong>Report</strong> March 2007 243
Table 8-4. SCRs Addressed in On-orbit S/W Change3243 6/4/2004 Modified thrusterdistribution algorithm3244 6/11/2004 Modification to nulldumping scheme3245 6/11/2004 Mode 1B bias estimateupdate3246 6/11/2004 Update hard-codedstar sensor db3247 6/11/2004 Modifications to dragfreesafemode test3248 6/11/2004 Modify loss of dragfreesafe mode macroDue to 2nd thruster failure, and the possibility of losingadditional thrusters, modify the MSS to include GeometricLogic algorithm to mitigate this problem. Provide commandsand data base readout capability to determine theconfiguration. This capability will co-exist with the currentpseudo-inverse approach, and a control flag which can beverified by DBRO will be used to select which approach to use.The default will be the Geometric Logic approach.See attachmentThe null dumping scheme needs to be modified due to thethruster distribution change. Ref. SC3243During Mode 1B operations it was discovered that the gyro biasestimate was only correct for one vehicle axis. Modify the codeto make it correct for x and y axes.The star sensor data base has the following hard-codedparameters (Jon-TBD)Star_Mag_Limit_Comp(1)=3.0Star_Mag_Limit_Cat(1)=3.0It was determined from flight experience that system efficiencyis increased if they are updated. A CSTOL patch was used toupdate them via release message, but with MSS3.4.3 the CSTOLwill no longer have valid addresses.<strong>Stanford</strong> has requested two new capabilities1) In primary drag-free mode, provide a return to drag-freeoption for 3 attempts in the event drag-free is dropped.2) In backup drag-free, stop translation control in the event ofreturn to analogIn a requirements review meeting held on Thursday, 6/10/04, itwas decided that modifying this safemode test was the favoredapproach. The test will check the following, and each check canbe independently enabled or disabled by command, withDBRO verification:1) RSS of error above a limit2) Arbiter state - analog3) DF_state (not=) DF_cmdThere will also be macro changes as specified in SCR3248 and3249As part of SCR3247, the loss of drag-free safe mode macroneeds to be modified to accommodate the options specified inSCR3247.[6/14/04 O. Chan] The safing responses for drag-free Test asbelow:SMACRO07 to mask for GSS arbiter state checkSMACRO29 to mask for drag-free data limit and status checks[7/22/04 O.Chan] No further implementation on Automaticallyreentry to primary drag-free.244 March 2007 Chapter 8 — Other Spacecraft Subsystems Analyses
Table 8-4. SCRs Addressed in On-orbit S/W Change3250 6/14/2004 Change sanity checkaxis indices3251 7/9/2004 <strong>Post</strong>-launch VMSmacro changes3252 7/12/2004 Update special macrosfor 125 bps uplink3253 7/12/2004 <strong>Post</strong> launch safemodemacro changesRef SCR3168.The ATC slope sanity check requires the same change to theaxis designation.Add GV45 to skip star present in guide star valid VMSmacrosif star not present, branch spcp f to mode 2a and branch thecurrent spcp to 0Add GV46 to skip shutter commands in guide star valid andinvalid VMS macrosCycle (command) shutter open/closed (GV46 = 0)Do not cycle shutter open/closed (GV46 = 1)Set GV46 to 1 in FSW InitializationAdd GV47 to skip star acquisition in mode 2A or 2B VMSmacrosDefault to no star acquisition to leave in gyro hold (GV47 = 0)Star acquisition (GV47 = 1)Set Observer to gyro hold in mode 3A VMS macroAdd star present command to Guide Star Valid to detectloss of starPerform ST present at beginning of GS valid macro if star notpresent branch to Mode 2A (GV45 = 1)Fix SAA_In macro to be like Guide Star Invalid macroDon’t use Telescope data when in SAAFix SAA_Out macro to be like Guide Star Valid macroUse Telescope data when out of SAAAdd local variables 5, set LV5 =1 in GS Valid and SSA_Outmacros, set LV5 = 0 in GS_Invalid and SSA_In macrosLV5 = 0, don’t reconfigure Observer and Att_Control modesNote: Deliver command template and CSTOL procedures to setGV45, 46, 47Updates special macros to include 125bps uplink.Update to reflect desired safemode responses, and deletion ofcontent of macros no longer required for flight operations.Thruster Current 2 test monitors the open loop thrusters(1,5,6,7,8)Thruster Pressure 2 test monitors the closed loop thrustersThruster Pressure 1, Current 1 tests must be always disabled(CARD)Star sensor aliveness and reasonableness autonomous switchto mode 2A gyro holdRevise response to control gyro saturation and body rate tests<strong>Gravity</strong> <strong>Probe</strong> B — <strong>Post</strong> <strong>Flight</strong> Analysis • Final <strong>Report</strong> March 2007 245
The software and macro changes resulting from these SCRs were verified and validated using the testssummarized in the Table 8-5. The testing was, naturally, all performed in the ITF to provide the highest fidelityenvironment possible.Table 8-5. Tests Executed and Passed to Verify SCRsTest IDTFSW0013TMSSSCR3242TMSSSCR3243TMSSSCR3243_2TMSSSCR3243_3TMSSSCR3245TMSSSCR3246TMSSSRC3247TMSSSCR3251TMSSSCR3252TMSSSCR3253Test DescriptionGyro Uncage / drag-free, Backup drag-free, drag-free Sensor FailureDrag-free Control Performance VerificationThruster Distribution Algorithm Performance VerificationAdditional Thruster FailureMSS version 3_4_3_0 Unit TestingMode 1B Bias CalculationGndRT v5.1.3 Real-Time Ground System TestingLoss of drag-free Safemode ResponseVMS Macros v2.11 TestSpecial Macros v2.11 TestSafemode Macros v2.11 TestThe implementation of these SCRs took place in two sessions: first the software changes to the ATC andSafemode tests, then the VMS and Safemode macro changes. On June 25, 2004 the ATC S/W Change <strong>Flight</strong>Readiness Review (FRR) was held and approved pending closure of a few tests still in analysis.The process of changing the software in the CCCA is a lengthy one. It is possible to implement patches oroverlays to the RAM but any changes implemented this way would vanish if the computer rebooted andreloaded itself from EEPROM. Instead the EEPROM has to get updated and the preferred, most reliable way toachieve that is to start by loading a new image into the Solid State Recorder (SSR, where there are severalmemory boards dedicated to holding images of the FSW) and then from there into the CCCA EEPROM whilethe CCCA is operating under the Start-UP ROM (SUROM).This was an impressive process. From problem identified in 17 May to software solutions developed, coded,tested, and loaded onto the spacecraft by 30 June with the corresponding VMS, Safemode, and Special macroscoded, tested, and loaded by 3 August. All of this was achieved while the operations team (and note that thedevelopment team was also part of the on-call operations support team) continued with the IOC testing andcalibration on the vehicle.Given an uplink rate of 1024 bps at best and 128 bps at worst the process of uplinking several megabytes of codeis tedious. 3 days was required to load and verify the new CCCA image on the vehicle. The new image wasstarted via a commanded A-side reboot on 29 July 2004 and the final VMS, Safemode, and Special macros wereinstalled on the vehicle by 3 August.8.5.5 Safemode DiscussionAll spacecraft must face the possibility that some critical hardware element will fail, putting the long term safetyof the spacecraft and the mission at risk. The <strong>GP</strong>B <strong>Flight</strong> Software mitigates this risk with its Safemodeapplication. This basic idea of this application is to perform tests on selected telemetry monitors from thehardware or software; tests which compare the measured values of these monitors against limits that can be246 March 2007 Chapter 8 — Other Spacecraft Subsystems Analyses
configured on-orbit as required. If a test fails then a failure counter is incremented, otherwise the failure counteris set to 0. if the failure counter exceeds a limit (also configurable on-orbit) then a configurable set of predefinedand preloaded safemode macros are activated. Breaking it down we get:• There are 98 tests across the C&DH, ATC, Payload, EPS, and Thermal subsystems. Each test can beenabled or disabled by real-time or stored commands. The test failure limits and the consecutive failurelimit for each test can be altered by real-time or stored commands. The safemode macros to activatewhen the test exceeds its consecutive failure limit are also configurable via real-time or storedcommands.• There are 47 safemode macros that do everything from switching to the backup computer to doingnothing (allows notification of the hardware failure status to be quickly noticed but leaves the responseto the <strong>GP</strong>B staff).• Once a test has been activated it will not activate again until re-enabled preventing an “infinite loop” ofsafemode responses. Further, once a safemode macro has been activated it won’t activate again until reenabled.Figure 8-36 illustrates the structure of a safemode test.Figure 8-36. Structure of a Safemode TestFigure 8-37 is an excerpt from a table made during March 2005 while the Safemode configuration was beingevaluated. Note that some tests are disabled, primarily the secondary tests that would get enabled when theprimary test failed.Figure 8-37. Excerpt from Safemode Status in March 2005<strong>Gravity</strong> <strong>Probe</strong> B — <strong>Post</strong> <strong>Flight</strong> Analysis • Final <strong>Report</strong> March 2007 247
Figure 8-38 below is an excerpt from the Test Description Table in the Safemode Design Document. It providesfor each test a concise description of the test and the Safemode response to the test failure.Figure 8-38. Excerpt from Test Description Table in Safemode Design DocumentThe general health and safety of the <strong>GP</strong>B spacecraft is monitored by the Safemode application.8.5.6 CCCA Single Bit ErrorsOne obstacle that must be overcome by any spacecraft is the space radiation environment that has noticeableadverse affects on electronic equipment. This radiation is the result of charged particles, some of which can beattributed to cosmic events or solar activity, interacting with the Earth’s magnetic field and colliding withorbiting spacecraft. Collisions with electronic circuitry are commonly manifested as Single Event Upsets (SEUs)or Single Bit Errors (SBEs).248 March 2007 Chapter 8 — Other Spacecraft Subsystems Analyses
Due to the shape of the Earth’s magnetic field and the orbital altitude of <strong>GP</strong>B, a majority of charged particleinteractions occurred either over the North / South poles or over the South Atlantic Anomaly (SAA).Figure 8-39shows the locations of SBEs aboard <strong>GP</strong>B during a typical period of the science data collection phase.Figure 8-39. Location of Single Bit Errors during Science Data CollectionThe <strong>GP</strong>B <strong>Flight</strong> Software together with Error Detection and Correction (EDAC) circuitry in the CCCA areresponsible for monitoring the effect of this radiation on the memory components of all subsystems. A portionof the overall processing is dedicated to a continuous memory scrub that cycles through all onboard memoryevery 2.5 seconds. This function is able to detect and correct Single-Bit Errors (SBEs) automatically. The EDACcircuitry can also detect Multi-Bit Errors (MBEs)—the corruption of more than one bit within the same 64-bitmemory word—but MBEs must be corrected manually. See section “CCCA Multi-Bit Errors” on page 252 formore information about the autonomous detection and manual correction of MBEs.SBEs occurred at a relatively consistent rate throughout the <strong>GP</strong>B mission, subject to increases and decreasesdepending on solar activity and variations in the Earth’s magnetic field. Data from typical one month periodsduring science data collection using both the A and B side CCCA are plotted in Figure 8-40 and Figure 8-41.These plots represent common SBE rates during periods of normal solar activity. The CCCA A-side(Figure 8-40) experienced about 8.7 SBEs per day during the period between October 10, 2004 and November10, 2004. The CCCA B-side (Figure 8-41) detected about 7.6 SBEs per day during the period between April 10,2005 and May 10, 2005. In general, a slightly higher SBE rate was observed during operation on the A-sideCCCA as compared to the B-side CCCA.<strong>Gravity</strong> <strong>Probe</strong> B — <strong>Post</strong> <strong>Flight</strong> Analysis • Final <strong>Report</strong> March 2007 249
Figure 8-40. A-side CCCA Single Bit Errors from Oct. 10, 2004 to Nov. 10, 2004Figure 8-41. B-side CCCA Single Bit Errors from Apr. 10, 2005 to May 10, 2005250 March 2007 Chapter 8 — Other Spacecraft Subsystems Analyses
Increased SBE rates were observed during the periods of high solar activity that resulted from solar flares andcoronal mass ejections. The best example of this occurred on Jan. 20, 2005 when a powerful X7 solar flareerupted into what was considered the strongest radiation storm since October 1989. Figure 8-42 shows protonflux data measured by the GOES11 satellite during the 3-day period from January 19 to January 22, 2005. Thestrength of this particular solar flare was due to the large number of high energy (>100 MeV) particles detected,represented by the green line in Figure 8-42. High-energy proton flux increased to a level four orders ofmagnitude greater than normal. Onboard SBE data over the same time span (January 19 to January 22) isdisplayed in Figure 8-43. At the peak of the solar event, the FSW detected and corrected over 60 SBEs in aperiod of 5 hours, a rate 40 times greater than standard levels.Successful error detection and correction was an important function of the <strong>GP</strong>B flight software, functionallyinsulating sensitive <strong>GP</strong>B electronics from the harmful space radiation environment. The FSW memory scrubroutine adequately protected the spacecraft from any hazardous conditions that could result from corruptedmemory caused by single bit errors.Figure 8-42. Proton Flux measured by GOES11 satellite during January 20, 2005 solar flare<strong>Gravity</strong> <strong>Probe</strong> B — <strong>Post</strong> <strong>Flight</strong> Analysis • Final <strong>Report</strong> March 2007 251
Figure 8-43. A-side CCCA Single Bit Errors during January 20, 2005 solar flare8.5.7 CCCA Multi-Bit ErrorsOther less common manifestations of charged particle collisions with spacecraft circuitry are Multi-Bit Errors(MBEs), defined as the simultaneous corruption of more than one bit within a 32-bit memory word. If thememory scrub routine detects a MBE, the flight software cannot autonomously correct the error, as it does witha SBE. As a result, other methods are needed to protect the spacecraft from corrupted memory caused by MBEs.Most spacecraft experience MBEs infrequently (on the order of ~1 per year). The MBE rate observed by <strong>GP</strong>Bwas significantly higher than expected. This rate is apparent when plotting the locations corresponding todetected MBEs during the first year of <strong>GP</strong>B on-orbit operations, as shown in Figure 8-44. This plot also showsthat the majority of MBEs occurred near the North / South poles and the SAA. The higher-than-expected MBErate resulted in a concentrated post-launch effort to further understand the increased susceptibility to multi-biterrors, further protect the vehicle from problems as a result of MBEs, and accelerate the process of identifyingcorrupted memory locations and patching the errors.252 March 2007 Chapter 8 — Other Spacecraft Subsystems Analyses
Figure 8-44. Location of Multi-Bit Errors during the first year of on-orbit operationsBuilt-in safemode protection against multiple CCCA MBEs in the same memory scrub cycle was exercised morethan once on-orbit. When activated, this safemode response resulted in either a B-side “block switch”, with theredundant B-side CCCA / C&DH system taking over for the A-side equipment, or a reboot of the B-side CCCA.While disruptive to any ongoing activities, including science data taking, this response resulted in theautonomous clearing of any MBEs in the system, ensuring vehicle safety. The first time this safemode responseactivated, during IOC, the software team successfully recovered the spacecraft back to the A-side equipment.Per plan, when this safing action occurred during science data collection, the CCCA was kept on the B-side forthe remainder of the mission. Figure 8-45 shows the cumulative MBE count (in the CCCA only) from launchthrough the end of May 2005. The pink shaded regions represent operation on the B-side CCCA.Figure 8-45. Cumulative CCCA MBE count from launch through end of May 2005.<strong>Gravity</strong> <strong>Probe</strong> B — <strong>Post</strong> <strong>Flight</strong> Analysis • Final <strong>Report</strong> March 2007 253
When single MBEs did not result in autonomous safemode response, affected memory locations were manuallypatched in order to avoid executing corrupted code or accessing corrupted memory values. The software teamdeveloped a valuable set of tools that allowed rapid identification, diagnosis, and correction of MBEs. Thesetools consisted of realtime diagnostic commands that displayed the address of affected locations in memory andthe (corrupted) value of that memory location. This information allowed software engineers to assess theoperating risk imposed by the MBE, and to verify that the memory location had not been overwritten since theMBE was detected. Occasionally, MBEs would corrupt areas within a data buffer that were overwritten soonafter corruption—these became known as “self-clearing MBEs”. After diagnostic data was collected and itconfirmed that an MBE had occurred, the FSW team utilized the Integrated Test Facility to develop realtimecommands to manually rewrite the affected memory locations to their expected value. The entire process, fromdetection through patching, was routinely performed in less than 6 hours throughout the <strong>GP</strong>B mission. Theplanning and forethought that resulted in this efficient set of tools for correcting MBEs ensured minimal sciencedata loss due to corrupted onboard memory.254 March 2007 Chapter 8 — Other Spacecraft Subsystems Analyses
9Gyro Suspension Subsystem (GSS) Analysis<strong>Gravity</strong> <strong>Probe</strong> B — <strong>Post</strong> <strong>Flight</strong> Analysis • Final <strong>Report</strong> March 2007 255
256 March 2007 Chapter 9 — Gyro Suspension Subsystem (GSS) Analysis
The Gyroscope Suspension System’s (GSS) role in <strong>Gravity</strong> <strong>Probe</strong> B is to electrostatically suspend the sciencegyroscopes within their housing cavities so that the gyroscopes may spin freely with minimal friction and torqueso that they may perform their role as local inertial space references.To perform its mission successfully, the GSS must satisfy a number of core requirements:1. Operate over 8 orders of force magnitude; the same system must be able to suspend the gyroscopes onEarth in a 1 g field as well as generate minimal disturbances at the 108 g level during data collection.2. Suspend the gyroscopes reliably; the system must never let a spinning rotor touch the housing. There issufficient mechanical energy in a rotor spinning at 60 Hz to effectively destroy the rotor and housing insuch an event.3. Operate compatibly with the SQUID readout system. The SQUID magnetometers are very sensitive,thus the suspension system must not interfere with these sensors during ground and on-orbit operation.4. Minimize electrostatic torques during science data collection. The suspension system must meetcentering requirements with minimal control effort and thus with minimal residual torques on therotors.5. Apply controlled torques to the rotor for calibration and initial rotor spin axis alignment.6. Act as an accelerometer as part of the “drag-free” translation control system to further minimize classicaltorques on the rotors.All of these requirements were met during the <strong>GP</strong>-B mission, and the suspension systems continue to operatewell following the depletion of helium from the dewar since they do not require cryogenic electronics tofunction.Figure 9-1. Block diagram of the payload electronics package showing the interconnect of the GSS units<strong>Gravity</strong> <strong>Probe</strong> B — <strong>Post</strong> <strong>Flight</strong> Analysis • Final <strong>Report</strong> March 2007 257
9.1 GSS Hardware DescriptionFigure 9-1 shows the four GSS units and their relationship to the rest of the payload electronics package. Eachgyroscope has a dedicated GSS system, and each GSS system comprises two electronics enclosures: forward andaft (see Figure 9-2).Figure 9-2. Photograph of GSS units. Aft processor and power supply (left), forward quiet analogelectronics (right). One pair is required for each gyroscope. During the mission, thetemperature of the aft assembly ranges between 300 K and 320 K; the forward assembly range is 265 K to 300 K.The forward electronics unit (FSU) resides in the spacecraft’s forward equipment enclosure (FEE), that ispassively thermally controlled to a range of 300-320K over the mission. The FSU contains the sensitive analogelectronics that are used to sense the position of the rotor and apply suspension voltages. A block diagram ofthis system is shown in Figure 9-3. The main components of this system are described in the following subsections:9.1.1 Low voltage drive amplifierDuring nominal science operation, voltages are applied to the electrodes through six ±50V low noise amplifiers;the bandwidth of these amplifiers was set by design to 100 Hz. Each amplifier has a input filter set that allowstwo modes of operation: 1) constant gain to DC, and 2) a band pass mode that rolls off the gain below 1 Hz to10% of the nominal peak. The DC mode is provided to simplify the design and operation of the backup analogcontrol loops. The band pass mode is used to limit the electrostatic force noise on the gyroscope by allowingonly signals in the neighborhood of the 30 Hz AC science drive carrier to make their way to the gyroscope.9.1.2 High voltage drive amplifierA ±1600 V set of amplifiers is used during ground test and gyroscope spin-up to provide enough electrostaticforce on the gyroscopes to suspend them in a 1g field or while spin-up gas is flowing in the channel. 1g groundsuspension requires approximately 650V to maintain suspension once centered, and roughly twice that to pickup the rotor from the housing wall. Gas spin up requires ~150V per axis to hold the gyroscope in the spin-upchannel. Nominal bandwidth of these amplifier is 2 kHz and power draw during spin-up is 0.8 W per channel.The output of the low and high voltage amplifiers is switched to the gyroscope by a 3 HV RF vacuum relay, oneper electrode. Switch time is approximately 1 ms, during which the rotor is not under active suspension control.During the mission, many checks are made on vehicle activity prior to making the switch to ensure the gyro willnot move significantly during this uncontrolled period.258 March 2007 Chapter 9 — Gyro Suspension Subsystem (GSS) Analysis
9.1.3 Computer driveSix parallel 16-bit digital to analog (D/A) converters are controlled by the GSS processor (mounted in the aftenclosure) and control algorithms running in his processor send voltage commands through the D/Aconverters to both the high and low voltage amplifiers. Nominal update rate for the system is 220 Hz in sciencemode and 660 Hz during spin-up.9.1.4 Position BridgeFigure 9-3. Block diagram of the Forward Suspension Unit (FSU)A 3 phase, 34.1 kHz sinusoidal position bridge is used to measure the position of the rotor in the housing. Theridge sense signal amplitude is selectable between 20 mV-pp and 200 mV-pp. The nominal bridge noise is 1nm/rtHz and the bandwidth is approximately 1 kHz. Each bridge channel is digitized by a 16-bit successiveapproximationanalog to digital converter and this information is sent at the control sample rate to the GSSprocessor.9.1.5 Analog Backup ControllersThree all-analog backup controllers are provided to cover all flight operational modes. These controllers areproportional-derivative (PD) architecture and are designed to center the gyroscope in the event of a failure ofthe computer to maintain positive control of the gyroscopes. During science data collection, two controllers areavailable: science mission high backup (SMHB) and science mission low backup (SMLB). The high backupcontroller is designed to have sufficient gain and bandwidth to allow re-centering of the under a worst-case 1km-m/sec micrometeoroid strike. This controller can use most of the 50 V range of the low voltage amplifierand is needed primarily to insure gyroscope safety, but will subject the rotor to higher suspension forces andtorques than the experiment error budget allows. The low backup controller is much less aggressive and isdesigned to emulate the normal science mission suspension voltages. In this mode, forces and torques are<strong>Gravity</strong> <strong>Probe</strong> B — <strong>Post</strong> <strong>Flight</strong> Analysis • Final <strong>Report</strong> March 2007 259
significantly reduces and thus preserves to a much larger extent the science mission configuration whilecomputer control is re-established. In spin-up mode, a similar controller is provided to hold the rotor inposition in the spin-up channel while gas is flowing if the computer control should fail during this critical phase.9.1.6 Suspension arbiterAn autonomous state machine in the FSU is used to monitor the health of the digital suspension algorithm andimmediately switch to a backup system should a fault be detected. The arbiter monitors the health of the GSSprocessor via a heartbeat keep-alive circuit and the gyro position via radius-from-center position thresholds.Should either of these tests fail the backup system is engaged. In science mode, initially the control is passed thehigh authority backup controller (SMHB). Once the gyro position is stable for 30 seconds, control is passed tothe low authority (SMLB) controller until the computer is ready to take control. In the event of a positionexcursion greater than the position threshold (> 10 μm), the high authority controller is used until the positionsettles again. Before control may be passed back to the flight computer, a handshake set of commands must besent to the FSU to convince the arbiter that the computer is healthy and read to take back control. A statetransition diagram for this arbiter is shown in Figure 9-4.9.1.7 Mode RegisterFigure 9-4. GSS Arbiter State Transition diagram.A bank of 16 latching relays are used to hold the configuration of the FSU (bridge amplitude, suspension mode,low voltage amplifier configuration, threshold enables, etc.). This set of relays are highly radiation tolerant andretain their state should power be removed, thus they are a very stable source of configuration informationshould the aft computer need to be rebooted during the mission (this was never necessary, however).260 March 2007 Chapter 9 — Gyro Suspension Subsystem (GSS) Analysis
9.1.8 Forward Communication LinkThe forward unit communicates with the aft unit via a pair of unidirectional parallel data busses, one aft-toforwardand one forward-to-aft. Timing signals, including the 34.1 kHz bridge excitation signal is provide viathis link.The GSS aft control unit (ACU) houses the GSS flight processor card, associated support circuitry, and thepower supply for the GSS string. A block diagram of this unit is shown in Figure 9-5. This unit is mounted onthe aft truss of the spacecraft, and thus is subject to wider temperature swings, approximately 265K to 300K9.1.9 RAD6000 ProcessorEach GSS employs a dedicated Lockheed-Martin Federal Systems (now BAE) RAD6000 processor, running at16.368 MHz. On board is 1 MB of EEPROM and 3 MB of static RAM. The processor communicates with thespacecraft via a Mil-Std-1553 serial link and with the GSS electronics via a parallel port on the processor card.This processor hold the gyro suspension system software and telemetry processing needed to receive commandsand send measurements to the ground via the spacecraft processor (CCCA). The telemetry system continuouslyprovides data at 2 to 5 second intervals of gyro position, control effort, suspension voltages applied, system state,analog monitor points, box temperatures, and other engineering information. Also available are high-speedsnapshots consisting of 12 seconds of full rate suspension control loop measurements and commands.9.1.10 Mux and TimingFigure 9-5. Block Diagram of the Aft Suspension Unit (ACU)The aft multiplexer and timing (AMT) card collects analog telemetry monitors from the aft box (power supplyvoltages, temperatures, etc) and generates the suite of timing signals for the GSS string.<strong>Gravity</strong> <strong>Probe</strong> B — <strong>Post</strong> <strong>Flight</strong> Analysis • Final <strong>Report</strong> March 2007 261
9.1.11 Clock synchronizationThe aft clock support card (ACS) receives the master 16.368 MHz clock from the spacecraft, as well as the 10 Hztiming strobe, and uses a phase locked loop to synchronize a local oscillator to this timing source. This permitsthe GSS string to operate in perfect clock synchronization to the spacecraft and thus prevent any EMI clockbeating effects that are possible with non-synchronized clocks. Should the external source be lost, the localoscillator will free-run and allow the suspension system to function without interruption.9.1.12 Aft Comm LinkThe Aft communications link (ACL) is the mate to the forward communications link (FCL) and enables the twosubsystems to communicate.9.1.13 Power supplyMounted external to the ACU enclosure is the GSS power supply, a custom designed DC/DC converter set tosupply the required voltages to the system. This is the lighter colored box to the left of the black ACU box inFigure 9-2. This system supplies single-string +3.3, +5.0 and ±15.0 volts to the ACU as well as redundant +5,±12, and high voltage (either ±800 or ±1200) to the forward suspension unit. A block diagram of the powersystem is given in Figure 9-6. In addition to supplying electronics power, the system also supplies voltages forsurvival heaters used when the boxes are unpowered. Normal operation generates sufficient heat naturally toeliminate their need during the IOC and science data gathering phase of the mission.Figure 9-6. Block diagram of the GSS power system.262 March 2007 Chapter 9 — Gyro Suspension Subsystem (GSS) Analysis
9.2 Suspension Controller DesignThis section describes the design and operation of the gyro suspension controller.9.2.1 Controller description and space of operationThe position of each gyroscope rotor in its housing is sensed through and electrostatic centering forces areapplied via six circular electrodes located on the gyroscope housing wall (Figure 9-7). This non-contactsuspension eliminates gimbal and bearing torques evident in other mechanical gyroscopes. The residualelectrostatic torques that do remain are proportional to 1) the rotor’s spherical asymmetry, 2) the rotor’s massimbalance,3) spin axis misalignment from the vehicle roll axis, and 4) the magnitudes of the electrostaticsuspension fields. The GSS is designed to minimize the electrostatic suspension fields while keeping the rotorcentered against external disturbances.Figure 9-7. Photograph of rotor and housing. Suspension electrodes and spin-up channel are clearly seen.Low-torque operation requires the control authority (bandwidth) of the controller to be minimized. Thedisturbance environment, however, is characterized by random micrometeoroid strikes that can applyimpulsive disturbances as large as 10,000 times the nominal acceleration environment. A fixed control schemethat can handle these impulses produces gyroscope disturbance torques far in excess of mission requirements.An adaptive Linear Quadratic Estimator (LQE) control algorithm has been developed to meet the high dynamicrange requirements for the mission’s electrostatic suspension. The controller architecture is novel because ituses estimates of the plant’s state, rather than estimates of the plant’s parameters, as inputs for adaptation(Figure 9-8). This allows the algorithm to dynamically increase its control authority and bandwidth to the levelneeded to respond to large impulsive disturbances while continuously minimizing control authority - andtorques - during nominal operation. The net result of this scheme is that the control system performs like ahigh-bandwidth and high authority controller with respect to disturbances that move the rotor far from thecommanded position, but performs like a low-bandwidth, low-authority control system with respect togyroscope disturbance torques. Figure 9-9 shows the simulated response to variously sized micrometeoroids;this performance has been verified in orbit. This variable bandwidth control scheme, in part, allows the <strong>GP</strong>-Bmission achieve its goal for the non-relativistic residual gyroscope precession rate of less than 1.6×10 11 deg/hr.<strong>Gravity</strong> <strong>Probe</strong> B — <strong>Post</strong> <strong>Flight</strong> Analysis • Final <strong>Report</strong> March 2007 263
Figure 9-8. Block diagram of the LQE control architecture.This algorithm is implemented in a radiation-hardened digital computer based on a Power PC-derived BritishAerospace (formerly Lockheed-Martin Federal Systems) RAD6000 processor running at 16.368 MHz within thesuspension electronics package. To achieve maximum performance from the processor, a custom single-thread,non-preemptive real time operating system was written for this application. During peak demand periodsduring spin-up operations, the processor is loaded to 96% of its capacity; science operation requiresapproximately 65% of capacity The code for this application is small, however, only occupying 500 kB ofmemory. The range of external accelerations that can be handled by the digital control algorithm is shown inFigure 9-10.Figure 9-9. Simulated response of adaptive LQE controller showing constant excursion for varying disturbanceThe digital controller is able to operate over 8 orders of magnitude of force disturbances while minimizing thetorques on the gyroscope rotors. The primary science mode digital suspension operates over a specific forcerange from 10 7 m/s 2 to 10 2 m/s 2 and bandwidths of 1.5 Hz to 8 Hz, respectively, at a sample rate of 220 Hz. The264 March 2007 Chapter 9 — Gyro Suspension Subsystem (GSS) Analysis
spin-up controller bandwidth is not adaptive, has a 660 Hz sample rate, and has been designed to reject thedisturbances from the spin-up gas flow. During spin-up, electrostatic torques are not a concern, thus acomputationally simpler, fixed control scheme is used. This system is also able to suspend a gyroscope in thelaboratory in 1 g conditions, and can apply up to 1600 VDC to provide the required electric fields to suspend onthe ground for performance testing. Computer systems are notoriously unreliable in a space radiationenvironment. Three all-analog backup control systems are also provided to suspend the gyroscope in the eventof a computer fault.Figure 9-10. Suspension Controllers and Modes of Operation showing the 8 ordersof magnitude of operation for this system.The spin-up backup controller is used during gas flow operations, and the two science mode backups are activeduring the remainder of the mission. The all-analog controllers are robust proportional/derivative (PD) designswith a force-to-voltage nonlinearity inversion circuit to allow good control over the range of motion of the rotorin the housing. The primary role of these controllers is to prevent the rotor from contacting the housing wall,thus an integral term in the controller is not needed which significantly simplifying the design of thesecompensators. An analog arbiter (see the FSU block diagrams above) monitors computer health and rotorposition and will autonomously switch into the appropriate backup controller in the event of a computer faultor a large position excursion of the rotor. This architecture permits the controller to operate over the required 8orders of force magnitude, providing reliable suspension of the rotors (via prime and backup systems), andminimize electrostatic torques on the rotor via the variable bandwidth adaptive control law.9.2.2 Controller performance on OrbitThe GSS system performed very well on orbit and was able to successfully suspend, support spin-up, and alignthe spin axes of the gyros to mission requirements.9.2.2.1 Science SuspensionBecause of the robustness and simplicity of the control algorithms, the gyroscopes were initially suspendedusing the analog backup control system. Figure 9-11 shows a snapshot of the trajectory of the Gyro 2 positionon its inaugural on-orbit suspension. The gyro was initially sitting on the housing wall in the C electrode axis<strong>Gravity</strong> <strong>Probe</strong> B — <strong>Post</strong> <strong>Flight</strong> Analysis • Final <strong>Report</strong> March 2007 265
direction (transverse to the space vehicle roll axis). Suspension voltage was applied at 0.5 seconds and remainedon until 6.0 seconds, after which the rotor was left unsuspended and it began to “fall”. The kinks in thetrajectory after the 6 second mark are points where the rotor “bounced” on the housing wall. The rotor is drivenhere by centrifugal acceleration of the housing with respect to the rotor. (This test was done prior to the finalmass trim of the spacecraft roll axis.) This test and others verified the functioning of the analog backup controlsystem on orbit.Figure 9-11. Initial suspension of gyroscope in analog backup mode (blue=A axis, green = B, red = C)The performance of the digital LQG controller was demonstrated by a series of step responses starting at 8 μmfrom the center of the housing. As is seen in Figure 9-12 and in more detail in Figure 9-13, the step responseshow high frequency (high bandwidth) overshoot oscillations when away from center and well damped (lowbandwidth) overshoot for steps near the center of the housing. The bottom plot in Figure 9-12 shows thebandwidth that the controller automatically selected during this run, ranging from 50 rad/sec (8 Hz) when therotor was far from center, down to 10 rad/sec (1.6 Hz) at the end of the snapshot. The controller bandwidthbottoms out at 3 rad/sec (0.5 Hz) during normal science operation.266 March 2007 Chapter 9 — Gyro Suspension Subsystem (GSS) Analysis
Figure 9-12. GSS step response in Science mode, showing control stiffness as a function of miscentering.Figure 9-13. Details of control response showing high-bandwidth (left) low-bandwidth (right) operation.<strong>Gravity</strong> <strong>Probe</strong> B — <strong>Post</strong> <strong>Flight</strong> Analysis • Final <strong>Report</strong> March 2007 267
9.2.2.2 Spin-up SuspensionDuring spin-up operations, much higher suspension voltages and control efforts are required to suspend thegyroscope against the spin-up gas. Figure 9-14 shows the control effort exerted by the suspension system (top)and the required electrode voltages to produce the force (bottom). A peak voltage of 150 VDC is required tosuspend the rotor against the push of the spin-up gas at full flow rate – 40 mN peak (0.06 g equivalentacceleration). Nominal flow rate is 725 sccm at a temperature 6 K. To apply these DC high voltages, the GSShigh voltage amplifier system and 660 Hz spin-up controller was required.Figure 9-14. GSS control efforts during full flow gyroscope spin-up operations(top plot: blue = A, green = B, red = C)9.2.2.3 Spin axis alignmentThough a core requirement of the experiment is to minimize GSS-induced disturbance torques on thegyroscope rotor, it is desired to align the spin axis of the rotor after gas spinup to within 1 arc-sec (2.8 × 10 4 deg)of a target orientation near line of sight of the guide star. This alignment establish the initial conditions for theexperiment.In the GSS, the electric fields used to suspend the rotor can be chosen to either enhance or minimizeelectrostatic torques on the gyroscope. By judicious choice of electrode voltages, the net electric field intensityon one axis can be made preferentially larger or smaller than the other axes, while staying consistent with theforce constraints needed to hold the rotor centered in the cavity. When the interaction of this electric field268 March 2007 Chapter 9 — Gyro Suspension Subsystem (GSS) Analysis
imbalance with non-spherical component of rotor shape (centrifugal bulging due to spin plus natural 10 nmlevel out-of-roundness terms) it is found that the gyroscope will tend to precess around the electrode axis withthe largest preload electric fieldDuring science data gathering, the suspension electric fields are reduced to the levels needed to meet thegyroscope centering and safety requirements which results in approximately 200 mV on the electrodes. Duringalignment, however, the electric fields are increased by a factor 300 over the science levels and explicitimbalances are introduced to increase the torques on the rotor by a factor of approximately 100 million over thenominal science levels.Using the SQUID output as a measure of the gyroscope’s orientation, a bang-bang control scheme is used toswitch the dominant preload between two electrode axes that are oriented at a 45 degree angle from the vehicleroll axis, the A and B electrode axes. Proper phasing of this signal allows the spin axis orientation to be movedfrom the post spin-up orientation — up to 500 arc-sec from the vehicle roll axis — to a final, specified,orientation within 10 arc-sec of the roll axis.Figure 9-15. Simulated (L) and actual (R) spin axis alignment tracks for Gyro 3 coarse alignmentFigure 9-15 (left) shows the trajectory of a gyro spin axis during the alignment process; the goal is the circle nearthe origin. With this system, alignment rates on the order of 3 arcsec/hr can be generated when driven by thehigh voltage amplifier using 50 V common mode on the electrode axes (coarse alignment mode), while rates of0.1 arc-sec/hr with a 8 V drive from the low voltage amplifiers (fine alignment mode); see Figure 9-16. Thespiral shape of the predicted trajectory is expected because a convenient, though sub-optimal, switching surfacewas used in the bang-bang controller: the pickup loop on the gyroscope parting plane.Figure 9-15 (right) shows the actual performance for the spin axis alignment of Gyro 3; note that the gyroscopefollows a similar curve to the prediction. All four gyroscopes were aligned successfully using this method.<strong>Gravity</strong> <strong>Probe</strong> B — <strong>Post</strong> <strong>Flight</strong> Analysis • Final <strong>Report</strong> March 2007 269
Figure 9-16. Predicted and measured drift rates for coarse and fine alignment modes.9.2.3 Drag-Free controlIn addition to gyroscope suspension, the GSS system interacts with the vehicle’s ATC system to permit dragfreecontrol of the vehicle to eliminate the effects of environmental forces on the vehicle. There are twoequivalent ways of canceling the spacecraft disturbances: First, the spacecraft can fly to follow an internalunsupported proof mass by minimizing the relative position of the spacecraft with respect to the proof mass(this is called a “primary” or “unsuspended” drag-free), and second by suspending the internal proof mass andcontrolling the spacecraft to keep the suspending forces a minimum (called “backup” or “suspended” drag-free).These are equivalent in function, but the backup mode is more robust especially when the clearance between thespacecraft and the proof mass must be minimized to achieve an accurate relative orientation measurement, as isnecessary in the <strong>GP</strong>-B case.Both “prime” and “backup” drag-free modes were part of the ATC design and have been exercised on orbit.Implementation details for both modes are given below:9.2.3.1 Unsuspended or “prime” drag-free mode:In this mode, the suspension system of the drag-free reference gyroscope is placed in a standby mode and therotor is allowed to freely float while the vehicle flies to keep the rotor at the center of the housing cavity. TheGSS monitors the position of the gyroscope in the housing and only allows rotor position excursions ofapproximately ±4μm from center of the 32μm rotor/electrode gap prior to disabling the drag-free mode and recenteringthe gyroscope electrostatically. At 4500 RPM, there is sufficient mechanical energy in the rotor todestroy the gyroscope assembly should the rotor come into contact with the housing wall. Therefore,conservative limits have been built into the suspension system to preclude this possibility during normaloperation.The ATC system regulates the position of the inertial mass of the spacecraft, R, with respect to the position ofthe gyroscope, r, as shown in Figure 9-17. The GSS passes rotor position information to the ATC controllerthrough the interface gain K1. The controller is implemented as a 3-axis PID controller with sufficient gain atthe space vehicle roll frequency to meet its 1×10 -11 m·sec -2 residual acceleration requirement. Calculations areperformed in the nadir frame and are rotated into the vehicle body frame for application.270 March 2007 Chapter 9 — Gyro Suspension Subsystem (GSS) Analysis
All drag-free sensors are subject to a gravity gradient force since the center of mass of the space vehicle isapproximately 23 cm away from the location of the first gyroscope; each subsequent gyroscope is 8.8 cm furtherfrom the vehicle mass center along the vehicle roll. The gravity gradient acceleration is on the order of 4×10 7m/s 2 on the rotor closest to the vehicle mass center (Gyroscope 1) and increases linearly with distance to theother gyroscopes. Drag-free operation in effect moves the vehicle point of free fall to the location of the dragfreegyroscope, thereby reducing the gravity gradient acceleration on the other gyroscopes as well.To aid the controller in rejecting this significant disturbance, a gravity gradient feed-forward signal, scaled bythe distance from the vehicle center of mass to the center of the gyroscope housing, is generated and added tothe thrust commands send to the space vehicle. In this case, the controller works primarily to reject the effects ofvehicle resonance modes (minimal) and external disturbances from atmospheric drag, solar pressure, and otherenvironmental disturbances.The main advantage of this mode is that the rotor is free-floating, and thus it represents the purestimplementation of a drag-free system and, in principle, to the greatest extent minimizes the torques on therotors – a great value for this experiment. However, this topology does have some particular disadvantages for<strong>GP</strong>-B.Figure 9-17. Unsuspended or “prime” drag-free control topology.Because of the need to protect the spinning rotor, the drag-free system is only allowed to operate in a relativelynarrow dead band around the center of the housing. This leads to more frequent drag-free shutdowns by theGSS when the vehicle encounters external environments that temporarily overwhelm the capability of the ATCsystem, approximately 5 mN per vehicle axis.This mode also does not allow for acceleration bias compensation in the sensor since it relies on relativeposition of the rotor and housing as its input. Any force (due to an electrical patch charge, for example) betweenthe rotor and housing will cause the rotor to accelerate toward the housing. In turn, the vehicle will accelerate tofollow. To hold the rotor at a fixed position in the housing, the ATC system would need to apply a constantacceleration the vehicle which would change the orbit over time.9.2.3.2 Suspended or “backup” drag-free mode:In this mode, the gyroscope is suspended in science configuration by the GSS and the drag-free system flies thevehicle to minimize the measured suspension forces on the gyroscope. The ATC system works to drive themeasured control effort on the proof mass, u, to zero via translation control commands, U, as shown in<strong>Gravity</strong> <strong>Probe</strong> B — <strong>Post</strong> <strong>Flight</strong> Analysis • Final <strong>Report</strong> March 2007 271
Figure 9-18. The GSS passes rotor control effort information to the ATC controller through the interface gainK2; any accelerometer biases are removed on the translation control side of the interface. At low frequency, nearspace vehicle roll rate, the transfer function from U to u is simply a constant, and in principle, a simple integralcontrol is all that is required to minimize u. The controller is implemented in the same structure as thesuspension-off drag-free mode, but with different coefficients. <strong>Gravity</strong> gradient feed forward is again applied tocompensate for known large disturbance acceleration.The chief advantage of this mode is that the spinning gyroscope is always actively centered by the GSS, and thusis at minimal risk of contacting the housing wall. In addition, acceleration is measured directly and thus a postmeasurementaccelerometer bias adjustment can be readily made in the ATC system; this feature was exercisedon orbit as noted below.The disadvantage to the science measurement is that the drag-free gyroscope is always suspended, and thus issubject to greater electrostatic torques than a free-floating gyroscope due to the active suspension. However, thisis not a significant disadvantage, since three of the four gyroscopes in primary drag-free mode need to besuspended against gravity gradient in any case, and the experiment error due to these residual forces has beenshown to be well within the requirements.Figure 9-18. Suspended or “backup” drag-free control topology.9.2.3.3 Drag-free <strong>Flight</strong> PerformanceThe design of the space vehicle permits any gyroscope to act as the drag-free reference; on orbit, the selection ofthe gyroscope to serve as the drag-free sensor was largely driven by practical, operational concerns. Tominimize the overall residual gravity gradient acceleration the gyroscopes, Gyroscopes 2 or 3 (near the center ofthe linear array) are preferable. Gyroscope 4 is the furthest from the center of mass of the vehicle, and thuswould require the most thrust – helium usage – to force the space vehicle to free fall around its center.Gyroscope 2, early on, required some control system tuning to optimize suspension performance and thus wasnot used for drag-free control during testing. Thus, drag-free testing and optimization was done withGyroscopes 3 and 1.Both the primary and the backup drag-free control modes were tested on the vehicle. Figure 9-19 shows anexample transition sequence from non-drag-free, to suspended (backup) drag-free to free-floating (primary)drag-free control. During these transitions, the transfer of the gravity gradient acceleration moves from thegyroscope to the space vehicle ATC system as the space vehicle is forced to free-fall about the drag-free sensor.In prime drag-free mode, the suspension control efforts are disabled, so the vehicle must fly around the positionof the rotor. Additional control effort activity in the ATC system is seen during this period.272 March 2007 Chapter 9 — Gyro Suspension Subsystem (GSS) Analysis
Though prime drag-free is the preferred operational mode, it was not used during the science data gatheringphase of the mission. After on-orbit calibration, it was found that some gyroscopes exhibited a smallacceleration bias, up to 20 nN, that the prime drag-free system would track; though this bias would have noeffect on the drift performance the gyroscopes, the ATC control action over time would slowly change the spacevehicle’s orbit. The backup drag-free system could properly compensate for these biases and showed acceptableperformance for the mission during testing, thus it was selected as the baseline drag-free mode during sciencedata collection.Figure 9-19. Drag-free transitions: Backup and primeRepresentative backup drag-free performance is shown in Figure 9-20. The top curve shows the spectrum of thespace vehicle translation control effort showing the twice-orbit frequency gravity gradient signature at 3.4×10 4Hz (red line); the peak at 1.7×10 4 Hz is the suspension system measuring the 10 nm rotor asphericity asmodulated by rotor’s polhode motion. The residual acceleration on the rotor is 4×10 11 m/s 2 from < 0.01 mHz to10 mHz in inertial space (averaging period: 24 hours). If the gyroscope is viewed as an accelerometer, theacceleration measurement noise floor is 1.2×10 9 m/s 2·Hz 1/2 in inertial space. Performance of the gyroscopes asaccelerometers is limited by noise introduced through coupling from the spacecraft’s pointing system and thelow signal-to-noise ratio on position sensing bridge, as required for compatibility with the SQUID readoutsystem. A <strong>GP</strong>S receiver on board the spacecraft measures the position of the vehicle in orbit and is used,together with ground-based laser ranging data, to confirm that the resulting vehicle orbit is indeed drag-free.This orbit data has been used to identify and remove force biases in both the ATC and GSS systems<strong>Gravity</strong> <strong>Probe</strong> B — <strong>Post</strong> <strong>Flight</strong> Analysis • Final <strong>Report</strong> March 2007 273
Figure 9-20. Representative drag-free performance together with gravity gradientacceleration on the space vehicle9.3 GSS SoftwareThe GSS software (GSW) residing in the RAD6000-based processors in each chain performs the controlcalculations and telemetry processing required to operate the suspension for each gyroscope. The code itself waswritten in the C language, rather than ADA used on the CCCA and the SRE systems, for two reasons: 1)compatibility with prototype code developed at <strong>Stanford</strong> prior to the design of the GSS, and 2) efficiency inexecution to allow the flight system to suspend a gyroscope on the ground. To this end, the VxWorks operatingsystem used on the CCCA and SRE subsystems was replaced with a single thread, non-preemptive real timeoperating system with a fixed scheduler. Since the GSS processor needed to execute a real-time control loop athigh speed without hiccups, the software team could control explicitly the priority of the control calculationswith other less-critical telemetry or housekeeping functions. This level of explicit control also made the codingof the transitions between spin-up and science configurations much more tractable.The code image is relatively small at 480 kB; with data storage and scratchpad space, the code occupied about37% of the 3 MB static RAM aboard the RAD6000 processor.274 March 2007 Chapter 9 — Gyro Suspension Subsystem (GSS) Analysis
A number of different applications ran on the processor during the mission.1. I/O and Scheduler. Communication with the GSS hardware via a parallel port and the CCCA via theMIL-STD-1553 link. Processor management via the scheduler with cycle times of 220 Hz in sciencesuspension mode, 660 Hz in spin-up suspension mode, and 1320 Hz in ground-test mode.2. Gyro Suspension. Implements the bandwidth on demand LQR control algorithm noted above, in eitherspin-up or science mode.3. Summit RAM Refresh. Performs scrubbing of radiation induced errors in the MIL-STD-1553 interfacethat is not covered by the main processor error correction circuitry.4. RAM Scrub. Performs scrubbing of radiation induced errors in the main processor SRAM. Detectsmulti-bit errors.5. Snapshots. Collects 12 seconds of full suspension rate (220 Hz) snapshots of gyro position and controleffort data. Not available in spin-up mode due to processor loading constraints.6. ATC Filter. Low pass filter for drag-free data being send to the CCCA.7. Charge Measurement. Presents excitation voltages to the gyro electrodes and performs on-boardfiltering to assess the charge on the rotor.8. Charge Control. Manages the charge control electrode drive during rotor discharge operations.9. Science Filter – Electrode voltage. Low pass filter that computes the mean and square of the 6suspension voltages and passes the data to telemetry.10. Science Filter – Gyro position. Low pass filter that computes the gyro position along the 3 suspensionaxes and passes the data to telemetry.11. Science Filter – Gyro control effort: Low pass filter that computes the control effort applied to the gyroalong the three suspension axes passes the data to telemetry.12. Database Readout: Used for reading and updating user-configurable software parameters.Table 9-1and Table 9-2 present the processor loading for various operational configurations in science andspin-up modes used during the mission.Table 9-3 lists the source lines of code (SLOC) for the variousapplications; 21,600 lines of C code were required to implement the suspension features required by <strong>GP</strong>-B.Table 9-1. GSS Science Mission Mode (220Hz) CPU UtilizationApplicationAllapplicationsOffSuspensiononlySteady state inScience MissionPeak load duringdatabase dumpI/O and Overhead 20.3 20.3 20.3 20.3Gyro Suspension — 36.5 36.5 36.5Summit RAM Refresh — — 0.6 0.6RAM Scrub 5.0 5.0 5.0 5.0Snapshot — — 6.5 6.5ATC Filter — — 0.1 0.1Charge Measurement — — 2.2 2.2Charge Control — — 0.3 0.3Science Filter – Electrode— — 2.0 2.0voltageScience Filter –Gyro position — — 0.9 0.9<strong>Gravity</strong> <strong>Probe</strong> B — <strong>Post</strong> <strong>Flight</strong> Analysis • Final <strong>Report</strong> March 2007 275
Table 9-1. GSS Science Mission Mode (220Hz) CPU UtilizationApplicationAllapplicationsOffSuspensiononlySteady state inScience MissionPeak load duringdatabase dumpScience Filter – Gyro control— — 0.9 0.9effortDatabase Readout— — — 4.7GIO parametersCPU Utilization% 25.3 61.8 75.3 80.0Table 9-2. GSS Spin-up Mode (660Hz) CPU UtilizationApplicationAllapplicationsOffSuspensiononlySteady statewith ScienceFiltersSpin AxisAlignmentPeak loadduringcommandI/O and Overhead 40.9 40.9 40.9 40.9 40.9Gyro Suspension — 38.8 38.8 40.2 40.2Summit RAM Refresh — 0.6 0.6 0.6 0.6RAM Scrub 5.0 5.0 5.0 5.0 5.0Snapshot — — — — —ATC Filter — — — — —Charge Measurement — — — — —Charge Control — — — 0.2 0.2Science Filter –— — 2.8 2.8 —Electrode voltageScience Filter –Gyro— — 2.2 2.2 —positionScience Filter – Gyro— — 2.2 2.2 —control effortSet gyro position— — — — 7.1vector commandCPU Utilization% 45.9 85.3 92.5 94.1 94.0Table 9-3. GSW application source lines of code (SLOC) metricsReqtsparagraphGSWApplicationSub-ApplicationReqIDUnit sourcefilename SLOC SecMemorysize5.1.6.1 GSWSchedulerSHGshg.cshg.commonshg.h7759113811948168100.text.rodata.data11948168100dT_10Hz.cdT_10Hz.commondT_10Hz.h129131813163220.text.rodata.data13163220dT_220Hz.cdT_220Hz.commondT_220Hz.h439136055683212.text.rodata.data55683212276 March 2007 Chapter 9 — Gyro Suspension Subsystem (GSS) Analysis
Table 9-3. GSW application source lines of code (SLOC) metrics (Continued)ReqtsparagraphGSWApplicationdT_660Hz.cdT_660Hz.commondT_660Hz.hdT_summit.cdT_summit.commondT_summit.h5.1.6.2 Initialization GIN gin.cgin.h5.1.6.3 GSS DataManagement5.1.6.3.1 GSS CmdRouterGDMGCRgcr.cgcr.commongcr.h5.1.6.3.2 GSS Tlm Proc GTP gtp.cgtp.commongtp.h5.1.6.3.3 GSS CmdProc5.1.6.4 I/OProcessing5.1.6.4.1 1553Interface5.1.6.4.2 ExpansionBus I/FGCPGIOGIFGSBgcp.cgcp.commongcp.hgio.cgio.commongio.hgif.cgif.commongif.hgsb.cgsb.commongsb.hgswBIC.cgswBIC.commongswBIC.hgswSTIC.h5.1.6.5 Checks GCK gck.cgck.commongck.h5.1.6.5.4 RAM Scrub GRS grs.cgrs.commongrs.h5.1.6.5.6 SUMMIT RAMRefresh5.1.6.6 GSS SupportProcessingSub-ApplicationReqIDGSR<strong>GP</strong>PUnit sourcefilename SLOC Secgsr.cgsr.commongsr.h88013134135131866512018294564310931123412224123586120794468539323572171185251030191537171313124321213163220.text.rodata.data.text.rodata.data13124321213163220156 .text 156984282848964012334848682800104100682828767608192164.text.rodata.data.text.rodata.data.text.rodata.data.text.rodata.data.text.rodata.data.text.rodata.data9842828489640123348486828001041006828287676081921642428 .text 242810522843482884242816.text.rodata.data.text.rodata.data.text.rodata.dataMemorysize10522843482884242816<strong>Gravity</strong> <strong>Probe</strong> B — <strong>Post</strong> <strong>Flight</strong> Analysis • Final <strong>Report</strong> March 2007 277
Table 9-3. GSW application source lines of code (SLOC) metrics (Continued)ReqtsparagraphGSWApplicationSub-Application5.1.6.6.1 GSS ATC Proc <strong>GP</strong>A gpa.cgpa.commongpa.h5.1.6.6.2 GSS SnapshotProcessing5.1.6.6.3 Gyro ControlProcessing5.1.6.6.5 GSSDiagnostics5.1.6.6.6 Gyro ChargeControlReqIDGSPGYPGDPGCCUnit sourcefilename SLOC Secgsp.cgsp.commongsp.hgyp.cgyp.commongyp.haod1.caod1.haod1imp.caod1imp.hcontrol1.ccontrol1.hinl1impl.cinl1impl.hcvecmath.ccvecmath.haod_smm_cpf.c288152315662625515649619022327780186344120349487051123324104128338965625104252882881252358016841730810084386496125024368414532304177 21885044aod_sum_cpf.c 177 21465124aod_gtm_cpf.c 178 21964964aod_ctm_cpf.c 178 21644964gdp.cgdp.commongdp.hgcc.cgcc.commongcc.hgmp.cgmp.commongmp.hfir880.hfir9600.h21189241772121162119204431708496376672248867232842680.text.rodata.data.text.rodata.data.text.rodata.data.text.rodata.data.text.rodata.data.text.rodata.data.text.rodata.data.text.rodata.text.rodata.data.text.rodata.data.text.rodata.data.text.rodata.data.text.rodata.data.text.rodata.data.text.rodata.dataMemorysize33241041283389656251042528828812523580168417308100843864961250243684145323042188504421465124219649642164496431708496376672248867232842680278 March 2007 Chapter 9 — Gyro Suspension Subsystem (GSS) Analysis
Table 9-3. GSW application source lines of code (SLOC) metrics (Continued)ReqtsparagraphGSWApplicationSub-ApplicationReqIDUnit sourcefilename SLOC SecMemorysize5.1.6.6.7 GSSHardwareCommandGHWghw.cghw.commonghw.h8202511910400123168.text.rodata.data104001231685.1.6.7 ScienceSuppotProcessingSCSscs.cscs.commonscs.h22822112872568.text.rodata.data28725685.1.6.7.1 ElectrodeVolt FilterEVFevf.cevf.commonevf.h18312152908563768.text.rodata.data29085637685.1.6.7.2 PositionSignal FilterPSFpsf.cpsf.commonpsf.h17310152664563584.text.rodata.data26645635845.1.6.7.3 Control EffortFilterCEFcef.ccef.commoncef.h17310152664563584.text.rodata.data2664563584UtilitiesnewtRaphRoot.cnewtRaphRoot.h67767640.text.rodata67640timeFuncs.ctimeFuncs.h443672080.text.rodata72080taylorSeriesTrig.ctaylorSeriesTrig.h5061080128.text.rodata1080128Total SLOC 216039.4 References9.4.1 Engineering DocumentsW.J. Bencze. Gyroscope Spin Axis Direction Control for the <strong>Gravity</strong> <strong>Probe</strong> B Satellite. Ph.D. Dissertation, Dept. of ElectricalEngineering, <strong>Stanford</strong> University. December, 1996.M.L. Eglington, Authority-on-Demand Adaptive Suspension Control for the <strong>Gravity</strong> <strong>Probe</strong> B Gyroscopes. Ph.D. Dissertation,Dept. of Aeronautics and Astronautics, <strong>Stanford</strong> University. August, 2000.An Electrostatic Suspension and Orientation Control System for the <strong>Gravity</strong> <strong>Probe</strong> B Relativity Mission's Science Gyroscopes byWilliam J. Bencze, Yueming Xiao, David N. Hipkins, Bradford W. Parkinson, and Gene F. Franklin whichwas presented at the 3rd International Conference on Motion and Vibration Control (3rd MOVIC),September 1996, Chiba, Japan.Gyroscope Spin Axis Direction Control for the <strong>Gravity</strong> <strong>Probe</strong> B Satellite by William J. Bencze, Yueming Xiao, David N.Hipkins, Bradford W. Parkinson, and Gene F. Franklin which was presented at the 1996 IEEE Conferenceon Decision and Control, December 1996, Kobe Japan.<strong>Gravity</strong> <strong>Probe</strong> B — <strong>Post</strong> <strong>Flight</strong> Analysis • Final <strong>Report</strong> March 2007 279
The Design and Testing of the <strong>Gravity</strong> <strong>Probe</strong> B Suspension and Charge Control Systems. S. Buchman, W. Bencze, R. Brumley,B. Clarke. G.M. Keiser. LISA Symposium. in William M. Folkner, Ed. Laser Interferometer Space Antenna,Second International LISA Symposium on the Detection and Observation of Gravitational Waves in Space,Pasadena, California, July 1998, AIP Conference Proceedings 456, American Institute of Physics,Woodbury, New York, 1998.Precision Electrostatic Suspension System for the <strong>Gravity</strong> <strong>Probe</strong> B Relativity Mission’s Science Gyroscopes by W.J. Bencze, R.W.Brumley, M.L. Eglington, S. Buchman, SICE Annual Conference, August 2003, Fukui, Japan.On-orbit Performance of the <strong>Gravity</strong> <strong>Probe</strong> B Gyroscopes and Electrostatic Suspension System. W.J. Bencze, D.N. Hipkins, Y.Ohshima, T. Holmes, G.M. Keiser, B. Muhlfelder, S. Buchman, C.W.F Everitt. SICE Annual Conference,August 2005, Okayama, Japan.W.J.Bencze, D.B.DeBra, L.Herman, T.Holmes, M.Adams, G.M.Keiser, C.W.F Everitt, On-Orbit Performance of the<strong>Gravity</strong> <strong>Probe</strong> B Drag-Free Translation Control System. 29th AAS Guidance & Control Conference, Breckenridge,CO, February 4-8, 2006. AAS 06-083.Software Design DocumentsSCSE04-6 Rev C: <strong>Flight</strong> Computer Memory and Timing Analysis. Lockheed Martin, April 2003 (LM/P086705C)SCSE16-8 Rev B: <strong>Flight</strong> Software Design Specification; GSS Software. Lockheed Martin, April 2003 (LM/P086919B)SCSE16-9 Rev H: <strong>Flight</strong> Software Design Specification; External Interface Detailed Design. Lockheed Martin, April 2003(LM/P086868H)280 March 2007 Chapter 9 — Gyro Suspension Subsystem (GSS) Analysis
10SQUID Readout Subsystem (SRE) Analysis<strong>Gravity</strong> <strong>Probe</strong> B — <strong>Post</strong> <strong>Flight</strong> Analysis • Final <strong>Report</strong> OMarch 2007 281
282 March 2007 Chapter 10 — SQUID Readout Subsystem (SRE) Analysis
The SQUID gyroscope readout system is used for measuring the spin axis orientation of the <strong>Gravity</strong> <strong>Probe</strong> B(<strong>GP</strong>-B) gyroscopes to a precision of 1 milliarcsecond (3x10 -7 degrees) in 10 hours of integration time. Thecryogenic portion of the readout system uses a dc SQUID to measure the gyroscope’s London magneticmoment. Room temperature electronics appropriately bias the dc SQUID allowing the detection andamplification of the gyroscope signal. We describe the system hardware including improved electronics andpackaging. We present payload test and flight performance data.10.1 IntroductionThe <strong>GP</strong>-B experiment requires a determination of the gyroscope precession rate with an error of less than 0.3milli-arcsec/yr. The readout system provides this function. The basis of the readout system is as follows: Thespinning gyro rotor generates a magnetic dipole, known as the London moment, which is perfectly co-alignedwith the spin axis of the rotor. Any change in the orientation of the spin axis causes a change in the orientationof the London moment. A pickup loop, placed in very close proximity to the rotor, intercepts this changingLondon moment. A superconductive signal cable connects the pickup loop to a dc SQUID (SuperconductingQuantum Interference Device). Since the magnetic flux threading the pickup loop is conserved, a current isgenerated when the London moment changes orientation. Also, because the pickup loop is tied to the spacecraftbody, all of the gyroscope spin axis orientation information is upconverted to the spacecraft’s roll frequency.Using a conventional, flux-locked loop configuration, the SQUID detects and amplifies the current signal.The coupling between the gyroscope and SQUID is (Lockhart, 1986):SQUID_FLUX M ⋅ N* ⋅ B Lπr 2 sin( θ)= -----------------------------------------------------L TEquation 10-1where M is the mutual inductance between the SQUID and its input coil, N* is the effective number of turns inthe pickup loop, B L is the equivalent magnetic field associated with the London moment, r is the radius of therotor, θ is the angle formed by the gyroscope’s spin axis and the pickup loop and L T is the sum of the pickuploop inductance, SQUID input coil inductance and any stray inductance. For the <strong>GP</strong>-B configuration, thegyroscope spin axis lies nearly in the plane of the pickup loop and sin(θ) can be approximated by θ, yielding asimple, linear relationship between gyroscope angle and SQUID flux.Readout noise is a significant component of the total measurement error of the <strong>GP</strong>-B experiment. Computersimulations (Haupt, 1996) predict that the gyroscope’s readout noise must be better than about 0.2 arcsec/√Hzor equivalently, a resolution of 1 marcsec in 10 hours of integration time. Using the linear relationship betweengyroscope angle and SQUID flux, we can express the gyroscope readout noise as a SQUID magnetic flux noise.Doing so, we find that the SQUID flux noise must be ≤ 50 μΦ o /√Hz. This noise performance must be achievedat the roll rate of the spacecraft, ≥ 5.5 mHz.In addition to SQUID noise as described above, readout gain and bias variations contribute to readout error.Spurious bias variations synchronous with the relativistic signals must be limited to 0.1 marcsec or 20 nΦ o(Haupt, 1996). As discussed below, we have considered various environmental factors which might lead to smallbiases. We have designed and tested the hardware to ensure that these bias effects are kept adequately small.Gain variations must also be controlled. The initial gyro signal (due to spin axis misalignment) will be of order10 arcsec. A slow, constant drift in readout gain would mimic a constant drift rate in the gyroscope. We mustlimit or measure gain variation in the readout system to 1 part in 10 5 per year (equivalent to 0.1 marcsec/yr drift<strong>Gravity</strong> <strong>Probe</strong> B — <strong>Post</strong> <strong>Flight</strong> Analysis • Final <strong>Report</strong> March 2007 283
ate uncertainty). Although we have designed and tested the hardware to limit gain drift, we have alsoimplemented a readout calibration system to measure the system’s gain, and if necessary, to compensate forgain drift.The performance attributes of noise, bias stability and gain stability have played a central role in developing thehardware. To achieve adequate performance, several environmental factors must be considered includingmagnetic and electromagnetic interference, thermal variations, and proton bombardment. As will be discussedin the next section, the hardware has been designed to tolerate these conditions.10.2 Hardware DescriptionThe SQUID carrier lies at the heart of the readout system and contains a Quantum Design dc SQUID die, anoutput transformer, a thinfilm feedback transformer, blocking resistors, and a resonance damping network.Photolithographically patterned Nb traces allow for superconductive connections. Au-Nb pads located near theSQUID and feedback transformer allow ultrasonic wedge bonds using Pb-In-Au wire. At other locations on thecarrier, Cu-Nb pads allow us to solder resistors, a damping network and an output transformer onto the carrier.The resistors isolate the SQUID from cable capacitance. The RC damping network helps to control parasiticinteractions between the SQUID and its input coil. Finally, the output transformer matches the outputimpedance of the SQUID to the input impedance of the room temperature electronics. The SQUID carrier ishoused inside a SQUID package. Through use of Ge resistance thermometers, heaters and high thermalconductivity sapphire and niobium construction materials, precision temperature control is possible.The pickup loop is a thinfilm structure and is fabricated on the parting plane of the gyroscope’s housing. Aniobium coating, 400 nm thick, is sputtered onto the housing using a dc magnetron system and patterned into a4 turn loop using photolithographic techniques. The signal cable connects the loop to the SQUID using springloadedjoints at each end. These joints have been designed to remain loaded during launch and thermal cycling.The signal cable has a solid Nb shield and passes through a 10 nF feedthrough filter to protect the SQUID fromEMI.284 March 2007 Chapter 10 — SQUID Readout Subsystem (SRE) Analysis
Figure 10-1. Gyroscope SQUID Readout SystemAs illustrated in Figure 10-1 above, changes in magnetic flux through the pick-up loop induce a current (I L ) inthe superconducting pick-up circuit, which is coupled to the SQUID through the mutual input inductance (M I ).The SQUID converts this current to a voltage which is read by the FLL electronics which provide a feedbackcurrent (I F ) coupled to the pick-up circuit through mutual inductance (M F ) in order to null changes in the inputcurrent (I L ). Offset and calibration currents (I O and I C ) are also coupled to the input circuit through M F . TheFLL voltage output provides a measure of the changing flux through the pick-up loop, the low-passedcomponent of which provides measure of the London Moment.The SQUID is operated in a flux-locked loop using low noise, analog electronics. Four circuits are used witheach SQUID to provide flux modulation current (at 420 kHz), dc bias current, feedback current (100 kHzbandwidth), and to receive the SQUID’s output voltage. A constant amplitude ac current source is summed intothe feedback line to provide a calibration of the system’s gain. The feedback current contains the relativity andother information. A signal proportional to this current is filtered, digitized, stored, and ultimately sent to theground. The electronics are located within a large Forward Equipment Enclosure (FEE) to prevent directexposure to the sun. The FEE has been designed to passively stabilize the temperature without causing excessiveheat build-up. In addition, key electronic components are temperature controlled.A previous paper (Lockhart, 1986) describes a multi-layered shield design to reduce both dc and ac magneticfields at the <strong>GP</strong>-B gyroscope. This shield has been designed to limit the magnetic field trapped in the rotor to auniform equivalent field of ≤ 1 μG. This shield also attenuates ac magnetic fields, which are coupled into thepickup loop as it passes through the earth’s magnetic field, by a factor greater than 10 12 .<strong>Gravity</strong> <strong>Probe</strong> B — <strong>Post</strong> <strong>Flight</strong> Analysis • Final <strong>Report</strong> March 2007 285
All of the <strong>GP</strong>-B electronics have been designed to be as quiet as possible to limit the amount of EMI reaching thereadout system. The readout system itself is very well shielded; its cables are filtered and are nearly light tight.We have also considered EMI sources external to the experiment. Although the <strong>Probe</strong> and dewar make anexcellent electrostatic shield, a window is provided for the telescope to view the guide star. We reduce theleakage through this window by metalizing it and by using EMI absorbing materials in the telescope’s sunshade.Together, these measures provide at least 40 dB of attenuation to 10 GHz.The payload electronics includes two forward SREs in order to provide readout system redundancy and ensureoverall reliability. Figure 10-2 below shows a schematic diagram of the forward SRE units.Figure 10-2. SQUID Readout Electronics (SRE) – Forward UnitsBoth forward units are operated simultaneously. FWD SRE A controls the SQUIDs for gyroscopes 1 and 3 andthe SQUID bracket temperature control for SQUIDs 1 and 2 while FWD SRE B controls the SQUIDs forgyroscopes 2 and 4 and the SQUID bracket temperature control for SQUIDs 3 and 4. The sub-blocks locatedwith the FWD SRE include; FLL = Flux locked Loop electronics, DAC = Digital to Analog conversionelectronics, DAS = Data Acquisition System and BTC = Bracket (SQUID) Temperature Control electronics aswell as power management, auxiliary analog test ports and communications blocks. The SRE subsystem alsoprovides power, digital communications and digital processing for the Telescope Readout Electronics (TRE).The payload electronics also includes two AFT SREs (A and B) in order to provide readout system redundancyand ensure overall reliability. Figure 10-3 below provides a schematic diagram of these aft SRE units.286 March 2007 Chapter 10 — SQUID Readout Subsystem (SRE) Analysis
Figure 10-3. SQUID Readout Electronics (SRE) – Aft UnitsAt most one AFT SRE is operated at any one time. The AFT SREs manage power and communications for theforward SRE/TRE units. They also contain a payload processor running software particular to the SRE/TRE andan oven controlled crystal oscillator (OCXO), which provides a single accurate timing to all the payloadelectronics.Figure 10-4 below contains a diagram of the SRE sub-system architecture.Figure 10-4. SQUID Readout Electronics (SRE) – Sub-system ArchitectureThe cross-strapping shown in Figure 10-4 above provides full redundancy of the AFT electronics and partialredundancy of the forward boxes. In the event of a failure of a single forward SRE, SQUID temperature control(BTC) may be maintained on both remaining SQUIDs using the remaining forward unit.<strong>Gravity</strong> <strong>Probe</strong> B — <strong>Post</strong> <strong>Flight</strong> Analysis • Final <strong>Report</strong> March 2007 287
10.3 Pre-Launch Ground-Based TestsWe performed ground-based readout system noise measurements in both isolated, quiescent conditions as wellas in the full <strong>GP</strong>-B payload configuration. Several years ago (Lockhart et al., 1994), we achieved a single-sidedSQUID noise of 30 μΦ o /√Hz (equivalent to 120 marcsec/√Hz) at a frequency of 5.5 mHz. The readout noiserequirement of 190 marcsec/√Hz (equivalent to 50 μΦ o /√Hz) was met in the full <strong>GP</strong>-B configuration duringpayload testing. Improved EMI rejection allowed us to eliminate a lossy SQUID input filter which had beenused in earlier tests. Removing this filter reduced SQUID noise and increased gyroscope coupling efficiency.Both of these effects translate into improved readout noise performance. In addition, the SQUID packages weretemperature controlled to limit thermally induced drift and the use of normal metal near the pickup loop waslimited to minimize Johnson noise.Ground tests confirmed the coupling between the rotor’s London moment and the output of the readoutsystem, thus confirming Equation 10-1. Furthermore, on-orbit environments were simulated to ensure that thereadout system would continue to perform adequately. Specifically, we tested the readout system for magneticand electromagnetic effects, thermal sensitivities, proton induced upsets and nonlinear behaviors.The earth’s magnetic field could couple into the readout system to mimic the science data. There are separateimpacts for AC and DC fields. We demonstrated flux trapping in the gyro rotor of less than 1 μG (uniform dcfield equivalent). This performance met our needs at dc. Some of our earlier tests had shown that theattenuation of ac magnetic fields was limited by leakage into the SQUID package. In tests of an isolated SQUIDpackage, a Pb-Sn gasket placed between the SQUID package and lid reduced this leakage by a factor of 50yielding a residual leakage of approximately 1 mΦ o /G. An end-to-end readout system ac shielding testdemonstrated adequate performance.Figure 10-5 shows a plot of SQUD noise data obtained during a payload test of the SRE system. The data werecollected through the SRE DAS. The sampling rate was 1 Hz but the low pass digital filter was not active. Evenwithout the low pass filter active, SQUIDS 2, 3 and 4 meet spec. SQUID 1 is 20% above spec. Proper filteringbrings all SQUIDS into spec (see the third column of data shown directly below the figure).288 March 2007 Chapter 10 — SQUID Readout Subsystem (SRE) Analysis
Figure 10-5. SQUID Noise Data - Payload TestTable 10-1. Calculations of true noise for each of the four SQUIDsSQUIDNoise @ 5.55 mHz(μΦ 0 /√Hz) measuredWhite Noise (μΦ 0 /√Hz)measured level at 0.5 HzNoise at 5.55 mHz (μΦ 0 /√Hz)after subtractionof aliased noise1 56 50 302 45 28 373 46 33 344 36 19 31To calculate the true noise at 5.55 mHz the excess (aliased) white noise in the data above must be subtractedfrom the measured noise at 5.55 mHz. The amount of noise to be subtracted from each FFT bin is the noisebetween the Nyquist sampling frequency (0.5 Hz) and the filter passband frequency (4 Hz). This is 7/8 of thepower as measured at 0.5 Hz. After subtraction of this aliased noise all four SQUIDs meet spec.In Figure 10-6 below, external AC magnetic fields applied to the payload show a response in the SQUIDs at theapplied frequency. For reference, the applied field is indicated on the charts in Figure 10-6 at the allowedamplitude at the roll frequency (nominally 5.5 mHz). This amplitude is below the SQUID noise floor at 5.5 mHzso measurements were performed at higher frequencies of 100 mHz and 50 mHz. The SQUID response at thesefrequencies shows the expected attenuation dependence on frequency and is consistent with meeting the ACshielding requirement at the roll frequency.<strong>Gravity</strong> <strong>Probe</strong> B — <strong>Post</strong> <strong>Flight</strong> Analysis • Final <strong>Report</strong> March 2007 289
Figure 10-6. AC Magnetic Shielding – Payload TestThermal fluctuations of both the SQUID and its electronics correlate with bias variations of the readout system;we therefore control the temperature of both. (Thermal fluctuations also correlate with gain fluctuations, butthe associated requirements are straightforward to meet). In addition, we minimize the sensitivity of the systemto any residual thermal variations. We must limit to 20 nΦ o the bias variations which mimic the science data.We have measured the thermal sensitivity of isolated SQUIDs and have found a coefficient of approximately 10mΦ o /K. Although we do not fully understand the cause, in some cases the thermal sensitivity of the completereadout system can be as much as 1 Φ o /K.Temporarily raising the temperature of the superconductive signal cable above its transition temperaturerestores the sensitivity to approximately 10 mΦ o /K. Furthermore, 2 μK temperature control of the SQUID hasbeen achieved using two nested feedback control loops. In addition, the temperature of the liquid helium bath isregulated and there are various passive control elements. We have measured the electronics sensitivity tothermal fluctuations. We achieved an electronics temperature coefficient of 50 μΦ o /K during early testing andhave reached 20 μΦ o /K by selecting electronic components with little temperature sensitivity. A 20 μΦ o /Ktemperature coefficient implies a 1 mK temperature control requirement for the electronics at roll frequency.For each SQUID, the measured bias temperature coefficient is less than the required 0.01 Φ 0 /K, as shown inTable 10-2 and Figure 10-7 below. The trend in the data taken between 2.92 K and 4.35 K indicates the biastemp-co will meet specification for all four SQUIDS over the full science range of 2.7 to 3.0 K.290 March 2007 Chapter 10 — SQUID Readout Subsystem (SRE) Analysis
Table 10-2. Measured SQUID bias temperature coefficientsSQUIDBias Temp-co (Φ 0 /K)1 0.000492 0.001803 0.000894 0.00095Figure 10-7. SQUID Temperature Coefficient – Payload TestIn Figure 10-8 below, the vertical axis scale multiplier is x10 -3 (overwritten by chart title). No temperaturecontrol was used until vehicle time 2.225e4 s, then coarse mode control until 2.310e4 s, then fine mode control.The peaking filter was turned on at 2.440e4 s.<strong>Gravity</strong> <strong>Probe</strong> B — <strong>Post</strong> <strong>Flight</strong> Analysis • Final <strong>Report</strong> March 2007 291
Figure 10-8. Temperature Error of SQUID Bracket Temperature Control Test at August 8 2001 18:19-20:19Figure 10-9. Square Root of Power Spectrum Magnitude of the Temperature ErrorNonlinear readout behavior can cause biases which mimic the relativity signals. The signal from the gyroscopeis detected by the SQUID and since there is finite gain in the electronics, only a portion of this signal is nulled bythe feedback electronics. The associated error interacts with the SQUID’s nonlinear voltage vs. flux curve andcauses the signal to be distorted and aliased to dc. We have analyzed this phenomenon (Gutt et al., 1993) andhave achieved adequate readout system performance by requiring and attaining adequately linear SQUID292 March 2007 Chapter 10 — SQUID Readout Subsystem (SRE) Analysis
voltage vs. flux characteristics (less than 1% deviation from a straight line over the expected operating range of0.02 Φ o ) and by requiring and achieving sufficiently high open-loop gain of the electronics (greater than 100 at1 kHz).Tests were also performed to evaluate the readout system’s performance in the presence of EMI. We divided theEMI into 2 broad frequency ranges: below and above 1 GHz. EMI below 1 GHz was coupled via pickup oncables entering the <strong>Probe</strong>. We were able to reduce readout EMI sensitivity for these frequencies byimplementing a variety of cable upgrades including 2 layers of electrostatic shielding, solid cable shields, andimproved cable filters. Signals above 1 GHz were found to pass through the telescope window reaching the<strong>Probe</strong> interior. Shielding the window significantly reduced high frequency EMI related effects.On orbit the <strong>GP</strong>-B spacecraft made repeated passes through the South Atlantic Anomaly (SAA). While in theSAA, as many as 10 4 protons/cm 2 /s with energies in excess of 10 MeV passed through the spacecraft. Duringcomponent level ground testing we bombarded SQUIDs (Muhlfelder et al., 1995) with high energy protons tosimulate this environment. The flux-locked loop electronics showed no observable sensitivity to the protonbombardment. Some of the SQUIDs that we tested did show step-like bias shifts. For the SAA situationdescribed above, these shifts corresponded to a few mΦ o every 5 minutes. We analyzed the impact of these biasshifts upon the determination of the relativistic drift rates and found that the predicted bias shifts should notcause significant degradation. We also subjected the SQUIDs and electronics to approximately 10 times the totalproton dose we expect for the <strong>GP</strong>-B mission. Neither was damaged by this exposure.The as-built <strong>GP</strong>-B readout system performed to its design specifications during ground testing. Its noise at 5.5mHz was < 0.2 arcsec/√Hz. The SQUID temperature coefficient was < 10 mΦ o /K, and the SQUID temperaturewas stabilized to 2 μK at the spacecraft’s roll frequency. The temperature coefficient of the electronics was < 20μΦ o /K and the temperature of the electronics was controlled to 1 mK at roll frequency. The system hadundergone thermal, proton, magnetic and EMI testing. Improvements in the SQUID’s input filter andimprovements in the shielding of the telescope window allowed us to meet the EMI requirement. All of theperformance and environmental tests showed that the <strong>GP</strong>-B readout system met the flight requirements. Onorbitdata indicate that the flight performance is similar.10.4 On-Orbit Performance DataThis section summarizes on-orbit performance of the SRE system in terms of SQUID noise, SQUID brackettemperature control, and SRE temperature control.10.4.1 SQUID NoiseFigure 10-10 below shows that SQUID noise data collected shortly after launch and initial system set-up areconsistent with pre-launch results. The gyroscopes were electrostatically caged in their housings in order tominimize magnetic flux motion in the input circuit and make a measurement of only the SQUID sensor noise.The green horizontal line indicates the noise requirement at the roll frequency; the red line is a least squares fitto a power law tail. All SQUIDs meet the noise requirement at the roll frequency. The spectra for SQUIDs 2 and4 also confirm that the ac magnetic shielding meets the requirement at the roll frequency.<strong>Gravity</strong> <strong>Probe</strong> B — <strong>Post</strong> <strong>Flight</strong> Analysis • Final <strong>Report</strong> March 2007 293
Figure 10-10. Quiescent SQUID Noise Data – On Orbit10.4.2 SQUID Bracket Temperature ControlThe two charts in Figure 10-11 below show the performance of the SQUID bracket temperature controller onorbit. Using the Bracket Temperature Control algorithm, the SQUID sensor temperature was controlled to 1.6micro K rms in a 3 mHz band about roll frequency. This is a factor of three below the required value of 5 microK rms, providing margin in the overall experiment error budget. This performance was achieved withoutimplementing the peaking filter at roll.294 March 2007 Chapter 10 — SQUID Readout Subsystem (SRE) Analysis
Figure 10-11. SQUID Bracket Temperature Control – On-Orbit<strong>Gravity</strong> <strong>Probe</strong> B — <strong>Post</strong> <strong>Flight</strong> Analysis • Final <strong>Report</strong> March 2007 295
Analog control loops on the electronics boards in the forward SREs are optimized to remove thermaldisturbances on annual time scales (i.e. bias drifts over the course of the year). There is no active temperaturecontrol at higher orbital (1.7 e-4 Hz) and roll (12.9 mHz) frequencies. However, the passive thermal attenuationof the FEE minimizes the thermal disturbances at roll to a few mK rms. Spectra for the FLL boards are shown inFigure 10-12 below. The other boards are similar.Figure 10-12. SQUID Electronics Temperature Control – On-Orbit10.4.3 SRE Temperature Control PerformanceThe three tables below summarize the SRE temperature performance on orbit. The measured thermal stabilityat roll combined with the measured on-orbit bias temperature coefficients gives the bias contributions due totemperature fluctuations at roll. The measured amplitudes of the thermal disturbances are as expected prelaunch.The temperature coefficients of the electronics are a factor of 10 larger than expected, while the SQUIDsensor temperature coefficients (BKT) are a factor of 10 smaller, keeping the end-to-end contribution asspecified. Further study of the on-orbit temperature coefficient measurement data may be required.Table 10-3. Thermal Power Density at Roll (C/(Hz))— Worst case estimateFLL DAC DAS BKT_ELEC BKTSQUID 1 0.02 0.02 0.04 0.02 0.00030SQUID 2 0.02 0.02 0.04 0.02 0.00030SQUID 3 0.02 0.04 0.05 0.02 0.00030SQUID 4 0.02 0.03 0.05 0.02 0.00030296 March 2007 Chapter 10 — SQUID Readout Subsystem (SRE) Analysis
Table 10-4. RMS Temperature Variations in 3 mHz Band About Roll (C)— Worst case estimateFLL DAC DAS BKT_ELEC BKTSQUID 1 0.00155 0.00155 0.00310 0.00155 0.0000023SQUID 2 0.00155 0.00155 0.00310 0.00155 0.0000023SQUID 3 0.00155 0.00310 0.00387 0.00155 0.0000023SQUID 4 0.00155 0.00232 0.00387 0.00155 0.0000023Table 10-5. RE Bias Temperature CoefficientsPer A001 (Heifetz, Silbergliet) - May 2004R1G1 equivalents (mV/K)FLL DAC DAS BKT_ELEC BKTSQUID 1 0.47 0.25 1.30 0.0158 3.11std. error 0.20 0.09 0.08 0.0066 0.06SQUID 2 0.39 0.28 1.40 no data 8.02std. error 0.14 0.18 0.04 no data 0.12SQUID 3 1.50 0.05 0.94 no data 4.23std. error 0.24 0.22 0.27 no data 0.08SQUID 4 2.12 1.59 0.71 0.0125 9.71std. error 0.32 0.32 0.15 0.0155 0.1510.5 SRE Software=RANGE 2 =GAIN 6=GAIN 5The SQUID and Science Telescope Software (SSW) residing in the RAD6000-based processor performs theinstrument control functions and telemetry processing required to operate the SQUID electronicsinstrumentation in the forward SRE boxes as well as the Telescope Readout Electronics (TRE) subsystem. Thecode is written in ADA and runs in the processor on a VxWorks real time operating system.The code image is 750 KB; with data storage and scratchpad space, the code occupied about 79% of the 3 MBstatic RAM aboard the RAD6000 processor.The primary functions performed by the SSW are:1. Handshake interface with MSS2. Command router sends commands to applications3. SQUID and science telescope science and ATC data processing4. Commands to SQUID and ST5. Raw / processed telemetry from SQUID / ST6. Payload Processor checks and memory scrub<strong>Gravity</strong> <strong>Probe</strong> B — <strong>Post</strong> <strong>Flight</strong> Analysis • Final <strong>Report</strong> March 2007 297
The science support applications running on the processor include:1. SQUID signal FFT (SQ01). The fftnd package calculates the SQUID fft in normal and decimatedmodes. It receives data from the fwd_sre package and prepares data for the PIT.2. Science lowpass filter (SQ02). A digital lowpass filter which operates on the output of the 20 Hz analoglow pass filter, sampled at 2200 Hz and produces a filtered, decimated 5 Hz rate value for transmission tothe ground.3. Squid_Calibration (SQ04). This application is a 10 Hz process whose purpose is the computation of thebias, amplitude and phase of reference calibration signals4. Sq_Bracket_Temp_Ctrl (SQ05). This application is a 10 Hz process which uses closed loop control toheat the two SQUID brackets to a target temperature specified in a database5. Slope_Est. Slope_Est (ST02). This application performs a sanity check on the science telescope 2.2 kHzdata and calculates the ATC slope fit.6. St_Eng_Data_Filter (ST01). This application is a 10 Hz process that gathers various TRE hardwarehousekeeping data and places it in telemetry. Values are updated every 2 seconds.7. Estimation of slope for science telescope (ST03,04). This application is a 10 Hz process whichcomputes estimates of the slope and intercept of the photo diode charging that is used to point thetelescope to the guide star8. Tre_Temp_Control (ST05). TRE Digital Temperature Control. This algorithm uses PID to keep theDMA temperature constant at a given setpoint (nominally 72 K)9. Snapshot Processing (ST07, SQ06). These applications provide the capability to collect and transmitraw SQUID and ST data to the CCCA for deferred transmission to the ground.10. <strong>GP</strong>BPP Checks. The purpose of this processing is to report hardware and software errors that occur inthe payload processor. The following types of errors are covered: Un-handled application exceptions,Processing rate time-outs, CCCA 1 Hz sync failure, MIL-STD-1553 bus errors, processor expansion bus(EBI) errors, Memory errorsDuring testing, it was found that the processor was loaded to 90+% of its capacity with all science applicationsenabled and running. To mitigate this load, a set of applications were turned on or off at the Guide StarValid/invalid transition points. A measure of the processor loading with this schedule in place is given inTable 10-6. Table 10-7 lists the source lines of code (SLOC) for the various applications; 16,341 lines of ADAcode were required to implement the SQUID and Science Telescope processing required by <strong>GP</strong>-B.Table 10-6. Processor utilization and activation schedule for SQUID/Science telescope applications duringGuide Start Valid and InvalidSQUID/ST <strong>Flight</strong> Software: Standard Science scenarios Guide star valid Guide star invalidATC 10Hz processing 36% 32%Science 10Hz processing 84% 83%Science 1Hz processing 10% 60%Overall CPU usage (includes 5% for memory scrub) 59% 64%Application statusData validation None NoneSQUID & ST commanding Enabled EnabledScience_Lowpass_Filter (SQ02) X X298 March 2007 Chapter 10 — SQUID Readout Subsystem (SRE) Analysis
Table 10-6. Processor utilization and activation schedule for SQUID/Science telescope applications duringGuide Start Valid and InvalidSQUID/ST <strong>Flight</strong> Software: Standard Science scenarios Guide star valid Guide star invalidSQ_Bracket_Temp_Ctrl (SQ05) X XTRE_Temp_Control (ST05) X XST_Snapshot (ST07): mode 6XSQUID snapshot (SQ06)XSQUID_Calibration (SQ04)XST_Eng_Data_Filter (ST01) X XScience_Slope (ST02)XSlope_Est (ST03, ST04), w/ sanity checks X XFFTs (SQ01): normal modeXNotes:1. ST DMA balance is only used before spin-up and does not impact science mode usage. When it isbeing used, the CPU usage is no worse than shown above2. Includes 5% worst-case estimate for SQUID bracket temperature controller3. Includes 4% worst-case estimate for SQUID bracket temperature controller4. The worst-case scenario CPU usage before and during spin-up is no worse than shown above.5. The individual processing rates are shown because they need to finish within their time allotment, inaddition to the overall CPU usage requirement. ATC usage percentage is based on 25ms available andScience usage percentage is based on 75ms available6. SQUID snapshot is not shown because ST snapshot is higher CPU usage, and only one type iscommanded active at a time.Table 10-7. SSW application source lines of code (SLOC) metricsLevel 1 Level 2 Level 3 Level 4MissionSupport SWData MgmtProcessingTelemetryProcessingMathematicalFunctionsMathematicalFunctionsMathematicalFunctionsApplicationDB ReadoutApplicationDB ReadoutReqID Unit source filename SLOCMSSDMPTMPADB database_dump.1.ada 31 64MemorysizeADB database_dump.2.ada 86 4600MFU generic_utilities.1.ada 124MFU generic_utilities.2.ada 162MFU gnc.1.ada 63<strong>Gravity</strong> <strong>Probe</strong> B — <strong>Post</strong> <strong>Flight</strong> Analysis • Final <strong>Report</strong> March 2007 299
Table 10-7. SSW application source lines of code (SLOC) metricsLevel 1 Level 2 Level 3 Level 4OperatingSystem SWSQUID/STSupport SWSQUID/STSupport SWSQUID/STSupport SWSQUID/STSupport SWSQUID/STSupport SWSQUID/STSupport SWSQUID/STSupport SWSQUID/STSupport SWSQUID/STSupport SWSQUID/STSupport SWSQUID/STSupport SWSQUID/STSupport SWSQUID/STSupport SWSQUID/STSupport SWSQUID/STSupport SWSQUID/STSupport SWMathematicalFunctionsMathematicalFunctionsMathematicalFunctionsReqID Unit source filename SLOCMFU gnc.2.ada 97MFU utility.1.ada 75MFU utility.2.ada 122SSW build_version.1.ada 4SSW debug_io.1.ada 81SSW debug_io.2.ada 74SSW flt_io.1.ada 3SSWSSWgeneric_datatypes.1.adageneric_datatypes.2.ada100 20099 376SSW int_io.1.ada 3 128SSW short_int_io.1.ada 5SSW squid.1.ada 128SSW sre.1.ada 188 448SSW sre_utilities.1.ada 96288244SSW sre_utilities.2.ada 73 1828SSW time_io.1.ada 8 24SSW time_io.2.ada 14 144SSW tre.1.ada 68 232SSW tre.2.ada 42 328Scheduler SHS ccca_status.1.ada 17 168Scheduler SHS ccca_status.2.ada 19 308Scheduler SHS ccsds_time.1.ada 71Scheduler SHS ccsds_time.2.ada 195 352Memorysize300 March 2007 Chapter 10 — SQUID Readout Subsystem (SRE) Analysis
Table 10-7. SSW application source lines of code (SLOC) metricsLevel 1 Level 2 Level 3 Level 4ReqID Unit source filename SLOCMemorysizeScheduler SHS ebi_interrupts.1.ada 10 24Scheduler SHS ebi_interrupts.2.ada 54 1056Scheduler SHS event_trace.1.ada 9 24Scheduler SHS event_trace.2.ada 17 1308Scheduler SHS p10hz_atc.2.ada 48 1608Scheduler SHS p10hz_science_1.2.ada 28 1176Scheduler SHS p10hz_science_2.2.ada 104 3360Scheduler SHS p10hz_science_3.2.ada 20 848Scheduler SHS p1hz_science.2.ada 48 1496Scheduler SHS processor.1.ada 9 24Scheduler SHS processor.2.ada 33 1280Scheduler SHS scheduler.1.ada 4 24Scheduler SHS scheduler.2.ada 180 3948Scheduler SHS ssw.2.ada 19 764Scheduler SHS ssw_status.1.ada 14 48Scheduler SHS ssw_status.2.ada 3Scheduler SHS task_priorities.1.ada 7<strong>GP</strong>BPPInitializationSIN initialize_ssw.2.ada 3 48<strong>GP</strong>BPPInitialization<strong>GP</strong>BPPData MgmtSQUID/STCommandRouterSQUID/STCommandRouterSQUID/STCommandRouterSQUID/STCommandRouterSQUID/STCommandRouterSINSDMinitialize_mailboxes.2.ada50 576SCR ccca_pit.1.ada 86 112SCR command_class.1.ada 210 1368SCR command_class.2.ada 434 10148SCRSCRcommand_envelope_class.1.adacommand_envelope_class.2.ada32 26823<strong>Gravity</strong> <strong>Probe</strong> B — <strong>Post</strong> <strong>Flight</strong> Analysis • Final <strong>Report</strong> March 2007 301
Table 10-7. SSW application source lines of code (SLOC) metricsLevel 1 Level 2 Level 3 Level 4<strong>GP</strong>BPP I/OProcessing<strong>GP</strong>BPP I/OProcessing<strong>GP</strong>BPP I/OProcessing<strong>GP</strong>BPP I/OProcessingSQUID/STCommandRouterSQUID/STCommandRouterSQUID/STCommandRouterSQUID/STCommandRouterSQUID/STCommandRouterSQUID/STCommandRouterSQUID/ST1553InterfaceSQUID/ST1553InterfaceSQUID/ST1553InterfaceSQUID/ST1553InterfaceSQUID/ST1553InterfaceSQUID/ST1553InterfaceSQUID/ST1553InterfaceReqID Unit source filename SLOCSCRSCRSCRSCRSCRSCRcommand_router.1.adacommand_router.2.adapayload_command_dataset.1.adapayload_command_dataset.2.adasw_mailbox_class.1.adasw_mailbox_class.2.ada20 4096 304024 176226 760864 104182 6592SIO bicpfns.1.ada 61 48SIObus_1553_device_driver_interface.1.ada209SIO ebifns.1.ada 30SIO rscfns.1.ada 55SIF payload.1.ada 113 1184SIFSIFSIFSIFpayload_message.1.adapayload_message.2.adapayload_message_transfer.1.adapayload_message_transfer.2.ada13 15244 410413 72112 3212SIF read_packets.2.ada 30 1056SIFsre_pit_constructor.1.ada8 24Memorysize302 March 2007 Chapter 10 — SQUID Readout Subsystem (SRE) Analysis
Table 10-7. SSW application source lines of code (SLOC) metricsLevel 1 Level 2 Level 3 Level 4SQUID/ST1553InterfaceSQUID/ST1553InterfaceSQUID/STExpansionBus I/FSQUID/STExpansionBus I/FSQUID/STExpansionBus I/FSQUID/STExpansionBus I/FSQUID/STExpansionBus I/FSQUID/STExpansionBus I/FSQUID/STExpansionBus I/FSQUID/STExpansionBus I/FSQUID/STExpansionBus I/FSQUID/STExpansionBus I/FSQUID/STExpansionBus I/FSQUID/STExpansionBus I/FSQUID/STExpansionBus I/FSQUID/STExpansionBus I/FReqID Unit source filename SLOCSIFsre_pit_constructor.2.adaSIF sre_pit_format.1.ada 402671 34344SSB ebi.1.ada 81 160SSB ebi.2.ada 65 1388SSB engr_data.1.ada 34 312SSB engr_data.2.ada 60 672SSBSSBfab_command_block.1.adafab_command_block.2.ada108 400282 8308SSB fwd_sre.1.ada 115 88SSB fwd_sre.2.ada 319 30104SSB fwd_sre_mux.1.ada 8SSBSSBSSBscience_telescope_cmd.1.adascience_telescope_cmd.2.adasend_fab_commands.2.ada138 84547 2374818 568SSB squid_cmd.1.ada 243 80MemorysizeSSB squid_cmd.2.ada 950 38940<strong>Gravity</strong> <strong>Probe</strong> B — <strong>Post</strong> <strong>Flight</strong> Analysis • Final <strong>Report</strong> March 2007 303
Table 10-7. SSW application source lines of code (SLOC) metricsLevel 1 Level 2 Level 3 Level 4ChecksSQUIDSupportProcessingSQUIDSupportProcessingSQUID/STExpansionBus I/FSQUID/STExpansionBus I/FSQUID/STExpansionBus I/FSQUID/STExpansionBus I/FSQUID/STExpansionBus I/FSQUID/STExpansionBus I/F<strong>GP</strong>BPPChecks<strong>GP</strong>BPPChecks<strong>GP</strong>BPPChecksSQUID ATCProcessingSQUID ATCProcessingSQUIDSnapshotProcessingSQUIDSnapshotProcessingScienceLowpassFilterScienceLowpassFilterReqID Unit source filename SLOCSSB squid_test_data.1.ada 15 72160SSB squid_test_data.2.ada 39 1912SSB st_test_data.1.ada 10 3520SSB st_test_data.2.ada 19 1080SSBSSBSCKsquid_science_data.1.adasquid_science_data.2.ada36 48239 136232SGC memory_scrub.1.ada 12 24SGC memory_scrub.2.ada 19 160SGC scrubfns.1.ada 33SQSSQSdedicated_squid_cmd.1.adadedicated_squid_cmd.2.ada2211 4584SQA squid_atc.1.ada 43 256SQA squid_atc.2.ada 221 9468SQT squid_snapshot.1.ada 105 9112SQT squid_snapshot.2.ada 166 7536SFPSFPscience_lowpass_filter.1.adascience_lowpass_filter.2.adaMemorysize76 35264492 142924304 March 2007 Chapter 10 — SQUID Readout Subsystem (SRE) Analysis
Table 10-7. SSW application source lines of code (SLOC) metricsLevel 1 Level 2 Level 3 Level 4ST SupportProcessingSQUID FFTProcessingSQUID FFTProcessingSQUID FFTProcessingSQUID FFTProcessingSQUID FFTProcessingSQUID FFTProcessingSQUID FFTProcessingSQUID FFTProcessingSQUID FFTProcessingSQUID FFTProcessingSQUID CalSignalSQUID CalSignalSQUID DigitalBracket TempControlSQUID DigitalBracket TempControlST ATCProcessingST ATCProcessingST SnapshotProcessingST SnapshotProcessingST SanityCheckSTEngineeringData FilterProcessingReqID Unit source filename SLOCFFT fft1.1.ada 2 80932FFT fft2.1.ada 2 80996FFT fft3.1.ada 2 80996FFT fft4.1.ada 2 80996FFT fft_utilities.1.ada 17FFT fft_utilities.2.ada 3FFT fftad.1.ada 97 147664FFT fftad.2.ada 105 6136FFT fftnd.1.ada 108FFT fftnd.2.ada 396SCFSCFSBTSBTSTSsquid_calibration.1.adasquid_calibration.2.adasq_bracket_temp_ctrl.1.adasq_bracket_temp_ctrl.2.ada60 104266 22864879 20481262 62244STC slope_est.1.ada 96 136STC slope_est.2.ada 427 13732STT st_snapshot.1.ada 152 8024STT st_snapshot.2.ada 413 11020SSCEDFst_eng_data_filter.1.ada228 456Memorysize<strong>Gravity</strong> <strong>Probe</strong> B — <strong>Post</strong> <strong>Flight</strong> Analysis • Final <strong>Report</strong> March 2007 305
Table 10-7. SSW application source lines of code (SLOC) metricsLevel 1 Level 2 Level 3 Level 4STEngineeringData FilterProcessingScience SlopeProcessingScience SlopeProcessingST DigitalTemp ControlST DigitalTemp ControlST DMABalancingST DMABalancingST DMABalancingST DMABalancingReqID Unit source filename SLOCEDFst_eng_data_filter.2.ada297 6552SSL science_slope.1.ada 154 21152SSL science_slope.2.ada 715 49948SDCSDCSDBSDBtre_temp_control.1.adatre_temp_control.2.adadma_balancing_interface.1.adadma_balancing_interface.2.ada45 672291 147721491 512SDB st_dma_balance.1.ada 23 32SDB st_dma_balance.2.ada 422 30816Total SLOC 16341Memorysize10.6 ReferencesGutt, G.M., N.J. Kasdin, M.R. Condron II, B. Muhlfelder, and J.M. Lockhart, A Method for Simulating a Flux-LockedDC SQUID, IEEE Trans. Superconductivity, 3, 1837 (1993).Haupt, G. T., Development and Experimental Verification of a Nonlinear Data Reduction Algorithm for the <strong>Gravity</strong> <strong>Probe</strong> BRelativity Mission, Ph.D. Thesis, <strong>Stanford</strong> University (1996).Lockhart, J.M., SQUID Readout and Ultra-low Magnetic Fields for <strong>Gravity</strong> <strong>Probe</strong>-B (<strong>GP</strong>-B), SPIE, 619, 148 (1986).Lockhart, J.M., D.N. Hipkins, G.M. Gutt, B. Muhlfelder, and N. Jennerjohn, Comparative Study of Bias-ReversingSchemes for Low Frequency Noise Reduction in dc SQUIDs, Physica B, 194, 89 (1994).Muhlfelder, B., G.M. Gutt, J.M. Lockhart, P. Carelli, A. Zehnder, et al., Effect of High Energy Proton Bombardment (50-280 MeV) on dc SQUIDs, IEEE Trans. Superconductivity, 5, 3252 (1995)306 March 2007 Chapter 10 — SQUID Readout Subsystem (SRE) Analysis
11Telescope Readout Subsystem (TRE) Analysis<strong>Gravity</strong> <strong>Probe</strong> B — <strong>Post</strong> <strong>Flight</strong> Analysis • Final <strong>Report</strong> March 2007 307
308 March 2007 Chapter 11 — Telescope Readout Subsystem (TRE) Analysis
11.1 Telescope Readout Electronics <strong>Report</strong> SummaryHere we provide a brief overview of the telescope pointing readout system. The science telescope and the 4probe windows constitute the sensor for pointing of the science metrology reference, and the telescope readoutelectronics (TRE) provide the readout for the telescope.The light from the guide star passes through the 4 probe windows, which to first order does not disturb thewavefront of this light. The telescope brings the light to a focus on two roof prisms, one for each rotation axis (Xand Y). When the telescope is directly pointed at the guide star the intensities of light that are reflected off ofeach side of the roof prisms are equal (after compensation by weighting factors). When the intensities are notequal, their normalized difference is a measure of the pointing of the telescope with respect to the guide star.The telescope readout electronics measures the light reflected from each side of the roof prisms. The light fromthe two sides of a roof prism is transported to two pairs of photo detectors, a primary pair (A-side electronics)and a redundant pair (B-side electronics). Each photodetector pair is located on a sapphire platform with theirJFET pre-amplifiers. The platforms are mounted on a thermal standoff on the front plate of the telescope (atabout 3 K) so the platforms can be operated at 72 K, where the JFET pre-amplifiers work well. The platforms aretemperature controlled. There are a total of 4 detector pairs (8 detectors) located on 4 platforms.The TRE measures the current of each photo detector with a charge-locked loop using a feedback capacitor tothe photo detector. The voltage across the feedback capacitor is read out after appropriate scaling by an analogto-digitalconverter with a range from +10 V to -10 V at a rate of 2200 samples/second, and it is quickly resetevery 0.1 s. This provides 220 A to D samples for each charge ramp. Only the even samples between 22 and 220of the ramp are used to determine the science slope (photo detector current after appropriate scaling). The firstfew samples are ignored to avoid the transient associated with the reset, and only the even samples are used toreduce the on-orbit computation time for the slope. Little information is lost in using only the even samplessince adjacent samples have a moderate degree of correlation.The diagram shown in Figure 11-1 indicates the relationship of the TRE and portions of the SQUID ReadoutElectronics (SRE) which provides power and control information to the TRE and digital-to-analog conversion,data handling, and signal processing for the TRE output signals. The four channels of the TRE are veryindependent of each other, with four identical sets of circuit boards that are housed in two boxes in intimatecontact with a corresponding SRE forward unit. There are two identical aft SRE units, but one is always poweredoff while the other is active, so the unused unit is not shown in the diagram.<strong>Gravity</strong> <strong>Probe</strong> B — <strong>Post</strong> <strong>Flight</strong> Analysis • Final <strong>Report</strong> March 2007 309
Figure 11-1. Block diagram of TRE and associated aspects of the SRE systemThe telescope Readout System performed well during initial on-orbit checkout (IOC). Most of the templatesworked as intended. The detector balancing algorithm, which is intended to adjust the operating point of thedetector preamplifiers and the signal level at the A/D converter, underwent a minor adjustment to change thelimits of acceptable completion for the clamp adjustment. As a result of less than optimal automated adjustmentperformance, a CSTOL procedure was created, and used to make manual adjustments of the clamp commandlevel to optimize the voltage level at the A/D converter.11.2 Operational Performance and OverviewThe Operations personnel had little to monitor or change with the Telescope Readout Electronics. Most of thetimeline events were related to managing the CPU utilization by the SQUID/ST Software. Three specific areas ofinterest, other than initial power on and setup did require some operator intervention, and these are highlightedin the next few sections.11.2.1 Gain LevelsTwo overall signal gain levels were used during IOC, Gain 12 and Gain 11. These correspond to approximately870 and 615 V/V between the charge-locked loop preamp output and the A/D converter of the SRE. It has beendetermined that the lower gain level achieves good performance and is easier to adjust with the balancingprocedure. During Science, it was determined that there might be an advantage to using even lower gain levels.Table 11-1 lists the times of gain changes on the two sides from just after launch until the end of the Science datacollection on 15 August 2005. The gain changes during the post-Science calibration phase are not given in thetable.310 March 2007 Chapter 11 — Telescope Readout Subsystem (TRE) Analysis
Table 11-1. Gain code change timesA-sideB-sideUTC Time Gain Code UTC Time Gain Code4/20/04 22:30 12 4/20/04 22:30 125/14/04 7:15 11 5/14/04 7:15 113/31/05 21:20 10 3/26/05 7:36 104/4/05 21:24 9 3/29/05 9:10 93/31/05 8:00 115/21/05 8:01 9Gain codes are the commands to select specific taps on a resistive ladder attenuator. Following the attenuatorselector is a large amount of linear gain and a 500 Hz low-pass filter. The net gain between the charge lockedloop and the A/D converter for various gain codes is as follows:• Gain code 9 commands gain value of 307 V/V, or 0.353 relative to gain 12.• Gain code 10 commands gain value of 434 V/V, or 0.499 relative to gain 12.• Gain code 11 commands gain value of 614 V/V, or 0.706 relative to gain 12.• Gain code 12 commands gain value of 870 V/V.11.2.2 PID Temperature Controllers for DMAsThe detector platform temperature for each of the four DMAs is controlled by PID controllers that sense thetemperature and provide commands for the heater voltage. These controllers maintain the platformtemperatures at 72 K. The controllers were used to purposely vary the platform temperatures during a stabilitytest to allow determination of a pointing sensitivity to the platform temperature. Performance results are shownin section “Platform Temperature Stability” on page 312.11.2.3 Signal StrengthsThe currents of the 8 photo detectors ranged from about 6 to 12 fA. Weighting factors are used in the signalprocessing to match the pointing sensitivities from the plus and minus detectors for each axis.11.2.4 Telescope Operation with the Shutter OpenThe <strong>GP</strong>-B system was designed with the expectation that a shutter would open and close once per orbit toprevent sunlight reflected from the earth from affecting the detectors. Unfortunately, the shutter mechanismincluded a spring loaded mechanism and its operation resulted in un-damped contact with an end stop. Theresulting disturbance gave a small acceleration shock to the gyroscopes, so the decision was made to operatewith the shutter open continuously. Such operation did not cause damage to the detectors, however a fewunexpected features arose. The earthshine resulted in an optical input several thousand times larger than theguide star, which caused significant unbalance in the four-JFET preamplifier circuits and saturation in most ofthe analog amplifiers in the signal chain of the warm electronics. The unbalance of the preamp currentseffectively reduced the power dissipation of the circuit, so in order to maintain the cold platform temperature atthe 72 K operating temperature, the PID controller increases the heater power until the earthshine subsides.This is followed by an under damped recovery transient to the normal steady-state condition observed in a timehistory of the heater voltage engineering monitor. The recovery response time depends on the thermal timeconstant of the DMA and the characteristics of the PID temperature controller. There was observable dampingduring the first 15 minutes of guide star valid, but this did not adversely affect the TRE contributions to thepointing error.<strong>Gravity</strong> <strong>Probe</strong> B — <strong>Post</strong> <strong>Flight</strong> Analysis • Final <strong>Report</strong> March 2007 311
Additionally, the warm electronics power dissipation is increased when most of the amplifiers are driven tosaturation. The signal level from the output of the charge locked loop is normally within a few mV of zero withguide star illumination, but increases to nearly -10 V during earth shine. The power dissipation in the resistiveattenuator and the feedback resistors of the amplifiers increases, and it is distributed over much of the analogprinted wiring board (PWB). The board temperature is measured using the temperature output of the REF-02voltage reference mounted on the PWB and appears in the local box temperature monitor. The degree ofheating changes with season, and the disturbance went through a long period during which earth shine wasobserved for nearly the entire guide star invalid period.11.3 Hardware PerformanceHardware performance will be discussed in greater detail with examples, long term plots and a typical look atdaily data.11.3.1 TRE Detector Dark NoiseThe TRE detector dark noise is difficult to measure separately from the effects of pointing ambiguity when theguide star is in the field of view. On May 31, 2005, when the guide star was lost for about three hours, there wasa whole guide star valid interval during which the science slope processing was active and there was no star inthe field of view. This provided 58 minutes of dark detector data in a normal operating environment. The effectsof particle hits were removed, and the standard deviations of the remaining signals were calculated after scalingthe data to fA using the appropriate factor for gain level 9. Each detector sample noise calculation used 33546samples out of a total of 34801 available during the interval, indicating that 1255 samples or 3.6% werediscarded due to particle hits. Using this data, Table 11-2 is a listing of the resulting RMS dark current noise foreach of the eight photo detectors, which are labeled with the detector designations P/M, X/Y, and A/B. A latersection shows the effect on pointing noise as the star brightness varies.Table 11-2. Photo detector dark noiseDetector Dark NoisePXA: 0.297 fAMXA: 0.255 fAPYA: 0.252 fAMYA: 0.257 fAPXB: 0.249 fAMXB: 0.379 fAPYB: 0.264 fAMYB: 0.248 fA11.3.2 Platform Temperature StabilityThe temperatures of the detector platforms are maintained using a computer algorithm with proportional,integral, and derivative (PID) gain coefficients. The temperature controller compares the temperature measuredby the silicon diode sensor on the platform with a commanded set point temperature, usually 72 K. The PIDalgorithm output controls a DAC in the TRE warm electronics that provides the voltage to the heater resistorson the platforms. The platform temperatures are maintained at 72 K with a standard deviation ofapproximately 23 mK.312 March 2007 Chapter 11 — Telescope Readout Subsystem (TRE) Analysis
11.3.3 Temperature History and Detector High LevelsThe small detector signals must have a large gain applied to match them to the input range of the A/D converter.There also needs to be a means to adjust the DC level of the signal within that range. The sensitivity of theadjustment changes with a different amount of net gain, and there is a small temperature drift of this offset asthe temperature of the warm electronics changes. All of these features were considered in the system design, andseveral operational consequences and results will be discussed. The normal detector signal is reset to an initialcondition, and then as photocurrent integrates on the capacitor, a negative going voltage ramp is produced. Theslope of this waveform contains the information of interest, but it is also desired to know the region of the A/Dconverter range used.The detector signals are digitized in the forward SRE using an A/D converter scaled to accept signals in a 20 Vrange centered about 0 V. Each detector signal is sampled at a rate of 2200 samples per second, to provide 220samples during the tenth second signal interval. The TRE provides a set of selectable gains by which the signaloutput of the CLL preamplifier is increased to provide a better utilization of the range. The Science Slopealgorithm calculates the slope of the detector ramp, but also reports three other signals of interest: detector high,detector mean, and detector low. The detector high signal provides the maximum value of detector sample 14over a 2 second interval (20 consecutive signal integrations). The detector high signal indicates where thebeginning of the ramp will occur, and is usually maintained near 0 V.Timing of the TRE and SRE signals is synchronized using a 10 pps signal called the ATC strobe. The reset of theCLL begins upon the receipt of the ATC strobe and takes a total of approximately 3.5 ms of the 100 ms interval.The charge locked loop is a reset integrator that uses a distributed operational amplifier. A portion of theamplifier is located adjacent to the cold detectors, and the remainder of the amplifier is located in the warmelectronics. There is a solid state switch in the warm area prior to the final stage of the amplifier that is activatedduring the reset interval Figure 11-2 shows the simplified schematic of the detector, feedback capacitor, andswitch states during the signal integration period of operation.Figure 11-2. CLL switch states during normal operationDuring the reset interval, the feedback capacitor is charged to a uniform voltage by switching its terminals totwo low impedance voltages, both of which are adjustable over a small voltage range by changing the eight bitcommand value to the DACs which control the voltages. The detector, feedback capacitor, amplifier input nodeis switched using a reset JFET to a voltage source adjustable approximately ±20 mV from the -4 V amplifierreference node. This DAC is called the offset DAC. See Figure 11-3 for switch states.<strong>Gravity</strong> <strong>Probe</strong> B — <strong>Post</strong> <strong>Flight</strong> Analysis • Final <strong>Report</strong> March 2007 313
Figure 11-3. CLL switch states during the reset interval.The input of the final amplifier in the charge locked loop is switched during the reset interval to another DACthat provides CLL output voltages between zero and -3.92 V with 256 steps of resolution. This DAC is called theclamp DAC because it clamps the capacitor to a fixed voltage during the reset operation.An adjustment procedure is used to optimize the settings of the two DACs to assure that the preamplifier isreasonably well balanced, and that the DC level of the amplified output is appropriate for the A/D converter.Figure 11-4. CLL switches locked for offset adjustmentIn practice, the offset DAC is adjusted with the reset JFET in an ON state as shown in Figure 11-4. Then theoffset DAC is adjusted to provide the smallest positive voltage output within its resolution. The normal resetclocking is then re-enabled and the clamp DAC is adjusted to provide an operating point within a selectablerange of the A/D converter. Once the adjustments are completed the same command values for the two DACsare used for long periods of time.The cold preamplifiers are each biased using current sources in the warm electronics. As the warm electronicstemperature changes, the 100 μA current sources vary approximately 0.159 μA/°C, so over the ±10 °C operatingrange, the current would change by ±1.6%. While this sensitivity has little effect on the pointing signals derivedfrom the telescope, it causes a minor operational requirement to readjust the clamp command a few timesduring the mission lifetime. The operational results of these adjustments are shown in the figure below.314 March 2007 Chapter 11 — Telescope Readout Subsystem (TRE) Analysis
Figure 11-5. Local box temperature and detector high signals since launchFigure 11-5 shows a very long time history of the eight detector high signals grouped in pairs below thecorresponding box temperature plot. It is interesting to note that while the four temperature plots are verysimilar, there is some degree of variation in the shape of the detector high levels. In the range of time betweenabout 2500 and 4500 hours, where the temperature tends toward a minimum and then increases smoothly, theshape of the detector highs for the bottom plot in the left column and the second from the top plot in the rightcolumn are quite different in character from the other six detector high plots. The steps in the detector highplots generally occur when an adjustment in the level was made.Table 11-3 below contains a tabulation of when each of the clamp adjustments were made, and the commandvalue to which they were set. Valid command values range from 0 to 255. There were some cases where a valuewas set, and then the system re-initialized for some reason such as an SRE processor re-boot. These resets arenot included in the listing.<strong>Gravity</strong> <strong>Probe</strong> B — <strong>Post</strong> <strong>Flight</strong> Analysis • Final <strong>Report</strong> March 2007 315
Table 11-3. Dates and UTC times when clamp commands were changedRefer to plots in Figure 11-5. All times listed areconverted from vehicle time to UTC.Left Column Plot 2PT_STxClampPCdA Switched to20-Apr-2004 22:28:29 17614-Jul-2004 15:26:17 17715-Nov-2004 19:13:31 17631-Mar-2005 23:07:52 17728-Jun-2005 16:07:30 178Left Column Plot 3PT_STxClampMCdA Switched to20-Apr-2004 22:28:29 18423-Apr-2004 09:59:09 18522-Jul-2004 19:34:57 18601-Aug-2004 16:32:53 18520-Aug-2004 01:04:13 18606-Nov-2004 23:12:39 18503-Dec-2004 16:48:31 18422-Feb-2005 01:31:39 18504-Mar-2005 00:36:49 18406-Mar-2005 06:15:59 18504-Apr-2005 21:35:42 18606-Jul-2005 18:22:30 187Left Column Plot 5PT_STyClampPCdA Switched to20-Apr-2004 22:28:29 17721-May-2004 08:04:11 17831-Jul-2004 22:38:03 17701-Aug-2004 16:34:13 17919-Nov-2004 17:36:31 17821-Mar-2005 23:53:22 17928-Jun-2005 16:07:30 180Left Column Plot 6PT_STyClampMCdA Switched to20-Apr-2004 22:28:29 18609-Jun-2004 02:45:50 18731-Jul-2004 22:38:53 18601-Aug-2004 16:34:53 18731-Mar-2005 23:08:12 188Right Column Plot 2PT_STxClampPCdBSwitched to20-Apr-2004 22:28:29 16623-Apr-2004 09:59:09 16721-May-2004 08:04:07 16614-Jul-2004 15:27:57 16731-Jul-2004 22:39:13 16601-Aug-2004 16:31:03 16706-Nov-2004 23:13:29 16826-Mar-2005 08:35:32 16926-Mar-2005 20:16:42 16827-Mar-2005 05:12:02 16729-Mar-2005 21:17:32 16930-Mar-2005 23:34:22 168Right Column Plot 3PT_STxClampMCdBSwitched to20-Apr-2004 22:28:29 17814-Jul-2004 15:28:27 17911-Nov-2004 17:34:11 17826-Mar-2005 08:36:12 17926-Mar-2005 20:17:22 17829-Mar-2005 21:17:52 17930-Mar-2005 23:34:52 17812-May-2005 22:54:52 17928-Jun-2005 16:07:30 180Right Column Plot 5PT_STyClampPCdBSwitched to20-Apr-2004 22:28:29 19223-Apr-2004 09:59:09 19114-Jul-2004 15:29:07 19201-Aug-2004 16:33:33 19326-Mar-2005 08:36:33 19226-Mar-2005 20:17:53 19327-Mar-2005 05:12:13 19430-Mar-2005 23:35:13 19328-Jun-2005 08:22:30 194Right Column Plot 6PT_STyClampMCdBSwitched to20-Apr-2004 22:28:29 19723-Apr-2004 09:59:09 19826-Mar-2005 08:37:13 19726-Mar-2005 20:18:33 19827-Mar-2005 05:12:32 19930-Mar-2005 23:35:43 19803-Jun-2005 17:37:30 19921-Jul-2005 18:12:30 200316 March 2007 Chapter 11 — Telescope Readout Subsystem (TRE) Analysis
11.3.4 Daily Data ExampleIt is unusual to look at data for time periods of greater than a few days duration; a 12 or 24 hour time spanfrequently shows many useful and interesting characteristics. Typical data for the TRE includes a look at howwell the temperature control system is working, whether the detector high levels need adjusting, and a look atthe ATC slopes to verify that the guide star is still in the field of view. These plots usually are done for all of theA-side and all of the B-side channels available. Usually the more boring the better, but shown here are two plotsmade from two distinctly different seasons that show how the sun location and the orbit affect the TRE (with theshutter open continuously). Both plots contain the same four signals, with a similar scaling range. The limits aredifferent to accommodate the seasonal difference. The first plot, Figure 11-6, is from 20 August 04 when thegamma angle was near its maximum value. The uncontrolled warm electronics box temperature is at a fewdegrees Celsius and the platform heater is supplying additional heat to the detector platforms during most of theguide star invalid period. During the guide star invalid period, the box warms, due to amplifier saturation, andthen during guide star valid, it cools again. A noticeable slope exists in the detector high level waveform. TheTRE gains were set at gain code 11 for both plots.Figure 11-6. High Gamma Angle Data SampleThe second plot, Figure 11-7, is from 12 February 05 when the gamma angle was near its minimum. The heatervoltage shows only small blips at the beginning and end of guide star invalid, the box temperature is near 15 °Cwith much smaller excursions, and the detector high levels show much less sloping.<strong>Gravity</strong> <strong>Probe</strong> B — <strong>Post</strong> <strong>Flight</strong> Analysis • Final <strong>Report</strong> March 2007 317
Figure 11-7. Low Gamma Angle Data SampleThe ATC slope signals are included in these plots as an indicator of photocurrent as well as a timing referencesince they are active only during the guide star valid periods of each orbit. Similarly, the detector high signals aregenerated by the science slope algorithm, which is usually cycled off during guide star invalid as part of the loadmanagement of the SRE processor.11.4 Optically Related PerformanceMany of the telescope performance characteristics are influenced by the optical properties of the telescope,beam splitters, windows, and guide star. Several of these characteristics are discussed in this section.11.4.1 Guide Star Brightness Variation and PeriodFigure 11-8 displays the history of IM Peg's light intensity as measured by the summed current of all eighttelescope detectors during the course of the Science Mission beginning on 1 September 2004 and ending 31August 2005. Each point of intensity is an average of about 50 minutes continuous observation, the equivalentof one orbit's guide star valid period. Some cleaning and censoring of the data was required. The intensity isfrom the summation of all eight guide star telescope detectors in units of fA. Errors are derived from thestandard deviation and the number of samples. The signal-to-noise ratio ranges from 5,000 to 10,000. Typically,2 to 6 orbits were analyzed every day to create this plot.318 March 2007 Chapter 11 — Telescope Readout Subsystem (TRE) Analysis
Figure 11-8. Guide Star intensity versus timeThe dominant feature in the light curve is the 24.51 day period associated with star spots synchronized by thetidal and elliptical distention wave forced by an unseen binary companion. The stellar rotation and orbitalperiods are tidally locked. Occasionally these systems flare, although during the <strong>GP</strong>-B mission no flaring wasobserved. RS CVn class stars, of which IM Peg is a member, display photospheric spots that modulate the lightcurve and they are also magnetically active. Doppler Imaging and Zeeman Doppler Imaging are used formapping stellar surfaces of the RS CVn components.The annual linear drift in guide star brightness is less than the 10% requirement that was specified at thebeginning of the mission. Fortunately, we observed the star during a stable period when no flares or suddenchanges in brightness occurred. The comparison waveform is composed of an 8 term Fourier trigonometricseries with coefficients chosen by a least squares method (Matlab). The residual linear variation component ofstellar brightness was -0.31616%/annum.11.4.2 Telescope Pointing SignalThe telescope pointing signals for science are derived from the telescope detector slopes, which are calculatedon-board the space vehicle and telemetered to the ground where they are converted to detector currents+ / −, X / Y , A / Bi, where +/- refers to the +/- detectors of a pair, X/Y to the X or Y-axis, and A/B to the A or B sideX / Y , A / Belectronics. A normalized telescope pointing signal s Nis found using the detector currents and+ / −, X / Y , A / Bweighting factors w, which account for the different efficiencies for each of the optical andelectronic paths for the eight telescope detectors. For simplicity the X/Y and A/B designations are not includedin the expression. The symbol sign is plus for the X-axis, and minus for the Y-axis.<strong>Gravity</strong> <strong>Probe</strong> B — <strong>Post</strong> <strong>Flight</strong> Analysis • Final <strong>Report</strong> March 2007 319
s N+w i= sign+w i++−+−w i−w i−−Equation 11-1Note that the X-axis uses the detector currents designated by Y, and the Y-axis uses the detector currentsdesignated by X, which is the result of the detector axes being designated by their spatial location and thepointing angles by the X and Y rotation axes.The pointing signal s P in units of marcsec is found with a scale factor, which is approximately 3.3 × 10 3marcsec/normalized pointing signal for both axes.Equation 11-2The weighting factors that are used to determine the ATC pointing signal on orbit are listed in Table 11-4.Normally the same weighting factors are also used to calculate the science normalized pointing signal, althoughdifferent weighting factors can be used in principle for science since the processing of the science slope datatakes place on the ground.Table 11-4. Weighting factors used for processing dataElectronic Side A-Side B-SideDetector Designation \ Polarity + - + -X 0.9931 1.0070 1.0005 0.9995Y 0.9421 1.0655 0.9245 1.089011.4.3 Telescope Scale FactorFrom ground measurements, the scale factor, which converts the normalized pointing signal to pointing angle,as estimated in S0619 (J.P. Turneaure, M. Heifetz, “<strong>Flight</strong> telescope/window system analysis of wavelengthdependent properties”, <strong>GP</strong>-B S-Doc S0619 Rev. -, 3-Mar-02), was measured to be about 2.0 arcsec pernormalized pointing signal. This estimate was based on measurements of the telescope in its Payloadconfiguration (flight telescope at liquid helium temperature and with the 4 flight windows at temperatures closeto those of flight) made with Artificial Star #3, see S0570 (R. Bernier, T. Acworth, J.P. Turneaure, D. DeBra,“<strong>Flight</strong> telescope/window system verification”, <strong>GP</strong>-B S-Doc S0570 Rev. -, 20-November-01).Room temperature and low-temperature measurements of the telescope indicated that the bare telescope wasvery close to focus with little wavefront error. However after the telescope was integrated into the payload,which included the four windows, the telescope/window system was found to be out-of-focus. When ArtificialStar #3 was adjusted to compensate for the telescope/window system defocus, which amounted to a focalposition shift of 5.2 mm, a good quality focus occurred with very little astigmatism. The knowledge in thequality of the focus was limited by the uncertainty in the wavefront error introduced by Artificial Star #3, whichhad an estimated Strehl ratio of 65%. <strong>Flight</strong> data shows that both telescope pointing axes have a scale factor ofabout 3.3 arcsec per telescope normalized pointing signal, which is consistent within error to the defocusmeasured on the ground.The lack of focus has an advantage: namely that the linear range of the telescope is larger and thus larger RMSpointing errors are acceptable in the data analysis. The non-linearity of the telescope has been exploredanalytically using optical theory and experimental data. Initial analysis indicates the telescope is 0.17 inches (4.3mm) out of focus, which within error agrees with the value measured on the ground when considering320 March 2007 Chapter 11 — Telescope Readout Subsystem (TRE) Analysis
wavefront errors. Figure 11-9 is a plot of the estimated intensity distribution function at the roof prism of thetelescope, and Figure 11-10 is a plot of the calculated scale factor as a function of pointing angle for this intensitydistribution. The small difference between two curves in the figure is due to the change of color of IM Peg.Figure 11-9. Point spread function of IM Peg image at the roof prism11.4.4 RMS pointing noiseFigure 11-10. Pointing angleWe observe both common mode noise and statistically independent noise in the slopes for +/- detector pairs.Some of the common-mode noise is known to be associated with pick-up from switching noise due to thetemperature control currents on the detector platforms. There may also be other unknown sources of commonmodenoise. We observe that the common-mode noise is to first order Gaussian with zero mean. This allows usto use an average value over one guide-star valid period for the denominator in the normalized pointing signal<strong>Gravity</strong> <strong>Probe</strong> B — <strong>Post</strong> <strong>Flight</strong> Analysis • Final <strong>Report</strong> March 2007 321
expression, which otherwise on a point-by-point basis would add about 2% to the pointing noise. The commonmodenoise is removed to first order in the numerator of the normalized pointing signal since it is a differencebetween the + and – detector currents, which each contain the common-mode noise.We find the resulting RMS noise in units of marcsec using the fact that the noise is Gaussian and the fact thatthe actual pointing can not change a significant amount compared to the noise from sample to sample (only 0.1s). This allows the noise to be estimated using the first differences between adjacent samples.Equation 11-3Figure 11-11 through Figure 11-14 are plots of the calculated noise for the four detector pairs as a function oftime. The time is in days, where day 1 begins on January 1, 2004 at 0 hours. Each noise point is the average noiseduring one guide star valid period.Figure 11-11. X-axis, A side RMS pointing noise equivalent due to detector noise322 March 2007 Chapter 11 — Telescope Readout Subsystem (TRE) Analysis
Figure 11-12. Y axis, A side RMS pointing noise equivalent due to detector noiseFigure 11-13. X axis, B side RMS pointing noise equivalent due to detector noise<strong>Gravity</strong> <strong>Probe</strong> B — <strong>Post</strong> <strong>Flight</strong> Analysis • Final <strong>Report</strong> March 2007 323
Figure 11-14. Y axis, B side RMS pointing noise equivalent due to detector noiseThe average, maximum, and minimum noise for the four channels are given in Table 11-5. The noise variationswith time are clearly correlated with the summed weighted currents (the denominator of the normalizedpointing signal), which vary with the intensity of the guide star. Requirement 7.5.2 of T003 requires that theRMS noise, as defined in the equation above, be less than 75 marcsec. This is met only for the X-axis for the A-side electronics and the X-axis for the B-side electronics. The average noise for the Y-axis for the A-sideelectronics is 83.8 marcsec, just 12% above the requirement.Table 11-5. On-orbit detector pair characteristicsChannel(Rotation Axis/Electronic Side)AverageSummedWeightedCurrent (fA)AverageNoise(marcsec)MaximumNoise(marcsec)MinimumNoise(marcsec)Ration S /n EX-Axis, Side A 23.7 51.8 58.0 47.7 1.07Y-Axis, Side A 13.4 84.4 96.4 77.4 0.74X-Axis, Side B 15.4 74.0 84.0 68.2 0.82Y-Axis, Side B 16.7 109.7 127.3 99.8 0.46We can estimate the contribution of the photon/electron pair shot noise n S and of the electronic noise n E withthe following expression and the knowledge of the summed weighted currents of each of the detector pairs,which vary with the brightness of the star. The summed currents i S are plotted in Figure 11-15 throughFigure 11-18 as a function of time, again in days. The fit assumes the following model.2 2 SnT= nS+ nE= +iScciE2SEquation 11-4324 March 2007 Chapter 11 — Telescope Readout Subsystem (TRE) Analysis
Using the on-orbit data, the ratios of shot noise to electronic noise are given in Table 11-5. The first threechannels in the table have ratios of n S /n E that correlate in an expected way with the summed current, i.e. theratio increases as the summed current increases. The channel for the Y-axis, B-Side, however, appears to have alarger electronic noise than the other three channels.Figure 11-15. X axis, A side current variationFigure 11-16. Y axis, A side current variation<strong>Gravity</strong> <strong>Probe</strong> B — <strong>Post</strong> <strong>Flight</strong> Analysis • Final <strong>Report</strong> March 2007 325
Figure 11-17. X axis, B side current variation11.4.5 Dither amplitude variationFigure 11-18. Y axis, B-side current variationThe telescope scale factors for both axes are matched to the gyroscope scale factors by sinusoidally dithering thespace vehicle at two dither frequencies, nominally one about the X axis and one about the Y axis. Initially thedither periods were 30 s and 40 s. They were changed to 29 s and 34 s in December 2004 (Vehicle Time156484800.0 s) to prevent the 2 nd harmonic of roll frequency being too close to the second dither period when itwas 40 s. The commanded dither amplitude, when it is on, is kept at a constant amplitude.326 March 2007 Chapter 11 — Telescope Readout Subsystem (TRE) Analysis
Figure 11-19 is a plot of the dither amplitude as a function of time in days beginning at 0 hours, 1 January 2004.The most notable feature in this figure is the ~10% variation in the dither amplitude at the rotation period of theguide star, IM-Peg. This same feature is also observed in the telescope X-axis dither amplitude. A similarcorrelation with the guide star brightness is also seen in the variation of the dither amplitude observed in thegyroscope pointing signals. This variation with the guide star brightness is the result of the detailedimplementation of the attitude controller. The attitude controller in the ATC system assumes a constantdenominator in the determination of the telescope normalized pointing signal. This results in the attitudecontroller injecting dither amplitudes into the pointing that vary with the guide star brightness. The change inthe average dither amplitude at about 350 days is associated with the change in dither frequencies.11.4.6 Bias VariationFigure 11-19. Dither amplitude as a function of timeIt was observed that the difference between the pointing angle as read by the primary channels and redundantchannels vary as a function of time. The variation correlates with the star intensity variation. Figure 11-20 showssuch variation from 1 August 2004 to 31 May 2005. The top graph is the summed detector current of TRE-XAchannels. Each data point is an average of all data points over one orbit in guide star valid period. The raw datais based on level 1 data with a radiation event removal filter. The bottom graph is the pointing angle differencebetween primary and redundant channels. Here again, each data point is an average over one orbit with theguide star valid. In both graphs, the nominal weighting factor is used.<strong>Gravity</strong> <strong>Probe</strong> B — <strong>Post</strong> <strong>Flight</strong> Analysis • Final <strong>Report</strong> March 2007 327
Figure 11-20. Pointing angle difference between primary and redundant readoutsOne possible explanation for such a variation is the variation of the weighting factor. The mechanism for such aweighting factor variation could be that the light transmission efficiencies from the two roof prisms to each ofthe eight photo detectors have different spectral responses. It was found from ground observations by GregHenry from Tennessee State University that the color of IM Peg also varies with the same period as the starbrightness. Figure 11-21 shows the color variation of IM Peg based on Greg Henry's data.Based on the data shown in Figure 11-21, a model based on the guide star spectrum and spectral properties ofthe light transmission through the optical system with a correction term for the color response differencebetween + and - detectors, a preliminary calculation indicates that the color variation could cause the weightingfactor to vary so as to cause a pointing angle change of 50 marcsec.Figure 11-21. The color variation of IM Peg. The sum of the detector current of one of the axisis also shown to indicate how star brightness varies.The weighted summed current for each of the four detector pairs were calculated and averaged from orbit toorbit in the guide star valid periods. Figure 11-22 shows such a plot from 1 July 2004 for each of the four pairs.Most points for the pair XB are hidden below those for YB. These data were then scaled to the data on 30 May328 March 2007 Chapter 11 — Telescope Readout Subsystem (TRE) Analysis
2004 and converted to the instrument magnitude for each pair of detectors. Figure 11-23 shows the datacomparison with ground measurement by Greg Henry in the R band. Considering IM Peg is a red star, and thepass band of the telescope optics peaks in the red region, the comparison to the R band is thus justified. Theagreement between the two measurements is striking.Figure 11-22. The scaled summed current for each of the four pairs of detectors.Figure 11-23. Comparison of four pairs of scaled summed current with each otherand with R band of ground measurement.In Figure 11-23, there is reasonable agreement of the relative intensity change in all four pairs of detectors. Toexamine the comparison in more detail, summed currents in XA, YA and YB channels are scaled against XBchannel. The scaled values are then normalized near unity. Figure 11-24 show the scaled comparisons.<strong>Gravity</strong> <strong>Probe</strong> B — <strong>Post</strong> <strong>Flight</strong> Analysis • Final <strong>Report</strong> March 2007 329
Figure 11-24. Scaled summed current compared with the values of channel XB.The ratios have been normalized for easy comparison.Here, again one sees a variation which correlates with the pattern of the star intensity variation. This providesyet another indirect evidence for weighting factor variation with star intensity. This also provides an estimate ofthe reliability of the weighted summed current at no worse than ±0.5%.Since the transmission to each of the eight detectors has a different color dependence, and IM Peg becomesbluer when brighter, the weighting factor varies with time with the same period of IM Peg. Such variations aretypically less than 1%. During the post calibration phase, we observed both Zeta Peg and HR Peg for anextended period of time. Preliminary analysis confirms the weighting factors do depend on the color of the star.Further analysis is in progress to estimate the impact of the weighting factor variation.Other parameters affecting the pointing bias include the settings of the TRE clamp voltages, the thermalenvironment of the detector platforms as well as the thermal environment of the TRE box. These effects are alsounder analysis.The direct impact of the weighting factor variation is a pointing bias variation in the body fixed frame. To the1st order, such variation has no impact on the science signal as long as the variation is within the linear region.A detailed analysis is underway to evaluate the ultimate effect on the gyro readout.330 March 2007 Chapter 11 — Telescope Readout Subsystem (TRE) Analysis
Figure 11-25. Comparison of estimated photocurrent based on Science slopes andon least square fit slope derived from TRE snapshots11.4.7 Snapshots Comparison to Science SlopesThe telescope signals are processed by two on-board algorithms, which are named ATC Slopes and ScienceSlopes. Both the ATC slopes and the Science slopes are calculated at the rate of 10 per second (for all eightdetectors); the ATC slopes are used in near real time by the attitude control system to point the telescope at theguide star. Typically, the Science slopes are in the telemetry formats at the highest rate of 10 per second, whilethe ATC slopes are at a rate of one per second. Intermittently the raw A/D converter samples, which are at a rateof 2200 samples per second, are also in the telemetry data stream called Snapshots. Snapshots need to bemanually scheduled, and they are telemetered at a maximum rate of one frame of 300 contiguous A/D samplesper ten seconds. There is a 0.3 s offset between vehicle times for Snapshots and Science slopes.The snapshot data have been processed on the ground for a fidelity comparison between the ground-basedSnapshot slope (calculated with a least squares algorithm using the same points as used by the onboard Scienceslope algorithm) to the slope estimated and reported by the Science slope algorithm. Figure 11-25 shows theresult of 267 snapshots compared with Science slopes, where the resulting slopes have been scaled to detectorphotocurrent in fA. This comparison verifies that the on-board Science filter and a simple least square filterproduce similar results with a correlation coefficient of 0.97364. Hence the Kalman filter derived Science slopesdiffer somewhat from the least squares estimate. This difference is attributed to the choice of Kalman filtercoefficients that were optimally derived from a similar comparison early in IOC part of the mission. TheKalman filter provides an optimal estimator for the slope since the charge integrated signal contains bothelectronic white noise and photon/electron shot noise.11.4.8 Telescope and Windows operating temperatureThe temperatures of the window mounts and telescope top plate were monitored continuously until the ECUwas turned off on 28 April 2005. After that date, the temperature was measured once a week.<strong>Gravity</strong> <strong>Probe</strong> B — <strong>Post</strong> <strong>Flight</strong> Analysis • Final <strong>Report</strong> March 2007 331
Figure 11-26 through Figure 11-29 show the temperature variations of these platforms from the start of themission.Figure 11-26. Temperature variation of telescope top plateFigure 11-27. Temperature variation of Window 1Figure 11-28. Temperature variation of Window 2Figure 11-29. Temperature variation of Window 4332 March 2007 Chapter 11 — Telescope Readout Subsystem (TRE) Analysis
12Cryogenic Subsystem Analysis<strong>Gravity</strong> <strong>Probe</strong> B — <strong>Post</strong> <strong>Flight</strong> Analysis • Final <strong>Report</strong> March 2007 333
334 March 2007 Chapter 12 — Cryogenic Subsystem Analysis
This subsystem provides the cryogenic, mechanical, and magnetic environments required by the scienceinstrument together with a view to the guide star (Figure 12-1). In this section, we focus primarily on dewarperformance, particularly lifetime, and on the performance of the magnetic shielding as well as the <strong>Probe</strong>vacuum.Figure 12-1. Integrated probe and dewar.12.1 Cryogenic System RequirementsSome of the key flight requirements for the dewar, probe, and the magnetic shield system are summarized inTable 12-1 below. Actual flight performance relative to these requirements is discussed in the referencedsections.Table 12-1. Key cryogenic system flight requirementsRequirement Section No. Doc. ReferenceMaintain a liquid helium bath temperature < 1.85 K controlled toT003, PLSE-12within 30 mKCryogen lifetime of 16.5 monthsT003, PLSE-12Liquid helium mass measurement to within 5%PLSE-12Vent flow measurement to within 5%PLSE-12Steady state field / gyro trapped flux < 9E-6 GT003, PLSE-12Magnetic field attenuation factor
12.2 Temperature / pressure control of the Main TankThe primary function of the dewar is to maintain a tank of superfluid helium at approximately 1.8 K so that thescience instrument can be maintained at its operating temperature of ~2.5 K. Thermal stability can bemaintained by allowing the heat leaking into the main tank to evaporate the liquid helium at an appropriaterate. This evaporation occurs at the external surface of a sintered porous plug, which acts as a phase separatorthat retains the superfluid liquid helium in the tank. (The porous plug was invented and developed by <strong>GP</strong>-B andhas been utilized by other flight programs requiring superfluid helium, e.g., IRAS, COBE.) The vapor thusproduced is then vented through a chain of four heat exchangers that warm the gas to the external boundarytemperature. The heat used to warm the gas is intercepted heat that otherwise would be conducted or radiatedto the liquid helium. By this means, the rate of evaporation of the liquid is significantly less than what it wouldotherwise be. After traversing the heat exchangers, the gas enters the thruster manifold and then is supplied tothe sixteen thrusters.The ATC subsystem controls the gas flow from each thruster according to the needs not only for attitude andtranslation control but also to maintain the appropriate pressure in the main tank. In general, the boil-off rate ofthe dewar exceeds the amount of gas needed for thrusting, and, in that circumstance, the excess gas is “nulldumped” such that no net torque or force is produced. When there is positive excess gas flow, the ATC pressurecontrol algorithm controls the total gas flow in such a way as to maintain a constant pressure in the thrustermanifold. If, on the other hand, the demand for thrusting exceeds the amount dictated by the pressure controlloop (negative excess mass flow), ATC allows the needed flow regardless of the pressure control loop.If the negative excess gas flow is such that on average the flow exceeds that provided by the main tank undernormal heat load, the pressure will decrease in the main tank causing the temperature also to drop. This isaccompanied by excessive cooling of dewar heat exchangers due to the high flow rate. If this condition were topersist, it could be compensated for by applying electrical heat to the main tank. It was not necessary to do this,however. In fact, except for special events and circumstances, ATC did maintain the main tank within a 5 mKtemperature band, well within the 30 mK requirement.12.3 Events and conditions related to Dewar performanceThe liquid helium consumption rate is not only determined by long-term conditions, but also by various eventsand conditions. Most of these events occur during the IOC (Initialization and On-Orbit Checkout) because theyare either part of planned IOC activity or because most unanticipated events occur early in the mission as partof the shakedown process. In fact, no significant additional thermal events occurred during the remainder of themission.12.3.1 LaunchLaunch occurred with the main tank 95.5% full (337 kg) and at a temperature of approximately 1.8 K. Thesemeet the requirements of launching at least 95% full and at a temperature less than or equal to 1.9 K. The guardtank was maintained at 4.2 K with normal boiling point liquid helium in order to reduce the heat rate to themain tank and avoid any need for servicing the main tank on the launch tower. During ascent the guard tankvented through a flow restrictor and a check valve that fully opened in zero-g. (The flow restriction wasrequested by Boeing in order to ensure that the cold gas would not damage the fairing on ascent.) This blowdownand depletion of the guard tank caused a substantial sub-cooling of the guard tank, heat exchangers, andvapor-cooled shields. This temporarily maintained a heat rate into the main tank that was below the steady-statevalue, which, if anything, is beneficial to the performance of the system. (The guard tank normally runs in the 25– 30 K range when cooled only by vent gas from the main tank.) The flow restrictor prolonged the completedepletion of the guard tank, but this had no material impact on the performance of the cryogenic subsystem.336 March 2007 Chapter 12 — Cryogenic Subsystem Analysis
12.3.2 Thermal transient eventsAbout a week into the mission, large thermal transient events (temperature spikes) were observed at probe anddewar station 200 and elsewhere in the <strong>Probe</strong> (Figure 12-2). These events were logged as Observation 029, andwere noted to have a period of about 24 minutes and an amplitude of 20 - 40 mK at probe station 200. After fivedays, the amplitude had increased to 150 mK with a period of 40 minutes as measured at probe station 200, andan adverse impact on SQUID readout performance was noted. Although no direct evidence was available toconfirm it, it was felt that the only feasible explanation for this phenomenon was periodic desorption andadsorption of residual helium gas in the dewar well. (A small long-term leak through cold valve RAV5 allowedhelium to leak into the well during guard tank fill operations prior to launch. A special well pumping line hadbeen installed to allow the well to be evacuated after fill operations. Normally pumping operations would extendfor about a day, but due to prelaunch schedule limitations, this was curtailed to a few hours after the last filloperation prior to launch.) Because the well was slowly venting to space through an opened pyrovalve, it was feltthat this problem would eventually resolve itself. Indeed, the period between spikes continued to lengthen andthe phenomenon was self-extinguishing by the time the flux reduction operation (see below) was initiated. Theheating that occurred during the flux flush operation undoubtedly caused additional gas desorption andremoval from the well, and the phenomenon was never observed again. It should be noted that although thisphenomenon had a significant adverse impact on SQUID readout noise performance, it did not have asignificant impact on dewar thermal performance.Figure 12-2. Temperature spiking at probe station 200 (primary cryogenic probe/dewar interface).12.3.3 Stuck thrustersOn two separate occasions, after launch and near the end of the flux-reduction operation, one thruster(numbers 6 and 8, respectively) failed in a high-flow configuration. In each case, the problem was corrected byclosing the appropriate thruster isolation valve (TIV). (There is sufficient redundancy in the thruster system to<strong>Gravity</strong> <strong>Probe</strong> B — <strong>Post</strong> <strong>Flight</strong> Analysis • Final <strong>Report</strong> March 2007 337
control the space vehicle without these two thrusters.) As a result, there was excessive loss of liquid helium.Some of this loss is recoverable (sub-cooling of the heat exchangers and vapor-cooled shields temporarilyreduced the heat rate; flow rate can consequently be reduced to allow temperatures to recover to normal values),but there is also some permanent loss.12.3.4 Heating events in the <strong>Probe</strong>There were three heating events in the <strong>Probe</strong>. These events added additional heat load to the main tankprimarily through the station 200 interface, but also to some extent through residual gas conduction in thedewar well. These events were 1) low temperature bakeout rehearsal, 2) trapped flux reduction, and 3) lowtemperature bakeout (post gyro spinup). The first and third events were relatively mild with maximumtemperatures in the 6 –7 K range and durations of less than a day. The trapped flux reduction process producedtemperatures up to 13 K and lasted for 36 hours. This event warmed the main tank over 1.9 K as the maximumvent rate (limited by choking of the porous plug) was not high enough to maintain heat balance. Functionally,however, all the heating events met their requirements and accomplished their purposes.12.3.5 Drag-Free operationAfter gyro spinup and at the commencement of drag-free operation, it was found that there was sufficientnegative excess flow rate (i.e., demand by ATC for flow in excess of that called for by the pressure control loop)to cause the main tank to cool. Compared to the stuck-thruster incidents, however, this incident was ratherminor with the negative excess occurring only during a fraction of each orbit. If this matter could not beresolved, however, it had the potential for shortening mission lifetime. It was subsequently discovered that if thepressure control loop were given additional control authority (a total range of 3 mg/s instead of 0.6 mg/s) thesubsequent reduction in null dumping was sufficient to make up for the periods of negative excess flow andstabilize the tank temperature in the long run. The main tank has enough heat capacity that it does not reactnoticeably to orbital period flow variations.12.3.6 Effect of Dewar shell temperatureThe parasitic heat rate into the main tank (i.e., the heat rate in excess of that imposed by the science instrument)is ultimately a function of the dewar vacuum shell temperature. The exposed portion of the dewar vacuum shell(the cone and cylinder) is passively cooled by use of a FOSR (flexible optical solar reflector) film. This filmreflects visible solar radiation while being an effective radiator to space in the infrared wavelengths. In general,shell temperatures followed seasonal trends as expected (colder when the sun was aft and illuminating thespacecraft, and warmer as the sun moved forward). On some occasions, however, the dewar shell temperaturewould run warmer than predicted (see discussion on lifetime estimation below), and this would have thetendency to elevate the heat rate into the main tank.12.3.7 Thermo-acoustic oscillations (TAOs)A TAO is a pressure oscillation that can occur in any gas-filled line that traverses a large thermal gradient, forexample, the vent line of a cryogenic system. It is driven by the thermal gradient, and can sometimes cause adramatic increase in heat rate to the cryogen. TAO activity has been previously observed in the main tank ventline in some non-flight configurations, and the question naturally arises as to whether it has affected heat rateon orbit. The answer is no for two reasons: The entire <strong>GP</strong>-B vent system was analyzed by Dr. Sidney Yuan, arecognized authority on TAO analysis, who determined that it was unconditionally stable against TAO.Secondly, the short-term peak-to-peak variation in the unfiltered thruster manifold pressure data during flightwas approximately 0.1 torr. (Some of this is undoubtedly electronic noise since the analog circuitry before the338 March 2007 Chapter 12 — Cryogenic Subsystem Analysis
A/D converter is broadband. Also, operation of the thruster system contributed to pressure fluctuations.) Ourexperience has indicated that TAO activity at the 0.1 torr level or less is completely inconsequential compared tothe normal parasitic heat rate. Thus, there is no evidence that TAO activity played a role in flight performance.12.4 Lifetime projectionMost missions that use expendable cryogens are typically observational in nature. Lifetime prediction is usefulfor planning and prioritization. In the case of <strong>GP</strong>-B, however, lifetime prediction is a bit more significant innature. This is because the mission plan calls for a post-science calibration phase to apply known perturbationsand measure their effects. This allows the quantification of various systematic errors. Many of these tests aredone at the end of mission because they involve perturbing fully spun-up gyros, effectively ending science andentailing some degree of risk. As a consequence, it is important to monitor dewar performance and periodicallymake updated predictions of the time of cryogen depletion.12.4.1 Thermal modelsBecause the dewar shell temperatures vary somewhat throughout the year, the heat rate to the main tank alsovaries. In order to predict future heat rates, it is useful to have a thermal model of the space vehicle that predictsthe dewar shell temperatures and a thermal model of the payload that estimates heat rate into the main tank as afunction of the dewar shell temperatures. The payload model correlates well with both ground measurementsand with on-orbit measurements when measured dewar shell temperatures are utilized. There is somediscrepancy, however, with the ability of the space vehicle model to predict dewar shell temperatures on orbit.This model predicts shell temperatures on the dewar forward cylinder that are as much as 10 K lower whenmeasured in the warm season (sun forward). Likewise, the model under-predicts the dewar top platetemperature by as much as 10 K during the cold season (sun aft). Discrepancies at other locations and seasonsare not as severe. The net effect of these discrepancies on payload performance, however, is not major. Theaverage flow rate predicted on the basis of measured shell temperatures is 7.68 mg/s, whereas the valuepredicted for calculated shell temperatures is 7.84 mg/s, a 2.1% discrepancy (Figure 12-3). It should be noted,however, that cryogen lifetime easily exceeds one year. That being the case, once the launch anniversary isreached, it is possible to look at the previous year’s data to aid in prediction. The perturbations occurring duringthe IOC phase tend to limit the utility of this approach, however.<strong>Gravity</strong> <strong>Probe</strong> B — <strong>Post</strong> <strong>Flight</strong> Analysis • Final <strong>Report</strong> March 2007 339
Figure 12-3. Helium flow rate predicted by dewar model based on both the measuredshell temperatures and predicted temperatures.12.4.2 Helium mass gaugingThere are three independent ways of determining helium usage. Two of the three, the flow meter and the heatpulse measurement system, are instruments built into the dewar. The remaining is a mass flow rate estimategenerated by the ATC software, based on commanded control force and the nominal specific impulse of eachthruster. The two flow rate measurements must be integrated downward from the initial quantity of liquidhelium (337 kg at launch as determined by a superconducting liquid level sensor coupled with a solid model ofthe interior of the main tank), whereas the heat pulse measurement yields a direct measurement of remainingliquid. Other factors involved in these measurements will be reviewed below.12.4.3 Initial lifetime estimateThe prediction for on-orbit performance made prior to launch was 18.8 months with no contingency. Thisresult did not include impacts of planned thermal events. For purpose of a prediction near the end of IOC,vacuum shell temperatures were adjusted upward by a fixed temperature increment. This was a conservativeway to incorporate elevated dewar shell temperatures. Using this approach, the payload model predicted anannual average boil-off rate of 8.3 mg/s. Based on the heat pulse measurement result of 269 kg on 28 June 2004,we expected a remaining life of 10.5 months as of 8/23/04 (near the end of IOC). Total predicted lifetime was14.7 months from launch compared to the mission requirement of 16.5 months. According to the ProgramChief Scientist, however, this was deemed sufficient to meet mission needs.340 March 2007 Chapter 12 — Cryogenic Subsystem Analysis
12.4.4 Update of lifetime estimateAfter the passage of over a year since launch, six HPM measurements (see below) had been made and otherinformation became available that caused a significant change in our lifetime estimate. Our new estimate wasfor depletion to occur on September 1, 2005, for a total lifetime of 499 days or 16.4 months, an increase of 1.7months over the initial estimate. This corresponds to an average boil-off rate of 7.8 mg/s. The reason for thechange was that early in the mission there were insufficient HPM operations to establish a trendline and it wasassumed that the flow meter results were accurate. As more HPM data, which correlated well with ATC flowrate values, became available, it became clear that the flow meter results were too high, and they wereconsequently discounted.12.5 Heat pulse measurement (HPM) operationThis section discusses the heat pulse measurement (HPM) procedure that was used to determine the amount ofliquid helium remaining in the dewar at various points in the mission.12.5.1 Principle of operationThe HPM operation is a calorimetric technique involving the addition of a known amount of thermal energy tothe main tank and measuring the resulting temperature rise to determine the mass of liquid helium. This can bedone to a reasonable degree of accuracy for three reasons: 1) The heat capacity of the main tank is dominated bythat of the liquid helium, 2) the thermodynamic properties of liquid helium are well known, and 3) the fact thatthe measurement involves superfluid helium means that the liquid is highly isothermal and that its thermalrelaxation time is virtually instantaneous. (This is true of even separate pockets of liquid but not true of thevapor phase, as will be discussed below.) In order to make the most accurate measurement, however, it is usefulto defeat the ATC pressure control loop and maintain a constant flow rate throughout the entire heat pulseperiod. The amount of heat added is chosen such that it is expected that the temperature rise will be on the orderof 10 mK. This is a large enough temperature rise to allow a reasonably accurate measurement of thetemperature rise yet not so large as to significantly affect dewar lifetime. Because of the potential to adverselyaffect lifetime, the hardware used to supply power to the heat pulse heaters is designed with redundant shutoffmechanisms. In addition, they are limited in number (four in a year vs. typically four a day for the flow meter)in order to limit impact on lifetime and risk.There is another issue that should be noted. The amount of helium deduced from the HPM for a giventemperature rise is proportional to the amount of thermal energy deposited into the main tank. The intentionwas to infer the energy from the measurement of the voltage across the heater resistance in conjunction with themeasured current or known heater resistance. The measurement was to be made with a standard four-terminaltechnique. This is important because the electrical leads that traverse the thermal gradient of a dewar are madeof a relatively resistive material (manganin) in order to limit thermal conductance. Unfortunately, due to adesign oversight, the input of the op-amp used to measure the voltage was referenced to ground, as was thecurrent source. This meant the measured voltage included the voltage drop across some of the electrical leads,which, in turn, introduces a potential scale factor error. This also meant that the inferred quantity of heliumcould be in error by some factor and the consumption rate could also be off by the same factor. It is essential tonote, however, that since this is a scale factor error, it does not affect the zero intercept, the projected time ofdepletion.The only effect that is likely to cause a bias error, which does affect the projected time of depletion, is a source ofheat capacity in addition to that of the liquid helium. Additional, unaccounted for, heat capacity would lead toover-estimation of the quantity of liquid and the lifetime. There are two candidates in this regard: the main tankassembly and the helium vapor. The former is completely negligible: The main tank, taken as 250 kg ofaluminum, has a heat capacity approximately equal to one part in 10 4 of 100 kg (~1/3 of initial fill) of liquid<strong>Gravity</strong> <strong>Probe</strong> B — <strong>Post</strong> <strong>Flight</strong> Analysis • Final <strong>Report</strong> March 2007 341
helium at 1.8 K. It does not appear, however, that the effect of the vapor is quite so negligible: When the maintank is at 10% of capacity, the heat capacity of the vapor is nearly 6% of that of the liquid. In the analysis of theHPM results, it was therefore assumed that the vapor was in equilibrium with the liquid, and its contribution tothe overall heat capacity was taken into account. This turned out to be a questionable assumption, as will bediscussed below.12.5.2 Results from HPM operationsSix HPM operations have been performed with the first being on 6/28/04, and the last on 7/29/05. In each case,the duration of heater operation was selected to yield a temperature increase of approximately 10 mK with aheater power of 1.44 W. This was chosen to yield a good signal-to-noise ratio for the temperature rise (~ 1%)without perturbing the system too greatly or significantly reducing lifetime (~15 hours for the firstmeasurement and proportionately less for subsequent measurements). An example of the data produced bysuch a measurement is shown in Figure 12-4, and the results of all six measurements are shown in Figure 12-5together with a linear fit and extrapolation to depletion. Also shown in the latter figure is the fact that abackward extrapolation of the linear fit to the date of launch disagrees with the initial quantity of 337 kg byabout 13%. This disagreement is indicative of a possible scale factor error, discussed above, which does not alterthe zero intercept on the time axis (end of life).Figure 12-4. Main tank temperature in response to fourth heat pulse measurement with lineartrendlines before and after heat pulse. Temperature increase is taken to be the difference in thetwo trendline values at the middle of the pulse.342 March 2007 Chapter 12 — Cryogenic Subsystem Analysis
Figure 12-5. Plot of the remaining mass of liquid helium as a function of HPM measurement date with lineartrendline. The fact that the trendline does not project backwards to the original quantity of liquid helium (takento be 337 kg) is indicative of a scale factor error.12.6 Dewar Vent Rate MeasurementThe mass flow meter measures temperature rise of gas stream resulting from a constant heater power input. Itconsists of a combination of a heater and thermometer located on the main tank vent line between HEX0 (HeatExchanger-0) and HEX1. In general, the higher the flow rate, the lower the temperature rise. The thermalresponse to flow is typically nonlinear and is calibrated during ground test with a wet test meter. Because of theheat added to the cryogenic region (80.6 mW), the heater is operated intermittently with typical flow meteroperation being performed generally four times a day for the first year of the mission. (After that theExperiment Control Unit, ECU, which operated the flow meter, was turned on only once a week due tointerference with two of the SQUID readout systems.) By integration of the flow data from a time when thequantity of helium is otherwise known, it is possible to estimate the current quantity of remaining helium.As noted previously, ATC also continuously estimates flow rate for control purposes using pressure transducersat each of the thrusters. A plot of both measurements is shown in Figure 12-6. Figure 12-7 shows the remainingmass estimate obtained from integrating both of these flow rate measurements together with linear least-squaresfits for both curves. The ATC flow rate result is typically about 10% lower than the dewar flow meter. Thisshows up as a difference in slopes in Figure 12-7. Since both curves start with the presumption of 337 kg, there isapproximately two months of difference in the projected times of depletion from the linear fits. This points upan inherent problem with the integration of a flow rate measurement: any systematic error, whether bias or scalefactor, ends up affecting the end point estimate.<strong>Gravity</strong> <strong>Probe</strong> B — <strong>Post</strong> <strong>Flight</strong> Analysis • Final <strong>Report</strong> March 2007 343
Figure 12-6. Flow meter and ATC flow rates as a function of UTC date starting at launch. Data encompassperiods of flow control (constant segments in the ATC data) as well as pressure control.Figure 12-7. Mass remaining estimated from integrated flow meter and ATC flow rates. Trendline fits areextrapolated to zero mass. Since depletion did not occur in early July, it is clear that the dewar flow meterresults under-predicted lifetime.12.7 Reconciliation of lifetime estimatesA comparison of Figure 12-5 and Figure 12-7 indicate that the three different measurements yield threedifferent predictions for end of life. However, the HPM and ATC results disagree only by eight days out of 16.4months (1.6%). Of the three, the HPM was probably the most credible for the reasons that have been noted.344 March 2007 Chapter 12 — Cryogenic Subsystem Analysis
This implied that the dewar flow meter results were about 10% too high. It should be noted that there is a reasonto be concerned about the dewar flow meter calibration: The calibration of the flow meter was performedduring payload test and prior to a replacement of a dc-dc converter in the ECU after the vehicle had beenshipped to Vandenberg. Thus there is a possibility that the power being applied to the flow meter heater isdifferent than that used during calibration. There is a provision for four-terminal voltage measurement on thisheater, but unfortunately this monitor circuit suffers the same problem as the HPM heater monitor.In addition, there is one other piece of evidence in support of the conjecture that the dewar flow meter resultsare about 10% too high. If the ATC flow data are plotted together with the dewar flow meter data reduced by10%, and the dewar thermal model results (based on measured dewar shell temperatures) are also plotted, allthree results are in reasonable agreement. This is illustrated in Figure 12-8. Also, by using the 13% scale factorcorrection on the HPM results and inferring an average flow rate, the HPM results can be brought into thecomparison: The average flow rate thus inferred from the HPM is 7.80 mg/s, which compares to the long-termATC average of 7.72 mg/s. Hence, it would appear that although there were some unresolved issues, the variousgauging techniques could be reconciled with each other in a consistent way by making some reasonableassumptions.Figure 12-8. Flow meter data reduced by 10% and plotted with ATC flow rate and flow rate predicted by thedewar thermal model. Thermal model is based on measured shell temperatures rather than predicted shelltemperatures.12.8 Comparison of lifetime prediction with final resultSubsequent to the last HPM operation, updated EOL predictions were made by integrating the ATC flowdownward from the last HPM result (17.8 kg) to the then-current date, and then integrating to zero using aprojected flow rate based on the flow rate measured a year ago. The resulting EOL predictions varied a little but<strong>Gravity</strong> <strong>Probe</strong> B — <strong>Post</strong> <strong>Flight</strong> Analysis • Final <strong>Report</strong> March 2007 345
were generally within a day or so of September 2, 2005. The actual time of depletion turned out to be 20:50 Z onSeptember 29, 2005 (527.2 days or 17.3 months into the mission). This represents a mission duration predictionerror of -5%.Although a 5% error in duration does not seem too bad, in fact it represents a substantial error in the latterHPM results. For example, HPM #6 (on day 465 of the mission) yielded a liquid mass estimate of approximately20 kg. (This includes the 13% correction for the probable scale factor error noted previously.) If one were toassume a constant boiloff rate of 337 kg over 527 days, one would expect that there would have beenapproximately 39.6 kg on day 465. HPM #6 was therefore likely to have been 49% too low. It should also benoted that the sign of the error (underestimation of liquid) is such that the problem is not that there is heatcapacity missing from the analysis, but rather there is too much non-liquid heat capacity being assumed in theanalysis. (This turned out to be fortunate because it caused the program to start the calibration phase earlierthan it would have otherwise. The extra time in the calibration phase turned out to be very valuable.)The most likely source of this problem is an assumption made in the analysis of the HPM data: that the entirecontents of the main tank, liquid and vapor, were in equilibrium both before and after the heat pulse. This isprobably not correct. The contact between vapor and liquid comes in two forms: thermal and mechanical.When power is applied to the HPM heater, which is in contact with the superfluid, its temperature andsaturated vapor pressure increase immediately. (The roll of the vehicle at a rate of 12.9 mHz forces the liquid toreside against the outside wall of the main tank and the vapor to form a central vapor bubble surrounding thewell during most of the mission. The HPM heaters are mounted on the slosh baffles, which are located at theouter wall and thus are kept in good contact with the liquid.) The pressure increase propagates at the speed ofsound throughout the vapor and can maintain even isolated pockets of superfluid (if any were to exist) inequilibrium through the process of evaporation and recondensation. This effect has been clearly demonstratedby M. Wanner for the ISO program. [Ref.: M. Wanner, Adv. Cryo. Eng. 33, 917 (1988).]Thermal transfer within the bulk of the vapor phase is of a different nature, however. Since the vapor is aclassical gas, there are two mechanisms that transfer heat: thermal conduction and convection. It will be shownthat the vapor is convectively stable so that the primary thermal transfer mechanism is conduction, wherein thetemperature distribution is governed by the diffusion equation together with the relevant boundary conditions.The relevant diffusion coefficient to be used in this equation is the thermal diffusivity, which is the ratio of thethermal conductivity of the gas to its heat capacity per unit volume (i.e., the specific heat times the density). It isequal to approximately 1x10 -6 m 2 /s for saturated helium vapor at 1.85 K. The key question now is how theequilibration time scale compares to the post-heat-pulse measurement time. An order-of-magnitude estimate ofthe equilibration time is reciprocal of the thermal diffusivity times the square of a relevant dimension (~0.5 m),which is on the order of 10 5 s. The post-pulse measurement time was always less than 10 4 s (see Figure 12-4).Although the numbers are rough, they definitely do support the picture that true thermal equilibration is slowcompared to the measurement time and consequently that the vapor is essentially adiabatically compressed bythe change in vapor pressure induced by the heated liquid.As noted above, all the initial HPM analysis was done assuming liquid-vapor equilibrium. This is theassumption made on the SHOOT program [Ref.: M.J. DiPirro, P.J. Shirron, and J.G. Tuttle, Adv. Cryo. Eng. 39,129 (1994)], although it was noted that this assumption did not apply during ground test when stratificationwould occur. In our case, when approximately three weeks had passed after the predicted depletion date withoutdepletion actually occurring, it was decided that the liquid-vapor equilibrium assumption needed rethinking.This was done by re-analyzing the HPM results under the assumption that the vapor phase underwent nochange of state during the measurement period subsequent to the heat pulse. This assumption essentially hasthe effect of ignoring the presence of the vapor and is the one used in the Wanner paper cited above. The resultof the re-analysis was to extend the EOL estimate by over a month to 10/11/05, which turned out to be in errorby +2.3% (total mission duration). Although this was an improvement over the original estimate (durationprediction error of -5%), it was realized that this was a untenable assumption except as a simple mathematicalapproximation: Even though it is reasonable to assume that the vapor is thermally decoupled from the liquid for346 March 2007 Chapter 12 — Cryogenic Subsystem Analysis
the time scales under consideration, it is not reasonable to assume that it is mechanically decoupled. As notedabove, over short time scales the evaporating liquid will adiabatically compress the vapor, and this will causeboth a density and a temperature increase throughout the bulk of the ullage vapor. In fact, an estimate (based onthermodynamic data) of the effect of heating 1.85 K liquid by 10 mK indicates that the vapor will becompressionally heated by 24 mK, or over twice as much as the liquid! It is for this reason that the vapor is mostlikely to be convectively stable, as was asserted previously. In order to test this hypothesis, the HPM data werere-analyzed a third time under the assumption of adiabatic compression of the vapor. Since this assumptiontakes the vapor off the saturated vapor pressure curve, the density and specific internal energy changes in thevapor were calculated using the adiabatic compressibility parameter derived from tabulated thermodynamicdata. [Ref.: V.D. Arp, and R.D. McCarty, NIST Technical Note 1334, 1989.] The results of the analyses of theHPM data using each of the three assumptions together with the actual depletion date are shown in Figure 12-9.It can be seen that the case where adiabatic compression has been assumed yields results that are intermediatebetween the other two. This is not surprising since adiabatic compression by a given pressure increment takesless energy than equilibrium compression (which is more nearly isothermal) thereby causing the analysis toproduce a larger liquid mass estimate. The reduction in mission duration prediction error achieved by assumingadiabatic compression rather than equilibrium compression is fairly modest, however, -3.8% instead of -5.3%. Itis not clear why the systematic error is this large (implied error of -31% for HPM #6 after correcting for the 13%scale factor error), but it is clear from the algebraic expression used to calculate the amount of liquid that theproblem is likely to involve an error in the presumed properties of the vapor, either the density or the specificinternal energy, or both.12.9 HPM Results: ConclusionsThe following appear to be reasonable conclusions based on our experience with the HPM technique:1. The calorimetric HPM technique is well (and uniquely) suited for use in measuring the quantity ofremaining superfluid liquid helium and in estimating time of depletion. Unlike an integrated flow metertechnique, the end-of-life estimate obtained from a sequence of HPM operations is insensitive to scalefactor(e.g., heater calibration) errors. If the initial quantity of superfluid is known with confidence, it canbe used to detect and correct errors of this sort.2. For 1.8 K operation, the largest source of systematic error in the EOL estimate appears to be inaccounting for the effect of the ulllage vapor. We analyzed our data using three different assumptionsregarding the post-HPM state of the vapor: a) the vapor stays in complete equilibrium with the liquid; b)the vapor is completely decoupled from the liquid and does not change state as a result of heat applied tothe liquid; and c) the vapor is adiabatically compressed by the increase in vapor pressure (i.e., the vaporis mechanically coupled to the liquid, but is thermally isolated). The first assumption is implausiblebecause the thermal equilibration time of the vapor is much longer than the measurement time. It led toa 5.3% underestimate of lifetime. The second assumption is implausible because mechanical couplingdoes cause rapid change in the state of the vapor when the liquid is heated. This assumption led to a 2.3%overestimate of lifetime. The last assumption is plausible if the ullage volume is large enough that thethermal diffusion time is long compared to the measurement time. This assumption led to a 3.8%underestimate of lifetime. It should be noted that one would logically expect that the actual result shouldlie somewhere between the predictions base on the first and third assumptions since, in reality, thesystem should be somewhere between isothermal and adiabatic. The fact of the matter, however, is thatthe actual result was between the second and third assumptions. Why this should be the case is not clear.3. Ultimately the vapor does re-equilibrate with the liquid so that, in principle, it should be possible to waitlong enough after the HPM operation for the equilibrium assumption to be true. Unfortunately this israrely a viable option. In a passive vent system (the most common configuration), the change in flow ratecaused by the HPM will cause long-term instability in the vent system (including the vapor-cooled<strong>Gravity</strong> <strong>Probe</strong> B — <strong>Post</strong> <strong>Flight</strong> Analysis • Final <strong>Report</strong> March 2007 347
shields) and subsequent instability in the bath temperature that will disturb the vapor equilibrationprocess. Even in a system such as ours, where the vent rate is actively controlled, the long-term stability israrely adequate due to environmental variation over various time scales (roll, orbital, diurnal) and due toelectronics and sensor drift.Figure 12-9. HPM data analyzed under three different assumptions together with extrapolated linear trendlines.12.10 Magnetic Shielding PerformanceThis section describes two aspects of <strong>GP</strong>-B’s magnetic shielding performance that are related to the cryogenicsystem: trapped flux in the gyro rotors and AC shielding.12.10.1 Rotor Trapped Flux<strong>GP</strong>-B has a unique magnetic shield system that provides an ultra-low magnetic field environment for thescience instrument. Considerable effort was also made to ensure that the materials used in constructing the<strong>Probe</strong> and the science instrument did not degrade this environment. The primary reason for this requirement isthe need to keep the magnetic flux in the gyro rotors below 9 microgauss (0.9 nT) uniform field equivalent.The trapped flux in the gyro rotors measured on orbit is smaller than 4 μG for all gyroscopes as shown inTable 12-2. (The readout system is only capable of measuring the component of trapped flux that threads thepickup loop and varies in time as the rotor rotates.) The trapped field in gyro 4 is more than an order ofmagnitude smaller. The table also compares the trapped field to the magnitude of the equivalent Londonmoment field for each rotor. These results indicate that the superconducting shield is nominal and that therewas no degradation of the shield as a result of launch conditions.348 March 2007 Chapter 12 — Cryogenic Subsystem Analysis
Table 12-2. Measured trapped field compared to the London moment equivalent field in each of the gyrorotors.GyroNo.Trapped field (μG) (Uniformfield equivalent and asaligned late in mission)12.10.2 AC ShieldingLondon moment equiv.field (μG)The second function of the magnetic shielding system is to prevent time-varying fields from coupling to thereadout pickup loops and contaminating the science signal. In this regard, the shields built into the dewar aresupplemented by superconducting cylindrical local shields around each gyro and by the diamagnetic effect ofthe superconducting rotors themselves. As it turns out, the limits on the AC magnetic shielding derived fromthe data while the gyros were caged early in the mission were not as tight as the limits obtained from the groundverification, which were 2x10 -12 (-234 db) attenuation. In any case, no evidence of a signal with the signature ofa leakage field was observed above the noise. In addition, the fact that the ambient dc field is nominal is goodprima facie evidence that the AC shielding has not been degraded from the ground test result.12.11 <strong>Probe</strong> Vacuum PerformanceRatio of trapped field toLondon moment1 3.1 57 0.0552 1.3 44 0.0293 0.859 59 0.0144 0.2 47 0.005Vacuum in the <strong>Probe</strong> is important during science data acquisition because of the damping effect residualhelium has on the gyro rotors. Of particular concern is differential damping wherein the component of spinalong the roll axis decays at a different rate than the component transverse to the roll axis. This can cause aprecession if the spin and roll axes are not exactly aligned. In order to keep this effect to an acceptable level,there is a requirement that the <strong>Probe</strong> pressure be less than or equal to 2x10 -10 torr after the low temperaturebakeout. In the absence of other damping torques, residual pressure can be determined by measurement of thespin-down decay time. In actuality, the spin-down decay time varied between 7,000 years for gyro 3 and 25,700years for gyro 4, however. This variability, along with other evidence, supports the contention that the spindownrates were dominated by some other mechanism (possibly patch effect) rather than by gas damping. Byusing the longest decay time, however, an upper limit of ~1.5x10 -11 torr (2 nPa) can be placed on the residualgas pressure—a result that is an order of magnitude below the requirement, demonstrating ample margin.<strong>Gravity</strong> <strong>Probe</strong> B — <strong>Post</strong> <strong>Flight</strong> Analysis • Final <strong>Report</strong> March 2007 349
350 March 2007 Chapter 12 — Cryogenic Subsystem Analysis
13Other Payload Subsystems Analyses<strong>Gravity</strong> <strong>Probe</strong> B — <strong>Post</strong> <strong>Flight</strong> Analysis • Final <strong>Report</strong> March 2007 351
352 March 2007 Chapter 13 — Other Payload Subsystems Analyses
13.1 Experiment Control Unit (ECU)The Experiment Control Unit (ECU) preformed nominally during <strong>GP</strong>-B Operations. All tasks were completedon schedule and without error. The ECU’s success can be directly attributed to extensive software and hardwaredevelopment and testing, anomaly identification, analysis, resolution and when necessary, rework prior tolaunch. Instrumental to the ECU’s operational success was the early insertion of experienced operationspersonnel into the development process with a “test it like you fly it” mentality as developed by Gaylord Green.Finally, the development of a modular <strong>Flight</strong> Timeline prior to launch created an environment where replanningand anomaly resolution was done with carefully thought out command sequences resulting in errorfreeimplementation.The dedication, ability and willingness of the Lockheed Martin ECU software team to develop last minutesoftware updates and additions during IOC was exemplary and contributed in no small part to the <strong>GP</strong>-Bmission success.13.1.1 ECU HardwareFigure 13-1 below shows the relative location of the forward and aft ECU boxes on the spacecraft frame.Figure 13-1. Locations of Forward and Aft ECU boxes on the <strong>GP</strong>-B spacecraft13.1.2 ECU-Controlled Heaters & Temperature SensorsThe ECU controls a number of heaters and temperature sensors inside the dewar and inside the <strong>Probe</strong>.Figure 13-2 shows the locations of ECU-operated heaters.<strong>Gravity</strong> <strong>Probe</strong> B — <strong>Post</strong> <strong>Flight</strong> Analysis • Final <strong>Report</strong> March 2007 353
Figure 13-2. ECU-operated heaters in the dewar & probeFigure 13-3 below shows the locations of ECU-operated temperature sensors in the dewar.Figure 13-3. ECU-operated temperature sensors in the dewar & <strong>Probe</strong>Finally, the close-up diagram of the <strong>Probe</strong> in Figure 13-4 below shows the locations of heaters and temperaturesensors inside the <strong>Probe</strong>, including the four probe windows.354 March 2007 Chapter 13 — Other Payload Subsystems Analyses
Figure 13-4. ECU-operated heaters and temperature sensors in the <strong>Probe</strong> and <strong>Probe</strong> windows13.1.3 ECU-Managed SubsystemsIn addition to controlling various heaters and temperature sensors, the two ECU boxes on the spacecraft controlnine subsystems on-board the spacecraft. Figure 13-5 below shows the names and general locations of thesesubsystems on the spacecraft frame. A brief description of each ECU-controlled subsystem follows the diagram.Figure 13-5. General locations of ECU-controlled subsystems on the spacecraft<strong>Gravity</strong> <strong>Probe</strong> B — <strong>Post</strong> <strong>Flight</strong> Analysis • Final <strong>Report</strong> March 2007 355
13.1.3.1 Vatterfly Valve OperationsFigure 13-6. A six-inch Vatterfly leakage exhaust valve at the top of the dewarThere are 6 Vatterfly Valves operated by the ECU. Two (2) 6-inch Leakage Valves, used for exhaust from the topof the dewar. Four (4) 2.5-inch Exhaust Valves, used for exhaust from each Gyro and plumbed up and out nearthe top of the dewar.13.1.3.2 Gas Management Assembly (GMA)Figure 13-7. The Gas Management System (GMA)The ECU provides heater control, temperature monitoring, and valve control for the Gas ManagementAssembly (GMA). The GMA is located in one bays on the lower spacecraft frame. It provides ultra-pure heliumgas for spinning up and flux flushing the four science gyros.13.1.3.3 Ultraviolet LampsThe ECU operates two UV lamps and their optical switches. These UV lamps are used for controlling the buildupof electrostatic charge on the science gyros.356 March 2007 Chapter 13 — Other Payload Subsystems Analyses
Figure 13-8. UV lamps and the gyro electrostatic discharge systemThe two UV lamps are located on the lower spacecraft frame, and their light is carried to the gyro housings,inside the <strong>Probe</strong>, through fiber optic cables.13.1.3.4 Proton MonitorThe Proton Monitor is a modifiable system designed to monitor the <strong>GP</strong>-B’s environment and detect anddistinguish in between protons, electrons and other charged particles/cosmic rays.Figure 13-9. The <strong>GP</strong>-B Proton Monitor boxThe ECU sends and receives 16-bit proton monitor commands from the spacecraft’s main computer(CCCA/CCCB) via the 1553 bus at a rate up to and including 10.0 Hz.13.1.3.5 ECU Survival HeaterDesigned to maintain the Aft ECU Operational Temperature Range, the Aft ECU baseplate survival heaterprotects the UV Lamps from low temperature damage. They thermostatically maintain a temperature inbetween 0 and 4 Celsius.13.1.3.6 Vacuum GaugeThe ECU provides +30V, 3W max. power and 2 channels of telemetry for each of two high vacuum gauges.,used to measure probe pressure during high probe pressure events.<strong>Gravity</strong> <strong>Probe</strong> B — <strong>Post</strong> <strong>Flight</strong> Analysis • Final <strong>Report</strong> March 2007 357
13.1.3.7 Payload MagnetometersThe ECU houses control circuitry for four external 3-axis magnetometers, and it provides three channels ofanalog telemetry.13.1.3.8 Dewar Passive Orbital Disconnect StrutsThe ECU senses the status of the dewar Passive Orbital Disconnect Struts (PODS), which are used to thermallyisolate the dewar from the spacecraft structure surrounding it.13.1.3.9 PID Temperature ControlThe spacecraft’s main computers (CCCA and backup CCCB) use a closed loop temperature control (PID)algorithm to control all of the following ECU heaters:1. Gas Inlet (Final Filter) 1&22. Gas Inlet (Final Filter) 3&43. Quartz Block Structure (QBS)4. Cryopump5. Vacuum Shell6. Heaters for each of the four windows in the <strong>Probe</strong>A set of parameters, including the activity duration and a temperature profile is uploaded to the CCCA/CCCBcomputer, and the PID algorithm then maintains the PID heaters at their specified temperature until theparameters are changed. The PID algorithm runs autonomously and is designed for controlling complex heateroperations in orbit. Performance of the ECU during two of these complex operations, flux flushing and lowtemperature bakeout of the <strong>Probe</strong>, is summarized in the next section.13.1.4 ECU Performance During Flux Reduction & Low TemperatureBakeoutThis section describes the flux reduction and low temperature bakeout procedures that were executed duringthe Initialization and Orbit Checkout (IOC) phase of the mission. For each of these procedures, theaccompanying chart shows how well the ECU met the specified requirements and success criteria.13.1.4.1 Low Temperature BakeoutThe low temperature bakeout process involves heating the interior surfaces of the <strong>Probe</strong> while open to space inorder to desorb and remove the helium which has condensed and been adsorbed onto the <strong>Probe</strong> interiorsurfaces during spinup of the Gyroscopes. The major components used during this operation are the ECU, theECU's Thermal Control PID Algorithm, the ECU Operated, Closed and Open Loop SIA Heaters and theirassociated Temperature Monitors.Requirements: This operation will assist in reducing the measured probe pressure below X Torr. SCIT-01Para. 8.2.3Success Criteria: Heating the <strong>Probe</strong> to 6-7 K and then lowering the temperature in a ramp until the pressurewithin the <strong>Probe</strong> in within requirements.Figure 13-10 below shows the performance of the ECU during the low temperature bakeout procedure carriedout during the IOC phase of the mission.358 March 2007 Chapter 13 — Other Payload Subsystems Analyses
13.1.4.2 Flux Reduction OperationFigure 13-10. Performance during Low Temperature BakeoutThe purpose of this operation is to reduce the Science Gyroscope's trapped magnetic flux. The majorcomponents used during this operation are the ECU, the GMA, the ECU's Thermal Control PID Algorithm, theQBS (H-05P & H-06P) and Vacuum Shell (H-08P & H-09P) Heaters and their associated temperaturemonitors.Requirements: This operation will assist in reducing the measured trapped flux on the science gyroscopes below9 microgauss. SCIT-01 Para. 8.2.3Success Criteria: Heating the QBS to 13 K and then lowering the QBS temperature in a ramp until the Gyro’sare below superconductive temperature.Figure 13-11 below shows the performance of the ECU during a flux reduction operation carried out early in theIOC phase of the mission.<strong>Gravity</strong> <strong>Probe</strong> B — <strong>Post</strong> <strong>Flight</strong> Analysis • Final <strong>Report</strong> March 2007 359
Figure 13-11. ECU performance during IOC flux reduction13.1.5 ECU Heater Activity During IOCDuring early orbit operations, The ECU was involved in Power on and Initialization of itself and it’s subsystems,the initial Gyroscope spinup practice, the Window Bakeout to remove particulate from the outer window due topre-launch and launch and the initial UV Lamp Operations. Figure 13-12 below shows the ECU heater activityduring the spacecraft’s first 12 days in orbit, as a function of temperature in kelvin, as measured by thetemperature sensor in the Cryopump.360 March 2007 Chapter 13 — Other Payload Subsystems Analyses
Figure 13-12. ECU heater activity following launchDuring early orbit operations, The ECU continued UV Lamp Ops, a practice Low Temperature Bakeout,Helium Flow rate analysis using the Flow Meter Heater and Gyroscope Flux Flushing. Figure 13-13 shows thisECU heater activity as a function of Cryopump temperature for mission day#13 – mission day #33.Figure 13-13. ECU heater activity during first month of IOC<strong>Gravity</strong> <strong>Probe</strong> B — <strong>Post</strong> <strong>Flight</strong> Analysis • Final <strong>Report</strong> March 2007 361
As we entered the second month of orbital operations, the focus again was on charge control with the UV Lamp,Helium Flow rate analysis using the Flow Meter Heater and increasingly sophisticated Gyroscope spinuproutines. Figure 13-14 shows the continued ECU heater activity as a function of temperature for the three-weekperiod from May 23, 2004 – June 12, 2004.Figure 13-14. ECU heater activity during the 2nd month of IOCFor the month of June 2004, the ECU was involved in initializing the Proton Monitor, Helium Flow rateanalysis using the Flow Meter Heater and a Full Window Bakeout, heating up all four Windows to remove anycondensation interference with the telescopes view of our guide star IM Pegasus and further, increasinglycomplex Gyroscope spinup operations. Figure 13-15 below shows the continued ECU heater activity asdocumented by the Cryopump temperature sensor in June-July, 2004.362 March 2007 Chapter 13 — Other Payload Subsystems Analyses
Figure 13-15. ECU heater activity from mid June - mid July, 2004As July turned to August, we entered the heart of the <strong>GP</strong>-B IOC phase, with full-speed gyroscope spinups thelow temperature bakeout, and helium flow rate analysis, using the Flow Meter heater. Figure 13-16 shows theECU heater activity during these critical IOC procedures.Figure 13-16. ECU heater activity during gyro spinup and other critical IOC procedures<strong>Gravity</strong> <strong>Probe</strong> B — <strong>Post</strong> <strong>Flight</strong> Analysis • Final <strong>Report</strong> March 2007 363
During the last month of IOC, preparing to enter the Science phase of the mission, the ECU heater activityslowed dramatically. During this period, the focus was on Quartz Block Support temperature stabilization usingthe closed loop QBS Temperature control, Charge Control use of the UV Lamps, Helium Flow rate analysisusing the Flow Meter Heater and the health and safety monitoring of temperatures and pressures. Figure 13-17documents the ECU heater activity during this period.Figure 13-17. ECU heater activity during the last month of IOC13.1.6 ECU Heater Activity During the Science PhaseDuring the first six months of the Science (Data Collection) Phase of the mission, we continued with health andsafety monitoring of temperatures and pressures, Quartz Block Support temperature stabilization using theclosed loop Temperature control, and Helium Flow rate analysis using the Flow Meter Heater. During thisperiod, we also performed the first of several Heat Pulse Meter Heater tests to determine the amount of Heliumremaining in the dewar. Figure 13-18 documents the ECU heater activity during this period.364 March 2007 Chapter 13 — Other Payload Subsystems Analyses
Figure 13-18. ECU heater activity during the first half of the Science PhaseAs we continued through the remainder of the Science phase of the <strong>GP</strong>-B Operations, the activity on the ECUwas used primarily for Charge Control use of the UV Lamps and Heat Pulse Meter Heater tests for a heliumlifetime calculations. In April 2005, we determined that the ECU was contributing noise to the SQUID ReadoutSystem. To mitigate this issue, we kept the ECU turned off throughout the remainder of the Science phase,except for a few hours each week, when we powered-on the unit to check the status of various telemetry values.Figure 13-9 below documents the ECU heater activity from January 2005 through the end of May 2005.<strong>Gravity</strong> <strong>Probe</strong> B — <strong>Post</strong> <strong>Flight</strong> Analysis • Final <strong>Report</strong> March 2007 365
Figure 13-19. ECU heater activity during the Science Phase, from January-May 200513.1.7 ECU transmission of Spacecraft NoiseNoise coupling has been an ongoing issue with the ECU, both prior to launch and during flight. Following is asummary of this issue.13.1.7.1 Pre-Launch ECU Noise CouplingPrior to launch, <strong>GP</strong>-B processed DR446 that addressed a noise-coupling path between the ECU and the SREsubsystems. Ultimately, this lead to a launch delay from December 2003 to April 2004 to replace a faulty powersupply in the ECU. However, the coupling path between the ECU and the SRE that allowed the detection of thefaulty ECU power supply was not able to be isolated and repaired during this time, and it was deemedacceptable for the performance of the science instrument.13.1.7.2 ECU Noise Coupling On OrbitOnce on orbit, we found that the ECU would occasionally generate coherent noise at a slowly changingfrequency that would couple to the SQUID outputs—primarily to SQUID#1. SQUID#1 and SQUID#3 haveconsistently exhibited a greater sensitivity to external sources of EMI due to the relatively long cables from thetop hat to the forward SRE. Similar noise was observed on the SQUID#1 outputs in early 2005, and it wasdecided then that the ECU could be turned off for extended periods to eliminate this noise source from theSQUID data. The ECU was turned off on April 28, 2005 and was occasionally turned on for system monitoringand heat pulse measurements to the end of helium point on September 29, 2005. Following the depletion ofhelium, the ECU was turned back on permanently.The effect of this coupled noise source on the science data is still to be determined in the post-mission sciencedata analysis effort, but at this time the effect is expected to be small to insignificant.366 March 2007 Chapter 13 — Other Payload Subsystems Analyses
13.2 Proton MonitorThe proton monitor (PM) aboard <strong>GP</strong>-B is a sophisticated electronic measurement instrument that is capable ofdetecting, counting, and measuring flux and energies of protons in the range 35MeV-525MeV. The purpose ofthis instrument is to provide valuable information about the radiation environment surrounding <strong>GP</strong>-B,especially the flux of high-energy protons, which can affect or disrupt the performance of sensitive electronicsand science instruments and may contribute to charge build-up on the gyroscopes. This data can also be used tostudy the proton flux density in <strong>GP</strong>-B’s low-earth orbit, as well as variations in flux that occur with changinggeomagnetic field and geographic location of the spacecraft. Furthermore, there are potential experiments thatthe proton monitor can be used for during the post-science phase of the mission. This report describes thecapabilities, summarizes the to-date performance, and discusses possible post-science applications of the protonmonitor.13.2.1 <strong>GP</strong>-B Radiation EnvironmentThe Earth’s geomagnetic field acts as a shield, blocking out much of the radiation from the sun and deep space.The shielding effect is strongest over the equator and low latitudes and weakest over the poles and the SAA,where the radiation belt shows a “pothole”, a dip, which scientists explain as a result of the eccentricdisplacement of the center of the magnetic field from the geographical center of the Earth as well as thedisplacement between the magnetic and geographic poles of Earth. Over the poles, the shielding effect is weakerdue to the orientation of the magnetic field. Thus, whenever <strong>GP</strong>-B passes over the poles or the SAA it is exposedto much higher particle flux than outside of these regions.The radiation environment at the altitude of <strong>GP</strong>-B’s orbit (640km) is dominated by the flux of trapped particlesin the Earth’s inner radiation belt. Most of these particles are low-energy protons and electrons, but there is asignificant flux of higher energy particles, especially over the SAA and the polar regions and it is the high energyprotons that the <strong>GP</strong>-B PM is designed to detect.Trapped protons mirror between the magnetic poles, following spiral trajectories around magnetic field lines.Because of this spiral motion, the velocity vector of a trapped proton is approximately perpendicular to themagnetic field vector. This effect makes determining the originating direction of the proton flux more difficultbecause the direction of the source, e.g. the Sun, is not necessarily the direction from which the detector sees thehighest proton flux.Energetic protons can affect the performance of onboard electronics by impacting transistors and flipping oneor more bits. Single and multi-bit errors of this kind can have a severe effect on critical spacecraft electronicsystems, which is why it is important to understand when and how they happen.13.2.2 Proton Monitor Features and SpecificationsThe <strong>GP</strong>-B PM has 16 channels and is capable of detecting protons in the energy range 35MeV-525MeV, whichexceeds the range and resolution of most past and current satellite detectors in low-earth orbit (POES satellitedetectors have a max of 275MeV, CPA - ~200MeV, SOPA – 50 MeV.) The monitor features two identical 4-layer silicone detectors with 45 degree view angles. The detectors are orthogonal, with one oriented along the –Z axis and the other along the -Y axis of the spacecraft. As the protons enter a detector, they are counted andsorted by energy level into 16 channels, whose configuration is shown in Table 13-1.<strong>Gravity</strong> <strong>Probe</strong> B — <strong>Post</strong> <strong>Flight</strong> Analysis • Final <strong>Report</strong> March 2007 367
Table 13-1. Proton monitor channel configurationChannel Energy Range (MeV)1 34-402 40-483 48-574 57-685 68-816 81-967 96-1148 114-1359 135-16010 160-19011 190-22512 225-26613 266-31514 315-37315 373-44216 442-525The default integration period of the PM is 12.8s. This period is adjustable and can be set to 3.2s, 6.4s, 12.8s,25.6s, or 51.2s. Other adjustable features include electron suppression, noise threshold, and minimumionization. Table 13-2 summarizes technical specifications.Table 13-2. Technical SpecificationsSpecificationValueMaximum Power Consumption 3.5 WMass3.5 kgDimensions17 x 15 x 10 cmScience Data Rate160 bpsTime ResolutionProgrammable, 12.8s defaultEnergy Resolution 2 x 16 energy channels (see Table 13-1)Measurement Range35 – 525 MeV protonsConfigurationTwo orthogonal proton detectorsAs mentioned above, the view angle of each detector is 45 degrees. However, since the horizontal detector isrolling with the spacecraft, its effective view angle is 45 degrees plus the angle that it rolls through in oneintegration period. For the default value of the integration period, 12.8s, that angle is0.7742rpm/60s*12.8s*360deg or about 59.5 degrees. Therefore, the effective view angle adds up to ~104.5degrees, which is much greater than the view angle of the detector. This does not apply to the vertical detectorsince it is always pointed in the same direction. The effective view angle of the horizontal detector can bedecreased by reducing the integration period or the roll rate of the spacecraft. On the other hand, increasing theintegration period or roll rate will result in a wider effective view angle, which, if increased to 360 degrees, willresult in an omni-directional detector. These considerations are important to keep in mind for the post-sciencephase of PM operations.368 March 2007 Chapter 13 — Other Payload Subsystems Analyses
13.2.3 History of PerformanceThe PM operated nominally from the beginning of the mission until Nov. 16, 2004 when we began receivingcorrupt telemetry data. After a couple of days, telemetry went back to normal. On December 14, 2004 the PMtelemetry data became corrupt again. No good data was available for the following two weeks. In early January,2005, the PM came back online, but stopped sending data shortly before the major peak of solar activity on Jan.20, 2005. After that, the data from the PM appeared invalid and there was a period when no data was received.On April 25, we discovered that if we apply a different parsing method to the incoming telemetry data, we seemuch more good data coming from the PM. Using this new parsing method, we went back and saw that the PMappeared to operate nominally starting on March 17, 2005.13.2.4 Data CollectedFigure 13-20, shown below, illustrates data collected on all horizontal channels over a one-month period,August 1 – September 1, 2004. The figure also shows the AP8min SAA model, ATC SAA model, and SLAC SAAmodel for GLAST contours [1]. Features of interest are active areas over the SAA, the poles and a band betweenthe south-east SAA boundary and the South pole.Figure 13-20. Typical Month of Proton Monitor DataFigure 13-21 shows proton monitor data versus time. Levels of increased activity over the SAA are clearly visibleas sharp spikes. Passes over the SAA are marked by red asterisks.<strong>Gravity</strong> <strong>Probe</strong> B — <strong>Post</strong> <strong>Flight</strong> Analysis • Final <strong>Report</strong> March 2007 369
Figure 13-21. Proton Monitor data in South Atlantic AnomalyLooking closer, we see a cyclic twice-orbital component to the signal, which shows increased proton flux as <strong>GP</strong>-B passes over the poles.Figure 13-22. Twice Orbital Component370 March 2007 Chapter 13 — Other Payload Subsystems Analyses
The main harmonics of the proton flux measurements can be seen by taking a fast Fourier transform (FFT) ofthe horizontal detector data, shown in Figure 13-23. The three vertical red lines mark the orbital, roll, and twiceroll frequencies, from left to right. The roll and twice roll components are clearly present in the FFT of thehorizontal detector data, since its boresight rolls with the spacecraft. The FFT of the vertical detector data isdominated by the orbital component.Figure 13-23. FFT of data from the horizontal detectorThe next plot, Figure 13-24, is a histogram of proton events detected by each horizontal channel over the sameone month period of August 1 – September 1, 2004.Figure 13-24. Histogram of Proton Events<strong>Gravity</strong> <strong>Probe</strong> B — <strong>Post</strong> <strong>Flight</strong> Analysis • Final <strong>Report</strong> March 2007 371
In November, 2004 there was a large solar mass ejection accompanied by class X and M solar flares, which lastedfor several days. This event was promptly picked up by the <strong>GP</strong>-B PM. Figure 13-25 shows the increased flux onboth the horizontal and the vertical detector during this event.Figure 13-25. Proton Monitor Data from November 2004Figure 13-26 is a zoomed-out view of Figure 13-25. It is interesting to note that the maximum flux over the SAAwas slightly smaller during the times corresponding to the two peaks in Figure 13-25. At first, this might seemunusual, but Katherine Harine from NASA’s Marshal Space <strong>Flight</strong> Center explains this phenomenon, “After asolar event, the trapped proton flux should actually drop a bit. The slight atmospheric heave due to solar energywill increase the loss mechanism of protons more than the number of protons created by the event. Typicallyduring a solar event the proton flux will increase at the Earth’s magnetic poles due to the absence ofgeomagnetic shielding, but may decrease slightly at lower latitudes due to the atmospheric heave lossmechanism mentioned above.”Figure 13-26. Zoomed out view of Figure 13-25372 March 2007 Chapter 13 — Other Payload Subsystems Analyses
This is precisely what we observe in Figure 13-27, which shows increased polar proton flux at the times of theflares.Figure 13-27. Increased Proton Flux during the November 2004 solar activity13.2.5 Correlating the PM with the TelescopeThe pointing telescope onboard the <strong>GP</strong>-B has photo detectors which register hits from high energy protons.These protons contribute to the noise in the science slope measurements. To better understand the mechanismby which protons reach the photo detectors, I used the PM to determine the correlation between the proton fluxand the noise in the science slope. The results of this analysis are summarized below.For each channel of the proton monitor, a correlation coefficient was calculated between the daily number ofprotons detected on that channel and the daily number of proton hits detected by different telescope detectors.Two months of data were used. Figure 13-28 shows the correlation coefficient vs. vertical channel number.Here, the data from the positive TRE-A X-Axis (PXA) detector was used.Figure 13-28. Correlation between Vertical PM Detector and Science Telescope (PXA)<strong>Gravity</strong> <strong>Probe</strong> B — <strong>Post</strong> <strong>Flight</strong> Analysis • Final <strong>Report</strong> March 2007 373
Figure 13-28 shows a correlation that increases with channel number and, equivalently, energy level. Onepossible explanation for this is that higher energy protons are more likely to penetrate through the spacecraftstructure to reach the detectorFigure 13-29 shows a similar plot using the data from the horizontal channels. Inthis case, the correlation function is inverse, meaning that the more high energy protons are seen by the PM, thefewer are seen by the telescope. Considering that the boresights of the two instruments are perpendicular, thiscan be explained knowing that direction of the trapped proton flux is approximately perpendicular to themagnetic field lines. Thus, if the telescope boresight is aligned with the magnetic field, many more protons willbe traveling perpendicular to it and parallel to the horizontal PM detector.Figure 13-29. Correlation between Horizontal PM Detector and Science Telescope (PXA)Figure 13-30 depicts the correlation coefficient vs. vertical channel number, but this time the data from thepositive TRE-A Y-axis detectors was used. A similar trend emerges.374 March 2007 Chapter 13 — Other Payload Subsystems Analyses
Figure 13-30. Correlation between Vertical PM Detector and Science Telescope (PYA).A more detailed analysis of the correlation will be done, taking into account the orientation of the telescopedetectors and the magnetic field, and possibly other factors that affect the proton flux through the spacecraft.13.2.6 Possible <strong>Post</strong>-Science Missions and Analysis<strong>GP</strong>-B’s useful life does not end with the completion of the science mission. During the post-science phase of themission, we can carry out experiments utilizing the numerous onboard instruments and sensors.There are several possible experiments that would involve the proton monitor. For example, by changing theattitude and roll rate of the spacecraft, as well as the integration period of the proton monitor, we can effectivelycontrol the view angle and direction of both detectors, pointing them wherever the experiment commands.Using the data from the magnetometers, we can measure the proton flux at specific angles relative to themagnetic field lines. We can also combine the proton monitor data with the gyroscope charge measurements tostudy the contribution of high energy protons to gyroscope charge build-up. An ongoing effort that can andmost likely will be continued in the post-science phase is understanding how energetic protons contribute tomulti-bit errors (MBEs) that disrupt the onboard electronics.13.3 Payload MagnetometersAs described in 13.2.2 (“Proton Monitor Features and Specifications” ) of this report, a lead bag is used toattenuate the magnetic field around the <strong>Probe</strong> and gyroscopes within. In order to make an estimate on howstrong this field is after attenuation, it is helpful to have measurements of the original field around thespacecraft. This information is collected by four fluxgate magnetometers mounted around the cone of thedewar.<strong>Gravity</strong> <strong>Probe</strong> B — <strong>Post</strong> <strong>Flight</strong> Analysis • Final <strong>Report</strong> March 2007 375
13.3.1 About the MagnetometersFigure 13-31. <strong>GP</strong>-B payload magnetometerEach of the <strong>GP</strong>-B payload magnetometers, manufactured by E. J. Iufer & Associates Inc. and shown inFigure 13-31, have a mass of 0.133 kg and are 3.21 inch x 1.89 inch x 1.4 inch in length, width, and height,respectively. Measurements are taken along three orthogonal axes of the magnetometer, each of which containsa coil that creates an electrical current in response to the characteristics of the magnetic flux lines in the Earth’sfield. The key performance parameters for these magnetometers are listed in Table 13-3 below.Table 13-3. <strong>GP</strong>-B payload magnetometer performance characteristics.Offset(Volts)Sensitivity(Volts/Gauss)Range(Gauss)Linearity*(%)Noise(Gauss)Axis Unit 1 Unit 2 Unit 3 Unit 4X 4.997 4.998 5.011 4.983Y 5.001 4.995 4.981 4.968Z 4.995 4.994 5.012 5.001X 4.9421 4.9181 4.9707 4.8868Y 4.5815 4.4776 4.5545 4.4781Z 5.0248 4.9139 4.8913 4.9137X -0.8 to 0.6 -0.8 to 0.6 -0.8 to 0.6 -0.8 to 0.6Y -0.8 to 0.7 -0.8 to 0.7 -0.8 to 0.7 -0.8 to 0.7Z -0.8 to 0.6 -0.6 to 0.6 -0.8 to 0.6 -0.7 to 0.6X 0.06 0.07 0.06 0.085Y 0.03 0.08 0.05 0.13Z 0.12 0.12 0.11 0.03X
Figure 13-32. Measurement axes of the payload magnetometers.Power and data signals are routed between the ECU and payload magnetometers through a 15-pin connector onthe side of each unit. The measurement coils for the magnetometers are mounted on the side plate containingthe power/data connector as shown in Figure 13-33.Figure 13-33. Mounting locations of the payload magnetometers.The orientation of these coils determines the measurement axes of the magnetometer. For magnetometers 1 and2, this plate is mounted on the left side of the unit as seen from the front end (the end opposite of the end thatcontains the mounting structure). Thus, these magnetometers are said to be “left-handed”. For magnetometers3 and 4, this plate is mounted on the right side of the unit, and thus these magnetometers are said to be “righthanded”.Data is sampled by each magnetometer unit every five seconds and transmitted down to Earth in counts (eachvolt corresponds to 3276.7 counts). The <strong>GP</strong>-B science team then performs several processing functions on thisdata. First, the data is converted from counts to volts. Next, crosstalk in the data, the interference that eachmeasurement coil receives from the other coils, is eliminated through multiplication with a matrix of groundmeasurements. Finally, the measurements are converted from the magnetometer frame to the spacecraft framethrough multiplication with direction cosine matrices.<strong>Gravity</strong> <strong>Probe</strong> B — <strong>Post</strong> <strong>Flight</strong> Analysis • Final <strong>Report</strong> March 2007 377
13.3.2 Other Applications for Payload MagnetometersWhile the data from the magnetometers is collected to provide a reference for estimating the magnetic fieldattenuation inside of the spacecraft, it can also be used for several other applications. For instance, the directionof the flux of ionized particles in the environment that the spacecraft flies in over the mid-latitudes of Earth isstrongly influenced by the Earth’s magnetic flux lines. These particles occasionally strike and flip digital bits inspacecraft computer memory (this is known as an upset event). Therefore, data gathered by the magnetometerson the strength and orientation of magnetic flux lines during upset events provides insight into the directionthat these particles impact the memory board. This information can and has been used to identifyvulnerabilities in both the shielding and layout of memory bits on the memory boards used in <strong>GP</strong>-B, and thus,will be helpful in selecting more robust shielding and memory board configurations in future missions.Another application for the payload magnetometer data is the detection of ionospheric field aligned currents inthe Earth’s polar regions. These currents disturb the magnetic field and heat up the Earth’s atmosphere, causingit to rise locally. This rise in the atmosphere should cause a small, temporary deceleration of <strong>GP</strong>-B (due to anincrease in drag), which should be detectable in the GSS units. This phenomenon has been observed on othersatellites and is of interest to the geophysics community for future study. In order to detect it on <strong>GP</strong>-B, GSS datawill have to be processed to calculate the drag experienced by the vehicle. Then, if there are any noticeableinstances of deceleration that could be linked to ionospheric field aligned currents, the magnetometer datacorresponding to this period of time will to be compared with a model of the Earth’s magnetic field to determinethe presence and scale of such currents.13.3.3 Lessons Learned Using Payload MagnetometersThe data produced by the magnetometers require a good deal of processing due to the fact that measurementsare not taken in the spacecraft body axes or for that matter, axes common to all magnetometer units. As it turnsout, this processing is nontrivial and has initially produced counter-intuitive results, which have proven difficultto verify. The lack of commonality in the sensors’ measurement axes creates ambiguity as to whetherdiscrepancies among the magnetometers’ measurements are due to physical phenomena or errors in thecalibration, numbering, positioning, and/or wiring of the individual units. Furthermore, if the spacecraft werenot equipped with separate magnetometers for attitude control, the only way to verify that the conversion to thespacecraft body axes was correctly performed would be to compare the final results with a model of the Earth’smagnetic field (note: this would require a conversion to Earth-Centered, Earth-Fixed axes). In future designs,these problems can be avoided by configuring the measurement axes of all magnetometer units so that theyalign with each other and the spacecraft body axes.13.4 Global Positioning System (<strong>GP</strong>S)When the notion of using <strong>GP</strong>S on <strong>GP</strong>-B was conceived in 1982, <strong>GP</strong>S had limited use in space applications.Nevertheless, <strong>GP</strong>S was selected as the best method to obtain precise position and velocity data. While theoriginal goal of using <strong>GP</strong>S for closed loop navigation proved too ambitious, the <strong>GP</strong>S subsystem has surpassed itsmission goal of providing real time Position, Velocity, and Time (PVT) solutions at better than 100 meter rmsaccuracy. Additionally, <strong>GP</strong>S time telemetry from the receiver has been successfully used to accurately reconcilevehicle time with Coordinated Universal Time (UTC). See section 8.2.5.2.9 for a list of selected <strong>GP</strong>-B <strong>GP</strong>Spapers.While laser ranging solutions has augmented <strong>GP</strong>S measurements during the mission, <strong>GP</strong>S telemetry is theprimary source of PVT information. The receiver was powered on two hours after launch. Real time positionand velocity telemetry provides relatively coarse orbit solutions. <strong>Post</strong> processed telemetry provides precise orbit378 March 2007 Chapter 13 — Other Payload Subsystems Analyses
solutions. Accurate orbit solutions was needed both to determine the extent of orbit trim required during theinitialization phase of the mission, and for precise vehicle position and velocity knowledge during the sciencephase of the mission.13.4.1 <strong>GP</strong>S HardwareThe <strong>GP</strong>S equipment is divided into two fully redundant sets. Each set is composed of a Trimble TANS VectorIII <strong>GP</strong>S receiver and four matching Trimble antennas. Originally built for battlefield <strong>GP</strong>S attitude applications,a modified TANS Vector III flew successfully on STS-77 in 1996, as part of the <strong>GP</strong>S Attitude and NavigationExperiment (GANE).The Trimble TANS Vector III is a six channel L1 receiver which calculates position, velocity, and time (PVT)every 1.7 seconds. The receivers are mounted on the spacecraft superstructure. Each receiver has inputs for fourantennae, two of which are mounted each fore and aft, as shown in Figure 13-34, and are placed as to maximizeantenna baseline and optimize sky view, as delineated in Table 13-4. The forward antennae’s field of view areobstructed slightly by the telescope sun shade, as depicted in Figure 13-35, but otherwise the antennae enjoy afull view of the sky.Table 13-4. Installed Position of <strong>GP</strong>S AntennaeAzimuth angleElevation angleAntenna 1 90 o 45 oAntenna 2 270 o 45 oAntenna 3 0 o -45 oAntenna 4 180 o -45 oFigure 13-34. Location of <strong>GP</strong>S equipment on <strong>GP</strong>-B<strong>Gravity</strong> <strong>Probe</strong> B — <strong>Post</strong> <strong>Flight</strong> Analysis • Final <strong>Report</strong> March 2007 379
Figure 13-35. <strong>GP</strong>S Antennae Field of View13.4.2 Hardware Modifications for <strong>GP</strong>-BDespite the equipment’s rugged heritage, pre-launch testing revealed hardware modifications were required toincrease robustness. Non-stainless steel screws were replaced with stainless steel equivalents. Resistor andcapacitor components were replaced with space compatible versions, as were connectors. Copper heat sinkswere added to better facilitate heat transfer in orbit. Thicker aluminum housing covers replaced the originalcovers to provide increased radiation shielding and more stiffness. As is typical in space applications, allelectronic boards were conformal coated.The receivers were also retrofit with Pulse Per Second (PPS) circuitry, which outputs a 5V pulse every second,on the <strong>GP</strong>S second. The PPS signal is used to reconcile vehicle time with UTC time.The majority of modifications involved changes to the receiver’s software. The receiver’s search algorithm wasmodified for space. To find a <strong>GP</strong>S satellite, the receiver must compare the incoming signal with the matchingsatellite PRN code. A terrestrial receiver looks through a Doppler shift range of ~10 kHz. Because theenvironment of <strong>GP</strong>-B is more dynamic, the Doppler shift window was increased to ~80 kHz. This increasedsearch capability allows the receiver to do a “cold” search in space. While bootstrap acquisition is a definite plus,Ephemeris Aiding allows the receiver to acquire the constellation typically within ten minutes. After power up,or receiver reset, the receiver is initialized with Keplerian orbital elements, as well as a complete set <strong>GP</strong>Sephemerides.Other modifications enhance communication with the <strong>GP</strong>-B flight computer. For example, while the flightcomputer interface operates at 10 Hz, a complete set of <strong>GP</strong>S telemetry occurs only every 10 seconds. Theintroduction of a Solution Quality Index (SQI) provides information about the receiver’s acquisition statusbetween successive sets. SQI has proved invaluable for understanding <strong>GP</strong>S telemetry, and is particularly usefulas a filter during post processing.13.4.3 Pre-Launch Testing and ResultsThe modifications necessitated strenuous qualification testing. Environmental testing focused on hardwaremodifications, and included the normal regimen of space qualification tests: EMI, thermal vacuum cycling,random vibration, etc. All tests were completed and data thoroughly reviewed prior to the equipment’sinstallation on the vehicle in September 2002. Selected highlights are given in Table 13-5. Integration testingwas successfully completed by August 2003. Prior to launch, the <strong>GP</strong>S subsystem was routinely used toaccurately time tag ground testing data.380 March 2007 Chapter 13 — Other Payload Subsystems Analyses
Table 13-5. Environmental Testing HighlightsTest Receiver AntennaSurvival Temp High (C) +85 + 85Survival Temp Low (C) -55 -55Operational Temp High (C) +20 +30Operation Temp Low (C) -9 -34Base Pressure (Torr) 3.2x10 -7 3.2x10 -7VibroAcoustic (G rms) 6.1 9.7Perhaps more interesting were the tests accomplished to verify software modifications. In particular, twocompeting effects needed to be investigated: rolling and orbiting.Figure 13-36. Rolling Rig<strong>Stanford</strong> University used a WellNav <strong>GP</strong>S Simulator to show that the software modifications allowed the receiverto acquire and maintain position fixes while in the simulated <strong>GP</strong>-B Orbit. But because the WellNav simulatorcannot model a rolling, orbiting vehicle, a rotating platform (Figure 13-36) was designed and fabricated. Therig, which can rotate over the entire range of predicted roll rates (0.1 – 2 rpm), showed that the antennaswitching algorithm would work up to 2 rpm, although slower rates yield better results.The receiver calculates the Signal to Noise Ratios (SNRs) for up to six tracked <strong>GP</strong>S vehicles. The antennaselection algorithm compares the SNR values every 15 seconds. The antenna with the <strong>GP</strong>S satellite with thehighest SNR is selected as the master antenna. The pattern should exactly repeat at the roll period. However, ifthe algorithm calculation occurs when the antenna with the best visibility is ascending, the next best antennawill erroneously be selected. Figure 13-37 shows the master antenna assignment for one channel at threedifferent roll rates, plotted vs. time. The top plot shows the master antenna switching occurring more or lessperiodically, as expected. Errors increase as the roll rate increases (middle and bottom plots). Nevertheless, andmost importantly, the receiver is able to maintain a lock in all cases.<strong>Gravity</strong> <strong>Probe</strong> B — <strong>Post</strong> <strong>Flight</strong> Analysis • Final <strong>Report</strong> March 2007 381
Figure 13-37. Master Antenna SwitchingTesting the receiver under flight-like conditions, orbiting and rolling simultaneously, required the use of anadvanced simulator. The Spirent <strong>GP</strong>S simulator at Marshall Space <strong>Flight</strong> Center (MSFC) was able to perform avariety of simulations, modeling the static scenario as well as the orbiting case at several different roll rates.Table 13-6 presents the results. As can be seen, the percent lock is never 100%. While the <strong>GP</strong>S equipment on<strong>GP</strong>-B does not have an on-orbit coverage requirement, the informal goal has been 70%. All the tested scenarios,as well as on-orbit results, yielded more than acceptable coverage.Table 13-6. Percent Lock for Various ScenariosScenario Percent Lock (%)Static 99.0Rolling Rig (Typical of 50 data sets with roll rates less than98.01 rpm)Orbiting, Inertial Pointing, No Roll 96.6Orbiting, Rolling (0.33 rpm) 96.6Orbiting, Rolling (0.5 rpm) 98.1Orbiting, Rolling (1.0 rpm) 72.613.4.4 Time ReconciliationThe addition of PPS circuitry allows vehicle time to be reconciled with UTC. But is the PPS signal dependentupon roll rate? The rolling rig provided an excellent platform to investigate this possibility.382 March 2007 Chapter 13 — Other Payload Subsystems Analyses
Figure 13-38. Histogram of PPS DataA histogram of the data is shown in Figure 13-38. Data for twelve different roll rates was used, in addition to adata set for the static case. Three data points were outside the plus/minus ten microsecond requirement range,99.88% of the data is within a plus/minus five microsecond range. No correlation was discovered between theoutput PPS signal and roll rate.A comprehensive set of tests verified that science telemetry could be time tagged to better than the 10 μsrequirement, and showed that the <strong>GP</strong>S PPS signal allows telemetry to be reconciled with UTC time withoutintroduction of further measurable time error.Details regarding the time reconciliation method can be found in [5], but an example of challenges overcome isuseful for appreciating the complexity of the <strong>GP</strong>-B spacecraft as well as its detailed design. In addition toproviding a 10 Hz timing strobe for vehicle hardware, the space flight computer’s master clock drives a 31 bitcounter at 16.368 MHz. Registers capture the value of the counter when a PPS or a 10 Hz strobe pulse isdetected. The values are included in telemetry. Since there is no a priori way of differentiating one PPS signalfrom its neighbor, the <strong>GP</strong>S receiver telemetry includes transmission time: the time at which the <strong>GP</strong>S data packetleaves the receiver. Another telemetry mnemonic captures the time the <strong>GP</strong>S data packet was received by theflight computer. By design the interval is minimized. Figure 13-39 shows the difference between thetransmission and reception time. The figure shows that the interval is always less than 0.6 seconds.<strong>Gravity</strong> <strong>Probe</strong> B — <strong>Post</strong> <strong>Flight</strong> Analysis • Final <strong>Report</strong> March 2007 383
Figure 13-39. Time difference between transmission and reception of <strong>GP</strong>S data packet.After determining the time difference, an algorithm fits the PPS signal to the integer <strong>GP</strong>S second. Figure 13-40shows the residuals using a second order model. Note that the residuals are less than 5 microseconds. Recentimprovements to the algorithm enable piecewise parabolic or cubic polynomial fits [6].384 March 2007 Chapter 13 — Other Payload Subsystems Analyses
Figure 13-40. Residuals of Least Square fitting algorithm with 2 nd order model.13.4.5 Orbital AccuracyTruth tables output by the GSSI simulator were compared to the receiver’s position and velocity solutions.Table 13-7 and Table 13-8 show the results, where the truth data is compared against both the raw and postprocessed telemetry.Table 13-7. Raw and Processed Positions vs. TruthPosition Spec X Y ZReal Time (m) 100 14.5 18.0 26.0<strong>Post</strong> Processed(m)25 3.7 6.9 4.6Table 13-8. Raw and Processed Velocities vs. TruthVelocity Spec X Y ZReal Time (cm/s) 100 7.1 7.4 10.3<strong>Post</strong>-Processed (cm/s) 7.5 0.4 0.7 0.5In most cases, the real time solutions exceed the post-processed mission requirements. The post processeddifferences are well within mission specifications.<strong>Gravity</strong> <strong>Probe</strong> B — <strong>Post</strong> <strong>Flight</strong> Analysis • Final <strong>Report</strong> March 2007 385
13.4.6 On-Orbit ResultsThe <strong>GP</strong>S components on <strong>GP</strong>-B have exceeded performance expectation through-out the <strong>GP</strong>-B mission.In particular, coverage has been significantly better than ground tests predicted. At a roll rate of 0.77 rpm,simulator testing suggests that the coverage rate should be 86% (see Figure 13-41). Nevertheless, the receiver hasenjoyed an average coverage rate of better than 97%.Figure 13-41. Coverage Curves for <strong>GP</strong>S simulator, rolling rig, and flight data. At <strong>GP</strong>-B's roll rate, the simulatedcoverage is 86%, while flight rate is better than 95%The receiver also did well whilst changing roll rate, as shown in Figure 13-42, where the roll rate was increasedfrom 0.6 to 0.9 rpm in 8 hours; the receiver maintained a coverage of better than 95%.The <strong>GP</strong>-B orbit modeling software, Microcosm, uses 30 hours of <strong>GP</strong>S solutions to compute a best fit orbitmodel. By comparing overlapping 30 hour data sets, accuracy of orbit position and velocity solutions can beestimated. The estimates are consistent with simulated orbit modeling done prior to launch and shown inTable 13-7 and Table 13-8, and suggest that on-orbit positions are known to better than 10 meters, andvelocities are known to better than 2 cm/s.386 March 2007 Chapter 13 — Other Payload Subsystems Analyses
13.4.7 On-Orbit EventsSeveral on-orbit events bare mention.Figure 13-42. Coverage rates during an increase in vehicle roll rate.13.4.7.1 Delay in Initial AcquisitionWhile pre-launch validation testing suggested that the time to first fix after <strong>GP</strong>S power-on would be less thanthe required ten minutes, the actual initial acquisition after the first on-orbit power-on took 110 minutes. Sincethen the receiver has been power cycled four times, and in each case the time to first fix has been less than tenminutes. As the launch data was delayed one day, one likely explanation of the increased acquisition time is thatinitialized Keplerian orbital elements were sufficiently stale that a cold search was necessary to acquire the <strong>GP</strong>Sconstellation. The explanation is consistent with telemetry. Furthermore, simulated cold searches typically takeabout 90 minutes.13.4.7.2 Possible Memory Leakage AnomalyA second observation is that the A-side receiver performance fell dramatically on day June 16 th of 2004, 55 daysafter a reset, recorded in the ARB notes as Observation 68. Symptoms included a drastic increase in the clockbias, and a severe decrease in coverage rate. Resetting the receiver’s memory cleared the issue. A flightequivalent receiver set up on the ground to test the hypothesis that the receiver locked because of real timeoperating system limitations with limited memory locked up after 40 days, with similar symptoms. Whilememory leakage, as this phenomenon is called, appears the most likely explanation, an operational process wasdeveloped for early detection. Fortunately, the event did not reoccur.13.4.7.3 <strong>GP</strong>S Constellation Geometry AnomalyOn December 4th, 2004, the ATC experienced an ADA exception error, which caused the vehicle to enter safemode, with loss of both drag-free and Guide Star. Details regarding this event have been tracked by the ARB asAnomaly 129. The cause of the exception error was determined to have been exceptionally high vehicle position<strong>Gravity</strong> <strong>Probe</strong> B — <strong>Post</strong> <strong>Flight</strong> Analysis • Final <strong>Report</strong> March 2007 387
and velocity values erroneously calculated by the <strong>GP</strong>S receiver. The cross product of the position and velocitysolution calculated by the receiver resulted in a value with of 3e19. The magnitude function takes the root sumsquared, 3e192 = 9e38 which exceeded a short float range of 1.7014e+038 (2^127). Typically all divisions,squares etc. are protected in the ATC code, but multiplications are not. The result caused a stack overflow,which in turn caused the safemode activation. The erroneous position and velocity solution was caused by poorgeometry of the <strong>GP</strong>S constellation. The operational solution was to increase the exception counter.13.4.7.4 Channel Alignment Issues Due to Computer Memory ErrorsOn two occasions, August 12 th , 2004 (Observation 102) and Jan 10 th , 2005 (Observation 135), telemetryindicated that a <strong>GP</strong>S error flag, channel alignment error, had toggled to the true state, indicating a problem withthe receiver. A detailed analysis of <strong>GP</strong>S solutions ruled out an actual error state, suggesting that the error bitflipped as a result of a single bit or multi-bit event. While rebooting the receiver would have cleared the error, inboth cases the decision was made to leave the receiver as is. In both instances, the receiver was eventuallyrebooted as part of other vehicle operations.13.4.7.5 Switch to B-Side <strong>GP</strong>S ReceiverThe last observation regards the switch to the B-side receiver. Since the <strong>GP</strong>S receivers are not cross strapped,when the vehicle switched from the A-side to the B-side on March 13, 2005, the <strong>GP</strong>S subsystem switched fromthe A-side to the B-side components as well. While the average percent lock by the B-side components is onlyslightly less than the A-side average (95% vs 98%), Figure 13-43 clearly shows that the day-to-day values varygreatly. Figure 13-43 also shows the percentage of <strong>GP</strong>S solutions used by the orbit determination group tocalculate the <strong>GP</strong>-B orbit also dropped after the switch to the B-side hardware. The decrease in usable points isdue to the increase in “stale” data—data from a previous solution still in the <strong>GP</strong>S memory buffer. When thereceiver is locked and outputting valid <strong>GP</strong>S solutions, stale data is overwritten by new data. Stale data shouldonly occurs when the receiver is reacquiring the <strong>GP</strong>S constellation. Analysis of the solution quality indextelemetry shows that the SQI is slightly, but consistently, higher on the B-side than on the A-side receiver, anobservation consistent with the decrease in percent lock seen. Further insight is gleaned by observing that jitterin the clock bias is higher on the B-side. The most likely hypothesis is that the difference is caused by slightdifferences in the performance of the <strong>GP</strong>S internal oscillators, used to track time between successive PVTsolutions. While only a detailed analysis of the <strong>GP</strong>S internal oscillators can verify the root cause, availabletelemetry is consistent with this hypothesis. Pre-launch sanity testing did not reveal performance differencesbetween the two oscillators.388 March 2007 Chapter 13 — Other Payload Subsystems Analyses
Figure 13-43. Percent Lock and data points used before and after the switch to the B-sidereceiver on March 4, 2005, day 64.Regardless of the root cause, it is important to note that while the percentage of <strong>GP</strong>S solutions used by the OrbitDetermination group has decreased since the switch to the B-side receiver, the quality of the solutions has notdecreased, The orbit solution calculated by the group continues to meet mission requirements. Although aperformance difference between the A-side and B-side components is clear, the <strong>GP</strong>S subsystem has easilyexceeded all mission requirements and pre-launch expectations.13.4.8 ReferencesJ. Ceva, B. W. Parkinson, Multiple Interference in Orbiting Receivers Due to Earth Surface Reflections, ION <strong>GP</strong>S-93, SaltLake City, Utah, September 1993.C. E. Cohen, B. W. Parkinson, Mitigating Multipath Error in <strong>GP</strong>S Based Attitude Determination. Reprinted fromGuidance and Control 1991,Vol. 74, Advances in Astronautical Sciences.C. E. Cohen, B. W. Parkinson, Expanding the Performance Envelope of <strong>GP</strong>S-Based Attitude Determination, ION <strong>GP</strong>S,Albuquerque, N. M. September 1991.P. Axelrad, B. W. Parkinson, Closed Loop Navigation and Guidance for <strong>Gravity</strong> <strong>Probe</strong> B Orbit Insertion, Journal of TheInstitute of Navigation, Vol. 36, No. 1, Spring 1989.J. Li, G.M. Keiser, J.M. Lockhart, P. Shestople, Time Transfer between UTC and Local Vehicle Time for the <strong>Gravity</strong> <strong>Probe</strong> BRelativity Mission. Proceedings of both Annual Meetings of Institute of Navigation, pp.560-570, 2004.J. Li, A. Ndili, L. Ward, S. Buchman, <strong>GP</strong>S Receiver Satellite/Antenna Selection Algorithm for the <strong>Stanford</strong> <strong>Gravity</strong> <strong>Probe</strong> BRelativity Mission. Proceedings of 1999 Institute of Navigation National Technical Meeting, pp.541.J. Li, A. Ndili, L. Ward, S. Buchman, M. Keiser, Analysis of Field-of-View of <strong>GP</strong>S Antennas and Constraints of the AntennaTransfer Time, <strong>Stanford</strong> University, <strong>GP</strong>-B Memo, SDOC 344, Rev -, 1998D. Yale, A. Ndili, J. Li, E Ng, E. Bean, S Buchman, Rolling <strong>GP</strong>S Receiver Development and Verification Testing for SpaceApplication, Institute of Navigation <strong>GP</strong>S-99 Conference, Nashville, Tennessee, Proceedings of the 12thInternational Technical Meeting, p. 857.<strong>Gravity</strong> <strong>Probe</strong> B — <strong>Post</strong> <strong>Flight</strong> Analysis • Final <strong>Report</strong> March 2007 389
E. G. Lightsey, C. E. Cohen, B. W. Parkinson, Development of a <strong>GP</strong>S Receiver for Reliable Real-Time AttitudeDetermination in Space, Proceedings of 7th International Technical Meeting of the Satellite Division of theInstitute of Navigation, 1994, p. 1677-1684.13.5 Gas Management Assembly (GMA)The GMA performed nominally during both the IOC and science (data collection) phases of the mission. Alltasks were completed on schedule and without any errors.All sub-systems of the GMA, including pressure and temperature were “green” throughout the mission, withthe exception of a few hours during the second week after launch, when the spacecraft sustained a proton strike,causing a switch-over from the main “A-side” computer and systems to the backup “B-side” systems. Duringgyro spin-up procedures, the GMA performed “as expected” with respect to spin-up manifold pressure vs. timeplots.No anomalies and only two observations were attributed to the GMA during the mission. The two observationswere for silicone diode temperature spikes that did not affect the thermal control of the GMA and an increasedpressure down stream of the pressure regulators due to gas leakage through the GMA latch valves. This wasexpected based on ground testing.13.5.1 GMA Development and Operational ConceptThe GMA was a late delivery sub-assembly that was fabricated, environmentally tested, and delivered to<strong>Stanford</strong> in 13 months. At <strong>Stanford</strong>, the GMA was functionally verified by spinning up a low temperature (4ºKelvin) gyroscope. It was mated to the space vehicle at Lockheed Martin in Sunnyvale, California just prior tothe space vehicle thermal vacuum testing. The GMA passed functional testing for both pre and post thermalvacuum testing.The GMA has three main operating parts:• Two high-pressure storage vessels filled with 10.4 liters of helium at 2000psia.• Two redundant gas manifolds that lead to each gyro inlet, a probe inlet, and a vent path to space. Eachgas manifold has two redundant pressure regulators, two flow controllers (725 sccm and 2 sccm), 15latch valves, and 7 pressure transducers.• Two heater strips to heat the GMA pallet to 20ºC ±8ºC during valve operations.Ultra-pure (99.9999%) helium gas is streamed from the Gas Management Assembly (GMA), mounted in a bayon the spacecraft frame, through tubing that enters the “top hat” (the thermal interface at the top of the <strong>Probe</strong>)and travels down to the gyro housings in the Science Instrument Assembly (SIA) at the bottom of the <strong>Probe</strong>. Asthe helium gas descends into the <strong>Probe</strong>, which is at a temperature of approximately 1.8 Kelvin, the gas coolsdown from 273 Kelvin to around 12 Kelvin.The GMA was used to perform the “flux reduction” and all phases of gyroscope spin-ups - 0Hz, 5Hz, 10Hz, andthe final “Full” spin. Flux reduction was performed through an inlet into the <strong>Probe</strong> with a helium gas flow at 2sccm while the <strong>Probe</strong> leakage valve was open.The GMA consists of the components shown in Table 13-9 below. Note the redundancy some of thecomponents.390 March 2007 Chapter 13 — Other Payload Subsystems Analyses
Table 13-9. Summary of Components for the Gas Management AssemblyComponent Qty Redundancy CommentsRegulators 4 2 Pairs 2 regulators in seriesLatch Valves 30 15 Gyro outlet branches included 2 of 4 valves that were in anopen state for electrical redundancyFlow Control Orifices 5 2 10 SCCM flow control for flux reduction was in place toreduced the risk of over pressurizing the <strong>Probe</strong>Filters 4 0 Filters were primarily for filling the GMA with He gasFill and Drain Valves 4 0 Used to fill GMA w/He gas and servicing the regulators (lockup).Pressure Sensors 14 0 Pressure sensors were primarily used to evaluate the status ofa latch valve (open or closed)Gas Bottles (5.2 literseach)2 0 Gas bottles were in parallel and not isolated from each other(total gas - 2000psia / 99.9999% helium)Figure 13-44. A Top View of the GMA Pallet with the Thermal Blanket Frame Attached<strong>Gravity</strong> <strong>Probe</strong> B — <strong>Post</strong> <strong>Flight</strong> Analysis • Final <strong>Report</strong> March 2007 391
Figure 13-45. A Bottom View of the GMA Showing the Supply Tanks and Outlet Valves13.5.2 Pre-Launch Ground SupportThe GMA was built by Moog, Inc. in Buffalo New York. The latch valves had a gas leakage specification of < 1x10 -7 std cc/second. Most of the latch valves met this requirement, though some valves leaked at as high as 1x 10 -4std cc/second. Some of the valves that did not meet the specification were the four vent valves that vented theGMA to space. The concern of these valves leaking on the ground was that “air” could leak back into the GMAthat would contribute cryogenic contamination into the science probe during spin-up. A mitigation plan wasdeveloped by <strong>Stanford</strong> to back fill the GMA with 300 psia of ultra pure helium (See Figure 13-46 below) up tothe pressure regulators to ensure a minimal risk of cryogenic contamination of the SIA (science instrumentassembly). Fill and Drain valves, as shown in Figure 13-48 below, were installed between the GMA and the<strong>Probe</strong> inlets to minimize cryo contamination from entering into the <strong>Probe</strong>.392 March 2007 Chapter 13 — Other Payload Subsystems Analyses
Figure 13-46. GMA vent manifold and service GSE used to minimize cryogenic contamination and ensureregulator lock-up for launchFigure 13-47. Service valve assembly (fill and drain valves) used to service the GMA to reduce the risk ofcryogenic contamination during ground supportCryogenic contamination could have resulted in a mission failure due to not having the ability to spin-up thegyroscopes. The mitigation plan included exhaustive ground support operations that took place until 12 hoursprior launch to avoid cyro contamination. All this effort for ground support operations led to a successful GMAoperation on orbit. The GMA configuration with component names is shown in Figure 13-48 below, and aschematic diagram of the GMA, configured for Gyro #4 spin-up, is shown in Figure 13-50.<strong>Gravity</strong> <strong>Probe</strong> B — <strong>Post</strong> <strong>Flight</strong> Analysis • Final <strong>Report</strong> March 2007 393
Figure 13-48. The GMA configuration on a vented honeycomb palletFigure 13-49. Schematic diagram of the GMA394 March 2007 Chapter 13 — Other Payload Subsystems Analyses
13.5.3 GMA Gas Consumption for Gyro #4 Spin-UpThe graph in Figure 13-50 below shows helium gas consumption for spinning up gyroscope #4 during IOC.This GMA gas consumption performance was typical for all four gyros.Figure 13-50. Helium gas consumption for 10 hz and full spin-up of gyro #4 during IOC13.5.4 Total GMA Gas Consumption for Gyro Spin-UpApproximately 450 psia of ultra-pure helium gas was used during IOC. The He gas was used to perform the fluxreduction, as well as gyroscope spin-ups. The GMA was used during briefly during post-mission still has anample supply of helium gas remaining for post mission gyroscope spin-ups, if this is deemed desirable.Figure 13-51. Pressure Transducer <strong>GP</strong>-1 Snap-Shot of Actual Gas Consumed by the GMA<strong>Gravity</strong> <strong>Probe</strong> B — <strong>Post</strong> <strong>Flight</strong> Analysis • Final <strong>Report</strong> March 2007 395
Table 13-10. Summary for Helium Gas Consumption for GMA Operations On OrbitGyroscope Number Helium Gas Consumption1 ~ 50 psia2 ~ 90 psia3 ~ 80 psia4 ~ 220 psiaFlux Reduction~ 10 psia13.5.5 GMA Science and <strong>Post</strong>-mission StatusThe GMA was secured for the science phase of the mission. The vent path and all gyro inlet valves were closed.The redundant (normally open) valves for the flux flush inlets remained open. GMA heaters were turned offand the safe-modes to activate any GMA valves were disabled. During the science phase of the mission, therewas no evidence of the GMA leaking any gas into the science gyroscopes that would affect any science data.There is an ample supply of helium remaining to spin up the gyros again for use in post-mission analyses or newexperiments.396 March 2007 Chapter 13 — Other Payload Subsystems Analyses
14Data Collection, Processing & Analysis<strong>Gravity</strong> <strong>Probe</strong> B — <strong>Post</strong> <strong>Flight</strong> Analysis • Final <strong>Report</strong> March 2007 397
398 March 2007 Chapter 14 — Data Collection, Processing & Analysis
This chapter provides an overview of the collection, processing and analysis of data collected from the <strong>GP</strong>-Bspacecraft and science instrument. The chapter includes two main sections:1. “Collection and Processing <strong>GP</strong>-B Data” —Several vignettes excerpted from <strong>GP</strong>-B Mission News storiesthat were posted to our <strong>GP</strong>-B Web site and also sent out to over 2,400 <strong>GP</strong>-B Email Update Listsubscribers during the 17 months of the <strong>GP</strong>-B flight mission.2. “The <strong>GP</strong>-B Science Data Analysis Process” —A brief description of the procedures that are currentlybeing used to analyze the science data and determine the experimental results that will be announcedand published in the spring of 2007.14.1 Collection and Processing <strong>GP</strong>-B DataThis section contains a series of vignettes describing how <strong>GP</strong>-B data were collected and stored, how safemodesprotected the spacecraft, science instruments and data, how anomalies such as computer memory errors werehandled, and how intentional telescope dither and stellar aberration were used to calibrate the science datasignals received. These vignettes were originally written to answer the question most asked throughout themission by people around the world who have been following <strong>GP</strong>-B: “Why is it that proton hits to thespacecraft, computer memory errors, and other anomalies and glitches that occurred during the science phaseof the mission will have little, if any effect on the final experimental results?”14.1.1 Data Collection and TelemetryOur <strong>GP</strong>-B spacecraft has the capability of autonomously collecting data—in real time—from over 9,000 sensors(aka monitors). Onboard the spacecraft there is memory bank, called a solid-state recorder (SSR), which has thecapacity to hold about 15 hours of spacecraft data—both system status data and science data. The spacecraftdoes not communicate directly with the <strong>GP</strong>-B Mission Operations Center (MOC) here at <strong>Stanford</strong>. Rather, itcommunicates with a network of NASA telemetry satellites, called TDRSS (Tracking and Data Relay SatelliteSystem), and with NASA ground tracking stations.Figure 14-1. A drawing of the spacecraft communicating with ground tracking stationsMany spacecraft share these NASA telemetry facilities, so during the mission, <strong>GP</strong>-B had to schedule time tocommunicate with them. These scheduled spacecraft communication sessions are called “passes,” and duringthe flight mission, the <strong>GP</strong>-B spacecraft typically completed 6-10 TDRSS passes and 4 ground station passes eachday. During these communications passes, commands were relayed to the spacecraft from the MOC, and datawere relayed back via the satellites, ground stations, and NASA data processing facilities. The TDRSS links have<strong>Gravity</strong> <strong>Probe</strong> B — <strong>Post</strong> <strong>Flight</strong> Analysis • Final <strong>Report</strong> March 2007 399
a relatively slow data rate, so we could only collect spacecraft status data and send commands during TDRSSpasses. We were able to collect science data only during the ground passes. That’s the “big picture.” Following isa more detailed look at the various data collection and communication systems described above.14.1.1.1 The Solid State RecorderAn SSR is basically a bank of Random Access Memory (RAM) boards, used on-board spacecraft to collect andstore data. It is typically a stand-alone “black box,” containing multiple memory boards and controllingelectronics that provides management of data, fault tolerance, and error detection and correction. The SSRonboard the <strong>GP</strong>-B spacecraft has approximately 185 MB of memory—enough to hold about 15.33 hours ofspacecraft data. This is not enough memory to hold all of the data generated by the various monitors, so the<strong>GP</strong>-B Mission Operations staff controlled what data were collected at any given time, through commands sentto the spacecraft.Figure 14-2. A typical solid state recorder (SSR) manufactured by SEAKR EngineeringMany instruments on-board the spacecraft have their own memory banks. Data rates from these instrumentsvary—most send data every 0.1 second, but some are faster and others slower. The data from all of theseinstruments are collected by the primary data bus (communication path) and sent to the central computer,called the CCCA. The CCCA then sends the data to the SSR.The data were categorized into five subtypes:1. Sensor programmable telemetry—High data rate of 0.1 seconds, greater than 9000 monitors, mostlyused for science & engineering)—this is <strong>GP</strong>-B’s “primary” useful data, including most science data.2. Event data—For example, whether the vehicle is in eclipse (tells when we entered eclipse behind theearth and when we emerged)3. Database readouts—Used to confirm that the on-board database is the same as the ground folks think itis – use this to verify that say, filter setting commands, were received and enacted.4. Memory readout (MRO)—Used to ensure that the binary memory on-board is the same (error free)memory we think it is—this is where single & multi-bit errors occur (this is not collected data, but onlyprogrammable processes—i.e., the spacecraft’s Operating System). If we find errors in the MROs, we canre-load the memory. Solar wind (proton hits), for example, can cause errors here.5. Snapshot data—This is extremely high-speed data (1/200th of a second) from the SQUID (Super-Conducting Quantum Interference Device), Telescope and Gyro readout systems. The CCCA does someon-board data reduction, performing Fast Fourier Transforms (FFT) on some of the incoming SRE data.This on-board reduction is necessary, because we do not have room in our SSR, nor the telemetrybandwidth, to relay the high-rate data back to the MOC all the time. (Perhaps we should upgrade toDSL…) However, like all numerical analysis methodology, an FFT can become “lost” because an FFT is400 March 2007 Chapter 14 — Data Collection, Processing & Analysis
not always performed from the same starting abscissa (x-axis) value. The Snapshot allows us to see someof the original data sets being used for the FFTs and confirm that they are not los—or if they are, we canfix them by making a programmed adjustment on-board. Other systems—the Telescope Readout (TRE)and Gyro Suspension System (GSS)—use their snapshots for similar instrumentation and data reductionvalidity checks.Data were stored to the SSR in a “First in, First out” queue. Once the memory is 15.33 hours full, the new databegins to overwrite the oldest data collected. That’s why it was a good idea to dump the SSR to the ground atleast every 12 –15 hours (for safety!), which is exactly what we did.14.1.1.2 Telemetry—TDRSS and Ground StationsSo, how did we talk to the spacecraft and retrieve our data? NASA communicates with its spacecraft in severalways. Its highest availability is through TDRSS, two communications satellites in orbit, just waiting forcommunications. These two satellites can’t handle much data at a time, and we could transmit to them only at a1K or 2K (kilobit per second) rate. For <strong>GP</strong>-B, this rate is only fast enough to exchange status information andcommands; it was not fast enough for downloading science data.Figure 14-3. A NASA TDRSS SatelliteNASA also uses ground-based stations. There are several around the world, but each ground station networkused is determined by satellite type and orbit. Because <strong>GP</strong>-B is in a polar orbit communicating primarily at 32K(32kilobits per second), we used the NASA Goddard “Ground Network”. This network includes stations inPoker Flats, Alaska; Wallops, Virginia; Svalbard, Norway; and McMurdo station, Antarctica. Communicationwith the South Pole station was not as reliable as the others, but we did use the McMurdo ground station on afew occasions during the mission.<strong>Gravity</strong> <strong>Probe</strong> B — <strong>Post</strong> <strong>Flight</strong> Analysis • Final <strong>Report</strong> March 2007 401
Figure 14-4. NASA ground stations at Svalbard, Norway (upper left), Poker Flats, Alaska (lower left),and Wallops Island, Virginia (right)Usually, we scheduled a ground pass at one of the four ground stations every six hours or so. We talked toTDRSS about six times per day. Communications must be scheduled and arranged, and like all internationalcalls, these communications passes are not cheap! Interspatial (satellite-to-satellite) calls are most expensive,and ground-to-space calls are slightly less costly. We could have talked to TDRSS and the ground stations moreoften, but it would have cost more money, so we generally followed our regular schedule, unless there was anemergency. During safemodes or other anomalies, we scheduled extra TDRSS and ground passes as needed. Wewere not in contact with the spacecraft at all times.While streaming 32K SSR data to the ground, we cannot record to the SSR. Our data collected by the sensorsduring the transmission were therefore enfolded into the transmission, bypassing the SSR. Also, it was necessaryto change antennas (switching from forward to aft antenna) midway through each ground pass. During theseantenna changes, we lost about 30 seconds of the real-time data because it was “beamed into space”. Our overalldata capture rate for the entire mission was 99.6%, significantly exceeding the 90% data capture specification inour contract with NASA. Thus, we did just fine in terms of data capture, despite the data losses during antennaswitches and anomalous events. On average, it took about 12 minutes to download the entire contents of theSSR.14.1.1.3 Relaying Data to the <strong>GP</strong>-B MOC at <strong>Stanford</strong>When the spacecraft data were sent through TDRSS, they were then transmitted directly to the <strong>Stanford</strong>University <strong>GP</strong>-B MOC through our data link with NASA, in real time. We recorded the data on our computersin a format similar to the ground station data, and then processed it in our data processing center at <strong>Stanford</strong>.402 March 2007 Chapter 14 — Data Collection, Processing & Analysis
Figure 14-5. The <strong>GP</strong>-B building and Mission Operations Center (MOC) at <strong>Stanford</strong> UniversityHowever, data relayed though ground stations went through an intermediate step, before being sent to ourMission Operations Center. When data arrives at a ground station, 32 byte headers are put on each data packetto identify it. The identifiers include our spacecraft ID, the ground receipt time, whether or not Reed-Solomonencoding was successfully navigated, the ground station ID, and several error correction checks. The data werestored at the local station and a copy was sent to a central NASA station. After it passed transmission errorchecks at NASA, it came to us at <strong>Stanford</strong>. The average 15-hour file took between 1.5 and 4 hours to arrive here.14.1.1.4 Uncompressing and Formatting the DataOnce the data were received here at <strong>Stanford</strong>, a laborious process began. Spacecraft data, by its very nature, mustbe highly compressed so that as much data as possible can be stored. While we have over 9,000 monitors onboard,we cannot sample and store more than about 5,500 of them at a time. That’s why our telemetry is“programmable”—we could choose what data we wanted to beam down. However, in order to get as much dataas possible, we compressed it highly.The data were stored in binary format, and the format included several complexities and codes to indicate thestates of more complex monitors. For example, we might encode the following logic in the data: “if bit A=0, theninterpret bits B and C in a certain way; but if bit A=1, then use a very different filter with bits B and C.” The datawere replete with this kind of logic. In order to decompress and decode all of this logic, we used a complex map.Our software first separated the data into its five types (described above). Then, type one underwent“decommutation.” Once all of the data in a set was translated into standard text format and decommutated, thatset was stored in our vast database (over one terabyte). This was the data in its most useful, but still “raw” form;we called this “Level 1 data.” It took about an hour to process 12 hours of spacecraft data. It was the DataProcessing team’s job to monitor this process, making sure files arrived intact, and unraveling any data snarlsthat may have come from ground pass issues.Our science team took the Level 1 data sets, filtered them, and factored in ephemeris information and otherinteresting daily information (solar activity, etc). The science team also performed several important “preprocessing”steps on the data sets. Once that initial science process was complete, a data set was stored in the“Level 2” database. From there, more sophisticated analysis could be performed.14.1.2 Detecting and Correcting Computer Memory Errors in OrbitThe computer and electronics systems on-board every spacecraft must undergo special “ruggedization”preparations to ensure that they will function properly in the harsh environment of outer space. <strong>GP</strong>-B's onboardcomputers and other electronics systems are no exception. For example, the components must beradiation-hardened and housed in heavy-duty aluminum or equivalent cases. Furthermore, the firmware(built-in hardware-level programming) must include error detection and correction processes that enable the<strong>Gravity</strong> <strong>Probe</strong> B — <strong>Post</strong> <strong>Flight</strong> Analysis • Final <strong>Report</strong> March 2007 403
electronic components to recover from the effects of solar radiation bombardment and other space hazards.Following is a brief description of <strong>GP</strong>-B's on-board computers and the techniques used to detect and correctsingle and multi-bit errors.14.1.2.1 Overview of Computers On-Board the <strong>GP</strong>-B Spacecraft<strong>GP</strong>-B has several computers on-board the spacecraft. The main flight computer and its twin backup are calledthe CCCA (Command & Control Computer Assembly). These computers were assembled for <strong>GP</strong>-B by theSouthwest Research Institute. They use approximately 10-year old IBM RS6000 Central Processing Units(CPUs), with 4 MB of radiation-hardened RAM memory. These computers, along with ruggedized powersupplies are encased in sturdy aluminum boxes, with sides up to 1/4” thick.In addition to the A-side (main) and B-Side (backup) flight computers, the <strong>GP</strong>-B spacecraft has two otherspecial-purpose computers—one for the Gyro Suspension System (GSS) and one for the SQUID ReadoutElectronics (SRE). Each of these specialized computers contains 3 MB of radiation-hardened RAM memory andcustom circuit boards designed and built here at <strong>Stanford</strong> University. Because of the custom circuit boards,these computers are housed in special aluminum boxes that were also built at <strong>Stanford</strong>.14.1.2.2 Memory Error Detection & Correction (EDAC) LogicThe RAM memory in these computers is protected by Error Detection and Correction logic (EDAC), built intothe computer's firmware. Specifically, the type of EDAC logic used is called SECDED, which stands for “SingleError Correction, Dual Error Detection.” Here's how it works. For every 64 bits of RAM in the computer'smemory, another 8 bits are reserved for EDAC. This produces a unique 64-bit checksum value for each RAMlocation. A firmware process called memory scrubbing runs continually in the background, validating thechecksums for the entire bank of RAM memory locations every 2.5 seconds.If the EDAC detects an error in which only one single bit is incorrect—a single-bit error (SBE)—in a memorylocation checksum value, it sends an interrupt signal to the CPU, and the CPU automatically fixes the error bywriting the correct value back into that memory location. However, if the EDAC detects an error involvingmore than one bit—a multi-bit error (MBE)—-it generates a different type of interrupt signal causing the CPUto store the address of the bad memory location in a table that is transmitted to our mission operations center(MOC) during each telemetry communications pass.14.1.2.3 Correcting Multi-Bit ErrorsWhenever the computer engineers on our operations team discovered the presence of one or more MBEs, theyimmediately looked up the use of that memory location in a map of the computer's memory. If that location wasin an area of memory that was not being used, the MBE was said to have been “benign.” In fact, most, but not all,of the MBEs we experienced during the mission occurred in benign memory locations. In these cases, one of thecomputer engineers traveled to the Integrated Test Facility (ITF),—then located at Lockheed MartinCorporation's Palo Alto office, about 15 minutes away from the <strong>GP</strong>-B MOC, but now located at <strong>Stanford</strong>—todetermine what value was supposed to be contained in the corrupted memory location. The ITF is a verysophisticated flight simulator that maintains a ground-based replica of all the systems running on thespacecraft.404 March 2007 Chapter 14 — Data Collection, Processing & Analysis
Figure 14-6. ITF readout showing a discrepancy between the actual value (left) of memory location in thespacecraft's computer vs the correct value (right) stored in the ITF simulator.Once the engineer determined the correct value of a bad memory location in the spacecraft's computer, hecreated a set of commands that were manually sent to the spacecraft during a telemetry pass to patch the badlocation with the correct value.Figure 14-6 shows a screen capture from the ITF comparing the correct andincorrect values for a memory location from the spacecraft's computer.Figure 14-7. Two members of the <strong>GP</strong>-B Mission Operations team discuss an MBE that triggered a B-Side (CCCBcomputer) reboot on March 18, 2005On the other hand, if the engineer determined that the MBE was located in an active part of the computer'smemory—a location containing a command that the CPU would be executing—he would ask the missionoperations team to manually issue a command to the flight computer, stopping the timeline of instructions thatwas being executed, until the bad memory location could be patched. However, it turns out that there was onescenario in which an MBE in a critical part of memory could be missed by the EDAC system.14.1.2.4 Computer Reboots Triggered by a Watchdog Timer FailureThe 2.5 seconds that it takes the EDAC to scrub the entire memory may seem like a very short time in humanterms, but an RS6000 CPU can execute a great many instructions in that time frame. Because the CPU isexecuting instructions while EDAC memory scrubbing is in process, it is possible for the CPU to access amemory location that was, say, struck by a stray proton from the sun near the SAA region of the Earth, beforethe EDAC system detected the error. And, if that memory location contains a corrupted instruction that theCPU tries to execute, it can cause the CPU to hang or crash. Communications hardware in the interface boxconnected to the computer includes a so-called “watchdog timer.” This is basically a failsafe mechanism that,like the deadman switch on a bullet train, awaits a signal from the CPU at regular intervals. If the watchdogtimer expires without receiving a signal, it automatically triggers a reboot of the computer.<strong>Gravity</strong> <strong>Probe</strong> B — <strong>Post</strong> <strong>Flight</strong> Analysis • Final <strong>Report</strong> March 2007 405
By a process of elimination, the <strong>GP</strong>-B Anomaly Review Team concluded that this is probably what happened inthe backup CCCA (main computer) on-board the spacecraft on Friday, March 18, 2005. The flight computermaintains a history of completed instructions up to within one second of executing an instruction in a badmemory location. However, once the watchdog timer expires and the computer reboots, this history is lost.Thus, the occurrence of such an event can only be deduced by eliminating other possible causes.14.1.3 <strong>GP</strong>-B Safemodes and Anomaly ResolutionConsider the following: <strong>GP</strong>-B is a unique, once-in-history experiment. Its payload, including the gyroscopes,SQUID readouts, telescope and other instrumentation took over four decades to develop. Once launched, thespacecraft was physically out of our hands, and typically, we only communicated with it about every two hoursvia scheduled telemetry passes. Thus, we entrusted the on-board flight computer (and its backup) with the taskof safeguarding the moment-to-moment health and well-being of this invaluable cargo. How did the <strong>GP</strong>-Bflight computer accomplish this critically important task? The answer is the safemode subsystem.14.1.3.1 The <strong>GP</strong>-B Safemode SystemMost autonomous spacecraft have some kind of safemode system on-board. In the case of <strong>GP</strong>-B, Safemode is anautonomous subsystem of the flight software in the <strong>GP</strong>-B spacecraft's on-board flight computers. The <strong>GP</strong>-BSafemode Subsystem is comprised of three parts:1. Safemode Tests—Automatic checks for anomalies in hardware and software data.2. Safemode Masks—Scheme for linking each safemode test with one or more safemode responsesequences.3. Safemode Responses—Pre-programmed command sequences that are activated automatically when acorresponding test fails to provide an expected result.Figure 14-8. Uploading commands to the spacecraft from the MOC, following a B-side computer reboot.These tests and response commands are designed to safeguard various instruments and subsystems on thespacecraft and to automatically place those systems in a known and stable configuration when unexpectedevents occur.For example, one of the tests in the <strong>GP</strong>-B Safemode Subsystem checks to ensure that the communications linkbetween the on-board flight computer and the <strong>GP</strong>-B MOC here at <strong>Stanford</strong> is alive and active. The requirementfor this test is that the flight computer must receive some command from the MOC at least once every 12 hours.If the flight computer does not receive a command within that time frame, we assume that normal telemetry isnot working, and the pre-programmed response commands cause the computer to automatically reboot itselfand then re-establish communication. This test is a variation of the “deadman switch” test used on high-speed406 March 2007 Chapter 14 — Data Collection, Processing & Analysis
ullet trains. To ensure that the train's engineer is alive and awake while the train is traveling at high speed, theengineer is required to press a button or switch at regular intervals. If the train does not receive the expectedhuman input within each time interval, the train automatically throttles down and comes to a halt.Not all of the tests and responses in the <strong>GP</strong>-B Safemode Subsystem were enabled at any given time. For example,some of the tests were specifically created for use during the launch and/or during the Initialization and OrbitCheckout (IOC) phase and were no longer needed during the science phase of the mission. Also, active tests andresponses could be re-programmed if necessary. For example, the response commands for the safemode thattriggered a computer reboot on Monday, March 14, 2005, were changed in the ensuing days to simply stop themission timeline, rather than rebooting the flight computer, as originally programmed.14.1.3.2 Responding to Anomalous Events On OrbitWhen anomalous events occurred, automatic responses ensured that the spacecraft and its subsystemsremained in a safe and stable condition. This enabled our mission operations team to become aware of the issueon-board, identify and understand the root cause, and take appropriate action to restore normal operations.<strong>GP</strong>-B employed a formal process, called “anomaly resolution,” for dealing with unexpected situations thatoccurred in orbit. This process was thoroughly tested and honed during a series of seven pre-flight simulationsover the course of two years.<strong>GP</strong>-B anomalous events were evaluated and classified into one of four categories:1. Major Space Vehicle Anomalies—Anomalies that endangered the safety of the spacecraft and/or thepayload. Response to these anomalies was time-critical.2. Medium Space Vehicle Anomalies—Anomalies that did not endanger the safety of the space vehicle butcould have impacted the execution of the planned timeline. Response to these anomalies was not timecriticalif addressed within a 72-hour window.3. Minor Space Vehicle Anomalies—Anomalies that did not endanger the safety of the space vehicle.These were low risk problems with the vehicle that were resolved by taking the appropriate correctiveaction.4. Observations—In addition to formal anomaly categories, the space vehicle often exhibited off-nominalor unexpected behavior that did not appear initially to be an operational or functional issue and did notviolate any limits, but warranted attention over time. Observation items were sometimes elevated to ananomaly category if they were judged to be serious enough to warrant a high-priority investigation.Figure 14-9. In the Anomaly Room, team members discuss a series of recovery commands thatwill be uploaded to the spacecraft.<strong>Gravity</strong> <strong>Probe</strong> B — <strong>Post</strong> <strong>Flight</strong> Analysis • Final <strong>Report</strong> March 2007 407
A special room in the <strong>GP</strong>-B Mission Operations, called the Anomaly Room, was the home of the <strong>GP</strong>-B AnomalyReview Board (ARB), a select group of senior <strong>GP</strong>-B team members from <strong>Stanford</strong>, NASA, and LockheedMartin, who managed the troubleshooting of anomalies and observations. The Anomaly Room, which waslocated across the corridor from the <strong>GP</strong>-B MOC, contained a set of spacecraft status monitors, communicationsand teleconference equipment, computer and voice hookups, a documentation library, white boards, acomputer projection system, and an oval discussion table.During the flight mission, whenever an anomaly was in the process of being resolved, the Anomaly Room wasstaffed 24 hours a day, 7 days a week; at other times, it was staffed during normal working hours, with teammembers on call. When major anomalous events, such as computer reboots, occurred outside normal workinghours, the Mission Director on duty activated the Anomaly Room and issued a series of pager and cell phonecalls via computer, summoning key staff members on the ARB, along with a selected anomaly team, comprisedof resident engineers and engineering specialists, to come in and work through the issue. The group used atechnique called “fault tree analysis” to evaluate and determine the root cause of unexpected events.The <strong>GP</strong>-B Safemode Subsystem and anomaly resolution process worked very well throughout the mission. Overthe course of the flight mission, the ARB successfully worked through 193 anomalies/observations. Most ofthese issues (88%) were classified as observations, and about 9% were classified as minor to medium anomalies.But five (3%) were classified as major anomalies, including the B-Side computer switch-over and the stuck-openvalve problems with two of the 16 micro thrusters early in the mission, as well as subsequent computer andsubsystem reboot problems due to solar radiation strikes. In each case, the established anomaly resolutionprocess enabled the team to identify the root causes and provide successful recovery procedures in every case.You can read a detailed description of the <strong>GP</strong>-B Anomaly Resolution Process in Chapter 5, ManagingAnomalies and Risk . Also, Appendix D, Summary Table of <strong>Flight</strong> Anomalies contains a table summarizing thecomplete set of anomalies and observations from launch through the end of the post-science calibrations inOctober 2005.14.1.4 Effects of Anomalous Events on the Experimental Results of <strong>GP</strong>-BWhenever anomalous events occurred on-board the <strong>GP</strong>-B spacecraft in orbit, such as computer switch-oversand reboots, we received numerous inquiries asking about the effects of these events on the outcome of the<strong>GP</strong>-B experiment. These events have resulted in a small loss of science data. In and of itself, this loss of data willhave no significant effect on the results of the experiment. If it turns out that some of the lost data wasaccompanied by non-relativistic torques on the gyros (measurable drift in the gyro spin axes caused by forcesother than relativity), we believe that there will probably be a perceptible, but still insignificant effect on theaccuracy of the end results. We really will not be able to quantify the effect of these events until the full dataanalysis is completed early in 2007.We have long anticipated and planned for dealing with possible lapses in the data and non-relativistic torqueson the gyros during the mission. In fact, this subject was explicitly discussed in Dr. Thierry Duhamel's 1984 PhDthesis entitled Contributions to the Error Analysis in the Relativity Gyroscope Experiment. (This was one of 79 <strong>Stanford</strong>doctoral dissertations sponsored by <strong>GP</strong>-B over the past 42 years.) Chapter 4 of Dr. Duhamel's dissertation isentitled “Effect of Interruptions in the Data.” In this chapter, Dr. Duhamel modeled various hypothetical casesof an undetermined amount of gyro spin axis drift due to non-relativistic torques (forces) on the gyros,accompanying data interruption periods of varying lengths. Each of Dr. Duhamel's hypothetical scenariosmodels these effects over a 12-month data collection period, showing the effect of gyro drift and data loss as afunction of when in the mission (month 1, month 2, etc.) the event occurs.In a nutshell, the results of Dr. Duhamel's research showed that lapses of data in which the gyros do notexperience any non-relativistic torques would have no significant effect on the outcome of the experiment.Lapses of data that are accompanied by gyro drifts of unknown size due to non-relativistic forces would have a408 March 2007 Chapter 14 — Data Collection, Processing & Analysis
perceptible, but still relatively small effect on the experimental results. Furthermore, Dr. Duhamel's researchindicates that in most cases, the effects of gyro drift and data loss tend to be larger if they occur at the beginningor end of the science phase, rather than in the middle.Based in part on Dr. Duhamel's prescient research over 20 years ago, the <strong>GP</strong>-B science team has developed andperfected a comprehensive, state-of-the-art data analysis methodology for the <strong>GP</strong>-B experiment that, amongmany other things, takes into account data lapses and the possibility of accompanying non-relativistic torqueson the gyros. Also, many improvements have been made in the <strong>GP</strong>-B technology since Dr. Duhamel did hisresearch. These improvements provide us with more extensive data and extra calibrations that enable us tofurther refine the original error analysis predictions.Dr. Thierry Duhamel now lives in France (his native country), where he works for EADS Astrium, a leadingEuropean aerospace company.14.1.5 Aberration of Starlight—Nature’s Calibrating Signal<strong>GP</strong>-B Principal Investigator, Francis Everitt, once said: “Nature is very kind and injects a calibrating signal, dueto the aberration of starlight, into the <strong>GP</strong>-B data for us.” This phenomenon actually provides two naturalcalibration signals in the relativity data that are absolutely essential for determining the precise spin axisorientation of the gyros over the life of the experiment. However, the word “aberration” typically refers tobehavior that departs or deviates from what is normal, customary, or expected—and usually, such behavior isnot welcome. So, what does aberration have to do with starlight? And, why would we want to use somethingaberrant as a calibration signal? To answer the first of these questions, we must first travel back in time to the18th century.14.1.5.1 18 th Century British Astronomer James Bradley Discovers Stellar AberrationAt the beginning of the 18th century, astronomers were still seeking some form of direct proof of theCopernican theory that all the planets in our solar system orbit around the Sun. One such person was BritishAstronomer James Bradley, who in 1718 was recommended by the Astronomer Royal Edmund Halley tobecome a Fellow of the Royal Society, and who eventually succeeded Halley as British Astronomer Royal in1742.Figure 14-10. British Astronomer Royal, James Bradley<strong>Gravity</strong> <strong>Probe</strong> B — <strong>Post</strong> <strong>Flight</strong> Analysis • Final <strong>Report</strong> March 2007 409
Starting on 3 December 1725, Bradley observed the star, Gamma Draconis, through his telescope and noted itsposition in the heavens. He was planning to observe the star's position periodically for a year, anticipating thatin six months, he would be able to view a shift in the star's position due to stellar parallax caused by the Earthhaving moved around the Sun to the opposite extreme of its orbit. In Bradley's time, the prevailing wisdom wasthat the distance across the long axis of the Earth's orbit—approximately 300,000,000 km (186,000,000 miles)—would provide a sufficient baseline to view a parallax shift in the star’s position. What the astronomers ofBradley's day did not know is that even the closest star to our solar system is nearly 150,000 times further awaythan the distance across Earth's orbit, and thus the parallax effect between December and June observations ofGamma Draconis only amounts to about 1.5 arcseconds (0.00042 degrees). This is an angle about the size a pea,viewed from one kilometer away—much too small to be measured with instruments of Bradley's day. It wouldbe another 100 years before stellar parallax was actually detected by Friedrich Bessel, director of the KonigsbergObservatory in Germany.As a result of a year’s worth of periodic observations of the star, Gamma Draconis, Bradley was surprised todiscover that the pattern traced out by the star’s motion was an ellipse. Moreover, the major axis of the ellipsecoincided not with the long axis across Earth's orbit from December to June as would be expected for a parallaxmeasurement, but rather with the short axis from March to September. Bradley pondered these seeminglymysterious results for two more years, discovering that all other stars he observed also traced out identicalelliptical patterns over the course of a year. One morning in 1728, he had an “aha” moment while sailing on aboat, watching the motion of a wind vane flying from a mast. He noticed that the vane kept changing directionsas the boat turned to and fro, and that it did not necessarily point directly opposite the boat’s direction of travel.He thought this might be due to a shifting wind, but upon querying the boat's captain, he learned that the wind'sdirection had remained constant. At that point, he realized that the vane's direction was resulting from acoupling of the boat's motion with the wind direction.At this point, Bradley made a profound connection: he likened the Earth to the boat and the light from a star tothe wind. He then realized that the apparent position of the star was changing as the Earth moved in its orbit.Bradley described this phenomenon in a letter to Halley, which was read to the Royal Society in January 1729. Inhis letter, he named the phenomenon “aberration of starlight,” because the stars appeared to be in a differentposition that they actually were, due to the fact that they were being observed from a moving body.Bradley further realized that since his telescope was moving through space along with the Earth, in order for thestarlight to hit the eyepiece in the center of his telescope, he would have to tilt the telescope in the Earth’sdirection of motion, towards the apparent position of the star. He determined that the angle at which thetelescope must be tilted represents the ratio of the speed at which the Earth is moving around the Sun divided bythe speed of light. Nowadays, thanks to Einstein's special theory of relativity, we now know that a relativisticcorrection factor must be added to the speed of light in the denominator of the stellar aberration ratio.410 March 2007 Chapter 14 — Data Collection, Processing & Analysis
Figure 14-11. Due to the motion of the Earth, the apparent position of a distant star viewed through a telescopediffers from its actual position—Bradley called this difference the aberration angle.From his observations of Gamma Draconis, Bradley knew that the maximum angle at which his telescope had tobe tilted was tiny—approximately 20 arc-seconds. Using this angle, and the velocity of the Earth moving aroundthe Sun, known in his day to be ~30 km/sec (~18.6 miles/sec), he calculated the speed of light to be about 10,000times faster than the orbital velocity of Earth or ~300,000 km/sec (~186,000 miles/sec).14.1.5.2 The Role of Stellar Aberration in the <strong>GP</strong>-B ExperimentYou can now see why the aberration of starlight played a role in the <strong>GP</strong>-B experiment. While constantlytracking the guide star, IM Pegasi, the telescope on-board the spacecraft was always in motion—both orbitingthe Earth once every 97.5 minutes and along with the Earth, the spacecraft and telescope have been orbiting theSun once a year. These motions result in two sources of aberration of the starlight from IM Pegasi. The first is anorbital aberration, which has a maximum angle of 5.1856 arcseconds, resulting from the spacecraft’s orbitalspeed of approximately 7 km/sec, relative to the speed of light. (In the case of orbital aberration, the relativitycorrection is insignificant.). The second is the now familiar annual aberration due to the Earth's orbital velocityaround the Sun, which when corrected for special relativity, amounts to an angle of 20.4958 arcseconds.In the <strong>GP</strong>-B experiment, the signals representing the precession in the gyroscope spin axes over time arerepresented by voltages that have undergone a number of conversions and amplifications by the time they aretelemetered to Earth. These conversions and amplifications imparted a scale factor of unknown size into thedata, and early on in the development of the <strong>GP</strong>-B experimental concept it was apparent that there needed to bea means of determining the size of this gyro scale factor in order to see the true relativity signal. Initially, it<strong>Gravity</strong> <strong>Probe</strong> B — <strong>Post</strong> <strong>Flight</strong> Analysis • Final <strong>Report</strong> March 2007 411
seemed that aberration of starlight was going to be a source of experimental error bundled into the scale factor.But upon examining this issue more closely, it became clear that, quite to the contrary, the orbital and annualaberration of light from the guide star actually provided two built-in calibration signals that would enable thegyro scale factor to be calculated with great accuracy.14.1.5.3 The Orbital Aberration SignalTo see how this works, let's first take a closer look at how the orbital aberration of the starlight from the guidestar, IM Pegasi, is “seen” by <strong>GP</strong>-B spacecraft.Figure 14-12. <strong>GP</strong>-B's Orbital aberration of light from the Guide Star, IM PegasiAs mentioned earlier, the spacecraft orbits the Earth once every 97.5 minutes. During the mission, as thespacecraft emerged over the North Pole, the guide star came into the field of view of the science telescope, andthe telescope then locked onto the guide star. This began what was called the “Guide Star Valid (GSV)” phase ofthe orbit. At this point in its orbit, the orientation of the spacecraft's velocity was directly towards the guide star,and thus, there was no aberration of the star's light—it traveled straight down the center of the telescope.However, as the spacecraft moved down in front of the Earth, the orientation of its velocity shifted in the orbitaldirection until it became perpendicular to the direction of the light from the guide star, slightly above theequator. This is the point of maximum aberration since the telescope was then moving perpendicular to theguide star’s light. As the spacecraft moved on towards the South Pole and then behind the Earth and directlyaway from the guide star, the aberration receded back to zero. At this point, the telescope unlocked from theguide star, transitioning into what was called the “Guide Star Invalid (GSI)” phase of the orbit. The navigationalrate gyros on the outside of the spacecraft maintained the telescope's orientation towards the guide star whilethe spacecraft was behind the Earth, but we did not use the science gyro data collected during the GSI phase.412 March 2007 Chapter 14 — Data Collection, Processing & Analysis
During the GSV portion of each orbit, the telescope remained locked on the guide star, with the spacecraft'smicro thrusters adjusting the telescope's pointing for the aberration of the guide star's light. This introduced avery distinct, half-sine wave pattern into the telescope orientation. This sinusoidal motion was also detected bythe gyro pickup loops that are located in the gyro housings, along the main axis of the spacecraft and telescope.Thus, this very characteristic pattern, generated by the telescope and thrusters, appeared as a calibration signalin the SQUID Readout Electronics (SRE) data for each gyro.14.1.5.4 The Annual Aberration SignalThe annual aberration of the guide star's light works the same way as the orbital aberration signal, but it takes anentire year to generate one complete sine wave.Figure 14-13. <strong>GP</strong>-B's annual aberration of light from the Guide Star, IM PegasiUsing the spacecraft's <strong>GP</strong>S system, we can determine the orbital velocity of the spacecraft to an accuracy ofbetter than one part in 100,000 (0.00001). Likewise, using Earth ephemeris data from the Jet Propulsion Lab inPasadena, CA, we can determine Earth's orbital velocity to equal or better accuracy. We then used thesevelocities to calculate the orbital and annual aberration values with extremely high precision, and in turn, weused these very precise aberration values to calibrate each of the gyro pointing signals. It is interesting to notethat the amplitude of the sine wave generated by the annual aberration is four times as large as the orbitalaberration amplitude, with peaks occurring in September and March. Because we launched <strong>GP</strong>-B in April andstarted collecting science data in September, the effect of the annual calibration signal did not become apparentin the data until February-March 2005, six to seven months into the science phase of the mission. Thus, fromMarch 2005 - August 2005, both the annual and orbital aberration signals were used in the ongoing analysis ofthe science data.<strong>Gravity</strong> <strong>Probe</strong> B — <strong>Post</strong> <strong>Flight</strong> Analysis • Final <strong>Report</strong> March 2007 413
14.1.6 Telescope Dither—Correlating the Gyro & Telescope Scale FactorsWhen used in reference to technology, the term, dither, generally refers to the seemingly paradoxical concept ofintentionally adding noise to a system in order to reduce its noise. For example, a random dithering technique isused to produce more natural sounding digital audio, and another form of visual dithering enables thousands ofcolor shades, used on Internet Web sites, to be derived from a limited basic palette of 256 colors. With respect tothe <strong>GP</strong>-B spacecraft, the dither refers to an oscillating movement of the science telescope and spacecraft that wasactivated whenever the telescope was locked onto the guide star. This intentional telescope movement produceda calibration signal that enabled us to relate the signals generated by the telescope photon detectors to thesignals generated by the SQUID magnetometer readouts of the gyro spin axis positions.14.1.6.1 Science Telescope—Centering on the Guide StarThe sole purpose of the <strong>GP</strong>-B science telescope was to keep the spacecraft pointed directly at the guide starduring the “guide-star-valid” portion of each orbit—that is, the portion of each orbit when spacecraft was “infront of ” the Earth relative to the guide star and the guide star was visible to the telescope. This provided areference orientation against which the spin axis drift of the science gyros could be measured. The telescopeaccomplished this task by using lenses, mirrors, and a half-silvered mirror to focus and split the incoming lightbeam from the guide star into an X-axis beam and a Y-axis beam. Each of these beams was then divided in halfby a knife-edged “roof ” prism, and the two halves of each beam were subsequently focused onto a pair of photondetectors. When the detector values of both halves of the X-axis beam were equal, we knew that the telescopewas centered in the X direction, and likewise, when the detector values of both halves of the Y-axis beam wereequal, the telescope was centered in the Y-axis direction. (The telescope actually contains two sets of photondetectors, a primary set and a backup set for both axes.)Figure 14-14. Schematic diagram of the <strong>GP</strong>-B telescope optics414 March 2007 Chapter 14 — Data Collection, Processing & Analysis
14.1.6.2 Normalized PointingThe telescope detector signals were converted from analog to digital values by the Telescope ReadoutElectronics (TRE) box, and these digital values were normalized (mapped) onto a range of -1 to +1. In thisnormalized range, a value of 0 meant that the telescope was centered for the given axis, whereas a value of +1indicated that all of the light was falling on one of the detectors and a value of -1 indicated that all of the lightwas falling on the other detector.Figure 14-15. Normalized pointing values for the <strong>GP</strong>-B telescopeIn actuality, the light beam for each axis was distributed in a bell-shaped curve along this scale. When thetelescope was centered, the peak of the bell curve was located over the 0 point, indicating that half the light wasfalling on each detector. If the telescope moved off center, the entire curve shifted towards the +1 or -1direction. You can think of this as a teeter-totter of light values, with the 0 value indicating that the light wasbalanced, as shown in Figure 14-16.Figure 14-16. Centering the telescope's light distribution<strong>Gravity</strong> <strong>Probe</strong> B — <strong>Post</strong> <strong>Flight</strong> Analysis • Final <strong>Report</strong> March 2007 415
14.1.6.3 The Telescope Dither PatternA telescope scale factor translated the values on this normalized scale into a positive or negative angulardisplacement from the center or 0 point, measured in milliarcseconds (1/3,600,000 or 0.0000003 degrees).Likewise, a gyro scale factor translated converted digital voltage signals representing the X-axis and Y-axisorientations of the four science gyros into angular displacements, also measured in milliarcseconds. We thenhad both the telescope and gyro scale factors defined in comparable units of angular displacement. Thetelescope dither motion was then used to correlate these two sets of X-axis and Y-axis scale factors with eachother.The telescope dither caused the telescope (and the entire spacecraft) to oscillate back and forth in both the X andY directions around the center of the guide star by a known amount.Figure 14-17. The telescope dither pattern around Guide Star, IM PegasiBecause this motion moved the entire spacecraft, including the gyro housings that contain the SQUID pickuploops, the SQUIDs detected this oscillation as a spirograph-like (multi-pointed star) pattern that defined a smallcircle around the center of the guide star. This known dither pattern enabled us to directly correlate the gyrospin axis orientation with the telescope orientation. The result was a pair of X-axis and Y-axis scale factors thatwere calculated for the guide-star-valid period of each orbit. At the end of the data collection period on August15, 2005, we had stored approximately 7,000 sets of these scale factors, representing the motion of the gyro spinaxes for the entire experiment.At the beginning of May 2005, we turned off the dither motion for a day to determine what effect, if any, thedither itself was contributing to our telescope pointing noise and accuracy. The results of this test indicated thatthe navigational rate gyros, which were used to maintain the attitude of the spacecraft and telescope duringguide-star-invalid periods (when the spacecraft was behind the Earth), were the dominant source of noise in theATC system, whereas the science gyro signals were stronger than the noise in the SQUID Readout Electronics(SRE) system.14.1.7 Extracting the Gyro Signals from the NoiseConceptually the <strong>GP</strong>-B experimental procedure is simple: At the beginning of the experiment, we initiallypointed the science telescope on-board the spacecraft at the guide star, IM Pegasi, and we electrically nudged thespin axes of the four gyroscopes into the same alignment. Then, over the course of a just under a year, as the416 March 2007 Chapter 14 — Data Collection, Processing & Analysis
spacecraft orbited the Earth some 5,000 times while the Earth made one complete orbit around the Sun, the fourgyros spun undisturbed—their spin axes influenced only by the relativistic warping and twisting of spacetime.We kept the telescope pointed at the guide star, and each orbit, we recorded the cumulative size and direction ofthe angle between the gyroscopes' spin axes and the telescope. According to the predictions of Einstein's generaltheory of relativity, over the course of a year, an angle of 6,606 milliarcseconds should have opened up in theplane of the spacecraft's orbit, due to the warping of spacetime by the Earth, and a smaller angle of 39milliarcseconds should have opened up in the direction of Earth's rotation due to the Earth dragging its localspacetime around as it rotates. In reality, what went on behind the scenes in order to obtain these gyro driftangles was a very complex process of data reduction and analysis that is taking the <strong>GP</strong>-B science team more thana year to bring to completion.14.1.7.1 <strong>GP</strong>-B Data LevelsThroughout the science phase of the <strong>GP</strong>-B mission, we continuously collected data during all scheduledtelemetry passes with ground stations and communications satellites, and these telemetered data were stored—in their raw, unaltered form—in a database here at the <strong>GP</strong>-B Mission Operations Center. This raw data is called“Level 0” data. The <strong>GP</strong>-B spacecraft is capable of tracking some 10,000 individual values, but we only capturedabout 1/5 of that data. The Level 0 data include a myriad of status information on all spacecraft systems inaddition to the science data, all packed together for efficient telemetry transmission. So, our first data reductiontask was to extract all of the individual data components from the Level 0 data and store them in the databasewith mnemonic identifier tags. These tagged data elements were called “Level 1” data. We then ran a number ofalgorithmic processes on the Level I data to extract ~500 data elements to be used for science data analysis, andthis was called “Level 2 data.” While Level 2 data include information collected during each entire orbit, ourscience team generally only uses information collected during the Guide Star Valid (GSV) portion of each orbitwhen the telescope was locked onto the guide star. We do not use any gyroscope or telescope data collectedduring the Guide Star Invalid (GSI) portion of each orbit—when the spacecraft is behind the Earth, eclipsedfrom a direct view of the guide star—for science data analysis.14.1.7.2 Gaps in the DataAnalyzing the data collected in the <strong>GP</strong>-B experiment is similar to fitting a curve to a set of data points—themore data points collected, the more accurate the curve. If there were no noise or error in our gyro readouts,and if we had known the exact calibrations of these readouts at the beginning of the experiment, then we wouldneed only two data points—a starting point and an ending point. However, there is noise in the gyro readouts,so the exact readout calibrations had to be determined as part of the data collection and analysis process. Thus,collecting all of the data points in between enables us to determine these unknown variables. In other words, theshape of the data curve itself is just as important as the positions of the starting and ending points.All measurements we collected were time-stamped to an accuracy 0.1 milliseconds. This enables our scienceteam to correlate the data collected from all four gyros. If one gyro's data are not available for a particular timeperiod, such as the first three weeks of the science phase when gyro #4 was still undergoing spin axis alignment,that gyro is simply not included in the analysis for that particular time period. In cases where all science data arelost for an orbit or two, the effect of these small data gaps on the overall experiment is very small. Examples ofsuch data gaps include the March 4, 2005 automatic switch-over from the A-side (main) on-board computer tothe B-side (backup) computer, and a few telemetry ground station problems over the course of the mission.14.1.7.3 Sources of NoiseAnother important point is that the electronic systems on-board the spacecraft do not read out angles. Rather,they read out voltages, and by the time these voltages are telemetered to Earth and received in the sciencedatabase here in the <strong>Stanford</strong> <strong>GP</strong>-B Mission Operations Center, they have undergone many conversions and<strong>Gravity</strong> <strong>Probe</strong> B — <strong>Post</strong> <strong>Flight</strong> Analysis • Final <strong>Report</strong> March 2007 417
amplifications. Thus, in addition to the desired signals, the <strong>GP</strong>-B science data include a certain amount ofrandom noise, as well as various sources of interference. The random noise averages out over time and will notbe an issue. Some of what appears to be regular, periodic interference in the data is actually importantcalibrating signals that enable us to determine the size of the scale factors that accompany the science data. InSection 14.1.5, “Aberration of Starlight—Nature’s Calibrating Signal” above, we described how the orbital andannual aberration of the starlight from IM Pegasi is used as a means of calibrating the gyro readout signals.Likewise, in Section 14.1.6, “Telescope Dither—Correlating the Gyro & Telescope Scale Factors” above, wedescribed how the telescope dither motion is used to calibrate the telescope signals. In addition, over the courseof the mission we have discovered a few unexpected sources of interference that must be appropriately modeledand removed from the data. The error analysis is well in hand, but careful and painstaking cross checks arerequired by our science team to ensure the validity of the final experimental results.14.1.7.4 Proper Motion of IM Pegasi—The Final Data ElementFinally, there is one more very important factor that must be addressed in calculating the final results of the<strong>GP</strong>-B experiment. We selected IM Pegasi, a star in our galaxy, as the guide star because it is both a radio sourceand it is visually bright enough to be tracked by the science telescope on-board the spacecraft. Like all stars inour galaxy, the position of IM Pegasi, as viewed from Earth and our science telescope changed over the course ofthe experimental year. Thus, the <strong>GP</strong>-B science telescope was tracking a moving star, but the gyros wereunaffected by the star's so-called “proper motion;” their pointing reference was IM Pegasi's position at thebeginning of the experiment. Thus, for each orbit, we must subtract out the telescope's angle of displacementfrom its original guide star orientation so that the angular displacements of the gyros can be related to thetelescope's initial pointing direction, rather than its actual pointing direction each orbit. The annual motion ofIM Pegasi with respect to a distant quasar has been measured with extreme precision over a number of yearsusing a technique called Very Long Baseline Interferometry (VLBI) by a team at the Harvard-SmithsonianCenter for Astrophysics (CfA) led by Irwin Shapiro, in collaboration with astrophysicist Norbert Bartel andothers from York University in Canada and French astronomer Jean-Francois Lestrade. However, to ensure theintegrity of the <strong>GP</strong>-B experiment, we added a “blind” component to the data analysis by requesting that the CfAwithhold the proper motion data that will enable us to pinpoint the orbit-by-orbit position of IM Pegasi untilthe rest of our data analysis is complete. Therefore, the actual drift angles of the <strong>GP</strong>-B gyros will not be knownuntil the end of the data analysis process.14.2 The <strong>GP</strong>-B Science Data Analysis ProcessIn this section we first provide a brief overview of what is involved in analyzing the <strong>GP</strong>-B science data. Dataanalysis actually began before launch. The science data analysis team built prototype computer codes to processsimulated science data in preparation for the actual data from the spacecraft. Following on-orbit checkout, theteam used real data to test and refine these routines and to take into account the anomalies the mission hasencountered (i.e. the time varying polhode period) that were not part of the initial simulations. These activitiesall preceded the formal data analysis effort.14.2.1 Formal Data Analysis PhasesFollowing acquisition and archiving of the science data from the satellite, the formal analysis of these data isbroken into three phases; each subsequent phase builds upon the prior toward the final science results.418 March 2007 Chapter 14 — Data Collection, Processing & Analysis
14.2.1.1 Phase 1: Short-term (day-by-day) analysisInitially, the data are analyzed primarily over a short time period, typically a few orbits or a day, with the goal tounderstand the limitations of data analysis routines and to improve them where necessary. The major activitiesof this phase include:• Final instrument calibrations are completed, based on the IOC, the Science Mission, and the <strong>Post</strong>-Science Calibration tests run on the vehicle.• Refinements are made to the subsystem performance estimates (i.e. GSS, ATC, TRE, SRE subsystems).The performance of these systems sets lower bounds on the quality of the results we expect to obtainfrom the experiment.• Through the data analysis, known features are removed—for example, aberration and pointing errorswere removed from the science signals.• A data grading scheme is implemented to flag and optionally ignore patches of the data set that are not ofscience quality due to spacecraft anomalies or off-nominal configuration of the instrument.The overall goals of this phase are to improve the quality of the science data analysis package, calibrate outinstrumentation effects, and produce an initial “orientation of the day” estimate based on the tuned-up dataanalysis package. It does not attempt at this stage to remove systematic errors that span many days or months.In addition, this analysis focuses on each gyros’ performance individually and does not attempt to combine thefour measurements, and it does not attempt to estimate the gyroscope precession (due to either relativistic orclassical effects)14.2.1.2 Phase 2: Medium-term (Month-to-month) analysisIn this second phase, the analysis team’s attention turns to understanding and compensating for long-termsystematic effects that span many days or months, such as those that arise from the time-varying gyro polhodeperiod or drifts in the calibrations of the on-board instrumentation.• Identify, model, and remove systematic errors and improve instrument calibrations.• Understand causes and implications of spacecraft anomalies. Model and remove effects resulting fromthese anomalies.• Assess the magnitude of residual Newtonian torques on the gyroscopes and compare with pre-launchestimates.The primary products from this phase are a “trend of the month” per gyroscope, which is the initial estimate ofthe measured gyroscope precession over a medium time scale (approximately 1 month) after the compensationof identified systematic error sources. This phase will also produce a refined “orientation of the day” pergyroscope. Here, too, the focus is on individual gyroscope performance.14.2.1.3 Phase 3: 1 Year perspectiveIn the final phase, the data from all four gyroscopes are combined with the guide star proper motionmeasurements, provided by our partners at the Smithsonian Astrophysical Observatory (SAO), to generate anoverall estimate of the gyroscope precession rates over the mission. These estimates form the basis of theprimary science result: the precession of the gyroscopes due to the effects of general relativity. This process willnaturally produce a third, improved, “orientation of the day” for each of the gyroscopes.<strong>Gravity</strong> <strong>Probe</strong> B — <strong>Post</strong> <strong>Flight</strong> Analysis • Final <strong>Report</strong> March 2007 419
14.2.2 Independent Data Analysis TeamsThe <strong>Stanford</strong> team has formed two independent, internal teams to attack the data analysis task. This was doneprimarily for internal quality control: two teams, processing the exact same data, should produce very similarresults. The results are compared formally on a regular basis where discrepancies are noted and investigated.These comparisons will unearth subtle software coding errors, which may go undetected if only a single analysispackage is used. Each team, while working under the constraint of using the same source data, has considerablelatitude in what methods of analysis to apply during each of the data analysis phases. This has the beneficialeffect of better understanding the nature of the source data and what signal processing techniques are mosteffective in estimating the performance of the four science gyroscopes.To provide a benchmark for both of the teams, sets of “truth model data” are constructed and are run on the twodata analysis packages. In these truth model cases, the signal structure, instrument calibrations, and noises areprecisely known and can be analyzed in a relatively straightforward way without sophisticated signal processingtools. Both data analysis packages should return identical results when run on such truth data; if they do not,this test reveals a fundamental difference in the algorithms that may be rectified quickly. Once the algorithmsagree on “truth”, they will be re-benchmarked regularly to ensure that evolutionary changes in the codes do notcompromise their ability to correctly analyze straightforward data sets.14.2.3 Data GradingThe <strong>Gravity</strong> <strong>Probe</strong> B science data consists of approximately 5300 guide star valid intervals during which theinstrument is able to measure the orientation of each of the four gyroscopes with respect to the line of sight tothe guide star. Due to vehicle anomalies or environmental effects, not all of these intervals contain valid sciencemeasurement data. If these data are used in the analysis algorithms, significant errors in the overall results maybe introduced.Consequently, a data grading scheme is used to separate the compromised data from the clean science data. Thegrading system does not remove data from the set, but simply flags segments of the data that do not meet anestablished grading criteria. Roughly 20 criteria have been set to flag sub-standard data on a gyro-by-gyro basis.The criteria chosen are primarily a function of vehicle state, such as “guide star out of view,” “vehicle in eclipse”,“loss of drag-free control,” “SQUID unlocked;” these all directly affect the validity of the data being sent fromthe spin axis readout system.During data analysis runs, the analyst selects the grading criteria that will apply during the run. Then, databaseextraction tools will then return the data that meet the grading criteria. Immediately, the same algorithm can berun with different grading criteria to assess the sensitivity of the result to various types of low quality data.420 March 2007 Chapter 14 — Data Collection, Processing & Analysis
14.2.4 Data Analysis “Standard Model”The data analysis effort revolves around a “standard model” for how the vehicle operates and how vehicleconfiguration affects the performance of the gyroscopes. This model evolves as the team’s knowledge of theoperation and performance of the vehicle increases during the analysis efforts. In addition to the 1) IndependentAnalysis teams, 2) the Truth Modeling Efforts, and 3) the Data Grading system, the data analysis team focusesits efforts on six primary areas of vehicle performance (Figure 14-8):1. Precession dynamics and torques: Understand the overall drift of the gyroscope and how it relates torelativistic effects and classical (Newtonian) effects.2. Orbital and Annual Aberration: Model and compensate for the apparent motion of the guide star due tospace vehicle motion.3. Vehicle Pointing: Assess the pointing of the space vehicle during guide star valid (GSV) and guide starinvalid (GSI) periods using all on-board sensors (ATC, telescope, science gyroscopes). Determinerelative scale factor between telescope readout of pointing and science gyroscope readout of pointing.4. Roll Phase Measurement: Measure and quantify errors in the roll phase of the vehicle over the mission(time history of the clocking of the vehicle with respect to the orbital plane).5. Spin Axis Orientation Measurement: Model and calibrate the SQUID readout system and compensatefor effects of vehicle pointing in the science signal.6. Polhode and Scale Factor Modeling: Model and remove the effects of the time varying polhode period onthe SQUID scale factor. Compensate for systematic errors in gyro orientation measurements due to theslow damping of the gyroscope polhode path.Figure 14-18. Components of the <strong>GP</strong>-B Data Analysis Standard Model (equations shown are significantlysimplified and are of iconic value only)Phase 1 activities focus primarily on improving the accuracy of all the terms that go into the standard model,based on vehicle data, and setting performance limits on the ultimate resolution of the experiment. Phase 2 and3 activities focus on the precession dynamics, effects of anomalies, and polhode models that span weekly or<strong>Gravity</strong> <strong>Probe</strong> B — <strong>Post</strong> <strong>Flight</strong> Analysis • Final <strong>Report</strong> March 2007 421
monthly time scales. Though only shown in a simple outline here, the standard model gives a convenient frameof reference for the whole team in which to discuss results and propose new explanations and models forobserved phenomena.14.2.5 Publication of Overall ResultsBased on the successful results announcement strategies for the COBE and WMAP missions, the <strong>Gravity</strong> <strong>Probe</strong>B project will announce the results of the experiment only after the internal data analysis effort is complete(Phases 1, 2, and 3, above), and after critical and detailed peer review of the results from the gravitationalphysics community. No data or preliminary results will be released prior to this point. This is done to insure theintegrity of the result and maintain credibility within the wider scientific community.Once this work is complete and both the internal and external review teams are satisfied with their reviews, theresults will be presented, along with a coordinated set of papers on the design and operation of the mission, at amajor physics conference.422 March 2007 Chapter 14 — Data Collection, Processing & Analysis
15Preliminary Results<strong>Gravity</strong> <strong>Probe</strong> B — <strong>Post</strong> <strong>Flight</strong> Analysis • Final <strong>Report</strong> March 2007 423
424 March 2007 Chapter 15 — Preliminary Results
This chapter summarizes the preliminary results announcement that the <strong>GP</strong>-B team will be presenting at themeeting of the American Physical Society (APS) in Jacksonville, Florida, on April 14-17, 2007. To learn aboutthe current status of the mission, and to view a summary of the final results once they have been announcedtowards the end of 2007, please visit the <strong>GP</strong>-B Web site at: http://einstein.stanford.edu.15.1 <strong>GP</strong>-B Successfully Collected the Data to TestEinstein’s Predictions About <strong>Gravity</strong>Over four decades of planning, inventing, designing, developing, testing, training and rehearsing paid offhandsomely for <strong>GP</strong>-B. The 17.3-month flight mission succeeded in collecting all the data needed to carry outthis unprecedented, direct experimental test of Einstein's general theory of relativity—his theory of gravity.Figure 15-1. A photo montage of the <strong>GP</strong>-B spacecraft in orbit and a photo of the <strong>GP</strong>-B Mission Operations Centerin action during the spin-up of gyro #4.<strong>GP</strong>-B is arguably the most sophisticated spacecraft ever flown. It incorporated many new technologies—mostnotably the gyros, their suspension systems, the accompanying SQUID readouts, and the precision-pointing ofthe spacecraft-fixed telescope—all of whose debut performances in space occurred during this mission. It isremarkable, and a testament to the preparation, talent, knowledge and skill of the <strong>Stanford</strong>-NASA-LockheedMartin development team, that all of these technologies performed exceedingly well on orbit, with some, such asthe Gyro Suspension System and SQUID readouts, significantly exceeding their required performancespecifications.As Gaylord Green, the <strong>GP</strong>-B Program Manager during launch operations, remarked after the spacecraft was inorbit and all systems were functioning nominally: "...10,000 things went right!15.2 The Effects of Relativity Are Clearly Visible in the RawDataThe <strong>GP</strong>-B satellite was designed as a pristine, space-borne laboratory, whose primary task was to use four ultraprecisegyroscopes to measure directly two effects predicted by general relativity. One is the geodetic effect—theamount by which the mass of the Earth warps the local space-time in which it resides. The second effect, calledframe-dragging, is the amount by which the rotating Earth drags local space-time around with it. Because thespacecraft is in a polar orbit, the two effects occur at right angles to each other, giving a clean separation betweenthem. Furthermore, the gyros are arranged such that each measures both effects.<strong>Gravity</strong> <strong>Probe</strong> B — <strong>Post</strong> <strong>Flight</strong> Analysis • Final <strong>Report</strong> March 2007 425
Figure 15-2. A diagram of the <strong>GP</strong>-B experiment showing the predicted geodetic and frame-dragging effects.According to Einstein’s theory, over the course of a year, the geodetic warping of Earth's local space-time shouldcause the spin axis of each gyroscope to shift from its initial alignment by a minuscule angle of 6.606 arc-seconds(0.0018 degrees) in the plane of the spacecraft’s orbit. Likewise, the twisting of Earth’s local space-time shouldcause the spin axis to shift by an even smaller angle of 0.039 arc-seconds (0.000011 degrees)—about the width ofa human hair viewed from a quarter mile away—in the plane of the Earth’s equator.Figure 15-3. A slide from the <strong>GP</strong>-B plenary talk that Francis Everitt will deliver at the APS meeting on April 14,2007. The plots on the left side of this slide clearly show the predicted geodetic effect in the unprocessed gyrodata to an accuracy level of ~1%. A copy of this talk will be available on the APS page of the <strong>GP</strong>-B Web site:http://einstein.stanford.edu/content/aps_posters#talks.426 March 2007 Chapter 15 — Preliminary Results
The graph in Figure 15-3 above shows that the geodetic effect is clearly visible even in the raw data (prior toprocessing) from the <strong>GP</strong>-B gyroscopes, confirming Einstein's predictions to a precision of better than 1 percent.As Professor Francis Everitt, <strong>GP</strong>-B Principal Investigator, recently remarked: “It’s fascinating to be able to watchthe Einstein warping of spacetime directly in the tilting of these <strong>GP</strong>-B gyroscopes—more than a million timesbetter than the best inertial navigation gyroscopes.”We have also seen indications of the frame-dragging effect, which is 170 times smaller than the geodetic effect.<strong>GP</strong>-B scientists are still in the process of extracting its signature from the spacecraft data.15.3 A First Peek at the ResultsAfter 18 months of rigorous, ground-breaking data analysis, our science is preparing to present a first publicpeek at the results summarized above during the April meeting of the American Physical Society (APS) inJacksonville, Florida. Professor Francis Everitt will kick off the April APS meeting with a plenary talk entitled:<strong>Gravity</strong> <strong>Probe</strong> B Interim <strong>Report</strong> and First Results. In addition, <strong>GP</strong>-B team members are scheduled to give threeinvited talks, two submitted papers, and the team will present 22 poster papers on various aspects of <strong>GP</strong>-B.The preliminary results to be announced at the April APS meeting for the geodetic effect are consistent with theprediction of general relativity to an accuracy of ~1.0 percent. This is on par with the only other measurement ofthis effect that was performed using the Earth-Moon system orbiting the Sun, but seen in a different and muchmore direct way. Moreover, the indications of frame-dragging measured thus far are also highly encouraging.However, for both measurements, the current level of experimental error must be significantly reduced and themeasurements thoroughly cross-checked before being announced as final results.The inherent noise in the <strong>GP</strong>-B SQUID readout system imposes a natural physical limitation on theexperimental accuracy that it is possible to achieve with the <strong>GP</strong>-B instrument. For the geodetic effect, this limitis ~0.01 percent, and for the much smaller frame-dragging effect, the limit is ~1.0 percent. The goal of <strong>GP</strong>-B is toachieve the highest possible experimental accuracy, approaching the physical limitations of the instrumentreadout.The <strong>GP</strong>-B science instrument has sufficient resolution and we have collected ample data to obtain resultsapproaching these limits. However, early in the data analysis, our science team uncovered surprising torque andsensor effects (from polhode motion of the gyros) that must separated and removed from the relativity effects inorder to obtain the desired level of accuracy. Addressing these torque and sensor effects has been our scienceteam's dominant focus in recent months, and this has led to a longer and more sophisticated data analysisprocess than was originally anticipated.On Friday-Saturday, March 23-24, 2007, just prior to the final edit of this report, our <strong>GP</strong>-B science teamreviewed the progress with the independent <strong>GP</strong>-B Science Advisory Committee (SAC) that has been consultingwith us on every aspect of the program for the past decade. Summarizing the committee's findings andrecommendations, SAC Chairman, Professor Clifford Will of Washington University in St. Louis, MO. andauthor of the classic text, Theory & Experiment in Gravitational Physics, reported: “The <strong>GP</strong>-B science team iscontinuing to make good progress on a number of fronts... We strongly support the [<strong>Stanford</strong>] proposal forfunding through December 2007 to complete the data analysis and prepare publication of the final <strong>GP</strong>-B result.”NASA has committed to extending support for <strong>GP</strong>-B at the required level.In the press release we have prepared for the APS meeting, <strong>GP</strong>-B Program Manager, William Bencze,summarized the situation: “Understanding the details of this science data is a bit like an archeological dig: ascientist starts with a bulldozer, follows with a shovel, and then he finally uses dental picks and toothbrushes toclear the dust away from the treasure. We are passing out the toothbrushes now.”<strong>Gravity</strong> <strong>Probe</strong> B — <strong>Post</strong> <strong>Flight</strong> Analysis • Final <strong>Report</strong> March 2007 427
15.4 The Two Surprises and Their Impact On TheExperimentFrancis Everitt is fond of telling the story that in the months leading up to the <strong>GP</strong>-B launch, several people whohad deep experience with other space missions told him that all the things he knew were likely to go wrongwould work perfectly, but other things that couldn't possibly cause any difficulty would keep the team up atnight.These turned out to be prophetic words. Our science team made two significant discoveries about the scienceinstrument that have lengthened the data analysis process:1. Shortly after the gyros were spun up in August 2004, we discovered that the polhode motion of the gyrorotors, which was expected to exhibit a constant pattern throughout the experimental period, waschanging over time, significantly complicating the calibration of the gyroscope readout angles.Figure 15-4. A slide from the <strong>GP</strong>-B plenary talk that Francis Everitt will deliver at the APS meeting on April 14,2007. This slide shows the changing polhode paths of gyros #1 and #4 and summarizes the issues of polhode ratevariations in the gyros.2. During the post-experiment instrument calibration testing in August-September 2005, the spin axes ofthe gyroscopes were found to be affected by certain class of small classical torques, known as“misalignment torques,” whose effects must be rigorously separated from the relativity measurements.428 March 2007 Chapter 15 — Preliminary Results
Figure 15-5. A slide from the <strong>GP</strong>-B plenary talk that Francis Everitt will deliver at the APS meeting on April 14,2007. This slide shows the misalignment torques discovered during a series of instrument calibration testsperformed during the last six weeks of the mission, prior to depletion of helium in the dewar.However, the team was prepared for such an eventuality. In fact, the <strong>GP</strong>-B experiment was carefully designed toenable us to discover such unexpected sources of error. As Francis Everitt notes: “When trying to do anexperiment that goes seven orders of magnitude beyond where anyone has gone before, some extraordinaryplanning is necessary. First, you design the experiment to make all the errors as close to zero as possible. Next,you average everything you can—for example, you roll the spacecraft throughout the experiment. Finally, youpurposely look for things that were not expected.”During one of many NASA program reviews prior to launch, experienced investigators from other NASAmissions asked us what processes we had put in place to discover systematic sources of error that might crop upin the data. Our answer was that we would follow a principle set forth by the 18th century scientist, HenryCavendish—namely, if you are worried that something in an experiment might be a potential source of error,you take the step of deliberately exaggerating the error sources to determine how bad they can get. This processenables you to quantify the magnitude of the problem and determine a way to deal with it. (For a thoroughdiscussion of the “Cavendish” principle, see the 1977 paper by Francis Everitt entitled Gravitation, Relativity andPrecise Experimentation, which is available in Adobe Acrobat PDF format on our <strong>GP</strong>-B Web site athttp://einstein.stanford.edu/content/sci_papers/papers/Everitt_Gravitation-Precise-Expt-1977.pdf.From mid-August through September 2005, after collecting 50 weeks of science data and before the liquidhelium was exhausted from the dewar, we followed Cavendish's principle by performing a barrage of calibrationtests on all parts of our science instrument. These tests, along with other tests that we performed throughout themission, enabled us to confirm that all of the known and expected sources of error—with one exception—were,in fact, negligible as expected. As William Bencze put it: “Without the extensive calibration tests, we would havebeen looking for a needle in a haystack; instead, we only had to look for a needle on the floor.”Specifically, these tests confirmed that six of the seven extrinsic “near zero” design specifications of theexperiment had been met or exceeded, and we were able to eliminate each of these factors as sources of error inthe final results. (For an explanation of <strong>GP</strong>-B’s seven near-zero specifications, see Section 3.1.1, <strong>GP</strong>-B’s Seven<strong>Gravity</strong> <strong>Probe</strong> B — <strong>Post</strong> <strong>Flight</strong> Analysis • Final <strong>Report</strong> March 2007 429
Near Zeroes.) The exception that we could not eliminate as a source of error was the seventh extrinsic designconstraint that the electric dipole moment of the gyro rotors be “near zero.” In other words, the gyro rotorsmust be highly electrically spherical as well as mechanically spherical.The electrical out-of-roundness is due to larger than anticipated electrostatic patches (regions of electricalcharge) on the rotor’s surface. These patches interact with similar ones on the housing’s inner surface to give riseto small “misalignment torques” that occur when the spin axes of the gyros are not aligned with the roll axis ofthe spacecraft. These patches also provide a subtle damping mechanism that extracts small amounts of energyfrom the spinning rotor, and this causes the polhode path to change. The potential existence of these patches wasknown prior to launch, but was believed to be negligible, based on careful physical analysis and laboratorymeasurements.Nature is full of surprises, and it is common for physics experiments, particularly a ground-breaking experimentsuch as <strong>GP</strong>-B, to uncover unexpected phenomena. Because we anticipated this situation and were activelylooking for surprises in the data, we were prepared to deal with them. Consequently, the team has been able tomodel precisely the polhode motion of all four gyroscopes, as well as the classical torques imparted by patcheffects on the rotors and housings. This painstaking work, which is still in progress, has lengthened the dataanalysis phase of the mission by more than a year—such is the nature of scientific inquiry. Ultimately, the timespent isolating and removing these confounding effects from the final results will reduce the current margin ofexperimental error to the desired level.Our goal in <strong>GP</strong>-B has always been to perform the best possible experiment and to use great care and redundancyto ensure the validity of the results. Every experiment has its share of unknowns or challenges that no one couldhave anticipated. But once such challenges surface, it is incumbent on the investigators to spend time addressingthem and accounting for them in the process of determining the final outcome.15.4.1 Time-Varying Motion in the Gyro RotorsThe gyroscope’s polhode motion is akin to the common “wobble” seen on a poorly thrown (American) football,though it shows up in a much different form for the ultra-spherical <strong>GP</strong>-B gyroscopes. While it was expected thatthis wobble would exhibit a constant pattern over the mission, it was found to slowly change due to minuteenergy dissipation in the spinning gyro rotors, caused by interactions of electrostatic patches on the rotor'ssurfaces and patches on the metallic surfaces inside the housings. For example, Figure 15-6 below shows“snapshots” of the changing polhode path of gyro #1 at various times during the mission.Figure 15-6. Plots from different viewing angles showing the changing polhode path of gyor #1 over the life ofthe experiment.The polhode wobble complicates the measurement of the relativity effects by putting a time-varying wobblesignal into the data.430 March 2007 Chapter 15 — Preliminary Results
Figure 15-7. A poster on gyro polhode motion to be presented at the APS meeting in April 2007.You can view/download a larger and more readable PDF version of this posteron our <strong>GP</strong>-B APS Web page: http://einstein.stanford.edu/content/aps_posters#posters.For a complete discussion of polhode motion, see the <strong>GP</strong>-B Mission News story entitled: Polhode Motion in the<strong>GP</strong>-B Gyroscopes in the 20 November 2006 <strong>GP</strong>-B update on our Web site at:http://einstein.stanford.edu/highlights/hl_polhode_story.html.15.4.2 The Effects of Time-Varying Polhode Motion on the ExperimentAs noted in Section 15.5, Next Steps—Moving Towards a Final Result below, both the SQUID-based magneticmeasurement (London moment) of the gyro spin axes and the telescope measurement of the spacecraft pointingdirection with respect to the guide star produce electrical signals that represent angular measurements. Becausethese two systems are independent of each other, it is necessary to cross-calibrate these instruments to ensurethat both systems are measuring the same relative angle when the orientation of the spacecraft changes.<strong>Gravity</strong> <strong>Probe</strong> B — <strong>Post</strong> <strong>Flight</strong> Analysis • Final <strong>Report</strong> March 2007 431
Figure 15-8. A slide from the <strong>GP</strong>-B plenary talk that Francis Everitt will deliver at the APS meeting on April 14,2007. This slide shows how dither and aberration of starlight are used as calibrating signals in determining thegyro-telescope scale factor, C g .Fortunately, the <strong>GP</strong>-B experimental data includes natural calibrating signals in the form of the aberration ofstarlight—both orbital and annual. (For a discussion of how the aberration of starlight is used as calibratingsignal in the <strong>GP</strong>-B data, see Section 14.1.5, Aberration of Starlight—Nature’s Calibrating Signal.) Our goal is toperform this calibration to a precision of 1 part in 100,000 (0.001 percent), but our measurements are limited bythe noise in our SQUID readout system. If there were no variation in the polhode period of the gyros, we couldsimply string together the data taken during the Guide Star Valid (GSV) portion of each orbit (when thespacecraft has a direct line of sight to the Guide Star) from a sequence of orbits until we have reached the desired0.001 percent precision. (We must string together data from ~15 orbits to reach this level of precision.) However,the polhode periods for the gyros did vary over the data collection period, and this makes it much more difficultto connect the data from successive orbits.432 March 2007 Chapter 15 — Preliminary Results
The complication is due to the presence of a residual magnetic flux that becomes trapped on the gyro rotorswhen they are cooled to superconductive temperatures. Whereas a constant polhode period can easily beremoved, a varying polhode period must be precisely modeled for each orbit before it can be removed. Considerthree cases:1. London moment with varying polhode rates and no trapped magnetic flux—In this case, there is noproblem; the data from successive orbits can easily be strung together to yield the desired precision sincethe London Moment is independent of rotor polhode dynamics to the levels we hope to measure.2. London moment with 1% trapped magnetic flux, but constant polhode period (no variation)—Again, inthis case there is no problem; the data from successive orbits can still be strung together because theconstant polhode period clearly stands out from other signals as the data analysis proceeds. Thus, it canbe precisely separated and removed.3. London moment with both trapped magnetic flux and time-varying polhode rates—This situation,which we have determined is the case for the <strong>GP</strong>-B gyros, requires very precise modeling of the polhodemotion for each gyro. Initial modeling that was based on information from the primary science readoutgave reasonable results, but it lacked a detailed dynamic model of the polhode motion. Now, some <strong>GP</strong>-Bgraduate students are working on a method that uses high-rate SQUID data “snapshots” to map out thetrapped flux patterns on each gyro. Using this map, together with a rotor dynamic model, we can moreaccurately predict the effect of rotor trapped flux on the gyro readout calibrations. Moreover, withaccurate trapped flux maps, we can string together relativity data from successive orbits to achieve thedesired experimental precision. Once we have the trapped flux modeling, the fitting process becomesmuch easier.15.4.3 Classical Misalignment Torques on the GyrosAfter months of research and analysis, our <strong>GP</strong>-B science team has determined that electrostatic patches are alsothe cause of the small torques we have observed on the gyroscopes when the spacecraft's axis of symmetry is notaligned with the gyroscope spin axes. Torques cause the spin axis of a gyroscope to change orientation, and incertain circumstances, this effect can look like the relativity signal <strong>GP</strong>-B measures.Fortunately, the change in gyro spin axis orientation due to these torques has a precise geometrical relationshipto the misalignment of the gyro spin/vehicle symmetry axis, and thus effects of these so-called misalignmenttorques can be removed from the data without directly affecting the relativity measurement.Important data that has enabled us to understand and model these torques was collected during a series ofplanned instrument calibration tests that we conducted during the final six weeks of the flight mission, frommid-August through the end of September 2005, when the helium in the dewar was finally exhausted. Duringthese calibration tests, we purposely slewed the spacecraft and telescope from the guide star, IM Pegasi, toobserve other stars nearby for 12 to 24 hours, and then returned to IM Pegasi. These exaggerated mis-pointingmaneuvers produced measurable torques on the gyros. From the results of these tests, the team has been able todetermine the nature and limits of these torques and has devised methods for modeling and removing themduring the data analysis phase. To learn more about these instrument calibration tests, see Section C.5,Instrument Calibration Phase: 8/19/05 – 9/30/05.<strong>Gravity</strong> <strong>Probe</strong> B — <strong>Post</strong> <strong>Flight</strong> Analysis • Final <strong>Report</strong> March 2007 433
Figure 15-9. A poster on the effects of classical torques on the gyros to be presented at the APS meeting in April2007. You can view/download a larger and more readable PDF version of this posteron our <strong>GP</strong>-B APS Web page: http://einstein.stanford.edu/content/aps_posters#posters.Our weekly mission status updates from 19 August 2005 through 30 September 2005 provide a detailedchronicle of the final calibration tests that we performed until the liquid helium in the dewar was finallyexhausted. In particular, the Mission News Story dated 26 August 2005 discusses the method and purpose ofpost-science calibration tests.15.4.4 Patch Effects—The Underlying Cause of Both EffectsPerhaps the greatest and most important challenge embraced by <strong>GP</strong>-B team during the data analysis period hasbeen to determine the underlying causes of both the unexpectedly changing polhode paths in the <strong>GP</strong>-B gyrosand the misalignment torques. Data collected during the mission clearly shows that the polhode periods of allfour gyros did not remain constant, but rather they damped out in all four gyros. In addition, the data also showsthat the characteristic spin-down times of the gyros (the time it takes them to spin down to about 37% of theirinitial speed) varied from gyro to gyro, ranging from between 7,000 and 26,000 years. This result is far betterthan the experimental specification of 2,000 years, but it was less than initial expectations (on the order of 50,000years). More importantly, the wide variation in spin-down rates suggests that some mechanism inherent to eachindividual gyro might best account for the changing polhode paths and the misalignment torques on the gyros.But what kind of mechanism could this be?434 March 2007 Chapter 15 — Preliminary Results
Figure 15-10. A poster on the evidence for patch effects to be presented at the APS meeting in April 2007.You can view/download a larger and more readable PDF version of this poster on our <strong>GP</strong>-B APS Web page:http://einstein.stanford.edu/content/aps_posters#posters.Given the almost perfectly spherical and homogeneous nature of the <strong>GP</strong>-B gyro rotors, there are twopossibilities:1. Internal energy dissipation in the gyro rotors2. External torques with just the right frequencyEarly in the data analysis phase, we thought that some kind of internal energy dissipation was the cause.However, adding the variation in spin-down rates to the analysis, we currently believe that both mechanismslisted above are involved and that the underlying cause is “patch effect charges” on the gyro rotors and on theinside surfaces of their housings. Patch charges arise from varying surface electrical potentials in polycrystallinematerials from regions of changing crystal orientations over the surface of the metal, or due to non-uniformdistribution of constituent elements in a metal alloy, or can arise due to the presence of contaminants on themetal surface.The sputtered niobium coatings on <strong>GP</strong>-B gyro rotors are naturally polycrystalline and thus inherently exhibitpatch charge effects. These charges impart some potential on the six electrodes that suspend each gyro in itshousing which causes a minute dissipation of energy as the rotor spins. This produces a small torque on the rotoras the energy is dissipated into the gyro housing, causing the spin rate of the gyro to slow down slightly, and alsocausing the polhode motion to be damped out over the mission.We were well aware of the possible ramifications of electrostatic patches on the gyro rotors prior to launch, andwe made a thorough investigation of them. In fact, a <strong>GP</strong>-B post-doctoral student carefully studied the effects ofelectrostatic patches on the gyro rotors and concluded that if the niobium coatings produced just two large<strong>Gravity</strong> <strong>Probe</strong> B — <strong>Post</strong> <strong>Flight</strong> Analysis • Final <strong>Report</strong> March 2007 435
electrostatic patches, located at opposite poles of the rotors, this would create a significant, classical torqueproblem in our gyros. To address this issue and determine the sizes of the patches, we performed two types oftests:1. a visual inspection,2. a laboratory measurement of the size and magnitude of the patches.The visual testing measured the grain size of the sputtered niobium coating, and found that the patches on the<strong>GP</strong>-B gyros were very small (less than 1 micrometer in size) and were scattered about the entire surface of eachrotor. With such small patches randomly distributed, it was our expectation that the patch effects would averageout and not be of any consequence to the experiment.To ensure this was the case, we performed a laboratory test. We sent flat samples of niobium-coated surfaces(produced in our same <strong>Stanford</strong> lab were the gyro rotors were coated) to a lab in France where they scanned thesamples with a Kelvin probe and showed that there was no problem with patches in the flat samples. (The lab inFrance could not handle spherical objects in their scanner, so we created flat samples using our same gyrocoating machinery.)Figure 15-11. A slide from the <strong>GP</strong>-B plenary talk that Francis Everitt will deliver at the APS meeting on April 14,2007. This slide shows the succession of investigative steps and observations that led to the determination thatpatch effects are the root cause of both the polhode variation and misalignment torques on the gyros.Thus, once the spacecraft was in orbit and we began observing the changing polhode periods of the gyros andthe misalignment torques, we did not initially suspect that patch effects might be the underlying cause. However,having eliminated other causes through all of the tests and calibrations performed during the mission, we havedetermined that patch effects are, indeed, the underlying cause of our two surprises. Furthermore, throughrecent gyro coating tests performed in our labs here at <strong>Stanford</strong>, we now know that we overlooked a critical issuein our method of coating the gyro rotors.436 March 2007 Chapter 15 — Preliminary Results
The niobium coatings on the rotors were sputtered on in a series of 64 stages, turning the rotor to a new positionfor each new coating. This process created a very uniform niobium coating on each rotor. However, it turns outthat the final, 64th layer effectively created two large patches on the rotors, defined by its edge. In other words,the edge of the final coating essentially divides the rotor into two halves, each of which is, in fact, a largeelectrostatic patch at opposite poles of the rotor—the very situation that we had tested for pre-launch and haddetermined was “not going to be an issue.”Knowing that this unprecedented experiment would likely uncover some surprises, we purposely collectedcopious spacecraft and instrument status data in addition to the scientific data and we thoroughly tested andcalibrated the science instrument throughout the flight mission. This meticulous planning has paid off in manyways. For example, it has enabled our science team to develop a methodology for precisely modeling the polhodemotion and trapped magnetic flux on each gyro. Most important, in the final months of the data analysis, ourscientists will be able to use this modeled data to separate and remove the misalignment torques caused by thesepatch effects, thereby significantly improving the accuracy of the final results.15.5 Next Steps—Moving Towards a Final ResultOur <strong>GP</strong>-B data analysis team comprises 34 people, including Principal Investigator, Francis Everitt. ProgramManager, William Bencze, manages the team, and Chief Scientist, Mac Keiser, is ultimately responsible for thedata analysis and results. The remainder of the team includes 22 scientists (physicists, mathematicians,engineers, and computer scientists), plus 9 physics and engineering graduate students. The entire data analysisteam, except for Francis Everitt, is pictured in Figure 15-12 below.Figure 15-12. A slide from the <strong>GP</strong>-B plenary talk that Francis Everitt will deliver at the APS meeting on April 14,2007. This slide shows the <strong>GP</strong>-B data analysis team, except for Principal Investigator, Francis Everitt.A copy of this talk will be available on our APS Web site: http://einstein.stanford.edu/content/aps_posters#talks.<strong>Gravity</strong> <strong>Probe</strong> B — <strong>Post</strong> <strong>Flight</strong> Analysis • Final <strong>Report</strong> March 2007 437
Last summer (2006), Mac Keiser devised a model-based, geometric method for separating the disturbance(misalignment) torques from the relativity signals. Over the past year, the team has been pursuing a combinationof this geometric method and a model-based, algebraic estimation method formulated by mathematicianMichael Heifetz. Recently, physicist Alex Silbergleit, following a line of inquiry first suggested by physicist JeffKolodziejczak (a collaborator from NASA's Marshall Space <strong>Flight</strong> Center), has found a way to combine theadvantages of both the geometric and algebraic methods into a unified, integral data analysis approach. Thisintegral approach eliminates the drawbacks of both previous methods, allows for iterative improvement of theresults, and relies less on modeling than either of the previous methods. Thus, we will be continuing to employthis integral approach through the end of the analysis.Specifically, our science team is focusing on two main issues:1. Fine calibration of the gyroscope/telescope scale factorBoth the SQUID-based magnetic measurement of the gyro spin axes and the telescope measurement ofthe spacecraft pointing direction with respect to the guide star produce electrical signals that representangular measurements. Because these two systems are independent of each other, it is necessary to crosscalibratethese instruments to ensure that both systems are measuring the same relative angle when theorientation of the spacecraft changes.Because of trapped magnetic flux on the gyro rotors, the calibration—conversion from electrical signalsto angles—of the gyro readout can vary in a complex, but computable way. Specifically, it is affected bythe polhode period of the gyros, which was found to change during the flight mission, rather thanremaining constant as originally expected.Figure 15-13. Map of the estimated magnetic flux trapped on the surface of the gyro rotors. Two methods arecurrently being employed—one mapping individual fluxons and the other mapping magnetic field strength.To address these issues and determine the correct scale factor, the team is in the process of preciselymodeling the time-varying polhode periods of each gyro for each orbit as well as creating precisemappings of the trapped magnetic flux on the surface of each gyro rotor.2. Refining the analysis of the misalignment torquesThe team is in the process of refining the data analysis techniques being used to separate and removethese classical misalignment torques from the relativity effects. To do this, it is necessary to take intoaccount many variables, including vehicle motion and polhode paths of the gyros.438 March 2007 Chapter 15 — Preliminary Results
The refinement of the misalignment torques and the mapping of the trapped magnetic flux on the gyrorotors interact such that if one is incorrect, the other becomes harder. There is also a symbioticrelationship between these two activities so that as one improves, it facilitates calculating the other.In addition to these two activities, the <strong>GP</strong>-B guide star (IM Pegasi) proper motion data is being held by IrwinShapiro and his group at the Harvard Smithsonian Center for Astrophysics (CfA). Upon completion of the dataanalysis endeavor here at <strong>Stanford</strong>, this extremely precise VLBI measurement data will be substituted for thecurrent placeholder values for the proper motion of IM Pegasi, taken from the 1997 Hipparcos [star] Catalogue,in order to obtain the greatest possible accuracy in the final <strong>GP</strong>-B result.Figure 15-14. A slide from a talk that Irwin Shapiro will deliver at the APS meeting on April 14, 2007, entitled:Proper Motion of the <strong>GP</strong>-B guide star.Irwin Shapiro is scheduled to give a talk about the <strong>GP</strong>-B Guide Star astrometry at the April APS meeting. Inaddition, two poster papers on the <strong>GP</strong>-B Guide Star Astrometry Project at the CfA. An audio recording of histalk, along with a PDF copy of his slides, as well as copies of both CfA astrometry poster papers will be availableon the APS Meeting page of our <strong>GP</strong>-B Web site shortly after the conference:http://einstein.stanford.edu/content/aps_posters#talk.s15.6 <strong>GP</strong>-B Data Archive to be Available Through theNSSDCDuring the past few weeks, while our science team continues to analyze the data, our <strong>GP</strong>-B data processing teamhas also been quite busy, compiling an archive of the <strong>GP</strong>-B raw data—both science data and spacecraft/payloadstatus data, as well as an archive of associated documents, drawings, photos and other information about the <strong>GP</strong>-B mission. We are preparing to begin the process of transferring this entire archive to the National Space ScienceData Center (NSSDC), located at the NASA Goddard Space <strong>Flight</strong> Center in Greenbelt, Maryland. Transfer ofthis archive is expected to be completed in late June, and the <strong>GP</strong>-B archive will then become publicly availablesometime thereafter.<strong>Gravity</strong> <strong>Probe</strong> B — <strong>Post</strong> <strong>Flight</strong> Analysis • Final <strong>Report</strong> March 2007 439
440 March 2007 Chapter 15 — Preliminary Results
16Lessons Learned and Best Practices<strong>Gravity</strong> <strong>Probe</strong> B — <strong>Post</strong> <strong>Flight</strong> Analysis • Final <strong>Report</strong> March 2007 441
442 March 2007 Chapter 16 — Lessons Learned and Best Practices
This chapter summarizes some valuable lessons that were learned during the <strong>GP</strong>-B mission, selected bestpractices employed during this time that helped to make mission operations effective and efficient, and finally,some lessons about the <strong>GP</strong>-B Management Experiment, summarized from <strong>Gravity</strong> <strong>Probe</strong> B: A Management Study, anindependent report presented to NASA by Edward S. Calder and Bradley T. Jones in April 2006.16.1 Lessons Learned<strong>Gravity</strong> <strong>Probe</strong> B logged 23 anomalies of various levels of severity and 170 observations during the 17-monthflight mission. Most of these are specific to the <strong>Gravity</strong> <strong>Probe</strong> B vehicle and mission, and thus do not havesignificant applicability outside of the project. However, the following lessons have been identified that havebroad applicability across other spaceflight projects. Included in this list are also significant lessons learned fromthe vehicle development and testing period preceding launch that also may be beneficial to other spaceflightprograms.Throughout the development and operation of the satellite, <strong>Gravity</strong> <strong>Probe</strong> B has also attempted to adopt “bestpractices” from lessons learned from other programs as well as the combined wisdom and experience of theteam at <strong>Stanford</strong>, Lockheed-Martin, and NASA Marshall. We would like to affirm a number of practices asespecially effective and worthy of continued adoption by the community.16.1.1 Pre-launch lessons learnedThe following subsections summarize lessons learned prior to launch of the <strong>GP</strong>-B spacecraft on April 20, 2004.16.1.1.1 Power system monitoringIssue Summary: Extensive, detailed power system monitoring is beneficial.Description of the <strong>GP</strong>-B experience:Both during pre-launch testing and on orbit, it has been useful to carefully monitor the performance of thepower system throughout the space vehicle. Many of the spacecraft and payload subsystems provide some levelof power system monitoring, however, in some important instances, no explicit pre and post regulation powermonitoring was provided. The engineering team, thus, had to rely on some of ancillary monitors to infer theperformance of some box power systems.Lesson:• Include voltage and current monitoring for the primary and secondary sides of all power conversionsystems as a standard design requirement for all custom designed power supplies.16.1.1.2 Early engineer involvementIssue Summary: Involve subsystem engineers early in display page development.Description of the <strong>GP</strong>-B experience:Formatting and design of operations console display pages (numeric data displays and graphs) were many timesput together without RE input. There wasn’t enough time spent to ensure presentation of data was sufficient.Lessons:1. Involve the users early enough to allow them to have input into the monitors that they will need to use.Many displays pages have monitors that were useful for testing, but not for operations.2. The display page should allow the user to easily modify the display.<strong>Gravity</strong> <strong>Probe</strong> B — <strong>Post</strong> <strong>Flight</strong> Analysis • Final <strong>Report</strong> March 2007 443
16.1.1.3 <strong>Flight</strong> science downlink databaseIssue Summary: Use flight science downlink database for system functional testing.Description of the <strong>GP</strong>-B experience:During system and vehicle functional testing prior to launch, a custom engineering data analysis package wasused to evaluate system performance. This package was incompatible with the flight data system and was onlyavailable at Lockheed-Martin, the system integrator. A separate database was to be used to manage data fromthe vehicle once on orbit.A lack of load-testing of this science database, especially using the science data reduction applications, longaccess times. Lack of system administrator resources slowed the development and deployment of hardware andsoftware solutions to the data bottlenecks.Lessons:1. Dedicate personnel resources to develop flight database infrastructure early in the program.2. Performance test database with high user loads to identify and rectify bottlenecks prior to launch.3. Establish one master database for both vehicle test and operations.16.1.1.4 Early integrated vehicle testingIssue Summary: Perform early integrated tests of the space vehicle.Description of the <strong>GP</strong>-B experience:A system level test was performed late in the program. This test determined that the ECU was generating noiseadversely impacting the SRE. Removing the ECU from the space vehicle for rework resulted in a program delay.Lessons:1. Perform perceptive system level tests as early as possible in during the integration of the vehicle.2. Allow significant spans of time to perform integrated vehicle tests; plan time in the schedule to performsystem rework if necessary. Hold tight to this contingency time – do not trade it off for schedule reliefelsewhere in the program.16.1.1.5 Configuration verification prior to vehicle power-onIssue Summary: Verify vehicle configuration prior to power-on to avoid blowing fuses.Description of the <strong>GP</strong>-B experience:Power distribution fuses were blown during in-process testing of the space vehicle. The most likely cause was anin-work power harness with non-terminated wires touching the spacecraft structure when power was applied.Lesson:• Verify configuration of vehicle, especially un-terminated cables, to ensure that power can safely beapplied without the risk of a short circuit.16.1.1.6 Customer-contractor information exchangeIssue Summary: Establish customer-to-contractor information exchange protocols early.444 March 2007 Chapter 16 — Lessons Learned and Best Practices
Description of the <strong>GP</strong>-B experience:The formal (contractual) relationship between NASA and <strong>Stanford</strong>, as well as <strong>Stanford</strong>’s prime subcontractor,Lockheed-Martin, evolved over time as NASA Marshall worked to gain more technical and programmaticinsight into the operations of the project. This led to difficulties with information exchange and peer-to-peerinteraction while new protocols were established.Lessons:1. Establish and maintain open peer-to-peer communications and clear technical visibility between thecustomer (NASA) and contractors, including sub-contractors, from the beginning of the project.2. Establish a secure information exchange vehicle, such as the internet-based MSFC Virtual ResearchCenter (VRC) to allow unfettered access to program information to all authorized team members.3. Create and maintain all program documentation in common electronically readable and searchableformat (not image format).4. Establish protocols to access and keep secure flight data between the Principal Investigator and thesponsoring organization (NASA), possibly including off-site tools for data viewing and analysis.16.1.1.7 Disturbance from sunshade shutterIssue Summary: Reduce the dynamic disturbance from sunshade shutter activations.Description of the <strong>GP</strong>-B experience:Large science gyro position excursions were observed during science telescope shutter activation. It was decidedto leave the shutter open continuously to avoid these dynamic disturbances on the science gyroscopes. Theprimary root cause of this situation was insufficient testing and analysis of the off-the-shelf design formechanical disturbances.Lessons:1. Perform detailed tests to determine the magnitude of mechanical disturbances on the integrated vehicle.2. Minimize dynamic disturbances caused by mechanisms.16.1.1.8 Telemetry data ratesIssue Summary: Add Capability to Dwell Telemetry on Payload Units for Higher Rate Data.Description of the <strong>GP</strong>-B experience:On <strong>GP</strong>-B there are four identical GSS units, and two SRE units. Obtaining continuous data for each of the 4units at a high sample rate is not possible due to bandwidth limitations on the downlink. However, shortduration(10-20 second) full data rate snapshots have been effective in providing focused high rate telemetry.Lesson:• Consider a function in <strong>Flight</strong> Software to dwell telemetry on a subset of the high data rate telemetry viaground command. Create a “payload-checkout” downlink format that would contain a minimal numberof monitors for all payload units, and a high sample rate for the one selected unit.16.1.1.9 Command Database improvementsIssue Summary: Improvements to Command Database.<strong>Gravity</strong> <strong>Probe</strong> B — <strong>Post</strong> <strong>Flight</strong> Analysis • Final <strong>Report</strong> March 2007 445
Description of the <strong>GP</strong>-B experience:The command database contains a binary flag regarding the hazardous nature of each command. TheConstraints and Restrictions database (CARD) contains text regards the reasons that certain commands mightbe hazardous. Since there was no relationship between the 2 databases manual effort was required to try andrelate the 2 databases in text documentation.Lesson:• Integrate such databases as described above to automate manually intensive and time-consumingfunctions.16.1.1.10 Software command and telemetry flexibilityIssue Summary: Create more flexible flight software command and telemetry dataDescription of the <strong>GP</strong>-B experience:We have limited space in telemetry processor interface tables (PITs) and telemetry downlink. Furthermore, thenumber of commands are limited, and we had an unclear understanding of everything that we are going to needto look at and/or change early in the design effort. Once the software is built there is not much flexibility to lookat or change things that were not anticipated.Lesson:• Provide a set of monitors that can be commanded to look at any <strong>Flight</strong> Software (FSW) variable, providea command that can change any FSW variable, as addressed by memory location.16.1.1.11 Real-time displays and plotsIssue Summary: Capability to Build Telemetry Displays and Plots In Real-time.Description of the <strong>GP</strong>-B experience:Ground software displays and plots had to be defined and delivered with a ground software delivery. If theyneeded to be changed or new ones added the ground software had to be re-delivered with the newdisplays/plots.Lesson:• Build in the capability for the user to build displays/plots in real time.16.1.1.12 Meteorite and orbital debris issuesIssue Summary: Meteorite and orbital debris mitigation should be part of core space vehicle design.Description of the <strong>GP</strong>-B experience:The <strong>GP</strong>-B M/OD (meteorite and orbital debris) study/analysis was a qualitative, comparative risk assessment,allowing the relative high-risk items to be addressed, as needed.446 March 2007 Chapter 16 — Lessons Learned and Best Practices
Lessons:1. M/OD design and analysis must be considered and evaluated early in the program/project life cycle froma complete system level approach, integrated with other systems such as structures, radiation shieldingand thermal protection materials, and not on component by component comparison.2. M/OD critical item lists may be different from failure effects mode critical items.3. Several items were omitted from the “critical items” list, since they were functionally redundant, orimpossible to shield at the point M/OD analysis was done in the program design (i.e., the dewar). ForM/OD impacts, if items are located adjacent to each other, they may not always be consideredredundant. For example, critical damage to the first item can generate debris, which could easily damagethe second. Thorough assessments should be performed for every item on the spacecraft, consideringlocation, redundancy, inherent shielding in the design, for the entire spectrum of environmentalparameters (particle density, velocity, direction, size, shape, etc.). This kind of assessment must begin atthe beginning of a program, not at the end, to assure items such as the dewar are, in fact, not high-riskitems.4. Some items were omitted from the list, such as the aft thruster plumbing. These lines are protected onlyby the MLI blanket surrounding them, and may cause mission failure if punctured and pressure is lost.5. For a better understanding of the quantitative risk of <strong>GP</strong>-B, and similar spacecraft, hypervelocity impactdata of flight-like items is required.16.1.2 Lessons Learned from On-orbit OperationsThe following subsections summarized various lessons that the <strong>GP</strong>-B team learned from operations of thespacecraft on orbit.16.1.2.1 Validation of pre-launch vehicle testingIssue Summary: Ensure that testing is backed-up by thorough data analysis & review.Description of the <strong>GP</strong>-B experience:One of two transponders (4 th generation TDRSS transponder, GFE from NASA/General Dynamics)experienced low link margins immediately following launch, and this resulted in degraded performance on the<strong>GP</strong>-B forward omni antenna. This particular transponder was retrofited to <strong>GP</strong>-B’s frequency prior to launch; itreplaced a transponder with a low power output anomaly found during system testing.The root cause was determined to be a low-level, out-of band oscillation in the second LNA stage that results ininterference inside the transponder. The unit level test data suggests that the cause of the problem was inducedduring the retrofit but was not observed during retrofit testing. Thermal cycle testing was performed, but athermal vacuum test was omitted with the rationale that a thermal cycle test in atmosphere would provide largerthermal stresses on the vehicle, and thus provide a more thorough test. Current data indicates that crystaloscillator performance and center frequency is sensitive to the pressure environment—this was not evident tothe team at the time of the rework Vehicle level testing did not find the problem because RF signal levels wereunrealistically high, thus masking the link margin problem. At the vehicle level, the program review of thetransponder test data was not able to uncover the problem, though there was evidence of the issue upon further,detailed review.<strong>Gravity</strong> <strong>Probe</strong> B — <strong>Post</strong> <strong>Flight</strong> Analysis • Final <strong>Report</strong> March 2007 447
Lessons:1. Perform all tests with a realistic signal levels as possible.2. Review test data with manufacturer to ensure as-installed performance matches manufacturer’sspecifications. Projects with existing 4th Generation TDRSS transponders should review their test databefore launch to ensure they do not have the same or similar problems.3. Thermal-Vac unit testing is advisable when reworking frequency characteristics of a unit, given newunderstanding of crystal oscillator performance / frequency variation with pressure environment.4. When testing a unit, a manufacturer should verify that the unit’s performance is both withinspecifications and within family – once a design has been manufactured and tested multiple times, out offamily test results are a good indication of possible manufacturing flaws. Additionally, requirementsneed to be evaluated to determine if they should be tightened to assure adequate on-orbit performance.5. Test configurations should be optimized to monitor RF system performance at all times – the ability toflag anomalous telemetry and compare prime/redundant strings in real time is preferable.6. Each test should have a set of objectives and success criteria (preferably measurable in the test data)defined prior to the test, and a post-test review should clearly establish that the test objectives andsuccess criteria were met.16.1.2.2 Independent configurability of redundant equipmentIssue Summary: Independent configurability of redundant equipment is required.Description of the <strong>GP</strong>-B experience:<strong>GP</strong>-B’s flight computer consists of two separate processors and is designed to be cold-redundant: only onecomputer may be powered at a time. Each processor holds an independent default parameter and macro set,identical at launch, but is modified as part of vehicle tuning operations. In the event of a major vehicle fault, theprimary processor is shut down and the backup is cold-booted which then starts to execute to its defaultparameter set.In this architecture, the only way to update the parameter and macro set on the backup processor is to performa “fail-over” to the backup side, allow the processor to boot-up and run with the default parameters and macros,and then perform an update. This process is very disruptive to the mission, so much so in <strong>GP</strong>-B’s case that wehave elected not to update the backup-side configuration if and when some other event forces the vehicle to thebackup system.Lesson:• Design the computer system so that all configurable elements for both processors (code, parameters,macros, etc.) may be loadable when either processor is running. This will ensure that, in the event of aprocessor failure, the backup system will control the vehicle with the same parameter set as the primarysystem.16.1.2.3 Computer memory design, monitoring and error correctionIssue Summary: Design of digital systems for single event upset (SEU) monitoring and correction.Description of the <strong>GP</strong>-B experience:<strong>GP</strong>-B has noted 34 separate anomalies relating to radiation induced single or multi-bit errors in its flightprocessor set. To a large extent, such events are unavoidable for spacecraft operating in a radiationenvironment. It has been noted that the multi-bit error rate (errors that are not correctable using the in-448 March 2007 Chapter 16 — Lessons Learned and Best Practices
processor EDAC parity word) is higher than originally predicted from pre-launch analyses. Any multi-bit errorin the central processor has the potential of forcing a fail-over to the backup processor; this event seriouslydegrades the science data taken by the space vehicle.Lessons:1. Develop and test patch procedures to rapidly correct multi-bit errors via ground command. Developdetailed memory maps sufficient to allow the operations team to identify the potential criticality of anymulti-bit error.2. Design into the codes detailed SEU multi-bit error reporting schemes. The <strong>GP</strong>-B flight computer needsto use a software debug interface to read out the locations of multi-bit errors.3. Choose memory and processor components based on on-orbit performance data when possible. The<strong>GP</strong>-B spacecraft suffered 34 multi-bit errors when pre-launch estimates for the susceptibility of theprocessor memory predicted only one during the mission. Detailed re-analysis during the missionbrought to light flight data from another mission that agreed with our experience, but was not used bythe team during processor memory selection (the data was published, but was not identified at thattime). In lieu of this data, the team should have chosen memory with an established performance record.16.1.2.4 Ground simulator fidelityIssue Summary: <strong>Flight</strong> projects should pay careful attention to ground simulator fidelity.Description of the <strong>GP</strong>-B experience:<strong>GP</strong>-B uses an Integrated Test Facility (ITF) to test and verify flight codes and command sequences for use onorbit. The ITF is a combination of flight-like hardware, hardware dynamics simulators, and software simulatorsto model the operation of the vehicle as a whole in its on-orbit environment. This is a critical development anddebugging tool for the project. While a good model for much of the spacecraft, not all interfaces are includedand some that are provide only static values (they are not dynamic and thus do not respond to spacecraftoperation as one would expect)A number of anomalies have been identified that relate to issues generated due to lack of fidelity of the ITF.Command sequences operated differently on the vehicle because the ITF did not have sufficient fidelity to showresponse, or that the interfaces were incomplete and thus did not respond where the vehicle did.Lessons:1. Manage the simulation facility like the vehicle; devote significant program resources and use aerospacebest practices to maintain the design and configuration of the system.2. Carefully define and broadly communicate the scope of any vehicle or subsystem simulator. Simulators,by their nature, cannot be perfect and including all vehicle features may be prohibitive. However, acareful plan managed by a dedicated team of simulation supervisors – independent from the teamdeveloping the spacecraft – would improve fidelity.3. Include as many interfaces as possible in the model. Wherever possible, use flight-like hardware ratherthan software models of systems. This includes cables built to flight prints.16.1.2.5 Gas thruster contaminationIssue Summary: Gas thrusters are vulnerable to contamination.<strong>Gravity</strong> <strong>Probe</strong> B — <strong>Post</strong> <strong>Flight</strong> Analysis • Final <strong>Report</strong> March 2007 449
Description of the <strong>GP</strong>-B experience:Two of <strong>GP</strong>-B’s gas thrusters were taken off line after failing; the identified root cause for both was foreign objectcontamination in thruster body which prevents the thruster from turning off properly. This observation has alsobeen made by numerous other projects with a variety of gas thruster designs.Lesson:• Pay particular attention to contamination control and cleanliness of all systems which interface with thecold gas thruster system. Use ultra-high-vacuum and optics procedures to maintain cleanliness. Designin as much filtering as possible to limit migration of potentially damaging particles.16.1.2.6 Attitude Reference Platform StabilityIssue Summary: The alignment sensitivity of the space vehicle's Attitude Reference Platform (ARP) was foundto be significantly more sensitive to the vehicle's thermal environment than originally calculated.Description of the <strong>GP</strong>-B experience:The space vehicle was unable to maintain the required wide-band and roll-frequency pointing requirements dueto a out of spec thermal sensitivity of the ARP to the space vehicle thermal environment. This effect significantlycomplicated the <strong>GP</strong>-B data analysis by requiring careful modelling of the effect during both guide star valid andinvalid periods.Lesson:• For such a mission critical piece of hardware, do not rely solely on analysis-only methods of verification,but place the vehicle in a thermal environment (in thermal vacuum testing, for example) in excess ofwhat is expected in orbit and verify the stability of the platform by direct testing. Formally require thevehicle subcontractor to perform this verification by test, in addition to analysis.16.1.2.7 Formal anomaly resolution processIssue Summary: A formal anomaly resolution process proved to be very effective.Description of the <strong>GP</strong>-B experience:<strong>GP</strong>-B developed, simulated, and practiced an Anomaly Resolution process during pre-launch preparations. Thesystem developed (described elsewhere in this report) was very effective, and a number of lessons were learnedand re-affirmed during the mission:Lessons:1. A formalized anomaly resolution process is very helpful to focus and guide investigations. Each anomalywas evaluated with a checklist to ensure all key issues were addressed. Recording of anomaly data andclosure information was enforced with this process. It provided a framework in which to develop faulttrees and form root cause investigations and assists in the rapid assimilation of new team members viaclear processes and standards.2. Leadership of the anomaly review board by senior, mission-cognizant technical staff critical for effectiveanomaly resolution. Senior technical staff, especially at the managerial level, have a deep understandingof the operation of the space vehicle and can effectively direct investigations in “high yield” directions.They have the broadest knowledge of the skills of the team members and are most effective in forminganomaly teams. ARB members that are senior managers from core subcontractors and technical450 March 2007 Chapter 16 — Lessons Learned and Best Practices
oversight groups (e.g. NASA) are able to draw on their organizations for expertise as needed. Thisleadership is distinct from program management; it is primarily focused on the technical issuessurrounding the anomaly.3. Employ flexible and easy-to-use record keeping tools. This provides flexibility in the method ofrecording anomalies and attacking problems, it does not significantly limit the team, and it requiresminimal training required. They provide for easy dissemination of data by using popular, established fileformats. Does not (generally) require special software applications installed on each users’ system. Aformal investigation process provides the structure needed to ensure relatively uniform record keeping.4. Develop “custom” computer tools only after true mission needs are known. Experience in pre-launchsimulations with tools developed a-priori found the tools lacking or utterly useless; they did not addressthe practical needs of anomaly investigation. Tools developed following detailed simulations withrealistic anomalies fall closer to the mark. Some of the tools’ features address large time intervals,features not generally brought out during a typical 1 to 3 day simulation; this should be taken intoaccount during tool development. The ops, engineering, and analysis teams should recognize that someof their true needs will be clear only after launch. Ensure that the tools are flexible enough to be modifiedin short order.16.1.2.8 Complexities of a 9-DOF satelliteIssue Summary: Design, test, and operation of a 9-DOF satellite must take into account the additionalcomplexities and challenges that are inherent in such a system.Description of the <strong>GP</strong>-B experience:The <strong>Gravity</strong> <strong>Probe</strong> B satellite actively monitors and controls 9 interacting degrees of freedom during normaloperation:• 3 in orientation of the space vehicle to keep the tracking telescope pointed at the guide star and maintaina constant roll rate and fixed roll phase with respect to the orbital plane• 3 in translation of the space vehicle to keep the vehicle in a drag-free orbit about the geometric center ofthe one of the science gyro’s housing cavities (nominally Gyro 3)• 3 in translation of the housing cavity with respect to the gyroscope rotor (nominally Gyro 3)The other 9 degrees of translation freedom of the remaining 3 gyroscopes are slaved to the first 9 describedabove and do not significantly interact with the dynamics of the vehicle as a whole. Note that by design, therotational degrees of freedom of the gyroscopes are not controlled.Gyro 3 serves as the drag-free sensor (accelerometer) for the satellite. The three control efforts required to keepthe housing centered around the gyroscope rotor are fed to the spacecraft. The spacecraft, in turn, appliescompensating forces via its thruster set to null the forces felt by the gyroscope rotor, as shown in Figure 16-1.These six degrees of freedom significantly interact. The gyroscope position control loop bandwidth (GSS) ismade small to minimize disturbance torques on the rotor, and is on the order of 2 Hz. The spacecraft translationand pointing (ATC) bandwidth is of the same order and is limited by thruster authority and ATC processing.These two control loops interact significantly during operation.<strong>Gravity</strong> <strong>Probe</strong> B — <strong>Post</strong> <strong>Flight</strong> Analysis • Final <strong>Report</strong> March 2007 451
Figure 16-1. Six interacting translational degrees of freedomAdditional coupling between the translational DOF comes from orientation changes. The center of mass of thespacecraft is about 20 centimeters from the center of the drag-free sensor’s housing. Thus, any change inorientation tends to be about the center of mass of the vehicle. The drag-free action nulls these orientationinduced forces and thus moves the effective center of mass of the vehicle to the center of the drag-free sensor’shousing. Again, the orientation control loop bandwidth is the same as the translation control bandwidth andthus this control loop, as well, interacts significantly with the gyro suspension control loop.This brief overview shows, in outline form, that the 9 degrees of freedom are strongly coupled in normaloperation and thus cannot be easily separated into simpler and isolated control subsystems.Lessons:<strong>Gravity</strong> <strong>Probe</strong> B has learned a number of important lessons about the design, test, and operation of asophisticated 9 DOF space vehicle, and these can be extended to other similarly complex missions (ST7/GRS,STEP, LISA, ConX)1. Interacting control systems must be tested together. While design is done using best engineeringpractices, often the full performance and complexity of the instrument can be assessed only through ajoint test of the equipment. For missions such as <strong>GP</strong>-B, a representative ground test is not possible. Thus,final performance is assessed and adjusted on orbit. This was proven out on <strong>GP</strong>-B with the drag-freesystem, the attitude control system, and the gyro charge management systems.2. Complex mission operations. Tuning up the space vehicle pointing and translation control loopsrequired significantly more time than originally expected (4 months actual vs. an estimated two weeks),though significant effort was expended prior to launch to develop and test in simulation the on-orbitoperations plan. Unmodelled vehicle dynamics required in-place system identification to allow thevehicle to perform to science-compatible levels while both the translation and orientation control was inoperation. This mission complexity stems directly from the coupled nature of the 9 degrees of freedom.3. Prepare for unanticipated behavior. The <strong>GP</strong>-B gyroscopes exhibited some unexpected behavior once onorbit, significantly: 1) the initial rotor charge was 450mV rather than the expected 100mV or less, 2) thepolhode period of the rotor changed over time when it was expected to be constant, 3) patch charge452 March 2007 Chapter 16 — Lessons Learned and Best Practices
effects appear greater than ground testing would indicate. Though all of these subjects were studiedextensively before launch, our best knowledge about how the instrument operated was not as accurate asanticipated. Only on-orbit operation made it possible to identify and mitigate these issues.4. Invest in high fidelity simulations. Hardware in the loop simulators are critical to validate the overalleffectiveness of a complicated scientific instrument and satellite system. Where the instrument cannot beoperated on the ground, suitable high fidelity simulations with flight compatible interfaces must bedeveloped. These simulators, however, must be vetted against flight data and updated once actualperformance data are known. This is required to be able to resolve operational anomalies16.1.3 IOC Observations by Lewis Wooten of NASA MSFCThe <strong>GP</strong>B Operations team has done an exceptional job conducting the Launch and the IOC phases of themission. The team is very intelligent, extremely dedicated, and has an unprecedented commitment to missionsuccess. Plus, they are just a wonderful group of individuals to work with. I measure an operations teamperformance on its ability to learn from mistakes, and adapt quickly to change, and make the right subsequentdecisions. On this basis, the <strong>GP</strong>-B team is one of the best in the business, and it is a team that will continue tomake adjustments and improve along the way. With that being said, I have very little to offer in terms ofsuggestions for improvements at this phase of the mission. However, if I am pressed to come up withsomething, I have provided the following two observations for consideration.16.1.3.1 Execution of Pass Plan Change RequestIssue Summary: The PPCR screening, approval, and execution process work extremely well for the majority ofthe cases, however it was not always consistentDescription of the <strong>GP</strong>-B experience:Given the dynamic approach used in troubleshooting some of the ATC sub-system problems, many of theirPass Plan Change Requests (PPCR’s) was executed without a through review with the flight team. There weretimes when they were pressed to send the commands before a specific communication pass expired, withoutbeing given the opportunity to participate in the screening process. The flight team are not “just buttonpushers”, they should be aware of what, why, when, the expected results, and fallback plans before they given “aclear to execute.” I did see this as a significant problem and it should not be an issue during the science missionphase.Lesson:Take the time necessary to get the flight team completely onboard before they are asked to execute a PPCR.<strong>Stanford</strong> modified the PPCR process to address this issue, which improved the process for a group that had alarge number of issues. It allowed them to work the problems yet it maintained discipline while not becomingadministratively difficult.<strong>Gravity</strong> <strong>Probe</strong> B — <strong>Post</strong> <strong>Flight</strong> Analysis • Final <strong>Report</strong> March 2007 453
16.1.3.2 Training and certification of new flight controllerIssue Summary: <strong>Stanford</strong> University has an excellent source of bright and “Gung Ho” young people to supportthe mission as flight controllers. As capable as these people are, there is no substitute for their preparation.Description of the <strong>GP</strong>-B experience:In fairness to the team, not enough time was allowed for them to be mentored and coached by the spacecraftlead subsystem engineers before these knowledgeable engineers rolled off the program. However, the missioncontrollers did a good job. The training and certification requirements for the initial team was much morestructured and rigorous than it was for the latter team. This not a major concern during this phase since a vastmajority of the high risk commanding and activities have been retired.Lesson:Make sure that the lead subsystem engineers meet at least once weekly for a 3-4 months period for mentoringand information exchange with their <strong>Stanford</strong> replacements. This was implemented at <strong>Stanford</strong> and workedwell.16.2 Selected Best PracticesThe following items were adopted by <strong>GP</strong>-B as “best practices” and we would like to affirm their effectiveness. Inaddition to a broad set of best practices brought forth from the collective wisdom of NASA, Lockheed-Martin,and the <strong>Stanford</strong> teams, these selected best practices are were particularly significant in day-to-day operations:16.2.1 Design team transition to mission operationsIssue Summary: Test and engineering team transition to mission operations ensured ownership.Description of the <strong>GP</strong>-B experience:The <strong>GP</strong>-B development and test teams transitioned to work on the mission operations team after launch. Thisreduced risk of mishaps and improved anomaly resolution efficiency. Expert knowledge was immediatelyavailable to efficiently resolve anomalies. Individuals had strong sense ownership, dedication, and responsibilityfor their components and subsystems.Best Practices:Retain and train design team for mission operations. Encourage a sense of “ownership” and continuity ofresponsibility for all individuals involved in the program. Provide long-term team stability. Take into accountthe conflict of hardware development versus mission operations development and manage it effectively16.2.2 Mission planning flexibilityIssue Summary: Mission planning flexibility provided needed timeline adjustments.Description of the <strong>GP</strong>-B experience:On-orbit anomalies and calibrations required mission planning to be flexible and responsive to changingprogram priorities. The mission operations team was extremely responsive to changes.Best Practices:Mission planning needs to be flexible and responsive to mission needs.454 March 2007 Chapter 16 — Lessons Learned and Best Practices
16.2.3 Control and communication of spacecraft configurationIssue Summary: Maintain thorough configuration control and communicate changes.Description of the <strong>GP</strong>-B experience:Important documents are maintained on secure web pages for access by all team members. Baselineconfiguration was established and successfully managed.Best Practices:Establish and document program baselines for schedules, databases, timelines and technical information.Thoroughly review all changes and communicate changes as appropriate to team members16.2.4 Effective use of databasesIssue Summary: Make good use of databases for requirement, test tracking and change control.Description of the <strong>GP</strong>-B experience:A Filemaker Pro database was used on <strong>GP</strong>-B for requirements/test tracking, change requests and many otheroperational information uses. This allowed quick cross-referencing of open items, requirements to test caseinformation and many other uses. It was very useful to quickly generate different matrices for trackingpurposes.Best Practices:This type of relational database is very useful for program management and control.16.2.5 Inclusion of operations experts in hardware developmentIssue Summary: Early insertion of operations experience into hardware development positively affects on-orbitoperations.Description of the <strong>GP</strong>-B experience:Early insertion of skilled operations personnel into the hardware development process, notably the ExperimentControl Unit (ECU), allowed the experience of what both procedure and hardware failures looked like, how totell the difference between the two and the best way to recover from them. Experiences during developmentmade functional test development more intuitive. The increased understanding allowed for more coherent testprocedures and simpler code.Best Practices:Apply operations experience into development process for:1. an intuitive set of flight procedures2. experience in recognizing and efficiently resolving anomalies16.2.6 Team member cross-trainingIssue Summary: Team member cross training is effective.<strong>Gravity</strong> <strong>Probe</strong> B — <strong>Post</strong> <strong>Flight</strong> Analysis • Final <strong>Report</strong> March 2007 455
Description of the <strong>GP</strong>-B experience:Cross training of operations team members is being implemented and is effective. Observed cross trainingbenefits include:1. more people to provide gap coverage for planned and unplanned gaps in schedule coverage,2. broadened team member knowledge and provides systems approach,3. avoids single string team members,4. minimizes team member fatigue caused by long work hours,5. shared workload improves teamwork,6. improves individual professional developmentBest Practices:Start cross training early and practice in mission simulations to ensure team is ready and flexible to handlechanging mission needs.16.2.7 Peer reviews in software developmentIssue Summary: Including peer reviews during software development was effective in finding errors and savingtime and money.Description of the <strong>GP</strong>-B experience:Peer reviews were introduced after several years of work as part of the U.S. Defense Department’s SoftwareEngineering Institute (SEI), based at Carnegie Mellon University, Level-3 certification. The peer reviews werepreceded by formal training, which was beneficial. Also, we were careful not to include management in thesereviews, as recommend by the process. As a result, code that was properly reviewed was very stable andexperienced fewer test errors. Software peer reviews should be provided priorityBest Practices:Peer reviews have shown their worth in finding errors early in the development cycle, which save time andmoney.16.2.8 Minimizing program risks with formal risk management planIssue Summary: IA formal, regular risk review is effective at early identification and control of program risks.Description of the <strong>GP</strong>-B experience:<strong>GP</strong>-B instituted a high visibility risk steering committee, which program management used to evaluate and setoverall program priorities. Risk groups met on a monthly basis; both <strong>Stanford</strong> and MSFC had independent riskevaluation teams that met regularly to share their assessments.456 March 2007 Chapter 16 — Lessons Learned and Best Practices
Hardware risks were evaluated using probability and impact of potential failure using a complete FMEAprocess; other program risks (budget, schedule, personnel) were evaluated using a similar method. Thecommittees solicited advice from independent councils of experts to ensure our evaluations were correct.Table 16-1 summarizes the five risk categories and definitions used by <strong>GP</strong>-B.Table 16-1. <strong>GP</strong>-B Risk categories and definitionsEvent Likelihood Consequences—Impact to Program if Event OccursRiskValueChance ofOccurrenceProgram CostIncreaseCritical PathImpactTechnical Impact5 Near certainty: > $8 M > 60 days Loss of mission.(90%)4 Highly likely: >$4M but < 8M 31 - 60 days Mission performance requirements degraded.(75%)3 Moderate: (50%) >$1M but < 4M 8 - 30 days Loss of some system level redundancy; nocompromise of mission requirements2 Low: (25%) 1M 1 - 7 days Technical impact without loss of system levelperformance or redundancy.1 Not likely: (10%) $100K None No compromise in mission performance orredundancy.Based on potential impact to the program, each risk was evaluated using Table 16-1above as a guideline andassigned to one of three categories:• Mitigate. Eliminate or reduce the risk by reducing the impact, reducing the probability or shifting thetime frame. If a risk is marked as “mitigate” the user will input a summary of the mitigation plan in theMitigation Strategy Summary field and a detailed plan if necessary.• Watch. Monitor the risks and their attributes for early warning of critical changes in impact, probability,time frame, or other aspects. If a risk is marked as “watch”, the user will input triggers for changing thatapproach in the Contingency plan/trigger field and any other appropriate/applicable plans.• Accept. Do nothing. The risk will be handled as a problem if it occurs. No further resources areexpended managing the risk. If a risk is marked as “accept”, the user will be prompted to input amandatory acceptance rationale along with any plans for handling the risk if it does occur.Risks were promoted or demoted as program need or technical understanding evolved.Best Practices:A formal risk management process with strong management support significantly improves the efficiency andtechnical understanding of the project team.16.3 Management Lessons from the Calder-Jones <strong>Report</strong>Because some aspects of <strong>GP</strong>-B program management were unique among NASA programs, and because <strong>GP</strong>-Bwas viewed as a management experiment as well as a scientific experiment—as described in Chapter 6, The <strong>GP</strong>-B Management Experiment—in 2005, NASA Headquarters commissioned two former <strong>GP</strong>-B team members,Ned Calder from the Engineering Systems Division at MIT and Brad Jones, from the Aeronautics &Astronautics Department at <strong>Stanford</strong> University to research and prepare an independent study on themanagement of <strong>GP</strong>-B. Calder and Jones presented their finished report, entitled: <strong>Gravity</strong> <strong>Probe</strong> B: A ManagementStudy to NASA in April 2006. A PDF copy of the complete Calder-Jones <strong>Report</strong> is available for downloadingfrom the <strong>GP</strong>-B Web server at: http://einstein.stanford.edu/pao/pfar/cj_report-apr2006.pdf.<strong>Gravity</strong> <strong>Probe</strong> B — <strong>Post</strong> <strong>Flight</strong> Analysis • Final <strong>Report</strong> March 2007 457
Below is an edited summary of six areas of the <strong>GP</strong>-B Management Experiment, described on page 24 of theCalder-Jones <strong>Report</strong>, from which NASA can glean some lessons for management of other missions. The fullreport includes a more complete discussion of these six management areas.16.3.1 Working With Organizational AsymmetriesEach of the institutions involved in the development of <strong>GP</strong>-B—a research university, an aerospace company,and NASA—have different strengths and different cultures. These entities should be managed to leverage theirunique strengths in a team context, while respecting their cultural differences. In a university environment, thegoal is typically knowledge-driven; a university researcher will pursue a problem until it has been solved…nomatter how long it takes. In aerospace companies, schedule and budget are typically the important managementfactors; product development is always constrained by time and budget, and this often leads to trade-offs. AtNASA, risk management is often of greatest concern. The management lesson for a program like <strong>GP</strong>-B is theimportance of leveraging these asymmetries to best advantage. For example, unique hardware such as the GSScould only be developed in a university environment, whereas more common flight hardware that resides onthe critical path for a satellite launch—e.g. the Gas Management Assembly on the <strong>GP</strong>-B spacecraft—is bestdeveloped by a knowledgeable and experienced aerospace company.16.3.2 Recognizing and Managing Critical Transition PointsAll NASA program progress through various stages or transitions where management requirements and stylesneed to change and/or adapt. Recognizing and planning for these transitional periods ahead of time cansignificantly streamline the program development process. This may include planning ahead for a managementchange at future transition point. For example, a program like <strong>GP</strong>-B was bound to reach a point where it wasnecessary to transition from an R&D program to a tightly-scheduled, minimal risk flight program. Planning forthis transition ahead of time, including anticipated management changes from an R&D-oriented programmanager to an aerospace-operations-oriented program manager, can facilitate making this transition moresmoothly.16.3.3 Adaptive Program Management.This is a corollary to Lesson #2 above. It is important to recognize that management styles and competenciesmust adapt as a program progresses through different stages in its life cycle. For example, in the case of <strong>GP</strong>-B,the operations management skills of Gaylord Green, which were very well suited for the flight program, wereless germane when the program transitioned to the data analysis phase. <strong>GP</strong>-B senior management adapted tothis phase shift in the program by changing program managers.16.3.4 Maintaining Aerospace Knowledge at UniversitiesUniversities working on NASA programs need to acquire some degree of institutionalized aerospace systemknowledge—that is, procedures, best practices, and lessons learned that have evolved in the aerospace industryand in government agencies from developing, launching, and operating spacecraft for over 50 years. This typeof knowledge is essential to the success of any NASA mission, regardless of management structure, and whenapplied appropriately, it can reduce risk and facilitate progress. However, if such knowledge is applied by rote,without proper contextual forethought, it can actually impair progress. By definition, this type of knowledge isexperiential, rather than academic; it cannot be taught in a classroom, but rather it must be learned in theprocess of actually building flight hardware and software. For this reason, once staff and/or students have beenthrough the process of building flight hardware or working on a spacecraft, it behooves NASA and universitiesto value these trained individuals as an investment for future aerospace programs, rather than as sunk costs fora single project.458 March 2007 Chapter 16 — Lessons Learned and Best Practices
16.3.5 Managing RiskIn a program such as <strong>GP</strong>-B, there is no such thing as zero risk. Rather, at any given phase of the program, it isimportant for NASA to determine what level of risk is acceptable and manage program risks accordingly. Thecreation of a formal risk-based management program, such as the one instituted jointly by MSFC, <strong>Stanford</strong>, andLMMS during the latter years of <strong>GP</strong>-B, allowed managers to take a high level look at overall program risks andto monitor the rate at which those risks were changing. This risk management plan included a graphic displaythat was easy to review at a glance, and it also defined a timeline for mitigating risks. Moreover, it providedguidance to NASA for determining the appropriate approach in mitigating program risks. Thus, a predictableprocess was developed whereby NASA support was scaled, based on the level of risk—i.e., the higher the risk themore support imparted by NASA. This not only enabled the <strong>GP</strong>-B team to receive an appropriate amount ofsupport, but it also enabled the team to have reasonable expectations as to the level of support to expect fromNASA for any given issue.16.3.6 Funding PredictabilityTo ensure the health and success of any program, NASA must strive to maintain funding commitments thathave been specified and agreed to. In the case of <strong>GP</strong>-B, NASA's actual level of funding was substantially less thanthe agreed upon funding commitment for the years 1999-2002. Scheduling the development of flight hardwareis intimately tied to expectations regarding available funds. Because funding expectations were not met duringthe critical years leading up to launch, the <strong>GP</strong>-B management team was forced either to unexpectedly cut or torestructure investments in technology development and support activities during this period. In turn, thesetrade-off decisions that were based on insufficient funding ultimately contributed to some of the technical andscheduling problems that emerged near the end of the program.<strong>Gravity</strong> <strong>Probe</strong> B — <strong>Post</strong> <strong>Flight</strong> Analysis • Final <strong>Report</strong> March 2007 459
460 March 2007 Chapter 16 — Lessons Learned and Best Practices
A<strong>Gravity</strong> <strong>Probe</strong> B Quick Facts<strong>Gravity</strong> <strong>Probe</strong> B — <strong>Post</strong> <strong>Flight</strong> Analysis • Final <strong>Report</strong> March 2007 461
462 March 2007 Appendix A — <strong>Gravity</strong> <strong>Probe</strong> B Quick Facts
<strong>Gravity</strong> <strong>Probe</strong> B Quick FactsSpacecraftLength6.43 meters (21 feet)Diameter2.64 meters (8.65 feet)Weight3,100 kg (3 tons)Power Total Power: 606 Watts (Spacecraft: 293 W, Payload: 313 W)Batteries (2)35 Amp HourDewarSizeContentsTelescopeCompositionLengthApertureFocal lengthMirror diameterGuide StarGyroscopes (4)ShapeSizeCompositionCoatingSpin RateDrift RateLaunch Vehicle2.74 meters (9 feet) tall, 2.64 meters (8.65 feet) diameter2,441 liters (645 gallons) superfluid helium @ 1.8 Kelvin (-271.4°C)Homogeneous fused quartz35.56 centimeters (14 inches)13.97 centimeter (5.5-inch)3.81 meters (12.5 feet)14.2 centimeters (5.6 inches)HR 8703 (IM Pegasi)Spherical (Sphericity < 40 atomic layers from perfect)3.81 centimeter (1.5-inch) diameterHomogeneous fused quartz (Purity within 2 parts per million)Niobium (uniform layer 1,270 nanometers thick)Between 5,000 – 10,000 RPMLess than 10 -11 degrees/hourManufacturer & Type Boeing Delta II, Model 7920-10Length38.6 meters (126.2 feet)Diameter3 meters (10 feet)Weight231,821 kg (511,077 lbs or 255.5 tons)Stages 2Fuel9 strap-on solid rocket motors; kerosene and liquid oxygen in first stage; hydrazineand nitrogen tetroxide in second stageMissionLaunch Date April 20, 2004SiteVandenberg Air Force Base, Lompoc, CADuration12-14 months, following 60-90 days of checkout and start-up after launchOrbitCharacteristicsPolar orbit at 640 kilometers (400 miles), passing over each pole every 48.75 min.Semi-major axis7027.4 km (4,366.8 miles)Eccentricity 0.0014<strong>Gravity</strong> <strong>Probe</strong> B — <strong>Post</strong> <strong>Flight</strong> Analysis • Final <strong>Report</strong> March 2007 463
Apogee altitude659.1 km (409.6 miles)Perigee altitude639.5 km (397.4 milesInclination 90.007°Perigee Arg. 71.3°Right Ascension of asc. node 163.26°MeasurementsPredicted Drift- GeodeticEffect6,606 milliarcseconds or 6.6 arcseconds (1.8x10 -3 degrees)Predicted Drift - Frame-Dragging39 milliarcseconds (1.1x10 -5 degrees)Required AccuracyBetter than 0.5 milliarcseconds (1.39x10 -7 degrees)ProgramDurationCost<strong>Gravity</strong> <strong>Probe</strong> B Quick Facts43 years from original conception; 40 years of NASA funding$750 million dollars464 March 2007 Appendix A — <strong>Gravity</strong> <strong>Probe</strong> B Quick Facts
BSpacecraft Data Chart<strong>Gravity</strong> <strong>Probe</strong> B — <strong>Post</strong> <strong>Flight</strong> Analysis • Final <strong>Report</strong> March 2007 465
466 March 2007 Chapter B — Spacecraft Data Chart
Space Vehicle CharacteristicsMass PropertiesElectrical PowerSpace vehicle mass w/ cont 3236.9 kg Payload power (unregulated) 254 W (11%) cont. includedSpace vehicle contingency 127.9 kg 4.0% Spacecraft power (unregld.) 293 W (6%) cont. includedSpace vehicle margin 88.9 kg SV power required (normal Science) 547 WSpacecraft mass w/cont 1271.7 kg Load power margin (GaAs) 156 W (29%) best/worst case seasonSpacecraft contingency 57.5 kg 4.7% Batteries 2-35 AHBallast 64.1 kg Eclipse DOD not to exceed: 40%CM in z (fwd of point midwaybetween SG 1 and PM) 69 mmPayload mass w/cont 1901.1 kg Communication(750km; 3dB link margin Rqmt)FWD AFT link MarginPayload contingency 70.4 kg 4.8% TDRSS MA forward link 125 bps 3.9 dB 3.9 dB (75 deg)Ix (at launch) 5003kg-m^2TDRSS MA return link 1024 bps 3.0 dB 3.0 dB (50 deg)Iy (at launch) 4907kg-m^2TDRSS SA forward link 2000 bps 3.5 dB 3.5 dB (70 deg)Iz (at launch) 2253kg-m^2TDRSS SA return link 2048 bps 3.9 dB 3.9 dB (70 deg)Mass Trim Mechanism GN downlink (11.3 meter) 2.5 Mbps 9.7 dB 6.1 dB (90 deg)Product of inertia (20 kg masses) 8.35kg-m^2EGSE (system test) 30.696 kbpsRadial COM (20 kg masses) 3.69mm<strong>Flight</strong> Software (32 bit RISC processor) Attitude and Translational Control SystemCPU throughput 70% AttitudeEEPROM 44% Pitch/yaw pointing (GV) 12 marcsec rmsRAM (Op system) 27-49 % Pitch/yaw pointing (GI) 4 arcsec rmsATC 10 Hz Roll pointing error 7 arcsec rmsScience data 1 Hz Roll rate error 0.3E-5 rpm rmsRoll rate range 0 - 1 rpmSolid State Recorder Roll rate range (nominally) 0.3-0.5 rpmMemory (EOL) 1.5 Gbits Attitude BW w/ control gyro 0.15 HzRecord rate 26,400 bps Attitude BW w/o control gyro 0.05 HzThruster System Attitude BW Roll 0.066 HzOperates over porous plug 2 to 16 mg/sec rangeat nominal 6.5 mg/sec from dewarForce, x 6.3 mNForce, y and z 8.3 mN TranslationalTorque, x 18 mNm Proof mass error 15 nm rmsTorque, y 14 mNm Translational BW 0.5 Hz Structure OrbitTorque, z (roll) 8.5 mNm All margins of saftey positive Polar inclinationAt 8 mg/sec from dewar: Factor of 2 for spacecraft truss Altitude is 646 km ±3 kmForce per thruster 8.3 mN Fundamental lateral frequency 9 Hz Eccentricity (circular) 0.001Bandwidth 100 Hz Disturbance Torques Fundamental lateral freq. (axial) 25.3 Hz<strong>Gravity</strong> gradient 2.2E-3 Nm peak (rss) Lowest solar array deployed freq. 1 Hz ThermalDisturbance Forces 1.3E-3 NM rms (rss) Lowest SV structure freq. on orbit >10 Hz Avg. dewar shell temp. 227 K<strong>Gravity</strong> gradient 0.98E-3 N peak (rss) Magnetic 2.4E-3 Nm peak (rss)1.26E-3 N rms (rss) 1.0E-3 NM rms (rss) Dewar Control ReliabilityAero (1 sigma density) 1.5E-3 N peak (rss) Aero (1 sigma density) 1.1E-3 Nm peak (rss) Pressure accuracy (sensor spec) 0.02 Torr At 18 months: 0.9661.3E-3 N rms (rss) 0.6E-3 NM rms (rss) Orbit mass flow (67% worst atm) 4.48 mg/s At 3 years 0.922Center of Mass offset force 0.15E-3 N rms (0.3 rpm)Worst case temperature variationCross product torque 0.26E-3 Nm rms (0.3 rpm) (3 sigma density, 1% ullage) ±1 mK Mean mission duration 2.95 yrs467 March 2007 Chapter B — Spacecraft Data Chart
<strong>Gravity</strong> <strong>Probe</strong> B — <strong>Post</strong> <strong>Flight</strong> Analysis • Final <strong>Report</strong> March 2007 468
CWeekly Chronicle of the <strong>GP</strong>-B Mission<strong>Gravity</strong> <strong>Probe</strong> B — <strong>Post</strong> <strong>Flight</strong> Analysis • Final <strong>Report</strong> March 2007 469
470 March 2007 Appendix C — Weekly Chronicle of the <strong>GP</strong>-B Mission
This appendix contains a complete compilation of all the <strong>GP</strong>-B weekly highlights/email updates posted fromthree weeks prior to launch on April 2, 2004, through the end of the <strong>Post</strong>-Science Instrument RecalibrationPhase of the mission on September 30, 2005.C.1 Pre-Launch Mission Phase: 4/2/04 – 4/18/042 April 2004—Pre-Launch Briefing at NASAHeadquartersThe official pre-launch <strong>Gravity</strong> <strong>Probe</strong> B mission and science briefingwas held this past Friday, April 2, 2004 at 1:00 PM Eastern DaylightTime at NASA Headquarters in Washington, D.C. The participants inthe briefing (pictured from left to right in the photo) were AnneKinney, Director of Astronomy/Physics Division, NASAHeadquarters; Rex Geveden, Program Manager, <strong>GP</strong>-B and DeputyDirector, NASA's Marshall Space <strong>Flight</strong> Center in Huntsville,Alabama; Francis Everitt, <strong>GP</strong>-B Principal Investigator at <strong>Stanford</strong>University, <strong>Stanford</strong>, California; Bradford Parkinson, <strong>GP</strong>-B Co-Principal Investigator at <strong>Stanford</strong> University, <strong>Stanford</strong> California; KipThorne, Feynman Professor of Theoretical Physics, CaliforniaInstitute of Technology, Pasadena, California7 April 2004—<strong>GP</strong>-B Launch <strong>Post</strong>poned Two DaysThe official <strong>Gravity</strong> <strong>Probe</strong> B launch date has been postponed by twodays to Monday, April 19, 2004 at 10:01 AM Pacific Daylight Time,from Vandenberg Air Force Base in Southern California. Theadditional time is necessary to allow engineers to troubleshoot anapparent short in launch pad ground support equipment. Thisequipment is needed for a safe and secure launch of the <strong>GP</strong>-Bspacecraft.Today, the temperature of the dewar's main tank was 1.7744K, and thedewar is 95.5% full. The Guard Tank level was 88.6%. Problems withthe connection between the ground service equipment and the boosterhave caused a two-day delay in the launch countdown.12 April 2004—Ground Support Problems Fixed,Launch is “Go” for April 19 LaunchThe problems which delayed the April 17th launch date by two dayswere closed out, and technicians worked through the Easter holidayweekend to keep <strong>GP</strong>-B on track for launch on Monday, April 19th.Today, the temperature of the dewar's main tank was 1.787K, and thedewar is 95.5% full. The Guard Tank level was 66.5%. On Saturday,ordnance was installed on the solid rocket boosters. and compatibilitytesting between the boosters and the space vehicle was carried out.Tonight, a visual inspection is in process to ensure that all itemsunnecessary for launch have been removed from the launch vehiclepremises.Following this press briefing, stories about <strong>Gravity</strong> <strong>Probe</strong> B appearedin a number of newspapers around the country. For example, theBoston Globe carried a front-page story. On the Internet, a story about<strong>GP</strong>-B, written by Associated Press science writer Andrew Bridges,became one of Saturday's most popular stories on Yahoo News.The official <strong>Gravity</strong> <strong>Probe</strong> B launch date is Saturday, April 17, 2004 at10:09 AM Pacific Daylight Time, from Vandenberg Air Force Base inSouthern California.Early Thursday morning, the <strong>Gravity</strong> <strong>Probe</strong> B Program reached amajor milestone: the <strong>GP</strong>-B space vehicle was moved on a trailer fromthe clean room, where it has resided since last summer, to the launchpad at Space Launch Complex 2 (SLC-2). At the launch pad, the spacevehicle was hoisted up the side of the Mobile Service Tower (MST) tothe “White Room” at the top, where it was mated to the 2nd stagebooster rocket. Current dewar temperatures are not available thisweek, but the dewar is 95.5% full. Last Friday, the temperature of thedewar's main tank was 1.7525K, and the Guard Tank level was 48.5%.All launch preparations are currently proceeding on schedule, and weare “Go” for launch on April 17th.14 April 2004—Technicians Begin Installation ofPayload FairingToday, technicians began installing the payload fairing—the “nosecone” at the top of the launch vehicle that surrounds the spacecraftduring launch. Four minutes and 41 seconds after launch, the fairingwill split apart and be jettisoned into space, in preparation for thesecond stage rocket to position the spacecraft in its circular polar orbitand proper orientation towards the guide star, IM Pegasi.The official <strong>Gravity</strong> <strong>Probe</strong> B launch date is Monday, April 19, 2004 at10:01 AM Pacific Daylight Time, from Vandenberg Air Force Base inSouthern California.Yesterday, <strong>Gravity</strong> <strong>Probe</strong> B was the lead story in the Science section ofthe New York Times, (you'll need to register on the NY Times site toview the story on their Web site), and it was one of the front pagestories in the San Jose Mercury News. In addition, a story about <strong>GP</strong>-Bappeared on the New Scientist Web site yesterday.<strong>Gravity</strong> <strong>Probe</strong> B — <strong>Post</strong> <strong>Flight</strong> Analysis • Final <strong>Report</strong> March 2007 471
16 April 2004—Vehicle is Prepared for April 19LaunchInstallation of the payload fairing—the “nose cone” at the top of thelaunch vehicle that surrounds and protects the spacecraft duringlaunch has been completed. Four minutes and 41 seconds after launch,the fairing will split apart and be jettisoned into space, in preparationfor the second stage rocket to position the spacecraft in its circularpolar orbit and proper orientation towards the guide star, IM Pegasi.The launch vehicle, with its payload and fairing at the top, are stillsurrounded by the Mobile Service Tower (MST). Very early Mondaymorning, the MST will be rolled away, leaving the launch vehiclestanding in readiness as the launch countdown begins.Yesterday, the temperature of the dewar's main tank was 1.797K, andthe dewar was 95.5% full. The Guard Tank level was 76.6%.A <strong>Flight</strong> Readiness Review (FRR) was successfully conductedyesterday, and <strong>Gravity</strong> <strong>Probe</strong> B is “Go” for launch.Today, <strong>Gravity</strong> <strong>Probe</strong> B Co-Principal Investigator, John Turneaure,was interviewed by Ira Flatow on NPR Talk of the Nation—ScienceFriday. This Sunday evening, April 18th, a feature story about <strong>Gravity</strong><strong>Probe</strong> B and principal investigator, Francis Everitt, is scheduled to airon ABC World News Tonight.C.2 <strong>GP</strong>-B Launch: 4/19/04 – 4/20/0419 APRIL 2004—GRAVITY PROBE B LAUNCHPOSTPONED FOR 24 HOURSA launch hold was called three minutes before the scheduled liftoff ofthe <strong>Gravity</strong> <strong>Probe</strong> B spacecraft. Marginal upper level wind conditionshad been observed throughout the countdown, and there wasinsufficient time to confirm that the Delta II rocket had the correctwind profile loaded for the data from the final weather balloon. Thelaunch of <strong>Gravity</strong> <strong>Probe</strong> B has been re-scheduled for tomorrow(Tuesday), April 20, 2004 at 9:57 AM Pacific Daylight Time, fromVandenberg Air Force Base in South-central California. The <strong>GP</strong>-Bsatellite has only a one-second launch window. Why a one-secondlaunch window? Find out on our FAQ Page.Following the launch on the Internet: The launch was Webcast onNASA Direct, as well as on NASA TV on the Web. To view NASADirect, see http://www.ksc.nasa.gov/nasadirect/index.htm. Forinformation about viewing NASA TV on the Web, using either theReal Player or Windows Media Player, seehttp://www.nasa.gov/multimedia/nasatv/index.html. You'll find a listof alternate sources of NASA TV on the Web athttp://www.nasa.gov/multimedia/nasatv/MM_NTV_Web.html.Another very comprehensive source of information is the SpaceflightNow Web site:http://www.spaceflightnow.com/delta/d304/status.html.We will send out more updates as new information becomes available.20 APRIL 2004—GRAVITY PROBE B LAUNCHEDSUCCESSFULLY TODAY AT 9:57:24 AM PDT!At 9:57:24 AM PDT today, the <strong>Gravity</strong> <strong>Probe</strong> B spacecraft wassuccessfully launched from Vandenberg Air Force Base in SouthcentralCalifornia. The countdown went smoothly, and at the momentof launch, a packed auditorium here at <strong>Stanford</strong> University broke intocheers and applause.The launch is proceeding perfectly, exceeding all of our expectations.The initial visual images from the various tracking stations were heartwarmingand beautiful to behold—surpassed perhaps only by theextraordinary images from the two cameras on-board the secondstage, which showed the separation of the spacecraft from the launchvehicle more than 300 miles above the Earth.472 March 2007 Appendix C — Weekly Chronicle of the <strong>GP</strong>-B Mission
C.3 IOC Mission Phase: 4/21/04 – 8/26/0424 APRIL 2004—MISSION UPDATE: DAY 4At 9:57:24 am Pacific Daylight Time on Tuesday, April 20, 2004, the<strong>Gravity</strong> <strong>Probe</strong> B spacecraft had a picture-perfect launch fromVandenberg Air Force Base in South-central California. The BoeingDelta II rocket hit the exact center of the bull's eye in placing thespacecraft in its target polar orbit, 400 miles above the Earth.At approximately one hour eleven minutes, the spacecraft's solararrays deployed, and shortly thereafter, the on-board cameras treatedall viewers, via NASA TV, to the extraordinary sight of the separationof the spacecraft from the second stage rocket, with a portion of theEarth illuminated in the background.After three days in orbit, all <strong>Gravity</strong> <strong>Probe</strong> B systems are performing asplanned. The solar arrays are generating power, and all electricalsystems are powered on. The spacecraft is communicating well withthe Tracking and Data Relay Satellite System (TDRSS) and supportingground stations.All four Gyro Suspension Systems have now been activated. Inaddition, a lift check was successfully accomplished for gyros #2 and#3. This was the first ever levitation of a <strong>Gravity</strong> <strong>Probe</strong> B gyro on“orbit.”The spacecraft's Attitude Control System is maintaining initial attitudecontrol. Fine attitude control should be achieved when thrustercalibrations have been completed. After that, the ultra-precise sciencetelescope will be locked onto the <strong>Gravity</strong> <strong>Probe</strong> B guide star, IMPegasi, to within a range of 1/100,000th of a degree.The spacecraft is being controlled from the <strong>Gravity</strong> <strong>Probe</strong> B MissionOperations Center, located here at <strong>Stanford</strong> University. TheInitialization & Orbit Checkout (IOC) phase of the <strong>Gravity</strong> <strong>Probe</strong> Bmission is planned to last 45-60 days, after which the 12-monthscience data collection will begin.30 APRIL 2004—MISSION UPDATE: DAY 10<strong>Gravity</strong> <strong>Probe</strong> B’s many successes in its first week on orbit will ensurea smooth transition into the science phase of the mission and the bestpossible experimental accuracy.The spacecraft has already achieved a science mission orbit, within theplane of the Guide Star, IM Pegasi, and its inclination error is one sixthof that expected.In the quiet environment of space, the gyro readout system isperforming significantly better than it did during any ground testing.All four SQUIDs (Super-conducting Quantum Interference Devices)are fully functional and have detected calibration signals with highprecision. Noise levels are below the allowable mission requirements.<strong>Gravity</strong> <strong>Probe</strong> B — <strong>Post</strong> <strong>Flight</strong> Analysis • Final <strong>Report</strong> March 2007 473
The electrical power system is fully functional and is providingadequate power for all operating conditions. Eclipse operation (whenthe spacecraft is in the shadow of the Earth) meets all requirements.There is no evidence of solar array motion that might disturb theexperiment.All other spacecraft subsystems are fully functional. All four gyroshave been checked out and are performing well. They have all beenelectrically suspended in analog mode; digital suspension activities willcommence shortly. The team is in the process of updating data tablesfor the Gyro Suspension System (GSS) to aid in achieving digitalsuspension of the gyros.The spacecraft’s Attitude Control System (ATC) is maintaining astable attitude (relative position in orbit—pitch, yaw and roll). Weexpect to lock onto the Guide Star, IM Pegasi, within a few days, aftercompleting on-orbit re-calibration of the spacecraft’s 16 microthrusters. During thruster re-calibration, it was observed that one ofthe redundant micro thrusters was stuck partially open. It was isolatedand removed from the system, and the flow of helium to the remainingmicro thrusters has been adjusted to compensate for its removal.Overall, one week after launch, it appears that all of the spacecraft’ssubsystems are functioning well—meeting or exceeding missionrequirements, in preparation for beginning the science experiment.7 MAY 2004—MISSION UPDATE: DAY 17As of Mission Day #17, the <strong>Gravity</strong> <strong>Probe</strong> B spacecraft continues toperform well, and we are expecting a smooth and successful transitioninto the science phase of the mission.The spacecraft remains in a science mission orbit, within the plane ofthe Guide Star, IM Pegasi. The gyro readout system performancecontinues to exceed expectations, and all four SQUIDs (SuperconductingQuantum Interference Devices) are functional andcalibrated, with very low noise levels. Power and thermal systems meetall of our mission requirements. All spacecraft subsystems continue toperform nominally.All four gyros have been electrically suspended in analog mode, andgyros #1, #2 and #4 are now digitally suspended; we expect gyro #3 totransition from analog to digital suspension shortly.Last weekend, the spacecraft was hit by radiation while passing overthe Earth’s south magnetic pole. This radiation caused data errors inthe spacecraft’s primary (A-side) computer, which exceeded itscapacity for self-correction. Thus, by design, the spacecraftautomatically switched over to the backup (B-side) computer, placedthe spacecraft in a “safe” mode, and put the planned timeline of eventson hold.The automatic switch over from primary to backup computer workedflawlessly. The <strong>GP</strong>-B mission operations team has since re-booted theprimary computer, restored its data parameters, and then commandedthe spacecraft to switch back to the primary computer, which is onceagain in control. During this incident, the <strong>GP</strong>-B science instrumentcontinued to function perfectly—as expected—with all four gyrosremaining suspended in their assigned modes.The spacecraft’s Attitude Control System (ATC) is continuing tomaintain a stable attitude (relative position in orbit—pitch, yaw androll). However, the process of locking onto the Guide Star, IM Pegasi,has been delayed a few days by the South Pole radiation incident.14 MAY 2004—MISSION UPDATE: DAY 24As of Day #24 of the mission, all spacecraft subsystems are functioningproperly. The orbit is stable and meets our requirements for nextmonth’s transition into the science phase of the mission, uponcompletion of the spacecraft initialization and orbit checkout.Furthermore, <strong>Gravity</strong> <strong>Probe</strong> B has successfully achieved severalimportant milestones over the past week.All four gyroscopes have now been digitally suspended for over aweek. At launch, the gyros were unsuspended. Once on orbit, eachgyro was first suspended in analog mode, which provides coarsecontrol of the gyro’s suspended position within its housing. Analogmode is used primarily as a backup or safe mode for suspending thegyros. Each gyro was then suspended digitally. The digital suspensionmode is computer-controlled; it puts less torque on the gyros thananalog mode and enables their position to be controlled withextremely high precision.At the end of last week, the <strong>Gravity</strong> <strong>Probe</strong> B team practiced LowTemperature Bakeout (LTB), in which discs of sintered titanium (verytiny titanium balls, smaller than cake sprinkles) are “warmed up” a fewKelvin, thereby attracting helium molecules to them. This process willremove any remaining helium from the gyro housings after full gyrospin-up. Last week’s practice LTB procedure had the added benefit ofimparting a very small amount of spin-up helium gas to the gyros.Following the practice LTB, the SQUID gyro read-out data revealedthat gyro #1, gyro #3, and gyro #4 were slowly spinning at 0.001, 0.002,and 0.010 Hz, respectively (1 Hz = 60 rpm). Amazingly, the GyroSuspension Systems (GSS) were able to measure gas spin-up forces atthe level of approximately 10 nano-newton (10-8 N). This means thatthe <strong>GP</strong>-B science team is able to interpret data from gyro spin ratesfour to five orders of magnitude smaller than what was planned for the<strong>GP</strong>-B science experiment.Earlier this week, the <strong>GP</strong>-B spacecraft flew “drag-free” around gyro #1,maintaining translation control of the spacecraft to less than 500nanometers. The term, “drag-free,” means that the entire spacecraftliterally floats in its orbit—without any friction or drag—around onethe gyros. Pairs of proportional micro thrusters put out a steady andfinely controlled stream of helium gas, supplied by the dewar, throughits porous plug. Signals from the Gyro Suspension System (GSS)control the output of the micro thrusters, balancing the spacecraftaround the selected gyro. The initial drag-free Control (DFC)checkout lasted 20 minutes, as planned. Then, a two-hour DFC sessionwas tested, during which the spacecraft roll rate was increased andthen returned to its initial rate, maintaining drag-free statusthroughout the test. Achieving DFC indicates that we are on track tomeet the science mission control requirements.Last, but not least, early this week, the Attitude & Translation Controlsystem (ATC) successfully used data from the on-board star sensors topoint the spacecraft towards the guide star, IM Pegasi. This was thefinal step before initiating the dwell scan process, a series ofincreasingly accurate scans with the on-board telescope that enable theATC to lock onto the guide star. Two days ago, the telescope’s shutterwas opened, and a first dwell scan was completed. We are now in thefinal stages of repeating the dwell scan to home in on the guide starand lock onto it. Photo: ATC Engineers with the Attitude Controlsystem before it was placed on the spacecraft, circa May 2001.474 March 2007 Appendix C — Weekly Chronicle of the <strong>GP</strong>-B Mission
21 MAY 2004—MISSION UPDATE: DAY 31One month into the mission, all spacecraft subsystems are continuingto perform well. The spacecraft’s orbit remains stable and meets ourrequirements for next month’s transition into the science phase of themission, upon completion of the spacecraft initialization and orbitcheckout. The four gyroscopes are suspended, and we have indicationsthat they are rotating slightly in their housings.Last weekend, the team successfully performed a procedure to reducemagnetic flux that had built up around the gyroscope rotors (spheres).Magnetic flux is a measure of the number of magnetic field linespenetrating a surface. To ensure that the SQUID readouts receiveclean signals from the gyroscopes and to provide the highest possibledegree of accuracy during the <strong>GP</strong>-B science experiment, any magneticflux around the gyroscope rotors must be minimized.We reduce magnetic flux by turning on heaters and flowing heliumgas, warmed to 10 Kelvin, through the <strong>Probe</strong>. This process also drivesoff any residual helium remaining in the well of the dewar, where the<strong>Probe</strong> sits. The flux reduction procedure went smoothly, and when itwas completed, the level of trapped flux remaining within the gyroswas almost imperceptible. In fact, gyroscope #4, which previously hadthe highest amount of trapped magnetic flux of all the gyros now hasthe lowest level.The flux reduction procedure added heat to the dewar, therebyincreasing the pressure inside to its maximum allowable level. Theincreased pressure during this stress period caused some of thespacecraft’s micro thrusters to become unstable, resulting in thespacecraft pointing in the wrong direction and triggering a“safemode.”still on track for completion within 60 days after launch, at which timethe 13-month science data collection will begin. This will be followedby a two-month final calibration of the science instrument assembly.28 MAY 2004—MISSION UPDATE: DAY 38At five weeks past launch, the <strong>Gravity</strong> <strong>Probe</strong> B team is now about halfway through the Initialization and Orbit Checkout (IOC) phase of themission. Thus far, the team has successfully transmitted over 5,000commands to the spacecraft, which remains healthy on orbit. Allspacecraft subsystems are continuing to perform well. The spacecraft’sorbit is stable, meeting our requirements for next month’s transitioninto the science phase of the mission. All four gyros are now digitallysuspended, and the team is in the process of locking the on-boardtelescope onto the guide star, IM Pegasi.This past week, the team began spinning up the gyros. During thiscomplex and delicate process, which spans the entire second half ofIOC, each of the four gyros undergoes a series of spin-up and testingsequences, the first of which gets the gyros spinning—but at a veryslow speed. Because the correct performance of the gyros is critical tothe success of the experiment, the team is proceeding through thespin-up process slowly, painstakingly monitoring and checking theperformance of the gyros throughout the process.In preparation for spin-up, the digital suspension system for each gyrowas first tested. This was accomplished by suspending each gyro in thecenter of its housing, electrically “nudging” it slightly off center in oneof eight directions (the corners of a cube), and monitoring itsautomatic re-centering. This checkout was first performed under lowvoltage conditions (fine control) and then under high voltageconditions (secure hold). Photo: The Forward GSS unit prior toinstallation and flight, circa May 2001.To begin the actual spin-up process, ultra-pure helium gas was flowedover gyro #1 and gyro #4 for 15 seconds, which started them spinningat approximately 0.125 Hz (7.5 rpm). While these gyros were slowlyspinning, the suspension test was repeated under high voltageconditions on gyros #2 and #3. During this high voltage suspensiontest on gyro #3, the team discovered an error in its command template,which turned off the high voltage amplifier to gyro #1 and caused it tolose suspension. There was no damage to gyro#1.The 16 micro thrusters are arranged in clusters of four, and localfeedback loops within each cluster enable the thrusters tocommunicate with each other and automatically adjust their flowrates. Ground commands were issued to isolate the unstable thrusters,which resolved the thruster cross-talk issue and enabled the spacecraftto re-orient itself. The thrusters are now functioning properly, thespacecraft’s attitude has been corrected, and it is once again pointingtowards the guide star.The flux reduction operation and subsequent thruster instability andattitude problems has delayed locking the spacecraft onto the guidestar, which will be our next major activity. While we have used upsome of the contingency days built into the Initialization & OrbitCheckout (IOC) schedule, this phase of the <strong>Gravity</strong> <strong>Probe</strong> B mission isMore than 1,000 commands have now been sent to the GyroSuspension System (GSS), and this was the first error found.Discovering an error in these numerous, intricate command templateswas exactly the kind of situation that the painstaking gyro spin-upprocess was designed to identify; it enabled the team to correct thecommand template for gyro #3 without serious consequences. Also, asa further precaution, the team has thoroughly reviewed the commandtemplates for the remaining three gyros. Gyros #2 and #3 have nowbeen spun-up to 0.26 Hz (15 rpm) and 0.125 Hz (7.5 rpm) respectivelywithout incident, and gyro #1 is currently being spun-up, as well.Over the past week, much progress has been made towards the goal oflocking the spacecraft’s on-board telescope onto the guide star. Thepointing error of the spacecraft has been reduced to within 385 arcseconds(0.11 degrees). This allows the on-board telescope to see theguide star over a portion of a spacecraft roll cycle. The team is in theprocess of fine-tuning the spacecraft’s attitude by adjusting thenavigational gyroscope in the Attitude and Translation Control (ATC)system, so that the telescope will be able to see the guide starthroughout the entire spacecraft roll cycle, and the team hopes to lockonto the guide star by the beginning of next week.<strong>Gravity</strong> <strong>Probe</strong> B — <strong>Post</strong> <strong>Flight</strong> Analysis • Final <strong>Report</strong> March 2007 475
4 JUNE 2004—MISSION UPDATE: DAY 45After six weeks in orbit, the spacecraft continues to be healthy, with allsubsystems performing well. Over the past two weeks, with the arrivalof summer in the Northern Hemisphere, the spacecraft emerged frombeing partially eclipsed by the Earth each orbit to being in full sunlightcontinuously. The spacecraft's orbit is stable and meets ourrequirements for transition into the science phase of the mission. Allfour gyros remain digitally suspended, and all are spinning veryslowly. Progress in locking the on-board telescope onto the guide star,IM Pegasi, has been slower than anticipated, but this afternoon, asthese highlights were being posted, we achieved this importantmilestone.This past week, the team started performing a highly methodical andpainstaking series of calibration tests on the four science gyroscopes.These tests begin at very low gyro spin rates of 0.333 Hz (20 rpm) orless. This enables the team to exercise and check out the softwarecommand templates that control the tests, without risk of damage tothe gyro rotors or housings, which could occur at higher speeds. Weaccomplish these calibration tests by briefly applying voltagesasymmetrically to the suspension electrodes on a given gyro, causingthat gyro rotor (sphere) to move off center by a few micrometers (10-6meters) or less, and then re-centering it. Photo: A backlit housing halfof a gyroscope. The three oval shapes (at 1 o'clock, 5 o'clock and 9o'clock, on the picture) are where the electrodes are placed.During these initial calibration tests, the team discovered that theperformance characteristics of the gyros on orbit are slightly differentfrom the simulator predictions on which the original commandtemplates were based. As a result of these differences, during one ofthe initial tests, gyro #4 touched one of its electrodes and stoppedspinning. A simple modification to the spin-up command templates isnow in process. Once the on-orbit performance characteristics of eachgyro is well understood, the team will repeat these tests at graduallyincreasing spin rates.The team also exercised the Ultraviolet Discharge procedure to reducethe electrostatic charge, which builds up on the gyro rotors over time.The rotors build up a charge in two ways: first, the process ofsuspending the rotors electrically deposits some charged particles onthem, and second, protons from the sun are constantly bombardingthe spacecraft, especially over the South Atlantic Ocean-the so-called“South Atlantic Anomaly”- and some of these protons strike the rotorsand leave a residual charge on them.We use ultraviolet light to remove the build-up of electrostatic chargefrom the gyro rotors. Each gyro housing is fitted with fiber optic cablesthat run from the gyro housings, up through the top hat of the <strong>Probe</strong>and out to an ultraviolet light source in the Experiment Control Unit(ECU) box, mounted on the spacecraft frame. UV light is beamedthrough the fiber optics onto the gyro rotors to discharge them.Reducing the level of charge is important because it increases thesensitivity and accuracy of the Gyroscope Suspension System (GSS).11 JUNE 2004—MISSION UPDATE: DAY 52On its 52nd day in orbit, the spacecraft continues to be in good health,with all subsystems performing very well. The spacecraft’s orbit, whichwill remain in full sunlight through August, is stable and meets ourrequirements for transition into the science phase of the mission. Allfour gyros are digitally suspended and have passed several very slowspeedcalibration tests. Furthermore, the science telescope is lockedonto the guide star, IM Pegasi, and we have verified that it is lockedonto the correct starOver the past two weeks, through a combination of softwaremodifications, revised procedures, and commands sent directly to thespacecraft, considerable progress has been made in adjusting theAttitude and Translation Control system (ATC) to properly maintainthe spacecraft’s attitude (pitch, yaw, and roll) in orbit. The ATCsystem accomplishes this important job by controlling the flow ofhelium gas, continually venting from the dewar, through thespacecraft’s micro thrusters. This system is critical to the success of themission because it maintains the required roll rate of the spacecraft, itkeeps the spacecraft and science telescope pointed at the guide star,and it keeps the spacecraft in a drag-free orbit. Thus, the team isparticularly gratified to now have the ATC functioning reliably, withthe science telescope locked onto IM Pegasi.The process of locking the science telescope onto IM Pegasi startedwith star trackers on either side of the spacecraft locating familiarpatterns of stars. Feedback from the star trackers was used to adjustthe spacecraft’s attitude so that it was pointing to within a few degreesof the guide star. The telescope’s shutter was then opened, and a seriesof increasingly accurate “dwell scans” was performed to home in onthe star. Since the spacecraft is rotating along the axis of the telescope,imbalance in the rotation axis can cause the guide star to move in andout of the telescope’s field of view. Feedback from the telescope wassent to the ATC system, which adjusted the spacecraft’s attitude untilthe guide star remained focused in the telescope throughout multiplespacecraft roll cycles. The ATC was then commanded to “lock” ontothe guide star. Photo: The <strong>GP</strong>-B Star Tracker before installation ontothe spacecraft, circa April 1999.Finally, to verify that the telescope was locked onto the correct guidestar, the micro thrusters were used to point the spacecraft/telescope ata known neighboring star, HD 216635 (SAO 108242), 1.0047 degreesabove IM Pegasi. When the telescope was pointed at this location, theneighboring star appeared with anticipated brightness, and there wereno other stars in the immediate vicinity. Thus, the sighting of the star,HD 216635, confirmed the correct relationship between the locationsof the two stars, ensuring that the telescope is indeed locked onto thecorrect guide star. In addition, the telescope has also seen the star HRPeg (HR 8714), a brighter and redder star, located less than half adegree to the left of IM Pegasi.This past week the team continued performing calibration tests of allgyros, spinning at less than 1 Hz (60 rpm). In addition, the teamsuccessfully tested a back-up drag-free mode of the spacecraft withthree of the gyros for an entire orbit, and, more significantly, the teamcompleted its first successful test of the primary drag-free mode sincere-configuring the micro thrusters, using gyro #3.In primary drag-free mode, the Gyro Suspension System (GSS) isturned off on one of the gyros, so that no forces are applied to it. TheATC uses feedback from the position of this gyro in its housing to“steer” the spacecraft, keeping the gyro centered. Back-up drag-freemode is similar, but in this case the GSS applies very light forces on thegyro to keep it suspended and centered in its housing. The ATC usesfeedback from the GSS to “steer” the spacecraft so that the GSS forcesare nullified or canceled, thereby keeping the gyro centered. Applyingforces with the GSS to suspend the drag-free gyro adds a very small,but acceptable, amount of noise to the gyro signal, and thus, eitherprimary or back-up drag-free mode can be employed during thescience experiment. Upcoming milestones include maintaining thespacecraft in a drag-free orbit, and beginning gyro calibration tests atspin rates of up to 5 Hz (300 rpm).476 March 2007 Appendix C — Weekly Chronicle of the <strong>GP</strong>-B Mission
18 JUNE 2004—MISSION UPDATE: DAY 59Just under two months into the mission, the spacecraft is in goodhealth, and all subsystems are performing well. The spacecraft’s orbitcontinues to be stable, meeting our requirements for transition intothe science phase of the mission. All four gyros remain digitallysuspended, and we are completing the planned series of calibrationtests at very low gyro spin rates. The science telescope remains lockedonto the guide star, IM Pegasi, and we are beginning the process ofdistributing and balancing the mass of the spacecraft at increased rollrates, as required for the science mission. For reasons discussed below,the Initialization and Orbit Checkout (IOC) phase of the mission hasbeen extended to 90 days.This past week, the team increased the roll rate of the spacecraft from0.1 rpm to 0.3 rpm, in preparation for “mass trim” and “bubble wrap.”These procedures are used to bring the entire spacecraft into balanceso that it rolls smoothly about its main axis, while continuing to focuson the guide star through the telescope. The mass trim operation issimilar to dynamically spin balancing a tire, using movable weights onthe spacecraft frame under computer control to adjust the spacecraft’scenter of mass. Bubble wrap is the process of uniformly distributingthe liquid helium around the dewar’s outer shell. We will accomplishthis by increasing the roll rate of the spacecraft in steps, from 0.3 rpmto 0.6 rpm.Also during this past week, the spacecraft/telescope re-visited guidestar neighbor HD 216635 (SAO 108242) as well as guide star neighborHR Peg (HR 8714), for further testing and brightness calibration.Last Saturday, the team was honored to have NASA AdministratorSean O’Keefe, Alaska Senator Ted Stevens, and some of their staffmembers visit the <strong>GP</strong>-B facilities here at <strong>Stanford</strong> University. The visitbegan with brief presentations by <strong>GP</strong>-B NASA Program Manager, RexGeveden from Marshall Space <strong>Flight</strong> Center, Principal InvestigatorFrancis Everitt, and <strong>Stanford</strong> Program Manager Gaylord Green. Next,the group viewed a display of spare flight gyroscopes, the flighttelescope, and other hardware and then toured the MissionOperations Center (MOC), talking with members of the <strong>GP</strong>-BOperations team who were on duty and observing them in action.While the visitors were watching, the MOC received data relayed fromthe spacecraft through the Tracking Data Relay Satellite System(TDRSS) to the ground tracking station at White Sands, New Mexico,as the guide star returned to view in the telescope during a validationcheck.Another important event this past week was using the results of priorgyro calibration tests to fine-tune the Gyro Suspension System (GSS)for each gyro. This significantly improved the suspension performanceof all the gyros, especially gyro #2. Parameters are now in place forspinning up the gyros to 5 Hz (300 rpm).We have received several email inquiries about how the spin rate ofthe gyroscopes is determined in orbit. It is determined using theSQUIDs. Even though the gyros are currently spinning very slowly,there is enough trapped magnetic flux on the gyro rotors for the<strong>Gravity</strong> <strong>Probe</strong> B — <strong>Post</strong> <strong>Flight</strong> Analysis • Final <strong>Report</strong> March 2007 477
SQUIDs to detect their rotation speed to an accuracy of 10 millionthsof a Hertz. Because the measurement is made between the gyro rotorsand their housings, and because the gyro housings are connected tothe spacecraft itself, the roll rate of the spacecraft was also measuredusing the gyros. In fact, two of the gyros spin in the same direction asthe spacecraft roll, and two spin against the roll. Thus, as the roll rateof the spacecraft was increased, two of the gyros appeared to spinfaster, and two appeared to slow down in accordance with theincreased roll rate. Photo: The gyro housing and SQUID lines underinspection during repairs of the Science Instrument Assembly, circaAugust 2000.As chronicled in previous weekly updates, two difficulties—now bothovercome—have made the task of locking onto the guide star takelonger than anticipated, and as a result, the IOC phase of the missionhas been extended from 60 to 90 days. First, the side-facing startrackers on the spacecraft required an extended search period toproperly identify the known field of stars. Feedback from these startrackers is used to orient the spacecraft in the vicinity of the guide star,similar to using a spotting telescope to position a high-poweredtelescope on a particular part of the sky. The second is frommalfunction of two of the spacecraft’s 16 ultra-sensitive microthrusters. Redundancy built into the system enables the spacecraft tofly without the two problematic thrusters, but to optimizeperformance with 14 instead of 16 thrusters, it was necessary to revisethe control software. This software change has now beenimplemented, and after a <strong>Flight</strong> Readiness Review on June 25, 2004, itwill be uploaded to the spacecraft. At a later stage, we will explorepartial re-activation of the two problematic thrusters.25 JUNE 2004—MISSION UPDATE: DAY 66On Day# 66 of the mission, the spacecraft continues to be in goodhealth, with all subsystems performing well. The spacecraft’s orbitremains stable, ready for transition into the science phase of themission. All four gyros remain digitally suspended, and finalcalibration tests at very slow gyro spin rates of up to 1 Hz (60 rpm)have been completed. The spacecraft’s roll rate has been incrementallyincreased from 0.3 to 0.9 rpm, as part of the process of uniformlydistributing and balancing the mass of the spacecraft. Following a<strong>Flight</strong> Readiness Review currently in progress, we will begin uploadingrevised drag-free thruster-control software to the Attitude andTranslation Control system (ATC) on-board the spacecraft over theweekend.This past week, we completed the last of a series of very low spin ratecalibration tests on the gyros and the gyro suspension system (GSS).As described in previous highlights, these tests involve briefly applyingvoltages asymmetrically to the suspension electrodes on a given gyro,causing that gyro rotor (sphere) to move off center by a few millionthsof a meter and then re-centering it. We also tested the GSS bymeasuring the level of electrostatic charge on each gyro rotor afterapplying 20% higher than normal suspension voltages to thesuspension electrodes, with the gyro rotors in spin-up position. Noneof the rotors showed a significant charge build-up after this procedure,which indicates that the GSS is functioning as anticipated.Additionally this past week, we continued with two proceduresdesigned to bring the entire spacecraft into balance, rolling smoothlyabout its main axis while the telescope focuses on the guide star. In thefirst procedure, called “bubble wrap,” the spacecraft’s roll rate wasincreased in incremental steps, from 0.3 rpm to 0.9 rpm. The increasedroll rate begins to rotate the liquid helium, effectively pushing itoutwards as it tries to move in a straight line with its inertia. Thedewar walls hold it in with a centripetal force. This wraps the heliumuniformly around the outer shell. Distributing the liquid heliumuniformly along the spacecraft’s roll axis helps to ensure that thescience telescope can remain locked on the guide star while thespacecraft is rolling.Some people might think this is centrifugal force. One might ask, whatis the difference between centripetal and centrifugal force, anyway?The words centripetal and centrifugal are in fact antonyms defined asfollows:centrifugal: tending to move away from a center.centripetal: tending to move toward a center.In the second procedure, called “mass trim,” weights mounted on longscrew shafts are attached in strategic locations around the spacecraftframe. Small motors, under control of the spacecraft’s ATC, can turnthese screw shafts in either direction, causing the weights to moveback and forth by a specified amount. Thus, based on feedback fromthe GSS, the spacecraft’s center of mass can be precisely centered, bothforward to back, and side to side, around the designated “drag-freegyro.”Finally, revisions to the spacecraft’s drag-free thruster-controlsoftware that will optimize the spacecraft’s performance, using 14instead of 16 micro thrusters, passed a design review last week. A<strong>Flight</strong> Readiness Review is currently in progress to approve theuploading of this updated software to the spacecraft this weekend.Next week, the ATC will be re-started using the new software. The 16micro thrusters are arranged 4 clusters, with each cluster having twopairs of thrusters. Redundancy built into the thruster system enablesthe spacecraft to meet the attitude control requirements for the sciencemission with only 12 functioning micro thrusters. In the event of athruster problem, the original thruster-control software was designedto isolate both the malfunctioning thruster and its paired partner. Therevised software now enables individual micro thrusters to be isolatedin any thruster pair, without affecting the paired partner. Of the 14micro thrusters currently functioning, only two are critically located,478 March 2007 Appendix C — Weekly Chronicle of the <strong>GP</strong>-B Mission
and if these two were both to malfunction, it is still possible to operatethe thruster system by partially opening the valves in the isolatedthrusters.Once the revised thruster-control software is up and running, thehelium bubble is wrapped, and the spacecraft’s mass has beentrimmed, we will lock onto the guide star, IM Pegasi, in a drag-freeorbit, in preparation for the science mission.2 JULY 2004—MISSION UPDATE: DAY 73At a little over ten weeks into the mission, the spacecraft is in excellenthealth, with all subsystems performing well. The spacecraft’s orbitremains stable, ready for the transition into the Science Phase. All fourgyros are digitally suspended and have completed calibration testing atapproximately 0.3 Hz (18 rpm) spin rates. Two problematic microthrusters, which were preventing the spacecraft from sustaining adrag-free orbit, have been isolated, and the thruster-control softwarewas modified to optimize Attitude and Translation Control system(ATC) functionality without them. Over the past two weeks, thespacecraft’s roll rate was increased from 0.3 rpm to 0.9 rpm as part ofthe process of uniformly distributing and balancing the mass of thespacecraft.During this past week, we completed the mass trim procedure at 0.9rpm, using movable weights on long screw shafts to alter thespacecraft’s center of mass from front to back and from side to side.The mass trim operation is necessary to precisely align the spacecraft’sroll axis so that it passes through the centers of the gyros and thetelescope’s line of sight. The mass trim procedure also balances themass of the spacecraft so that it rolls smoothly around this axis.Also, this past week, we decreased the spacecraft’s roll rateincrementally from 0.9 rpm back to 0.5 rpm. During the first rolldowndecrement to 0.7 rpm, we discovered that the distribution of theliquid helium in the dewar is less predictable during roll-down than itis during roll-up. When the spacecraft’s roll rate is slowed too quickly,the liquid helium begins to slosh around. The resulting displacementof the center of mass from the sloshing helium affects the microthrusters, resulting in a significant increase in the time required tocomplete the roll-down.Last weekend, in preparation for optimizing ATC performance with14 instead of 16 micro thrusters, we uploaded revised drag-freethruster-control software to the on-board computer. After completingthe mass trim maneuver and stabilizing the spacecraft at the 0.5 rpmroll rate, we re-booted the on-board computer with the revisedsoftware. The re-boot went very smoothly, and a checkout of the newsoftware confirms that the two problematic thrusters are isolated andreceiving no helium, while the remaining 14 thrusters are respondingto commands as expected. With the new software up and running, wehave begun successfully testing both primary and backup drag-freemodes around gyro #1.Meanwhile, gyro #1 and gyro #3 are currently in the process of beingspun up to 3 Hz (180 rpm), and likewise, gyros #2 and #4 will be spunup to 3 Hz next week. Over this weekend, the team will also re-lock thescience telescope on the guide star, IM Pegasi, with the spacecraftrolling at 0.5 rpm and balanced along the telescope’s axis of sight.Before we begin calibration testing of the gyros at a spin rate of 3 Hznext week, our goal is to have the spacecraft rolling smoothly at 0.5rpm, locked onto the guide star, and in a drag-free orbit around one ofthe gyros. Photo: A picture of a gyro rotor before coating, beingmeasured for roundness many years ago.9 JULY 2004—MISSION UPDATE: DAY 80After 80 days in orbit, the spacecraft remains in excellent health, andall subsystems are continuing to perform well. All four gyros aredigitally suspended and are currently spinning at approximately 3 Hz(180 rpm). Two weeks ago, the on-board computer was re-booted witha new version of the drag-free thruster-control software to workaround two problematic micro thrusters that were isolated and takenout of service shortly after launch. The new software optimizes theperformance of the Attitude and Translation Control system (ATC)using 14, instead of 16 micro thrusters, and it has been performing asexpected since the re-boot. The spacecraft is flying drag-free aroundgyro #1, at a roll rate of 0.52 rpm, with the science telescope lockedonto the guide star, IM Pegasi. We are now entering the home stretchof the Initialization and Orbit Checkout (IOC) phase of the mission.On Saturday, July 3rd, we re-locked the science telescope on the guidestar, IM Pegasi, with the spacecraft rolling at 0.5 rpm. The spacecraftremained locked on the guide star throughout the 4th of July weekend.This past week, we continued testing and optimizing ATCperformance in both primary and backup drag-free modes. Based onthis testing, we have selected back-up drag-free as the nominal modefor the science phase of the mission. In back-up drag-free mode, theGyro Suspension System (GSS) applies very light forces on the gyro tokeep it suspended and centered in its housing. The ATC uses feedbackfrom the GSS to “steer” the spacecraft so that the GSS forces arenullified or canceled, thereby keeping the gyro centered. Applyingforces with the GSS to suspend the drag-free gyro adds a very smallamount of noise to the gyro signal, but this noise is negligible, and it isoutweighed by the added stability that has been demonstrated in ourtests over the past few weeks. This increased stability is due to the factthat the back-up mode uses both the micro thrusters and the GSS tocounteract drag on the spacecraft, whereas the primary mode reliessolely on the micro thrusters to create a drag-free orbit.Yesterday, the roll rate of the spacecraft was slightly increased from0.50 to 0.52 rpm, in preparation for the transition into the sciencephase of the mission. This slightly higher roll rate was chosen based onATC and SQUID readout performance, as well as the requirement thatthe science phase roll rate should not be a harmonic of either orbit orcalibration frequencies. We are in the process of evaluating whether ornot further mass trim operations will be needed for the science phaseof the mission.On Friday, July 2nd, we successfully spun-up gyros #1 and #3 to 3 Hz(180 rpm), by streaming ultra-pure helium gas through their spin-upchannels for 90 seconds each. This past Tuesday and Wednesday, July6th and 7th, we followed suit with gyros # 2 and #4. Note that wecannot control the exact spin rate of the gyro rotors (spheres). Rather,we control the length of time that ultra-pure helium gas flows throughthe spin-up channel for each gyro, and then the SQUID readouts tellus the resulting spin rates—which may differ slightly from one gyro toanother. Pending a final review meeting this afternoon, tomorrowmorning, we are planning to stream helium gas over the gyro #4 rotorfor another 90 seconds, thereby increasing its spin rate toapproximately 6 Hz (360 rpm). Then, after performing a number oftests to ensure that gyro #4 and its suspension system are functioningproperly, tomorrow afternoon, we plan to spin up this gyro to fullspeed by streaming ultra-pure helium over its rotor for approximately90 minutes. We anticipate that the final spin rate of the gyro #4 rotorwill be between 120 Hz (7,200 rpm) and 170 Hz (10,200 rpm). We willthen monitor the performance of gyro #4 for several days beforespinning up the remaining gyros to full speed.<strong>Gravity</strong> <strong>Probe</strong> B — <strong>Post</strong> <strong>Flight</strong> Analysis • Final <strong>Report</strong> March 2007 479
17 JULY 2004—MISSION UPDATE: DAY 88At just under 3 months in orbit, <strong>Gravity</strong> <strong>Probe</strong> B is nearing the end ofthe Initialization and Orbit Checkout (IOC) phase of the mission. Thespacecraft remains in excellent health, and all subsystems arecontinuing to perform well. All four gyros are digitally suspended,with gyros #2 and #4 spinning at science mission speed—greater than80Hz (4,800 rpm)—and gyros #1 and #3 spinning at approximately 1.5Hz (90 rpm), ready for full-speed spin-up. The updated drag-freethruster control software that was uploaded to the spacecraft threeweeks ago to optimize performance of the Attitude and TranslationControl system (ATC) is continuing to perform nominally. Thespacecraft’s roll rate is 0.52 rpm, and the science telescope is being relockedonto the guide star, IM Pegasi, following the full-speed spin-upof gyro #2 yesterday.This past Tuesday, July 13th, <strong>Gravity</strong> <strong>Probe</strong> B achieved a majormilestone with the successful spin-up of gyro #4 to a science-readyspeed of 105.8 Hz (6,348 rpm). Second to the launch, the full-speedspin-up of the gyros has been the next most long-awaited event in thehistory of <strong>GP</strong>-B. Members of the team were very attentive at theirstations in the Mission Operations Center (MOC) here at <strong>Stanford</strong> for3 hours and broke into applause when the final announcementboomed over the MOC intercom that the gyro #4 full spin-up hadbeen completed successfully.Yesterday, July 16th, gyro #2 underwent the same spin-up procedure,reaching a final spin rate of 87 Hz (5,220 rpm). Spinning up the gyrosto science-ready speed is a complex and dynamic operation thatexercises the full capabilities of the Gyro Suspension System (GSS) andrequires a high level of concentration and coordination on the part ofthe <strong>GP</strong>-B Team. Following is an overview of the process.First, commands are sent to the GSS to move the gyro rotor (sphere)very close to the spin-up channel (about 1/100th of the edge of a sheetof paper) in one half of the gyro’s housing. Ultra-pure (99.99999%)helium gas is streamed from the Gas Management Assembly (GMA),mounted in a bay on the spacecraft frame, through tubing that entersthe “top hat” (the thermal interface at the top of the <strong>Probe</strong>) and travelsdown to the gyro housings in the Science Instrument Assembly (SIA)at the bottom of the <strong>Probe</strong>. As the helium gas descends into the <strong>Probe</strong>,which is at a temperature of approximately 1.8 Kelvin, the gas coolsdown from 273 Kelvin to around 12 Kelvin.Before entering the spin-up channel in one of the gyro housings, thegas is passed through a combination filter/heater. The filter, which ismade of sintered titanium, removes any impurities that may have beenimparted to the helium on its journey into the <strong>Probe</strong>. The heaterenables the helium to be warmed slightly, which increases its adhesionto the ultra-smooth surface of the gyro rotor. The filtered and warmedhelium then passes through the spin-up channel in one half of the gyrohousing, and most of the gas evacuates into space through an exhaustsystem. However, some of the helium leaks into the housings of theother gyros, causing their spin rates to decrease up to 20% over a fullspin-up period of 2-3 hours.480 March 2007 Appendix C — Weekly Chronicle of the <strong>GP</strong>-B Mission
For this reason, the order in which the gyros are spun up is veryimportant. Earlier in the IOC phase, the 3 Hz (180 rpm) spin-upprovided information on the helium leakage rate of each gyro. Gyro#4, which had the highest leakage rate, was spun-up to full speed first,so that helium leaked from its spin-up would not affect other gyrosthat were already at science mission speed. The remaining gyros arethen spun-up in decreasing order of their helium leakage rates—gyro#2, gyro #1, and finally, gyro #3.Each full-speed spin-up takes most of a day. In the morning, heliumgas is flowed over the gyro for 90 seconds, and tests are run to ensurethat the helium leakage rate for that gyro corresponds to previousmeasurements. If everything checks out, the full-speed spin-up, inwhich helium gas is flowed over the rotors for 2-3 hours, commencesearly in the afternoon. The <strong>GP</strong>-B team controls the spin-up process bysending commands from the Mission Operations Center (MOC) hereat <strong>Stanford</strong> to the spacecraft in real-time. For example, they sendcommands to open or close the GMA valves to flow helium throughthe gyro’s spin-up channel. They also control the amount of heatapplied to the gas before it enters the gyro spin-up channel, and theycontrol opening and closing of exhaust valves. Real-time telemetryprovides immediate feedback on the progress of the spin-up so thatvarious parameters can be adjusted as necessary.The successful spin-up of gyro #4 to full speed enabled us to spin-upgyro #2. Gyro #2 topped out at 87 Hz (5,220 rpm), which is onlyslightly above the minimum spin rate of 80 Hz (4,800 rpm) requiredfor the science experiment. Also, the helium gas leakage from the Gyro2 spin-up slowed gyro #4 down to 91Hz (5,460 rpm). We are takingsome time to evaluate the data from the first two spin-up proceduresand to perform some ground-based tests before spinning up gyros #1and #3 to full speed.Meanwhile, we are fine-tuning the drag-free software used by theAttitude and Translation Control system (ATC) to optimize itsperformance at the current and final spacecraft roll rate of 0.52 rpm.For part of each orbit, the spacecraft passes behind the Earth, causingthe telescope to lose visual contact with the guide star. During this“eclipse” period, two standard external rate gyroscopes, plus the startrackers on either side of the spacecraft, enable the ATC to keep thespacecraft/telescope pointed towards the guide star. When thespacecraft emerges over the North Pole and the guide star becomesvisible again, the telescope must be re-locked onto it. This re-lockinghas been taking up to 15 minutes, and the fine-tuning will speed upthis process considerably.23 JULY 2004—GRAVITY PROBE B MISSIONUPDATE: Day 94One day #94 of the mission, <strong>Gravity</strong> <strong>Probe</strong> B is poised to enter thehome stretch of the Initialization and Orbit Checkout (IOC) phase ofthe mission. The spacecraft is in excellent health, and all subsystemsare continuing to perform well. All four gyros are digitally suspended,with gyros #2 and #4 spinning at science mission speed—greater than80Hz (4,800 rpm). Gyros #1 and #3 are spinning at less than 1.5 Hz (90rpm) and are ready for full-speed spin-up next week. Fine-tuning ofthe Attitude and Translation Control system (ATC) is still in progress,and the ATC is performing well. The spacecraft’s roll rate is 0.52 rpm,and the science telescope is locked onto the guide star, IM Pegasi.Last Friday, the full-speed spin-up of gyro#2 went smoothly, with afinal spin rate of 87 Hz (5,220 rpm). Helium gas leakage from the spinupof gyro #2 caused gyro #4 to slow down from 105.8 Hz (6,348 rpm)to 91 Hz (5,460 rpm). We had hoped that gyro #2 would achieve a spinrate above 100 Hz (6,000 rpm), with less leakage effect on gyro #4.Thus, rather than spinning up gyros #1 and #3 as originally planned,we spent the past week doing analysis and running tests—both on thespacecraft and here at <strong>Stanford</strong>—in order to ensure that the upcomingspin-up of gyros #1 and #3 will result in higher speeds, with lessleakage effect on the remaining gyros.The spin rate of the gyros during the Science Phase of the missionaffects the signal-to-noise ratio in the SQUID readouts of theexperimental data. The noise level is quite small, but constant. Thehigher the gyro spin rate, the larger the London moment (magneticfield created by a spinning superconductor), and thus, the greater thesignal-to-noise ratio. In ground testing prior to launch, we determinedthat a spin rate of 80 Hz (4,800 rpm) or greater for each gyro wouldprovide a good signal-to-noise ratio for the science mission. However,the threshold of 80 Hz (4,800) rpm is not a hard and fast limit, so if thefinal spin rate of one or more gyros falls slightly below this value, thiswill not appreciably compromise the science data.One way to potentially increase the spin-up rate of the remaining twogyros, while reducing the amount of helium gas leakage during spinupis to use the Gyro Suspension System to position the gyro rotorscloser to the spin-up channel in the gyro housing. Tests and analysisperformed this past week indicate that we can move the rotors of gyros#1 and #3 up to 30% closer to the spin-up channels than gyros #2 and#4, and still have a safe margin of clearance from the suspensionelectrodes and the gyro housings. We have also determined thatopening a second exhaust valve during spin-up may help to reduce thepressure in the <strong>Probe</strong> caused by helium leakage, thereby reducing thespin-down effects on the remaining gyros. Both of these changes willbe implemented in the spin-up of gyros #1 and #3 next week.Also, this past week, we continued fine-tuning the drag-free softwareused by the Attitude and Translation Control system (ATC) tooptimize its performance at the current and final spacecraft roll rate of0.52 rpm. Tests from parameter changes we made to the ATC systemindicate that we have reduced the time it takes to re-lock onto theguide star from as much as 15 minutes to less than 2 minutes.31 JULY 2004—GRAVITY PROBE B MISSIONUPDATE: Day 102<strong>Gravity</strong> <strong>Probe</strong> B successfully accomplished a major milestone thisweek as the final two gyroscopes were spun up to high spin speed. Allfour gyros are now spinning at high spin speed. The spacecraft is inexcellent health, and all subsystems are continuing to perform well.With this major accomplishment behind us the Program is enteringthe home stretch of the Initialization and Orbit Checkout (IOC) phaseof the mission.This week's high speed spin-up operations were performed on gyro #3(Tuesday) and gyro #1 (Friday). There were no anomalies during thespin up. The SQUID readout FFT tracked the spin up in real-time. Asexpected, the other gyros spun down approximately 15% with eachhigh speed spin-up operation due to pressurization of the <strong>Probe</strong>caused by gas leakage during the spin-up. Final spin speeds of thegyros are now: gyro #1 (80.0 Hz - 4800 rpm), gyro #2 (62.3 Hz - 3738rpm), gyro #3 (82.7 Hz - 4962 rpm) and gyro #4 (65.5 Hz - 3930 rpm).At these spin speeds, <strong>GP</strong>-B’s relativity measurement is expected to besignificantly better than specification. Therefore, no further gyro highspeed spin-up operations are planned.Fine-tuning of the Attitude and Translation Control system (ATC) isnearly complete, and the ATC is performing well. This past week, wecontinued fine-tuning the drag-free software used by the ATC tooptimize its performance at the current spacecraft roll rate of 0.52rpm. Tests from parameter changes we made to the ATC system<strong>Gravity</strong> <strong>Probe</strong> B — <strong>Post</strong> <strong>Flight</strong> Analysis • Final <strong>Report</strong> March 2007 481
indicate that we have reduced the time it takes to re-lock onto theguide star from as much as 15 minutes to less than a minute. We havealso increased the number of reference stars seen by the star trackerfrom 3 to 8.Next week we will be performing a few final operations prior tobeginning taking science data. The most significant operation left to beperformed is the spin axis alignment of each gyro. This is performedusing the Gyro Suspension System in a special oscillation mode toslowly align each gyro spin axis to be in nearly perfect alignment withthe guide star. Having the gyros aligned at the beginning of themission makes any precession caused by general relativity simpler tomeasure. We are nearly complete aligning the spin axis of gyros #2 and#4 and plan to align #3 and #1 next week. Another operation for nextweek is to perform a final bake-out operation to remove any residualhelium molecules from around the gyros. This operation is performedby heating up the instrument area slightly (to approximately 6 degreesKelvin), which will cause residual helium to migrate to a collectordevice in the <strong>Probe</strong>. And finally, the final operation prior to science isto command the spacecraft to begin drag-free operations.6 AUGUST 2004—GRAVITY PROBE B MISSIONUPDATE: DAY 108<strong>Gravity</strong> <strong>Probe</strong> B has nearly completed the Initial On-Orbit CalibrationPhase of the Mission. Last week we completed the fast speed spin-upof all four gyros. This week we completed the low temperature bakeoutof the <strong>Probe</strong> and expect to complete spin axis alignment of the finaltwo gyroscopes this weekend. Prior to starting the Science Phase of theMission, we decided to increase the roll rate of the spacecraftfrom.52rpm to .75rpm which will improve the accuracy of theexperiment and minimize the risk of achieving a good measurement inthe event of a shortened mission. We plan to increase the roll rate earlynext week. At that point we will transition to the Science Phase of themission.The low temperature bakeout operation was done in order tominimize the pressure inside the vacuum probe. The resulting lowpressure, or ultra-high vacuum, is required to minimize the spindownrate and torques on the gyroscopes. The low temperature bakeoutprocess involved heating the <strong>Probe</strong> to approximately 6-7 degreesKelvin while the <strong>Probe</strong> was open to the vacuum of space. This allowedexcess helium gas to escape to space. The probe was then closed tospace and the heaters turned off. The probe temperature then returnedto its nominal value and the remaining helium was adsorbed into thecryopump. The cryopump is a passive device made of sinteredtitanium, which has a very large adsorbing area. <strong>GP</strong>-B’s lowtemperature bakeout process created pressure inside the vacuumprobe less than one thousandth that of space.We continued to perform spin axis alignment of the gyroscopes thisweek. This is performed using the Gyro Suspension System in a specialoscillation mode to slowly align each gyro spin axis to be in nearlyperfect alignment with the guide star. Having the gyros aligned at thebeginning of the mission makes any precession caused by generalrelativity simpler to measure. Thus far, we've completed the alignmentof gyro #1 and #2. Gyro's #3 and #4 should be completed this weekend.After much analysis and discussion this week we decided to increasespacecraft roll rate during the science mission from .52 rpm to .75rpm. A .75 rpm roll rate minimizes the risk of events which mightoccur that could cause degradation to the accuracy of the mission. Inaddition, by combining the factors that influence gyro accuracy andguide star acquisition, this relatively small increase in roll rate shouldproduce a ~20% improvement in the overall accuracy of theexperiment. We expect to perform this operation beginning Monday.Assuming success, we then will begin drag-free operation with thestart of the Science Mission Phase later next week.13 AUGUST 2004—GRAVITY PROBE B MISSIONUPDATE: DAY 115On day #115 of the mission, <strong>Gravity</strong> <strong>Probe</strong> B is within a week ofcompleting Initialization and Orbit Checkout (IOC) and making thetransition into the Science Phase of the mission. The spacecraft is inexcellent health, and all subsystems are performing well. Thespacecraft's roll rate is stable at 0.75 rpm, and final testing of drag-freeorbital flight and fine-tuning of the Attitude and Translation Controlsystem (ATC) is nearing completion. All four gyros are digitallysuspended and spinning at science mission speeds, ranging from61.8Hz (3,708 rpm) to 82.1 Hz (4,926 rpm). The spin axes of Gyros #1and #3 have been aligned with the science telescope's sighting axis,which is locked onto the guide star, IM Pegasi, and these gyros havecompleted the transition to science data collection mode. Spin axisalignment is continuing on Gyros #2 and #4, which are expected totransition to science mode over the next few days.This past Monday, August 9, 2004, we successfully increased thespacecraft's roll rate from 0.52 rpm to 0.75 rpm. In last week'shighlights, we noted that the decision to do this was made “after muchanalysis and discussion,” triggering a number of email inquiries aboutthe risks of increasing the roll rate. Three main issues influenced thisdecision: First, increasing the roll rate requires more fine-tuning of theATC system, which would delay the transition into Science mode by afew more days. Second, because the star trackers used by the ATC aremounted on the sides of the spacecraft, an increase in roll rate meansthat the star trackers must perform their pattern-matching on a fastermoving field of stars. Third, there was a concern that any effects ofmass imbalances in the spacecraft might be exaggerated at a faster rollrate. In the end, we decided that the ~20% improvement inexperimental accuracy outweighed these risks. All systems areperforming correctly at the increased roll rate, and the only downsidewas a small delay in our transition to the Science phase of the mission.Also this past week, we have flown the spacecraft in both primary andback-up drag-free modes, using Gyro #1 as the proof mass(spacecraft's center of mass). Primary drag-free mode relies solely onthe micro thrusters to create a drag-free orbit around the proof massgyro, whereas in back-up drag-free mode, the ATC uses suspensionforce data from the Gyro Suspension System (GSS) of the proof massgyro to “steer” the spacecraft so that residual GSS forces are nullifiedor canceled on this gyroscope. Either primary or back-up drag-freemode can be used in the Science Phase of the mission. However, theresidual voltages applied by the GSS to suspend the drag-free gyro adda very small, but acceptable, amount of noise to the gyro signal inback-up drag-free mode, so the primary mode is preferable, all otherthings being equal.In fact, early in July, we had selected back-up drag-free mode as thenominal mode for the Science Phase of the mission because at thattime, when the gyros were spinning very slowly, back-up mode wasyielding better results than the primary mode. However, now that thegyros are spinning at full speed, primary drag-free mode is yielding thebest results, as originally anticipated, so it will be the nominal modefor drag-free operation during the Science Phase of the mission. Thereason for this performance difference is that while the <strong>GP</strong>-B gyrorotors (spheres) are the roundest objects ever manufactured, they arenot perfectly spherical. The GSS is capable of controlling the positionof the gyros to a level of one nanometer. However, some of the482 March 2007 Appendix C — Weekly Chronicle of the <strong>GP</strong>-B Mission
“bumps” or deviations on the rotor surfaces are as large as 20nanometers. When the rotors are spinning slowly, these larger“bumps” are detected by the GSS, and they decrease its positioningaccuracy. However, when the rotors are spinning fast, these deviationsaverage out. Thus, at full speed, the average surface deviation on thegyro rotors is less than the one-nanometer precision of the GSS, sothere is no degradation in positioning the gyro rotors.solution for ensuring that the helium mass flow through the ATCsystem remains within required levels. By adjusting thruster biases,and by reducing the commanded helium flow, the amount of heliumconsumed by the ATC system is now less than the helium boiled awayby the natural heat in the dewar. As a result, the helium requirementsof the ATC system will have no impact on the mission lifetime,thereby maximizing the science performance.The final steps in the IOC, prior to beginning data collection, involvethe transition of each gyro into science mode. There are three mainsteps in this transition. First, the spin axis of each gyro is aligned withthe science telescope/spacecraft roll axis. Then, ultraviolet light,beamed from lamps on the spacecraft frame through fiber optic cablesinto the gyro housings, are use to remove any residual static chargefrom the gyro rotor surfaces. Finally, the GSS voltage is reduced, inorder to obtain the best signal on the SQUID readouts. Currently,Gyros #1 and #3 have completed this transition to science mode.Gyros #2 and #4 are finishing spin axis alignment, and they areexpected to complete the transition to science mode over the next fewdays.20 AUGUST 2004—GRAVITY PROBE B MISSIONUPDATE: DAY 122A little over four months into the mission, the spacecraft remains inexcellent health, and all subsystems continue to perform well. Thespacecraft’s roll rate remains stable at 0.75 rpm, and final testing ofdrag-free orbital flight and fine-tuning of the Attitude and TranslationControl system (ATC) is continuing. All four gyros are nowsuspended in low-voltage science mode. All of their spin axes havebeen aligned with the science telescope’s sighting axis, which is lockedonto the guide star, IM Pegasi. These alignments are in the process ofbeing fine-tuned.Last weekend, we completed coarse spin axis alignment on gyros #2and #4. On Monday, August 16th, ultraviolet light was beamedthrough fiber optic cables into the housing of gyro #2 to remove excessstatic charge on the gyro #2 rotor (sphere). Then, the suspensionvoltage for gyro #2 was reduced to 200 millivolts, the level required forscience data collection. The following day, the same procedures werecompleted on gyro #4. Thus, by the middle of this past week, all fourgyros were in the science mode configuration.Furthermore, in the process of performing these tests, we havedetermined that back-up drag-free mode is working very reliably, andthus we have re-selected back-up drag-free operation as the baselinemode for the Science Phase of the mission. We anticipate that ourinvestigation and problem-solving efforts around this roll-axis forcewill take a few more days. During that time, we will continue testingback-up drag-free mode around gyro #3, as well as further fine-tuningthe spin axis alignment of the four gyros.In addition this past week, while optimizing the performance of thetelescope system, we have found a small source of bias noise in thetelescope detector output signal. Although it would probably have noeffect on the science outcome, it seems prudent to eliminate this biasnoise, especially since a simple adjustment will take care of it. We areplanning to make this adjustment over the next two days.Finally, analysis of the gyroscope spin-down rate performance overthis past week has shown that, under low-voltage, science modesuspension, the spin-down rate for all four gyros is less than 0.000001Hz (0.00006 rpm) per hour. This means that it would take more than7,000 years for one of our gyros to completely spin down. On Earth,we could only test the spin-down rates of the gyros in a high-voltagesuspension mode, and based on these ground tests, the orbital spindownrequirement for the gyros was set at 2,300 years. We now seethat the spin-down performance of the <strong>GP</strong>-B gyros in science mode ismore than three times better than this requirement.About ten days ago, we began to notice that while in primary drag-freemode, the ATC was requiring more helium propellant than planned tocounter an unexpected force along the spacecraft’s roll axis—that is, inthe direction of the guide star. This past weekend, we switched toback-up drag-free mode on gyro#3, which gave a similar result. Overthe past two days, we have completed two tests that have provided a<strong>Gravity</strong> <strong>Probe</strong> B — <strong>Post</strong> <strong>Flight</strong> Analysis • Final <strong>Report</strong> March 2007 483
C.4 Science Mission Phase: 8/27/04 - 8/12/0527 AUGUST 2004— GRAVITY PROBE B MISSIONUPDATE: DAY 129On Day #129, we have arrived at the second major milestone of themission—the completion of the Initialization and Orbit Checkout(IOC) Phase and transition into the Science Phase. The spacecraftcontinues to be in excellent health, with all subsystems performingwell. The telescope is properly tracking the guide star, IM Pegasi,during the portion of each orbit when the guide star is visible. Fineprecision spin axis alignment has been completed on gyros #1, #2, and#3, and after the suspension voltages on these gyros were reducedfrom 10 volts to 200 millivolts in preparation for data collection, a finalelectrostatic discharge was performed on the gyro rotors usingultraviolet light. Gyro #4 is further behind its fellow gyros and willcontinue undergoing spin axis alignment awhile longer. Today, thespacecraft was placed in a drag-free mode around gyro #3, and it willremain in this mode for the duration of the Science Phase of themission, which has now officially begun.Over the course of this past week, we completed a number of finaladjustments to the spacecraft and the gyros, in preparation for thetransition to the Science phase. For example, on Wednesday, August25th, we increased the spacecraft’s roll rate very slightly from 0.75 rpmto 0.7742 rpm. This moved the signal frequencies from the gyros outof the range of telemetry sample rate harmonics, thus improving thesignal to noise ratio of the experimental data.Throughout most of this past week, we continued fine precisionalignment of the gyro spin axes to the telescope axis. Conceptually,this is a straightforward process. Our SQUID magnetometers, inconjunction with the Gyro Suspension System (GSS), can detect veryslight imperfections in the gyro rotors, and they utilize theseimbalances, enhanced by a suspension force of 10 volts (50 timeshigher than the science suspension voltage of 200 millivolts) to torquethe rotors ever so slightly, causing their spin axes to spiral in towardsthe target alignment position. However, our success in creating gyrorotors that are almost perfect spheres actually hinders this process.The smaller the level of imperfections in the rotors, the longer it takesthe GSS to complete the alignment.Today, we completed the final preparations, prior to beginning datacollection. First, we reduced the suspension voltages on gyros #1, #2,and #3 from the 10 volt level used for spin axis alignment to 200millivolts (0.2 volts), which is the level that will be used for datacollection throughout the Science Phase of the mission. We use highervoltage in the GSS whenever we are controlling the position of thegyro rotors. However, during the data collection phase, we use thelowest voltage required to maintain proper suspension, so that onlythe effects of relativity will be influencing the spin axis deflections ofthe gyros.After lowering the suspension voltages, we used ultraviolet light,shining through fiber optic cables as we have done previously, toremove any excess electrical charge that has built up on the rotors.When ultraviolet light shines on certain metals, it liberates electrons.Two fiber optic cables are embedded in each gyro housing—one ateach end—and each fiber optic cable terminates at an electrode,located just above the rotor surface, When the ultraviolet lamps areturned on, electrons form between the electrode and the rotor surface,and by changing the bias on these electrodes, we can control thedirection of electron flow, either towards or away from the surfaces ofthe rotors.Finally, this morning, we commanded the spacecraft into back-updrag-free mode, balanced around gyro #3. After testing the spacecraftin both primary and back-up drag-free modes over the past few weeks,we have determined that back-up drag-free mode has yielded the mostreliable and efficient performance, and thus, the spacecraft will remainin this mode for the duration of the Science Phase. We will continuetuning the drag-free performance of the Attitude and TranslationControl (ATC) system in the early portion of the Science Phase tocorrect for a previously reported, unknown force, which is causingexcess helium flow from the dewar through the micro thrusters. Thecurrent science configuration of the spacecraft has very little marginfor increased helium flow.In next week’s highlights, we will look back over the IOC period andput it into the perspective of the whole mission. In the process of doingthis, we will hopefully answer a number of email inquiries we havereceived recently regarding the health, longevity, and success of the<strong>GP</strong>-B mission.3 SEPTEMBER 2004—GRAVITY PROBE B MISSIONUPDATE: DAY 136As of Day #136, <strong>GP</strong>-B has successfully completed its first full week inthe Science Phase of the mission, with gyros #1, #2, and #3 in sciencemode. Gyro #4 is still undergoing alignment of its spin axis, which weexpect to be completed in about a week. For the past week, thespacecraft has been in drag-free mode around gyro #3.The spacecraft remains in excellent health, rolling at a rate of 0.7742rpm, with all subsystems performing well. The telescope continuesproperly tracking the guide star, IM Pegasi, during the portion of eachorbit when the guide star is visible. We are still investigating a smallforce or bias along the roll axis of the spacecraft, but this bias has noeffect on science data collection. Moreover, during the past two weeks,we have tuned the spacecraft’s Attitude and Translation Control(ATC) system to compensate for this bias, with no excess expenditureof helium through the micro thrusters.Having just achieved the major milestone of transitioning into theScience Phase of the mission, this is a good time to pause and lookback over the Initialization and Orbit Checkout (IOC) phase of themission. During this 19-week period, the <strong>GP</strong>-B mission has alreadyachieved a number of extraordinary accomplishments:• The orbit injection of the spacecraft was so close to perfect (within6 meters of the target orbit plane) that none of the planned orbittrim operations were necessary.• We’ve communicated with the spacecraft over 3,000 times duringthe IOC phase, and the Mission Planning team has successfullytransmitted over 70,000 commands to the spacecraft without anerror.• <strong>GP</strong>-B is the first satellite ever to achieve both 3-axis attitude control(pitch, yaw, and roll), and 3-axis drag-free control. Essentially,while orbiting the Earth, the whole spacecraft flies around one ofthe science gyros.• The <strong>GP</strong>-B gyros, which are performing perfectly in orbit, will belisted in the forthcoming edition of the Guinness Book of WorldRecords as being the roundest objects ever manufactured.484 March 2007 Appendix C — Weekly Chronicle of the <strong>GP</strong>-B Mission
• The spin-down rates of all four gyros are considerably better thanexpected. <strong>GP</strong>-B’s conservative requirement was a characteristicspin-down period (time required to slow down to ~37% of its initialspeed) of 2,300 years. Recent measurements show that the actualcharacteristic spin-down period of the <strong>GP</strong>-B gyros exceeds 10,000years—well beyond the requirement.• Once tuned up, the spacecraft’s Attitude and Translation Control(ATC) system has been able to function at a spacecraft roll rate of0.7742 rpm—more than twice the roll rate of 0.3 rpm initiallyspecified.• The magnetic field surrounding the gyros and SQUIDs (SuperconductingQUantum Interference Device) has been reduced to0.0000001 gauss, less than one millionth of the Earth’s magneticfield—the lowest ever achieved in space.• The gyro readout measurements from the SQUID magnetometershave unprecedented precision, detecting fields to 0.0000000000001gauss, less than one trillionth of the strength of Earth’s magneticfield.• The science telescope on board the spacecraft is tracking the guidestar, IM Pegasi (HR 8703), to superb accuracy, and it is alsocollecting long-term brightness data on that star.A number of people have asked the following two-part question about<strong>GP</strong>-B: “Given that our gyros are spinning about half as fast as weoriginally anticipated, and that the IOC phase took about twice as longas originally anticipated, how will these two situations affect thesuccess of the <strong>GP</strong>-B experiment?”Regarding the gyros, several of the accomplishments above—especially the extremely low SQUID noise and higher than plannedspacecraft roll rate—have effectively reduced the error factor in the<strong>GP</strong>-B science experiment, thereby partially compensating for thereduced spin rates of the gyros.Regarding the extended length of the IOC phase, the <strong>GP</strong>-B mission isunique because it is truly a physics experiment in space. As such, thereare trade-offs that can be made. The primary trade-off we had towrestle with was: More optimization/calibration of the instrumentprior to entering science, with a shorter data collection period; or, lessoptimization/calibration, with a longer data collection period. Weconcluded that the best overall accuracy would be achieved byensuring that the science instrument was optimally calibrated from thestart, even if this meant collecting data for a shorter period than wehad hoped. And, in fact, we now have a considerably betterunderstanding of the instrument than originally anticipated at thisstage of the mission.The original ideal duration of the experiment was 13 months ofrelativity data gathering, but this is not essential, especially in view ofthe work we have now done on the optimization/calibration phase.After two months of science data collection, we can make a very goodmeasurement of the geodetic effect and a significant measurement ofthe frame-dragging effect. The data improves as the 3/2 power of thetime (i.e. double the time, and the result will improve by a factor of~3). In the near future, we will make another measurement of theresidual helium in the dewar, which will provide an accuratedetermination of its cryogenic lifetime. This, in combination with theobserved instrument performance, will indicate the final expectedaccuracy of the experiment.The <strong>GP</strong>-B program will not release the scientific results obtainedduring the mission until after the science phase has concluded. It iscritically important to thoroughly analyze the data to ensure itsaccuracy and integrity prior to releasing the results. After more than40 years of development, we have learned the value of thoroughnessand patience.10 SEPTEMBER 2004—GRAVITY PROBE B MISSIONUPDATE: Day 143Just over 20 weeks in orbit, <strong>GP</strong>-B remains in the Science Phase of themission. Gyros #1, #2, and #3 are in science mode, generatingrelativity data. Alignment of the spin axis of gyro #4 with the guidestar, IM Pegasi, is continuing and will be completed by early nextweek.The spacecraft remains in excellent health, rolling at a rate of 0.7742rpm (one revolution every 77.5 seconds). The Attitude andTranslation Control (ATC) system is maintaining a drag-free orbitaround gyro #3, and it is properly tracking the guide star, IM Pegasi,during the portion of each orbit when the guide star is visible. Thedewar temperature is nominal, and the flow of helium, venting fromthe dewar through the micro thrusters to maintain the drag-free orbithas remained within expected limits. All other spacecraft subsystemsare continuing to perform well.On Tuesday, September 7, a double-bit error occurred in a non-criticalmemory location of the spacecraft’s main (A-side) computer due to aproton hit. This type of error is likely to occur from time to timeduring the mission. The necessary correction was prepared anduploaded to the proper memory location of the computer. Thisincident had no effect on science data collection or spacecraftsubsystems.Our statement in last week’s highlights that the <strong>GP</strong>-B program will notbe releasing any scientific data or results until after the completion ofthe science and instrument re-calibration phases of the missionprompted several inquiries that essentially boil down to two questions:1) What steps have we taken to ensure the integrity of the raw data andthe accuracy of the results? And, 2) Why is it necessary to wait so longbefore releasing any results?<strong>GP</strong>-B’s principal investigator, Professor Francis Everitt, has beenquoted on several occasions as saying: “I don't care whether Einsteinwas right or wrong; what I want is the experimental truth.” This is ourguiding philosophy here at <strong>GP</strong>-B. The results of the <strong>GP</strong>-B experimentwill be invaluable to science whether or not they agree with Einstein'spredictions. Also, given that this experiment is unlikely to ever berepeated, everyone on the <strong>GP</strong>-B team feels a great sense of personalresponsibility to be as careful and thorough as possible in collectingthe data and cross checking our instruments and procedures foraccuracyMore specifically, in answer to the first question above, manysafeguards are built into the <strong>GP</strong>-B experiment to ensure the integrityof the raw data, the correctness of the data analysis, and the accuracyof the results. These safeguards include:• <strong>GP</strong>-B is a joint effort between NASA, <strong>Stanford</strong>, and LockheedMartin. People from NASA and Lockheed Martin work on site herein the <strong>GP</strong>-B facilities at <strong>Stanford</strong>, and NASA managers review all<strong>GP</strong>-B mission activities.• <strong>GP</strong>-B has an external Science Advisory Committee, comprised ofrenowned physicists and space scientists. That committee hasoverseen the preparations for data collection, and it will review allof the data and analysis before the results are published.<strong>Gravity</strong> <strong>Probe</strong> B — <strong>Post</strong> <strong>Flight</strong> Analysis • Final <strong>Report</strong> March 2007 485
• <strong>GP</strong>-B also has an independent data analysis team that will beanalyzing the data in parallel with the <strong>GP</strong>-B science team tocorroborate our results. Any differences in the results of these twoteams will be reconciled before the results are announced.• The incoming raw data is fed directly into a database and is onlyavailable on a “read-only” basis to the scientists who will beanalyzing it.During the week, <strong>GP</strong>-B continued to tune-up the ATC system byimproving the quality of “roll phase data” of the spacecraft. This dataincreases the precision with which we can monitor the alignment ofthe gyroscopes. The “roll phase data” refers to the precise orientationof the spacecraft as it rolls around its axis (360 every 77.5 seconds).• Multiple cross checks are performed to identify any potentialsystematic experimental errors. For example, the results of all fourgyros are compared and correlated for consistency.• During the <strong>GP</strong>-B experiment, the spin axis deflections of thegyroscopes are measured relative to the guide star, IM Pegasi. But,in order to determine the actual relativistic drift rate of the gyros,we must also measure the proper motion of IM Pegasi relative toquasars (the most distant objects in the universe). The Harvard-Smithsonian Center for Astrophysics (CfA) is measuring theproper motion of IM Pegasi with respect to quasars to anunprecedented level of precision. However, by design, the CfA willnot release this proper motion data to the <strong>GP</strong>-B science team untilafter the scientific data collection, post-science instrumentcalibrations, and the data analysis have all been completed. In otherwords, the relativistic drift rates of the gyros may only bedetermined once the <strong>GP</strong>-B gyro drift results and CfA propermotion results are combined.Regarding the second question of why it is necessary to wait so longbefore releasing any results, one reason is now apparent: the guide starproper motion safeguard requires that all the <strong>GP</strong>-B data analysis becompleted before we can receive and combine the CfA proper motiondata and release/publish the final result. A related technical reason isthat while we should have a very good measure of gyro drift after 2-3months of data collection, it is essential that this data be cross checkedand calibrated to ensure its accuracy. We use the annual aberration ofour guide star signal (the difference between the actual position of IMPegasi and its apparent position due to the Earth’s revolution aroundthe Sun) as one means of calibrating the telescope/gryo readout scalefactor. Collecting this aberration data over a substantial portion of ayear will ensure the greatest accuracy of this calibration.In summary, we are using utmost care and rigor in our experimentalmethods and analysis, and only after the analysis has been completedand thoroughly checked will we announce and publish the results. Atthat time, all of the <strong>GP</strong>-B data will become available to the publicthrough the National Space Sciences Data Center (NSSDC), located atNASA’s Goddard Space <strong>Flight</strong> Center in Greenbelt, MD.17 SEPTEMBER 2004—GRAVITY PROBE B MISSIONUPDATE: Day 150After 22 weeks in orbit, <strong>GP</strong>-B finally has all four gyroscopes generatingrelativity data. Gyro #4 joined Gyro’s #1, #2, and #3 in science modethis week after its spin axis was successfully aligned with the guide star,IM Pegasi, on Tuesday. The official transition occurred on Thursdaymorning (PDT), marking the first time that <strong>GP</strong>-B is conductingscience on all four gyros.The spacecraft continues to be in excellent health, rolling at a rate of0.7742 rpm (one revolution every 77.5 seconds). The Attitude andTranslation Control (ATC) system is maintaining a drag-free orbitaround gyro #3, and it is properly tracking the guide star, IM Pegasi.The dewar temperature is nominal (1.82 Kelvin), and the flow ofhelium, venting from the dewar through the micro thrusters hasremained within expected limits.When the spacecraft rolls, so do the pickup loops encircling eachgyroscope. These superconducting wire loops are used to monitor theorientation of the magnetic field around each gyroscope. They arelocated in the same plane as the spacecraft’s roll axis, so when thespacecraft rolls the loops turn with it. As a result, the loops perceive a“change” in each gyroscope’s orientation as the wire turns through thegyroscope’s magnetic field.If <strong>GP</strong>-B knows the exact orientation of the spacecraft (and, in turn, thepickup loops) at each moment in time, we can better determine theorientation of each gyroscope. The spacecraft’s orientation isdetermined primarily through the two star trackers located on theforward portion of the spacecraft on opposite sides. These star trackersimage the starry sky through an 8x8 field, providing the spacecraftwith a reference map to measure its orientation. If the stars in eachtracker’s field of view are in the right location, then the spacecraft ispointing in the right direction.In last week’s highlights, we noted that a double-bit error in computermemory was caused by “a proton hit”. An astute reader asked, “Howdo we know that the spacecraft was hit by proton?”Onboard the spacecraft is a proton detector, specially made for the<strong>GP</strong>-B mission. Its purpose is to monitor the high-energy particles thatimpact the spacecraft and the science instrument. This proton flux canlead to the accumulation of charge on the gyroscopes, which in turncould lead to unacceptable torques on the gyroscopes. So far, thecharge accumulated on the gyroscopes is much less than expected.One ancillary benefit of <strong>GP</strong>-B’s proton monitor has been its ability toaccurately locate the South Atlantic Anomaly, a region above theSouth Atlantic Ocean where the fluxes of particles trapped in theEarth’s geomagnetic field are much greater than anywhere else. <strong>GP</strong>-B’sorbit takes it through this region regularly, allowing it to produce amore precise map of this magnetic anomaly.24 SEPTEMBER 2004—GRAVITY PROBE B MISSIONUPDATE: Day 157<strong>GP</strong>-B had an eventful week. We began the 4th week of science with allfour gyroscopes in the science mode. Then on Thursday we had ananomaly with gyro #3.At 8:30 PM local time on Thursday, the drag-free gyro #3 transitionedto analog mode resulting in safemode that stopped the timeline. The<strong>GP</strong>-B vehicle and science gyros were safe. Gyro's #1, #2 and #4486 March 2007 Appendix C — Weekly Chronicle of the <strong>GP</strong>-B Mission
emained in the digital suspension science mode. A preliminaryassessment by the science team indicated minimal impact to anyexperiment accuracy. An investigation is under way to determine thecause of the drag-free gyro #3 transition to analog mode and safemodeactivation. The operations and engineering teams did an excellent jobworking through the night to safe the vehicle and quickly develop arecovery plan.By Friday afternoon the spacecraft was back in science collecting modewith gyro #1 performing the drag-free operation. On Saturday theoperations team successfully transitioned Gyro #3 from analogsuspension to the digital suspension science mode. All other spacecraftsystems are in excellent health. The spacecraft is rolling at a rate of0.77419 rpm (one revolution every 77.5 seconds). The Attitude andTranslation Control (ATC) system is maintaining a drag-free orbitaround gyro #1, and it is properly tracking the guide star, IM Pegasi.The dewar temperature is nominal (1.82 Kelvin), and the flow ofhelium, venting from the dewar through the micro thrusters hasremained within expected limits.spacecraft was back in science mode, with gyro #1 performing thedrag-free operation. The effect of this event on the science experimentwas insignificant. The most likely cause of this event was a data spikein the Gyro Suspension System (GSS) position sensor for gyro #3.Gyro #3 was returned to digital suspension as part of the recoveryplan, and it has remained digitally suspended, with no furtherproblems, since that time. However, we are continuing to monitor itsperformance and investigate the root cause. Thus, for the foreseeablefuture, the spacecraft will continue to fly drag-free around gyro #1.During the week the team performed a heat pulse test on thespacecraft dewar to obtain further information to help predict lifetime.Early indications are that the helium in the dewar will last another 10months, which should be sufficient to satisfy the missionrequirements.1 OCTOBER 2004—GRAVITY PROBE B MISSIONUPDATE: Day 164The spacecraft is in good health, flying drag-free around gyro #1. Allfour gyros are digitally suspended, and their SQUID readouts arecollecting relativity data during the portion of each orbit when thescience telescope is locked onto the guide star, IM Pegasi. Thespacecraft’s roll rate remains at 0.7742 rpm (one revolution every 77.5seconds). The dewar temperature is nominal (1.82 Kelvin), and theflow of helium, venting from the dewar through the micro thrusters iswithin expected limits.At this time of year in North America, at around 8:30 PM PacificDaylight Time, the constellation Pegasus, in which the guide star IMPegasi resides, is clearly visible above the Eastern horizon. With amagnitude ranging from 5.6 – 5.85, IM Pegasi is too dim to see withthe naked eye, but in a good viewing location, it should be visible withbinoculars.In last week’s update, we reported that at 8:30 PM local time onThursday, 23 September 2004, gyro #3—which was then serving as thedrag-free gyro—suddenly transitioned to analog backup suspensionmode, automatically triggering a safemode that stopped the missiontimeline. The <strong>GP</strong>-B operations and engineering teams quicklydeveloped a recovery plan, and by the following afternoon, theAlso last week, we reported that the team had performed a heat pulsetest on the spacecraft dewar in order to determine the mass of liquidhelium remaining inside, which determines the remaining lifetime ofthe mission. The heat pulse test works in the following way: Theamount of heat that it takes to warm an object by a specified amountdepends on the type of material, its temperature, and its mass. Thus, ifthe “specific heat” (the amount of heat needed to warm a kilogram ofmaterial by one degree kelvin) is known, it is a simple matter tomeasure the mass by applying a known amount of heat (usually withan electric heater) and measuring the resultant temperature rise. In thecase of the <strong>GP</strong>-B dewar, the situation is simplified by the fact that heatdistributes itself virtually instantaneously throughout superfluidhelium. The amount of heat used in the test must be large enough tocause a measurable temperature change (approximately 10millikelvin) but not so large as to appreciably shorten the missionlifetime. The heat pulse test yielded a remaining superfluid heliummass of 216 kg, which translates into a remaining mission lifetime of9.9 months. This means that the science (data collection) phase of themission will continue for a little over 8 more months, and then we willspend the final month re-calibrating the science instrument.Finally, this past Tuesday, 28 September 2004, we observed a slightincrease in the helium required by the micro thrusters to maintaindrag-free flight around gyro #1. To be conservative, we decided to turnoff drag-free mode and evaluate the situation. Over a period of 4-6hours, the oscillations that were causing the ATC to require excesshelium died out and have not returned. After some analysis anddiscussion, we have determined these oscillations were caused by asympathetic resonance between the ATC drag-free control efforts anda sloshing wave on the surface of the now reduced superfluid heliumin the dewar. This situation is somewhat analogous to placing avibrating tuning fork on the body of a guitar, which then causes guitarstrings tuned to harmonics of the same frequency to start vibrating.This is a transient situation, and the team has adjusted the ATC drag-<strong>Gravity</strong> <strong>Probe</strong> B — <strong>Post</strong> <strong>Flight</strong> Analysis • Final <strong>Report</strong> March 2007 487
free suspension parameters to de-tune this harmonic coupling. Wehave since returned the spacecraft to drag-free operation around gyro#1, and it is performing nominally.8 OCTOBER 2004—GRAVITY PROBE B MISSIONUPDATE: Day 171At the end of Mission Week #25, <strong>GP</strong>-B is in its sixth week of sciencedata collection. The spacecraft continues to be in good health, flyingdrag-free around gyro #1. All four gyros are digitally suspended andperforming nominally. The spacecraft’s roll rate remains at 0.7742rpm (one revolution every 77.5 seconds). The dewar temperature isnominal (1.82 Kelvin), and the flow of helium, venting from the dewarthrough the micro thrusters remains within expected limits.As noted in last week’s update, we have continued to monitor theperformance of gyro #3, which had been serving as the drag-free gyrountil it suddenly transitioned to analog backup suspension mode twoweeks ago. At that time, we quickly implemented a recovery plan,switching drag-free flight operations to gyro #1 and reinstating digitalsuspension on gyro #3. It remained digitally suspended all last weekuntil last Friday, 1 October 2004, when it once again transitioned intoanalog backup mode. This past Monday, 4 October 2004, we resuspendedgyro #3. Subsequently, we changed the Gyro SuspensionSystem (GSS) bridge setting for this gyro to the high-level excitationmode used during gyro spin-up to increase the signal-to-noise ratio ofthis gyro’s position readout. The GSS team will continue to monitorthe performance of this gyro, and they are preparing to test severalhypotheses regarding the root cause of this gyro’s loss of digitalsuspension.Last week, we also reported detecting oscillations in the drag-freecontrol force, which we suspect were caused by a sympatheticresonance between the ATC drag-free control efforts and a sloshingwave on the surface of the now reduced superfluid helium in thedewar. We adjusted the ATC drag-free suspension parameters to detunethis harmonic coupling, and the oscillations disappeared for mostof last week, but last Friday, they began to re-appear. We have sincereduced the gain in the drag-free controller to its initial level, prior tothe appearance of these oscillations, and this seems to have mitigatedthese oscillations. Following is a more detailed explanation of thissuspected harmonic resonance phenomenon, provided by our <strong>GP</strong>-Bcryogenic expert, Mike Taber.<strong>GP</strong>-B recently experienced a minor instability, characterized byexcessive thruster venting and a slowly rotating force transverse to theroll direction. This force oscillation was observed by the suspensionsystem of all four gyros and had a period of approximately 220 seconds(3.7 minutes). At the time this occurred, the system was in “drag-free”mode, where the control effort needed to center gyro #1 was beingminimized by the helium thrusters. This is normal operation inscience mode, wherein the space vehicle is being flown in such a wayas to minimize the suspension forces and torques that can perturb thegyro spin direction. As a precautionary measure, in response to thisoscillation, the drag-free control system was commanded off. Theoscillation was then observed to slowly decay over a period of aboutsix hours.The initial assessment of this phenomenon was that it was due to aslosh instability in the liquid helium. The helium in the main tankexists in two phases: liquid and vapor. Since the space vehicle is slowlyrolling, centrifugal force causes the denser liquid to reside near theouter wall of the main tank with the vapor forming a bubble at thecenter. Normally, the liquid rotates as a solid body with the rest of thevehicle. However, if excited, it is dynamically possible for a surfacewave to form at the liquid-vapor interface that can propagatecircumferentially. The fact that the oscillation persisted, but thenslowly decayed after the drag-free control was turned off, supports thisscenario. The energy to build up and sustain the wave was supplied bythe drag-free system reacting to the force of the propagating wave withan appropriate phase shift. A subsequent examination of telemetrydata indicated that this phenomenon actually started when the gain ofthe drag-free controller was doubled some time ago, but the amplitudewas too small for it to be readily apparent. Ten days (and a number ofevents) actually passed before the oscillation grew sufficiently largethat it was noted in the Attitude and Translation Control (ATC)system and dewar data. The drag-free controller gain has since beenreduced back to its original value. There is no indication that any ofthese events had any adverse impact on the <strong>GP</strong>-B experiment.15 OCTOBER 2004—GRAVITY PROBE B MISSIONUPDATE: Day 178Six months into the mission, <strong>GP</strong>-B is performing remarkably well. Thespacecraft is in fine health, flying drag-free around gyro #1. All fourgyros remain digitally suspended, and they are all generating sciencedata. The spacecraft is rolling at 0.7742 rpm (77.5 seconds perrevolution), and all subsystems are performing well. The dewartemperature remains nominal at 1.82 kelvin, and the flow of helium488 March 2007 Appendix C — Weekly Chronicle of the <strong>GP</strong>-B Mission
from the dewar through the micro thrusters continues to be withinexpected limits. We are now in our seventh week of data collection,which is going very smoothly, and a recent test on the dewar indicatesthat we have enough helium to continue collecting data forapproximately eight more months. The quality of the data gatheredthus far is excellent.This past week has been a relatively quiet one for the <strong>GP</strong>-B spacecraft.The oscillations in the drag-free control force, which we have beenreporting on for the past two weeks, have diminished to aninsignificant level. Adjustments that we made to the drag-freesuspension parameters to de-tune a harmonic coupling between thedrag-free control system and helium sloshing in the dewar, combinedwith reducing the gain in the drag-free controller to its initial level,seem to have mitigated this instability. To be certain, we arecontinuing to monitor the drag-free control system with regards tothis issue.Furthermore, gyro #3, which we have been monitoring over the pastthree weeks, since it unexpectedly transitioned from digital to analogback-up suspension, has remained digitally suspended, withoutfurther incident this past week. We suspect that the issue with gyro #3is not related to the gyro rotor (sphere) itself, but rather with somenoise spikes in its suspension system that have exceeded pre-set limits,automatically triggering a transition into analog back-up suspensionmode. Increasing the signal-to-noise ratio of this gyro’s positionreadout seems to have mitigated this problem. However, we arecontinuing to monitor gyro #3, and we are still analyzing the rootcause of this behavior.The short answer is that neither of these events has had any significanteffect on the data or the experimental results. The SQUID readouts foreach gyro continue to provide spin axis orientation data in both digitaland analog suspension modes, so no data was lost when gyro #3transitioned to analog mode. Also, even in those few moments whenthe spacecraft is not in drag-free mode, we continue to collect data, butin this case, we must carefully evaluate any potential torques (forces)placed on the gyros to ensure that they did not alter the gyro’s spin axisalignment.22 OCTOBER 2004—GRAVITY PROBE B MSSIONUPDATE: Day 185<strong>GP</strong>-B continues to perform well. We have switched back to flying thespacecraft drag-free around gyro #3, and all four gyros are digitallysuspended and generating science data. The spacecraft’s roll rateremains constant at 0.7742 rpm (77.5 seconds per revolution), and allsubsystems are continuing to perform well. As we near two months ofdata collection, the flow of helium from the dewar through the microthrusters remains within expected limits, and the dewar temperature isstable at 1.82 Kelvin. We have approximately seven months of datacollection remaining, and the quality of the data received thus farcontinues to be excellent.The two issues mentioned above have prompted several inquiriesabout the effects of such events on the health of our data and theultimate results of the experiment.This past Tuesday, October 19th, gyro #1, which has been serving asthe “drag-free” gyro for the past few weeks, transitioned into analogbackup suspension mode. Having already worked through this samescenario with gyro #3 last month, we were able to smoothly switchdrag-free operations back to gyro #3 and restore digital suspension togyro #1 within three hours of this event. Because gyro #3 has beenperforming well after we increased the signal to noise ratio in its GyroSuspension System (GSS) position readout, we have made the sameadjustment to gyro #1. We are now monitoring the performance ofboth gyros #3 and #1 to determine if the analog suspension transitionwill recur, or if this issue has been resolved.The oscillations in the drag-free control force, which we have beenreporting on in previous highlights, have remained at an insignificantlevel over the past week. We are performing further analysis andadjustments on the drag-free suspension parameters to ensure the detuningof any harmonic coupling between the drag-free control systemand helium sloshing in the dewar. We are continuing to monitor thedrag-free control system with regard to this issue.<strong>Gravity</strong> <strong>Probe</strong> B — <strong>Post</strong> <strong>Flight</strong> Analysis • Final <strong>Report</strong> March 2007 489
We have received inquiries about a recent letter to Nature by IgnazioCiufolini and Erricos Pavlis claiming to have verified the Lense-Thirring frame-dragging effect of general relativity through laserranging data observations of the LAGEOS I & II spacecraft. In theirmeasurement, the frame-dragging effect needs to be separated by anextremely elaborate modeling process from Newtonian effects morethan 10,000,000 times larger than the effect to be measured. The letterdoes not provide enough detail of the methods of verification andvalidation to allow a critical evaluation. We and other members of therelativity community look forward to a more complete account. Ifverified, their result will be of considerable interest.This past Wednesday evening, for the first time since 1918, whenAustrian physicists, Josef Lense and Hans Thirring published theirimportant paper on the gravitomagnetic or “frame-dragging” effect,the Boston Red Sox swept the World Series. Some say the heavensresponded with a glorious total eclipse of the moon—or perhaps, itwas the eclipsed moon that enabled the Red Sox to achieve thisstunning victory. Whatever the case, these cosmic events hadabsolutely no effect on the <strong>GP</strong>-B spacecraft.The <strong>GP</strong>-B science instrument and spacecraft were specificallydesigned to create a pristine environment to perform directmeasurements of both the frame-dragging and geodetic effects ofgeneral relativity with all Newtonian disturbances several orders ofmagnitude smaller than the effects to be measured. Theoretically, onlyone gyroscope is needed to make <strong>GP</strong>-B’s measurements, but we usefour gyroscopes to give highly accurate independent checks of the twoeffects. As a further validation, throughout the whole <strong>GP</strong>-B mission weconduct a continuing series of verification/calibration tests. Inparticular, during our final month-long instrument re-calibrationfollowing data collection, we will perform a series of tests in whichcertain classes of potential disturbances are deliberately increased inorder to uncover any previously unknown effects. Tests of this kind,where possible disturbances are enhanced in order to calibrate andremove them, are a vital part of good experimental physics practice.29 OCTOBER 2004—GRAVITY PROBE B MISSIONUPDATE: Day 192In its 28th week in orbit, <strong>GP</strong>-B is continuing to perform well. We havecompleted two months of data collection, and the quality of the datareceived thus far is excellent. The spacecraft is maintaining a constantroll rate of 0.7742 rpm (77.5 seconds per revolution) and flying dragfreearound gyro #3. The dewar temperature remains stable at 1.82kelvin, and the flow of helium from the dewar through the microthrusters is nominal. All other spacecraft subsystems are continuing toperform well.However, in preparation for solar events that could have an effect onour spacecraft, yesterday, the <strong>GP</strong>-B Mission Operations teamperformed an all-day simulation of the recovery process we will needto go through in the unlikely event that proton radiation from the suntemporarily disables our main, A-side computer, triggering anautomatic switch-over to our backup, B-side computer. Chances ofsuch a switch-over increase slightly whenever our spacecraft passesthrough the region over the South Atlantic Ocean, called the “SouthAtlantic Anomaly,” where the fluxes of particles trapped in the earth’sgeomagnetic field are greater than anywhere else.In fact, this may have been the cause of the B-Side switch-over weexperienced during the second week of the mission. At that time, wewere just beginning to adjust various parameters on the spacecraft,and switching back to the A-side computer went smoothly andquickly. Now that we are well into the science phase of the mission,flight-control parameters have changed, so it is prudent to rehearse therecovery procedures in order to minimize down time and loss of datain the event of a switch-over. To this end, we were pleased with theteam’s excellent performance during yesterday’s simulation.Again, this past week, oscillations in the drag-free control force thatwe have reported on in previous updates remained insignificant. Weare continuing to perform analysis and adjustments on the drag-freesuspension parameters to ensure that no harmonic coupling occursbetween the drag-free control system and helium sloshing in thedewar, and we continue to monitor this situation.490 March 2007 Appendix C — Weekly Chronicle of the <strong>GP</strong>-B Mission
Likewise, increasing the signal to noise ratio in the Gyro SuspensionSystem (GSS) position readouts of gyros #3 and #1 appears to havemitigated the problems we experienced with these gyros unexpectedlytransitioning to analog suspension mode. Both gyros #3 and #1 haveboth remained digitally suspended this past week, and we arecontinuing to monitor the performance of their suspension systems.On Thursday, 21 October 2004, our <strong>GP</strong>-B external Science AdvisoryCommittee, chaired by Professor Clifford M. Will of WashingtonUniversity in St. Louis, met here at <strong>Stanford</strong> and conducted a valuablereview of our science data processing approach.5 NOVEMBER 2004—GRAVITY PROBE B MSSIONUPDATE: Day 199As of mission Day #199, all vehicle and payload systems remain ingood health. We have now completed nine weeks of data collection,and the quality of the data continues to be excellent. The spacecraft ismaintaining a constant roll rate of 0.7742 rpm (77.5 seconds perrevolution) and flying drag-free around gyro #3. The flow of heliumfrom the dewar through the micro thrusters is nominal, and the dewartemperature is stable at 1.82 Kelvin.Once again, this past week has been a relatively quiet one for the <strong>GP</strong>-Bspacecraft. Adjustments that we made to the drag-free suspensionparameters have prevented any further harmonic coupling betweenthe drag-free control system and helium sloshing in the dewar. As aresult, the previously reported oscillations in the drag-free controlforce have completely disappeared. We will continue to monitor thedrag-free control system and any motion of helium in the dewar, butthis is no longer considered to be an issue.Likewise, increasing the signal to noise ratio in the Gyro SuspensionSystem (GSS) position readouts of gyros #3 and #1 has mitigated theproblems we experienced with these gyros unexpectedly transitioningto analog suspension mode. Both gyros #1 and #3 have remaineddigitally suspended since we made these adjustments, so we alsoconsider this issue to be closed.12 NOVEMBER 2004—GRAVITY PROBE B MISSIONUPDATE: Day 206In its 30th week in orbit, the <strong>GP</strong>-B spacecraft is in good health and isperforming well. We have completed 2.5 months of data collection,and the quality of the data continues to be excellent. The spacecraft isflying drag-free around gyro #3, while maintaining a constant roll rateof 0.7742 rpm (77.5 seconds per revolution). As we enter the secondportion of the year when the spacecraft remains in full sunlight forapproximately a month, the shell of the dewar is warming up slightly,and thus rate of helium boiling off from the dewar has increasedslightly, resulting in a uniform increase of helium flow through themicro thrusters, in order to maintain the appropriate pressure insidethe dewar to keep its temperature stabilized at 1.82 kelvin.The two plots to the right show a side-by-side comparison of normalsolar activity from one month ago versus the activity during thegeomagnetic storm this past Wednesday and Thursday. The differenceis dramatic. Note especially the large increase in highest-level (green)proton flux on November 10th. The increase in these particles rarelyrises above the 0.1 (first) level on this plot.This past week, we moved our pre-flight prototype science telescopeinto a clean room to photograph it, before returning it to its sealeddisplay case in our <strong>GP</strong>-B lobby here at <strong>Stanford</strong>. The science telescopeis both a beautifully crafted instrument and a marvel of engineering.<strong>Gravity</strong> <strong>Probe</strong> B — <strong>Post</strong> <strong>Flight</strong> Analysis • Final <strong>Report</strong> March 2007 491
One of the effects of geomagnetic storming is a significant increase inhigh-energy proton bombardment in any part of the Earth facing theSun, and especially in the region known as the South AtlanticAnomaly, which normally experiences heightened levels of solarparticle bombardment. Thus, it was not surprising that at 4:58 PMPST on 10 November 2004, as the <strong>GP</strong>-B spacecraft was entering theSouth Atlantic Anomaly region, a proton hit a critical memorylocation in the SQUID Readout Electronics (SRE). This eventtriggered a chain reaction of safemodes that, among other things,halted the <strong>GP</strong>-B mission time line, caused the SRE computer to reboot,and transitioned all four gyros to analog backup suspension mode.Over the past few weeks, the SRE electronics had sustained two protonhits to non-critical memory locations, and we were already in theprocess of planning the necessary steps to manually reboot it, but as ithappens, nature apparently took care of this issue for us. Fortunately,the effects of this event were limited to the SRE electronics, and thespacecraft’s main (A-side) computer was not affected. Our teamworked through the night this past Wednesday and most of Thursday,sending commands to the spacecraft to reset affected systems andrestore all four gyros to digital suspension modes. As of this afternoon,the spacecraft has returned to normal operation. The effect of thisevent on the experimental data is not yet known. A few data pointsfrom this period may have to be omitted, but such an omission willhave no significant effect on the overall experimental results.19 NOVEMBER 2004 – GRAVITY PROBE B MISSIONUPDATE: DAY 213The <strong>GP</strong>-B spacecraft remains in good health and is continuing toperform well. We have been collecting science data for 83 days, anddata acquisition process is proceeding as expected. The spacecraft ismaintaining a constant roll rate of 0.7742 rpm (77.5 seconds perrevolution), and it is flying drag-free around gyro #3. The dewar’sinternal temperature remains steady at just under 1.82 Kelvin.At this time of year, the spacecraft is entering a 6-week period where itremains in full sunlight—that is, light from the Sun shines broadsideon the spacecraft. As a result, the dewar’s outer shell has been warmingup, and some of this heat is transferred to the liquid helium inside.Because the temperature and pressure inside the dewar are maintainedat constant levels, this expected seasonal warming of the dewar causesthe helium inside to boil off at a faster rate. To compensate for thisincreased helium flow and maintain the correct pointing position, thespacecraft’s Attitude and Translation Control system (ATC) has been“null dumping” (uniformly venting) the excess helium out through themicro thruster system.Last week, we reported that on 10 November 2004, the SQUIDReadout (SRE) computer failed a fundamental “health check,” whichresulted in its rebooting itself and triggering six protective safemodesthat, among other things, halted the spacecraft’s on-board timeline,unlocked the telescope from the guide star, closed the telescopeshutter, and transitioned all four gyros into analog backup suspension.On first analysis, it appeared that the root cause of this anomalousevent was that a high-energy proton had struck a critical memorylocation in the SRE computer during the severe geomagnetic stormthat was raging all last week.However, further analysis now suggests that the spacecraft did notsuffer a new proton hit after all. Rather, the SRE computer hadpreviously suffered high-energy proton hits resulting in multi-bit (notself-correctable) errors in two of its memory locations. These memorylocations were thought to be non-critical, but it now appears that oneof these affected memory locations was accessed during a routinemaintenance procedure.This caused a health check of the SRE computer to fail, which in turn,automatically triggered the safemodes and re-booted the computer.For precautionary purposes, our team had already prepared aprocedure to manually reboot the SRE computer and clear out anymulti-bit errors, but this will no longer be necessary, since thecomputer’s self-reboot last week cleared and reset all of the computer’smemory locations. The fact that this event happened while thespacecraft was entering the South Atlantic Anomaly region of theEarth (where protection from proton bombardment is significantlyreduced) during a severe geomagnetic storm, was apparently acoincidence.Events such as the one that occurred last week always prompt anumber of inquiries about whether such glitches cause any loss ofscientific data or detriment to the experimental results. The shortanswer to this question is “no.” Such events typically do not—and havenot—had any significant effect on the <strong>GP</strong>-B experimental data or theresults.492 March 2007 Appendix C — Weekly Chronicle of the <strong>GP</strong>-B Mission
26 NOVEMBER 2004—GRAVITY PROBE B MISSIONUPDATE: Day 220On the eve of the 2004 Thanksgiving holiday weekend—mission week#32—the <strong>GP</strong>-B spacecraft is in good health, with all subsystemsperforming well. We have now been collecting data for three months.Data collection is proceeding smoothly, and the quality of the data isexcellent. The spacecraft continues to fly drag-free around gyro #3,maintaining a constant roll rate of 0.7742 rpm (77.5 seconds perrevolution.) The temperature inside the dewar remains steady at justunder 1.82 Kelvin.3 DECEMBER 2004—GRAVITY PROBE B MISSIONUPDATE: Day 227The <strong>GP</strong>-B spacecraft continues to be in good health, with allsubsystems performing well. As of tomorrow, we will have beencollecting relativity data for 100 days. The data collection process isproceeding smoothly, and the quality of the data remains excellent. Allfour gyros are digitally suspended in science mode, and the spacecraftis flying drag-free around gyro #3, maintaining a constant roll rate of0.7742 rpm (77.5 seconds per revolution.) The temperature inside thedewar is holding steady at just under 1.82 kelvin.For much of the month of December, our Mission Planning staff hasscheduled minimal spacecraft activity, outside routine monitoring ofspacecraft functionality and downloading of science data. However,lest we become complacent, Mother Nature seems to have a way ofstirring up the pot—as was the case last Saturday afternoon.The Spacecraft’s TaleLast Saturday began as a rather “ho-hum” California winter’s day.Orbiting the Earth every 97.5 minutes, the <strong>GP</strong>-B spacecraft passeddirectly over California around 6:30AM PST, but the Sun was alreadyup, and the sky was too bright to see the satellite. In the <strong>GP</strong>-B MissionOperations Center (MOC), a skeleton crew consisting of the on-dutyMission and <strong>Flight</strong> directors and one or two resident engineersmonitored several telemetry passes (communications sessions) duringthe morning hours. Most were 25-minute satellite passes, duringwhich the spacecraft relays status information to the MOC throughthe NASA TDRS (Tracking and Data Relay Satellite) communicationssatellite system. And, during a 12-minute ground pass at 1:15PM PST,the spacecraft’s solid-state recorder relayed relativity data to the <strong>GP</strong>-Bscience database through a high-speed telemetry connection with theSvalbard ground tracking station, on the island of Spitsbergen inNorway. All in all, it was a normal Saturday, and the atmosphere in theMOC was quite relaxed.It has been relatively quiet here in the <strong>GP</strong>-B Mission OperationsCenter, since the strong solar flares and geomagnetic storm threeweeks ago. Our team continues to adjust the flow rate of the excesshelium from the dewar during the present a 6-week “hot” season,where the spacecraft is continually in sunlight throughout each orbit.(See last week’s highlights for a discussion of the spacecraft’s seasons.)Furthermore, seasonal warming of the spacecraft has resulted in theAttitude Reference Platform (ARP) on the outside of the spacecraftproducing data that slightly diminishes the pointing accuracy of theAttitude and Translation Control system (ATC). To address this issue,the ATC team installed a modified data filter, and tests performed thispast week indicate that spacecraft pointing accuracy has nowimproved.Finally, the team has been adjusting controls on the navigationalgyroscopes that are used by the ATC to keep the telescope pointedtowards the guide star, IM Pegasi (HR 8703), during periods when thespacecraft moves behind the Earth, eclipsing the telescope’s view of theguide star. These adjustments have reduced the time required for thetelescope to re-lock onto the guide star—when the spacecraft emergesover the North Pole—to less than one minute.10 DECEMBER 2004—GRAVITY PROBE B MISSIONUPDATE: Day 234Now, almost 34 weeks in orbit, the <strong>GP</strong>-B spacecraft is in fine health,with all subsystems continuing to perform well. The spacecraft, whichis in the middle of a 6-week un-eclipsed (full sun) period, is flyingdrag-free around gyro #3, maintaining a constant roll rate of 0.7742rpm (77.5 seconds per revolution.) The temperature inside the dewaris holding steady at just under 1.82 kelvin. All four gyros are digitallysuspended in science mode. We have been collecting relativity data for15 weeks. The data collection process is continuing to proceedsmoothly, and the quality of the data continues to be excellent.Following the successful ground pass with Svalbard, the spacecraftcontinued on its southward route. At around 1:30 PM PST, Pacifictime, the spacecraft was flying over South America—heading towardsthe South Pole—when it entered the South Atlantic Anomaly (SAA).This is a region above the Earth where the fluxes of trapped protonsand other particles, emitted by the Sun, are much greater thananywhere else on Earth, due to the asymmetry of the Earth’s protectiveVan Allen Radiation Belts. Thus, spacecraft are more vulnerable tobeing struck by protons when flying through this region.At 1:48PM, Pacific Time, an odd event silently occurred on-board thespacecraft, triggering four safemodes (pre-programmed commandsequences designed to automatically place the spacecraft, its gyros,telescope, and other systems and instruments, in a stable and safeconfiguration in response to anomalous or out-of-limits feedbackfrom various on-board sensors).Back in the MOC, the next telemetry pass was not scheduled until 3:16PM, so the operations staff was completely unaware of this change inthe spacecraft’s condition—for the time being. At 3:15PM, the MOCstaff settled into their seats for the upcoming satellite status telemetrypass. As the spacecraft’s antenna locked into the TDRSS satellite and<strong>Gravity</strong> <strong>Probe</strong> B — <strong>Post</strong> <strong>Flight</strong> Analysis • Final <strong>Report</strong> March 2007 493
egan transmitting, one-by-one, status monitors around the MOCbegan turning red, signaling the spacecraft had triggered itssafemodes. There is a problem on-board.During the next 20 minutes, phones rang, pagers beeped, and soon,the MOC was teeming with activity. An assessment of the safemodesthat were triggered indicated that an error—never seen before—hadoccurred in a module of the Attitude and Translation Control (ATC)computer system. The spacecraft’s <strong>GP</strong>S had registered an off-the-scalevelocity spike, which if correct, indicated that, for one brief moment,the spacecraft had traveled faster than the speed of light—or to useStar Trek terminology, it had “warped into hyperspace.” In fact, the<strong>GP</strong>S system had reported a single data point with an erroneously highvelocity, which when squared, caused a computer overflow. The ATCcomputer module took exception to this data overflow and triggered asafemode test, which in turn activated a chain reaction responsesequence.17 DECEMBER 2004—GRAVITY PROBE B MISSIONUPDATE: Day 241As we near the end of 2004, the <strong>GP</strong>-B spacecraft has been in orbit forjust under eight months and collecting science data for almost fourmonths. It remains in fine health, and all subsystems are continuing toperform well. The spacecraft is beginning to experience brief periodsof being eclipsed from sunlight by the Earth during each orbit,signaling that its recent full-sun season is waning. It is flying drag-freearound gyro #3, maintaining a constant roll rate of 0.7742 rpm (77.5seconds per revolution.) The temperature inside the dewar is holdingsteady at just under 1.82 Kelvin. Recent measurements indicate thatapproximately half of the superfluid has now been expended from thedewar. All four gyros are digitally suspended in science mode. We arenow approximately 40% of the way through the science phase of themission. The data collection process is continuing to proceedsmoothly, and the quality of the data remains excellent.A <strong>GP</strong>-B RETROSPECTIVE ON 2004Looking back, 2004 has been a year of monumental triumph for <strong>GP</strong>-B.The year began with a re-work of the Experiment Control Unit (ECU),and its subsequent reinstallation into the space vehicle.At the beginning of April, as the space vehicle was being readied forlaunch, the official <strong>GP</strong>-B pre-launch press conference was held atNASA headquarters in Washington DC. (You can view a streamingvideo of this press conference, which includes many technical detailsabout the <strong>GP</strong>-B science experiment and technology, on NASA'sKennedy Space Center ELV Web page.)Three weeks following the press conference, at 9:57 am PST on 20April 2004, a Boeing Delta II rocket carried the <strong>GP</strong>-B spacecraft,embodying over 40 years of dogged persistence in science andengineering, into a perfect orbit. That emotionally overwhelming day,culminating with the extraordinary live video of the spacecraftseparating from the second stage booster meant, as <strong>GP</strong>-B ProgramManager Gaylord Green put it, “that 10,000 things went right.” The<strong>GP</strong>-B launch will long be remembered—not only by <strong>GP</strong>-B PrincipalInvestigator, Francis Everitt, and the <strong>GP</strong>-B team, but also bythousands of people who have been associated with <strong>GP</strong>-B in one wayor another over the years and countless others who have beenfollowing it.The MOC staff immediately scheduled several extra satellitecommunication passes so they could communicate with the spacecraftmore frequently. Then, over the ensuing 24 hours, they methodicallyworked through a series of tests and command sequences to return thespacecraft to its normal science operation mode. We initially assumedthat the <strong>GP</strong>S receiver had suffered a proton hit in the SAA region, butfurther analysis suggests that this was not the case. Rather, thisanomaly was apparently caused by one of the four accessible <strong>GP</strong>Ssatellites being in the wrong position for proper <strong>GP</strong>S triangulation.The ATC system usually catches situations of this kind and disallowsthe data; but, this one slipped through the filter.The spacecraft has returned to normal operations. This incident wasnot detrimental to the <strong>GP</strong>-B experimental data. And, once again, thefact that an anomalous event occurred while the spacecraft was flyingthrough the SAA region appears to be a coincidence—or is it?The launch was the “end of the beginning” for <strong>GP</strong>-B. The ensuing 4-month IOC period demonstrated the exceptional preparedness anddedication of the <strong>GP</strong>-B team, from dealing with anomalies in orbit tospinning up the four gyros last August, which following the launch,was the second greatest milestone in the program.Now, four months into the 10-month science phase of the mission,our whole <strong>GP</strong>-B team can reflect back on the past year with anenormous sense of pride and accomplishment. And, as we lookforward to the coming year, we are keenly aware of our continuedresponsibility to see this once-in-a-lifetime experiment through to itsfinal conclusion.7 JANUARY 2005—GRAVITY PROBE B WEEKLYUPDATE: Day 262Throughout the holiday season, the <strong>GP</strong>-B spacecraft has remained inexcellent health, with all subsystems performing well and noanomalous events. The <strong>GP</strong>-B spacecraft has now completed more than3,870 orbits over 8.5 months, and on average, the four gyros have eachmade approximately one billion revolutions.494 March 2007 Appendix C — Weekly Chronicle of the <strong>GP</strong>-B Mission
The spacecraft's full-sun season has ended, and it is now experiencinglonger periods of being eclipsed from sunlight by the Earth duringeach orbit. It is flying drag-free around gyro #3, maintaining aconstant roll rate of 0.7742 rpm (77.5 seconds per revolution.) All fourgyros are digitally suspended in science mode. The temperature insidethe dewar is holding steady at 1.82 Kelvin, and it is now less than halffull of superfluid helium. We have been collecting science data for 19weeks, and we are now approximately 45% of the way through thescience phase of the mission. The data collection process is continuingto proceed smoothly, and the quality of the data remains excellent.14 JANUARY 2005—GRAVITY PROBE B WEEKLYUPDATE: Day 269The spacecraft is in excellent health, with all subsystems performingwell. The <strong>GP</strong>-B spacecraft is flying drag-free around gyro #3,maintaining a constant roll rate of 0.7742 rpm (77.5 seconds perrevolution.) All four gyros are digitally suspended in science mode.The temperature inside the dewar is holding steady at 1.82 Kelvin. Wehave been collecting science data for 20 weeks, just under halfwaythrough the science phase of the mission. The data collection processcontinues to proceed smoothly, and the quality of the data remainsexcellent.21 JANUARY 2005—GRAVITY PROBE B WEEKLYUPDATEMission Elapsed Time: 276 days (39 weeks/9 months)Current Orbit #: 4,075 as of 4:30PM PSTSpacecraft General Health: GoodRoll Rate: Normal at 0.7742 rpm (77.5 seconds per revolution)dewar Temperature: 1.82 Kelvin, holding steadyWe are in the process of recovering from the effects of 7 major solarflares that have erupted from the Sun’s surface since 15 January 2005.These flares have resulted in extremely high levels of proton radiationand two multi-bit errors (MBE) in our SRE electronics.In addition, these high levels of solar radiation saturated the <strong>GP</strong>-Btelescope detectors, causing the telescope to lose track of the guide star(IM Pegasi). We have now re-locked the telescope onto the guide star.We have determined that one of the MBEs in the SRE electronics is ina non-critical location, but the second one is in a location that is usedfor SQUID calibration.We are in the process of creating a work-around for the second MBElocation. Our science team reports that the loss of data from theseevents has been minimal, and that it will have no significant effect onthe experimental results.<strong>Gravity</strong> <strong>Probe</strong> B — <strong>Post</strong> <strong>Flight</strong> Analysis • Final <strong>Report</strong> March 2007 495
28 JANUARY 2005—GRAVITY PROBE B MISSIONUPDATEMission Elapsed Time: 283 days (40 weeks/9.25 months)Current Orbit #: 4,178 as of 4:00 PM PSTSpacecraft General Health: GoodRoll Rate: Normal at 0.7742 rpm (77.5 seconds per revolution)Dewar Temperature: 1.82 Kelvin, holding steadyCommand & Data Handling (CDH): Multi-bit errors (MBE): 0, Singlebiterrors (SBE): 8.5 (daily avg.)Last Thursday morning (20 January 2005), <strong>GP</strong>-B entered Safemode 2A(gyro hold), due to the loss of the guide star. Analysis of this safemodeindicated that the telescope detectors were saturated by a large solarflare (X-7 class) that occurred Wednesday night.The solar flare had fluxes spiking several orders of magnitude abovenominal in the > 100MeV proton energy range. Less than a day later(16:27 PST), <strong>GP</strong>-B successfully re-locked onto the guide star and theAttitude and Translation Control (ATC) system returned to itsnominal configuration. During this event, the attitude error of thespacecraft and telescope remained within 800 arcseconds of the guidestar. A preliminary assessment suggests that this event had minimalimpact on the <strong>GP</strong>-B data or experiment.One issue currently being investigated is the spacecraft’s protonmonitor, which had been yielding spurious values before last week’ssolar storm. The proton monitor was power cycled this Tuesday night(25 January). After reboot, it provided two hours of meaningless datafollowed by zeros. The proton monitor team is examining the data foradditional clues, and a review of this issue will be forthcoming.4 FEBRUARY 2005—GRAVITY PROBE B MISSIONUPDATEMission Elapsed Time: 290 days (41 weeks/9.5 months)Science Data Collection: 161 days (23 weeks/5.25 months)Current Orbit #: 4,281 as of 4:00 PM PSTSpacecraft General Health: GoodRoll Rate: Normal at 0.7742 rpm (77.5 seconds per revolution)Dewar Temperature: 1.82 kelvin, holding steadyCommand & Data Handling (CDH): Multi-bit errors (MBE): 1 (See MDSummary below), Single-bit errors (SBE): See MD Summary below)Last weekend, on both Saturday and Sunday, the spacecraft’s maincomputer (CCCA) erroneously displayed a dramatic increase insingle-bit errors (SBE). We observed similar SBE increases in July 2004and one other time since then. In both previous cases, the SBE countquickly returned to normal, and we were unable to determine the rootcause of the erroneous increase. SBEs are self-correcting, so noparticular action is required, but we are monitoring this situation.Also, this past Tuesday, a new multi-bit error (MBE) was discovered ina memory location of the CCCA computer. A command wassubsequently sent to reload this memory location, clearing the MBE.The health of the spacecraft’s Proton Monitor is still underinvestigation. Telemetry indicates that it is powered on, but the dataappears to be corrupt. Note that the science mission is NOT affectedby the loss of the Proton Monitor. The Proton Monitor Engineeringunit is continuing to investigate this failure.We have been notified that the sun spot which caused the <strong>GP</strong>-Bscience telescope to lose track of the guide star two weeks ago, will becoming around to the front side of the sun on 5 February 2005.Geomagnetic activity around the Earth tends to increase after theappearance of sun spots. Thus, we have added extra telemetry passesand increased sensitivity to this issue during the next two weeks.11 FEBRUARY 2005—GRAVITY PROBE B MISSIONUPDATELast week’s intense solar storm has died down, and solar protonactivity, as reported by the National Oceanic & AtmosphericAdministration’s (NOAA) Space Environment Center (SEC), hasreturned to normal levels. (The left solar photo and graph are from lastweek; the solar photo and graph on the right are from today.)Likewise, the <strong>GP</strong>-B spacecraft has returned to normal functioning,with the ATC system locking normally on the guide star each orbitand the telescope detectors returning normal values. <strong>GP</strong>-B was not theonly satellite affected by last week’s solar storm; other satellites faredworse from the ordeal. In fact, given that last week’s solar storm wasthe worst one since October, 2003, the <strong>GP</strong>-B spacecraft performedremarkably well, with a very swift recovery and no significant impactto the experiment.Mission Elapsed Time: 297 days (42 weeks/9.75 months)Science Data Collection: 168 days (24 weeks/5.5 months)Current Orbit #: 4,384 as of 4:00 PM PSTSpacecraft General Health: GoodRoll Rate: Normal at 0.7742 rpm (77.5 seconds per revolution)Dewar Temperature: 1.82 Kelvin, holding steadyCommand & Data Handling (CDH): Multi-bit errors (MBE): 0, Singlebiterrors (SBE): 1,731 (daily average)This past week was a quiet one for <strong>GP</strong>-B, with very few activitiesscheduled. The solar flares that caused us to lose the guide star threeweeks ago came around to the front of the Sun, facing towards Earth,again this past week. We took extra precautions and scheduled extratelemetry passes to deal with possible effects of these solar flares on thespacecraft. However, this time, the solar flares produced no substantialgeomagnetic activity around the Earth. This may be a sign that the Sunhas moved into a quieter part of the solar cycle.496 March 2007 Appendix C — Weekly Chronicle of the <strong>GP</strong>-B Mission
18 FEBRUARY 2005—GRAVITY PROBE B MISSIONUPDATEMission Elapsed Time: 304 days (43 weeks/10.0 months)Science Data Collection: 175 days (25 weeks/5.75 months)Current Orbit #: 4,486 as of 2:00 PM PSTSpacecraft General Health: GoodRoll Rate: Normal at 0.7742 rpm (77.5 seconds per revolution)Dewar Temperature: 1.82 Kelvin, holding steadyCommand & Data Handling (CDH): Multi-bit errors (MBE): 0, Singlebiterrors (SBE): 4,704 (daily average)This past week was again a relatively quiet one for <strong>GP</strong>-B. Solar flareactivity is low, and solar radiation levels are normal. Guide starcapture times (time required to re-lock the telescope onto the guidestar as the spacecraft emerges from behind the Earth each orbit) areaveraging approximately one minute, which is excellent. Thebrightness table was updated for two of the stars that are monitored bythe spacecraft’s star trackers, and this significantly improved the startracker’s performance. Brightness tables for other stars in the startracker catalog will be updated next week.To determine how much helium is currently left in the dewar, the <strong>GP</strong>-B dewar team is in the process of performing another heat pulse meteroperation. The heat pulse test works in the following way: The amountof heat that it takes to warm an object by a specified amount dependson the type of material, its temperature, and its mass. Thus, if the“specific heat” (the amount of heat needed to warm a kilogram ofmaterial by one degree Kelvin) is known, it is a simple matter tomeasure the mass by applying a known amount of heat (usually withan electric heater) and measuring the resultant temperature rise.Star Sensor Magnitude Update was run Thursday to adjust thecataloged magnitude of star 173. As of Tuesday, updates of observedmagnitude of stars 50 and 173 were successful. Other stars’magnitudes may be updated.Two separate communications issues at Poker Flat, AK (2hr40m) andWallops Ground Station (2hr50m) caused brief outages of data. All thedata was recovered from Alaska; Wallops data was unrecoverable.Since the start of the mission, the <strong>GP</strong>-B team has successfully collected99.0% of the data (requirement is 90%).4 MARCH 2005—GRAVITY PROBE B MISSIONUPDATEMission Elapsed Time: 318 days (45 weeks/10.5 months)Science Data Collection: 189 days (27 weeks/6.25 months)Current Orbit #: 4,694 as of 2:00 PM PSTSpacecraft General Health: GoodRoll Rate: Normal at 0.7742 rpm (77.5 seconds per revolution)Dewar Temperature: 1.82 Kelvin, holding steadyCommand & Data Handling (CDH): Multi-bit errors (MBE): 0, Singlebiterrors (SBE): 8,198 (daily average)In the case of the <strong>GP</strong>-B dewar, the situation is simplified by the factthat heat distributes itself virtually instantaneously throughoutsuperfluid helium. The amount of heat used in the test must be largeenough to cause a measurable temperature change (approximately 10millikelvin) but not so large as to appreciably shorten the missionlifetime.The dewar team expects to complete their analysis of the heat pulsedata next week, and we will report the results in next week’s update.Our current expectation is that the science phase of the mission willconclude towards the end of June, and the results of the heat pulsemeter operation will help us determine whether or not the currentmission time line is correct.25 FEBRUARY 2005—GRAVITY PROBE B MISSIONUPDATEMission Elapsed Time: 311 days (44 weeks/10.25 months)Science Data Collection: 182 days (26 weeks/6.0 months)Current Orbit #: 4,589 as of 2:00 PM PSTSpacecraft General Health: GoodRoll Rate: Normal at 0.7742 rpm (77.5 seconds per revolution)Dewar Temperature: 1.82 kelvin, holding steadyCommand & Data Handling (CDH): Multi-bit errors (MBE): 0, Singlebiterrors (SBE): 9,937 (daily average)Three activities occupied our attention this past week:The Heat Pulse Meter Operation (HPMO), used to determine heliumin the dewar, occurred as scheduled on Wednesday night, 16-February. Preliminary analysis has been concluded and a sub-systemlevel review is in progress.Guide star capture times have improved to the one-minute range aftergyro biases were updated on all three axes. This is a typical adjustmentof the positioning gyroscopes on the satellite (which are different thanthe science gyros) that is required due to the influence of the Sun as<strong>GP</strong>-B orbits the Earth. These adjustments allow the satellite to morequickly re-focus, or “capture”, the guide star as it emerges from theEarth's eclipse on each orbit.11 MARCH 2005—GRAVITY PROBE B MISSIONUPDATEMission Elapsed Time: 325 days (46 weeks/10.75 months)Science Data Collection: 196 days (28 weeks/6.50 months)Current Orbit #: 4,767 as of 2:00 PM PSTSpacecraft General Health: GoodRoll Rate: Normal at 0.7742 rpm (77.5 seconds per revolution)Dewar Temperature: 1.83 kelvin, decreasing slowlyCommand & Data Handling (CDH): Now using B-side (backup)computer & guidance systemsMulti-bit errors (MBE): 0, Single-bit errors (SBE): 7 (daily average)The switch-over to the backup systems occurred automatically at 7:17am PST last Friday morning, 4 March 2005, due to two or more multibiterrors (MBE’s) in the flight computer, occurring within a 0.2second interval. The MBEs were caused by radiation hits in the south<strong>Gravity</strong> <strong>Probe</strong> B — <strong>Post</strong> <strong>Flight</strong> Analysis • Final <strong>Report</strong> March 2007 497
magnetic pole. This event triggered pre-programmed safemodes,which in turn resulted in the automatic switch-over. We haveprovided a more complete description of this anomalous event and theensuing recovery efforts in the Mission News Section below.The possibility of a B-side switch during the science phase of themission was anticipated, and the team had recently rehearsed theprocedures for dealing with such an event. As a result, much of therecovery process—which otherwise might have taken two weeks orlonger—was accomplished last weekend. This event has caused us tolose about a week’s worth of science data. Our data collection rate hasbeen running above 99% up to this point in the science phase of themission, and the loss of a week’s data will only reduce that level byabout 2%, which is still well within the mission requirement of 90%.Assuming that this event did not place any non-relativistic torques(forces) on the gyros, the loss of this small amount of data will nothave any significant effect on the outcome of the experiment. Analysisto ensure that this is the case is underway.On Monday evening, 14 March 2005 at 11:38PM PST, the spacecraft'ssafemode system triggered another computer reboot—the secondflight computer reboot within the past two weeks. Telemetry indicatedthat this most recent safemode response was activated when a memorycheckout procedure detected at least three multi-bit errors (MBE’s)within a 0.2 second interval in the B-side computer.Since the switchover from the A-Side (main) computer two weeks ago,the spacecraft has remained in control of the B-Side (backup) flightcomputer. In this configuration, if a new series of MBEs occurs, thespacecraft does not automatically switch back to the A-side computer.Rather, the B-side computer reboots itself, and the mission operationsteam follows a pre-defined set of procedures to restore the normalsystems configuration for science data collection-as was the case thispast Tuesday and Wednesday.This week, the team is still in the process of fine-tuning the backupcontrol systems in order to provide the same level of response andquality of science data that we had been obtaining from the main (Aside)systems prior to this event. These fine-tuning efforts areproceeding well, and we have already resumed science data collection.18 MARCH 2005—GRAVITY PROBE B MISSIONUPDATEMission Elapsed Time: 331 days (47 weeks/11.00 months) as of3/17/05Science Data Collection: 202 days (29 weeks/6.75 months) as of3/17/05Current Orbit #: 4,883 as of 2:00 PM PST on 3/17/05Spacecraft General Health: GoodRoll Rate: Normal at 0.7742 rpm (77.5 seconds per revolution)Dewar Temperature: 1.80 kelvin, rising slowlyCommand & Data Handling (CDH): B-side (backup) computer incontrol, Multi-bit errors (MBE): 3 as of 3/17/05, Single-bit errors(SBE): 7 (daily average) as of 3/17/05In response to the reboot, the mission operations team uploaded andran a set of pre-approved recovery commands on the B-side computer.The spacecraft's roll rate, which had automatically decreased duringthe reboot, was quickly restored to the science value of 0.7742 rpm.The team also sent commands to reboot the SQUID ReadoutElectronics (SRE) as part of the initial recovery response, prior to reacquisitionof the guide star and return to drag-free flight. Thisaccelerated the overall recovery process by a full day. We returned todrag-free operation on Gyro #3 at 5:34PM PST on Tuesday, less than18 hours after the B-side reboot event. After several guide star searchmaneuvers Tuesday night, the guide star was successfully acquired at4:41AM PST on Wednesday, 29 hours after the reboot event.498 March 2007 Appendix C — Weekly Chronicle of the <strong>GP</strong>-B Mission
Because this is the second MBE-triggered event in a two-week period,we have changed the action response of the sequential MBE safemodetest from “rebooting the B-side computer” to “stopping the missiontimeline.” We have made this configuration change because we believethat the reboot response overreacts to the reporting of sequentialMBEs. This change will minimize unnecessary adverse impact toscience data collection that occurs when the <strong>GP</strong>-B flight computerreboots. The cause of the last two safemode response activations isunder investigation, and a fault tree is being developed to identify theroot cause of these events.Each time we experience a switchover or reboot of the on-board flightcomputer, a small amount of science data is lost. If the reboot events ofthe past two weeks have not placed any non-relativistic torques(forces) on the gyros, this small data loss will not have any significanteffect on the outcome of the experiment. Analysis to determinewhether this is the case is in progress.25 MARCH 2005—GRAVITY PROBE B MISSIONUPDATEMission Elapsed Time: 339 days (48 weeks/11.25 months)Science Data Collection: 210 days (30 weeks/7.00 months)Current Orbit #: 5,004 as of 5:00 PM PSTSpacecraft General Health: GoodRoll Rate: Normal at 0.7742 rpm (77.5 seconds per revolution)Dewar Temperature: 1.82 kelvin, holding steadyCommand & Data Handling (CDH): B-side (backup) computer incontrol, Multi-bit errors (MBE): 1 (on 3/18), Single-bit errors (SBE): 8(daily average)Once again last Friday, 18 March 2005 at 7:20AM PST, as thespacecraft was passing over the western edge of the South AtlanticAnomaly (SAA), the B-Side flight computer, which has beencontrolling the spacecraft for the past three weeks, suffered a multi-biterror (MBE) and rebooted. Although last week's reboot was triggeredby an MBE, it was a different situation from the reboots of theprevious two weeks. In the previous two weeks, multiple multi-biterrors occurring within a 0.2 second interval caused a safemode test tofail, which then triggered the reboot response. After the reboot lastMonday, we re-programmed the multiple MBE safemode response tobe less sensitive, and the reboot last Friday was not triggered by afailure of this safemode test. Rather, it was apparently triggered by anMBE striking a critical memory location in the B-side flight controlcomputer, causing the computer to “hang.” A reboot command wasthen executed automatically when a “watchdog timer” in thecomputer's interface module expired without receiving an expectedsignal from the computer. For a more detailed explanation of the flightcomputer's error detection system, see this week's <strong>GP</strong>-B Mission Newsbelow.Because of the reboot, the vehicle roll rate automatically decreasedfrom its normal level of 0.77 rpm to 0.66 rpm, and the telescopebecame unlocked from the guide star, IM Pegasi. However, thespacecraft's Attitude and Translation Control system (ATC) kept thespacecraft and telescope pointed to within 3,000 arcseconds of theguide star using the on-board navigational control gyroscopes.Our mission operations team quickly swung into action, preparing aset of pre-planned recovery commands. The team uploaded thesecommands to the spacecraft, and they were executed at 3:20PM PSTon Friday. The team then commanded the spacecraft to return todrag-free operation at 7:30 PM-just 12 hours after the flight computerreboot. The guide star was re-captured at 8:40 PM on Friday evening,concluding a swift and flawless execution of the recovery procedure.On Saturday, the team sent real-time commands to optimize theattitude control performance, including enabling both roll and ratefilters, powering on the A-side navigation control gyro, and enablingthe science dither (an error reduction technique). We also switchedback to the A-side (main) navigation control gyroscopes, and byWednesday, 23 March, the spacecraft's ATC pointing performancehad improved to the pre-anomaly level. Finally, the team reprogrammeda section of the ACT’s stored commands, so that in theevent of a future computer reboot, the vehicle will not roll down. Thisshould result in better pointing accuracy during the anomaly periodand faster recovery.Last Friday's reboot anomaly presented yet another challenge to ourmission operations team—a challenge that they faced and overcamewith professionalism and teamwork. Congratulations to the team fortheir continued outstanding performance.<strong>Gravity</strong> <strong>Probe</strong> B — <strong>Post</strong> <strong>Flight</strong> Analysis • Final <strong>Report</strong> March 2007 499
8 APRIL 2005—GRAVITY PROBE B MISSIONUPDATEMission Elapsed Time: 353 days (50 weeks/11.57 months)Science Data Collection: 224 days (32 weeks/7.34 months)Current Orbit #: 5,210 as of 4:00 PM PSTSpacecraft General Health: GoodRoll Rate: Normal at 0.7742 rpm (77.5 seconds per revolution)Dewar Temperature: 1.82 kelvin, holding steadyCommand & Data Handling (CDH): B-side (backup) computer incontrol, Multi-bit errors (MBE): 0, Single-bit errors (SBE): 7 (dailyaverage)1 APRIL 2005—GRAVITY PROBE B MISSIONUPDATEMission Elapsed Time: 346 days (49 weeks/11.50 months)Science Data Collection: 217 days (31 weeks/7.11 months)Current Orbit #: 5,10 as of 4:00 PM PSTSpacecraft General Health: GoodRoll Rate: Normal at 0.7742 rpm (77.5 seconds per revolution)Dewar Temperature: 1.82 kelvin, holding steadyCommand & Data Handling (CDH): B-side (backup) computer incontrol, Multi-bit errors (MBE): 1 (on 3/26), Single-bit errors (SBE): 9(daily average)Last Saturday, the Gyro Suspension (GSS) computer for gyro #4reported a multi-bit error (MBE). Upon investigation of this MBE, theGSS team determined that it was in a memory location that wouldsoon be accessed by a program command sequence. To avert thecomputer reboot problems that the spacecraft has been experiencingfor the past three weeks, the team sent commands to the flightcomputer halting the mission timeline. Then, as described in lastweek's Mission News, computer specialists used the Integrated TestFacility (ITF) simulator at Lockheed Martin to determine the correctvalue for the afflicted memory location and uploaded a patch to repairthat location. After this repair, the team sent a revised commandtimeline to the GSS computer and resumed normal operations.Because of the team's intervention, the guide star lock was not lost andthe spacecraft remained in drag-free flight throughout this period.Also, gyro #4 remained digitally suspended in science (data collection)mode. Complete recovery from this MBE took only a few hours,thanks to the diligence of the team.Investigations into the root causes of the recent spate of MBEssuggests the possibility that the scrub routine which is checking thememory cells of the on-board Command & Control ComputerAssembly (CCCA) could trigger a safemode response on a single MBEif that error occurs in certain locations. As a result, the team has reprogrammedthe safemode response for the MBE test to automaticallystop the mission timeline, rather than rebooting the computer.Also this past week, the <strong>GP</strong>-B team continued work on the Attitudeand Translation Control system (ATC) and the telescope detectors.The purpose of these adjustments is to enable the spacecraft to remainunder control of the science gyros (rather than the navigation controlgyros) in all orbits through the South Atlantic Anomaly (SAA) region.For a number of weeks now, the spacecraft has been experiencingdegraded attitude performance in the South Atlantic Anomaly (SAA)region. As a short-term fix for this problem, we have beencommanding the Attitude and Translation Control system (ATC) toswitch from the science telescope to the spacecraft's navigationalgyroscopes for controlling the spacecraft's attitude while in the SAAregion. This has increased the spacecraft's stability in the SAA, butsince we only use relativity data collected when the science telescope isin control of the ATC, we have effectively been losing science data inthose orbits where the spacecraft passes through the SAA undernavigational gyro control.Over these past few weeks, our Attitude and Translation Control(ATC) group has been working very hard to fine tune the ATC systemso that the science telescope can remain in control of the spacecraft'sattitude in the SAA region. Three weeks ago, we made some progresson this issue by shrinking our defined boundaries of the SAA region,thus reducing the number of orbits affected. Two weeks ago, the ATCgroup made further progress by changing the ATC gain settings(similar to adjusting the volume control on a radio). Finally, this pastweek, the ATC group adjusted the gain settings on the TelescopeReadout Electronics (TRE). This past week's adjustments, incombination with those previously made, have mitigated this issue.The science telescope is now able to remain locked on the guide star inall passes through the SAA, and we are once again collecting sciencedata in all orbits.Also this past week, we started making detailed plans for the postscienceinstrument re-calibration phase, estimated to begin early inJuly.15 APRIL 2005—GRAVITY PROBE B MISSIONUPDATEMission Elapsed Time: 360 days (51 weeks/11.80 months)Science Data Collection: 231 days (33 weeks/7.57 months)Current Orbit #: 5,316 as of 9:00 PM PSTSpacecraft General Health: GoodRoll Rate: Normal at 0.7742 rpm (77.5 seconds per revolution)Dewar Temperature: 1.82 kelvin, holding steady500 March 2007 Appendix C — Weekly Chronicle of the <strong>GP</strong>-B Mission
Command & Data Handling (CDH): B-side (backup) computer incontrol, Multi-bit errors (MBE): 0, Single-bit errors (SBE): 6 (dailyaverage)Around February of this year, we entered a <strong>GP</strong>-B “season” where thefront of the spacecraft is pointing towards the sun. Many of theelectronics boxes on-board the spacecraft are located in the ForwardEquipment Enclosure (FEE), and we are in the process of investigatingthe possibility that the spacecraft's sunward orientation may be acontributing factor to the increase in multi-bit errors (MBEs) weexperienced a few weeks ago, as well as some of the attitude controlissues we have experienced recently—especially in the South AtlanticAnomaly (SAA) region.This past week, we made further progress operating the spacecraftthrough the SAA region. In analyzing the SAA attitude data we havecollected recently, our ATC group noticed some interesting patterns.They have now investigated these patterns and determined that a datatype conversion routine was causing data values exceeding a certainthreshold to become corrupted. This situation was greatly exacerbatedin the SAA region, where the telescope's detectors were being floodedwith stray protons, which causes a noticeable increase in thesecorrupted data values.As reported in last week's update, we addressed these SAA attitudeproblems by shrinking our defined size of the SAA region andreducing the gains on both the ATC system and the telescopedetectors. These gain reductions have provided a work-around for thisdata corruption problem by re-scaling the data values so that they nolonger exceed the threshold in the SAA region. As a result, ourspacecraft can now point at the guide star throughout the SAA regionwith the same precision as it does outside the SAA.Also last week, we exercised the Ultraviolet Discharge procedure onscience gyros #1, #2, and #4, followed later by drag-free gyro #3. Thisprocedure reduces the electrostatic charge that builds up on the gyrorotors over time. The rotors build up a charge in two ways: first, theprocess of suspending the rotors electrically deposits some chargedparticles on them, and second, protons from the sun are constantlybombarding the spacecraft, especially over the SAA region, and someof these protons strike the rotors and leave a residual charge on them.Finally, this past week, we began planning for another heat pulse testto determine the level of liquid helium remaining in the dewar. Wealso continued our detailed planning for the post-science instrumentre-calibration phase, estimated to begin early in July.22 APRIL 2005—GRAVITY PROBE B MISSIONUPDATEMission Elapsed Time: 367 days (52 weeks/12.00 months)Science Data Collection: 238 days (34 weeks/7.80 months)Current Orbit #: 5,419 as of 9:00 PM PSTSpacecraft General Health: GoodRoll Rate: Normal at 0.7742 rpm (77.5 seconds per revolution)Dewar Temperature: 1.82 kelvin, holding steadyCommand & Data Handling (CDH): B-side (backup) computer incontrol, Multi-bit errors (MBE): 0, Single-bit errors (SBE): 9 (dailyaverage)Our mission operations team performed routine tasks over this pastweek related to the electrostatic discharge of Gyro #3 (the “drag-free”gryo) and minor dewar pressure oscillations. After performing anumber of tests on Gyro #3 early in the week, it was discharged onThursday to -3.0 mV, using ultraviolet light, as explained in last week'supdate.The Attitude and Translation Control (ATC) group reports that thetime required to re-lock onto the guide star as the spacecraft emergesfrom behind the Earth each orbit continues to be excellent, includingone guide-star capture (re-locking) this weekend that took only 20seconds.<strong>Gravity</strong> <strong>Probe</strong> B — <strong>Post</strong> <strong>Flight</strong> Analysis • Final <strong>Report</strong> March 2007 501
On Tuesday afternoon (19-April), <strong>GP</strong>-B Principal Investigator,Francis Everitt, delivered a Physics Colloquium to a packedauditorium at <strong>Stanford</strong> entitled: “The <strong>Gravity</strong> <strong>Probe</strong> B <strong>Flight</strong> Mission:A <strong>Stanford</strong> Physics-Engineering Partnership”. In this lecture,Professor Everitt explained some of the finer points of <strong>GP</strong>-B's varioustechnologies, emphasizing in each case the interdisciplinarycollaborations required to produce these extraordinary technologicalinnovations.29 APRIL 2005—GRAVITY PROBE B MISSIONUPDATEMission Elapsed Time: 374 days (53 weeks/12.26 months)Science Data Collection: 245 days (35 weeks/8.03 months)Current Orbit #: 5,523 as of 5:00 PM PSTSpacecraft General Health: GoodRoll Rate: Normal at 0.7742 rpm (77.5 seconds per revolution)Dewar Temperature: 1.82 kelvin, holding steadyCommand & Data Handling (CDH): B-side (backup) computer incontrol, Multi-bit errors (MBE): 0, Single-bit errors (SBE): 8 (dailyaverage)This past Tuesday, 26 April 2005, the <strong>GP</strong>-B dewar team ran anotherheat pulse meter test to get an update on the amount of liquid heliumremaining in the dewar. Their preliminary results suggest that we haveabout two weeks more helium than anticipated. Further analysis is inprocess, and if these results are correct, the helium will be depletedaround the end of August or beginning of September. This means thatwe will be able to continue collecting science data into the first twoweeks in July, before beginning a very important series of instrumentcalibration tests that must be completed before the helium runs out.Also this past week, we continued fine-tuning our SQUID readoutsystem, analyzing potential sources of noise. To this end, we turned offthe telescope dithering motion all day on Wednesday, 27 April 2005 todetermine its contribution to experimental noise.Likewise, for the same reason, on Thursday, we turned off theExperiment Control Unit (ECU) for several days. We are in theprocess of analyzing the results of these noise experiments, which maylead to further fine-tuning of various spacecraft systems.6 MAY 2005—GRAVITY PROBE B MISSION UPDATEMission Elapsed Time: 381 days (54 weeks/12.49 months)Science Data Collection: 252 days (36 weeks/8.26 months)Current Orbit #: 5,627 as of 5:00 PM PSTSpacecraft General Health: GoodRoll Rate: Normal at 0.7742 rpm (77.5 seconds per revolution)Dewar Temperature: 1.82 kelvin, holding steadyCommand & Data Handling (CDH): B-side (backup) computer incontrol, Multi-bit errors (MBE): 1, Single-bit errors (SBE): 9 (dailyaverage)Further analysis of the results of the heat pulse test run on Tuesday, 26April 2005, to determine the amount of liquid helium remaining in thedewar, confirms the preliminary prediction that the helium in thedewar will be depleted in late August or early September. Based onthese results, the <strong>GP</strong>-B mission operations team is planning tocomplete readout calibrations, some of which can be done while weare still collecting science data, by the beginning of August. Gyrotorque calibrations, which cannot be done during the science phase ofthe mission because they involve placing small torques (forces) on thegyro rotors, will commence early in August and continue until thehelium runs out.Our telescope pointing and guide star capture times continue to beexcellent, thanks to recent fine-tuning of the spacecraft's Attitude andTranslation Control system (ATC) parameters. We have alsodetermined that we can reduce some noise in the SQUID ReadoutElectronics system (SRE) by turning off the Experiment Control Unit.However, we will now periodically power on the ECU for about 6hours in order to obtain certain readouts that require informationfrom the ECU.Finally, a memory location in the B-side (backup) flight computer thatis now controlling the spacecraft sustained a multi-bit error (MBE) lastSaturday, 30 April 2005. The memory location affected is not currentlybeing used. Following new procedures developed a few weeks ago,when we were experiencing an increased level of MBEs, our computeroperations team quickly uploaded a patch to correct the contents ofthe affected memory location.Also this past week, the <strong>GP</strong>-B Anomaly Review Board met todetermine whether or not to change the pre-programmed safemodetrigger and response to MBEs detected in the main flight computer.After a lengthy discussion, it was decided to change the safemodetrigger condition from 3 to 9 MBEs and the response actions from502 March 2007 Appendix C — Weekly Chronicle of the <strong>GP</strong>-B Mission
simply stopping the timeline (halting execution of the command setcurrently loaded into the computer) to automatically rebooting thecomputer. These changes ensure that if the error occurs in a memorylocation that increments the error counter at 10 Hz, the computer willautomatically reboot immediately, rather than possibly freezing upand waiting for up to 8 hours for an “aliveness” test to trigger a reboot.13 MAY 2005—GRAVITY PROBE B MISSIONUPDATEMission Elapsed Time: 388 days (55 weeks/12.72 months)Science Data Collection: 259 days (37 weeks/8.49 months)Current Orbit #: 5,726 as of 5:00 PM PSTSpacecraft General Health: GoodRoll Rate: Normal at 0.7742 rpm (77.5 seconds per revolution)Dewar Temperature: 1.82 kelvin, holding steadyCommand & Data Handling (CDH): B-side (backup) computer incontrol, Multi-bit errors (MBE): 0, Single-bit errors (SBE): 9 (dailyaverage)Our telescope pointing and guide star capture times continue to beexcellent. The Experiment Control Unit continues to remain offduring most orbits, resulting in reduced noise in the SQUID ReadoutElectronics system (SRE). Once a week, we power the ECU back on fora few hours in order to obtain and check certain readouts, such as thedewar temperature, that are provided by the ECU.The NASA Distinguished Public Service Medal is awarded to anindividual whose distinguished accomplishments contributedsubstantially to NASA's mission. Contributions must be soextraordinary that other forms of recognition by NASA would beinadequate. This is the highest honor that NASA confers to anindividual who is not a government employee.Because the spacecraft has been in orbit for over a year now, we areable to conduct an analysis of the external temperature and solar arrayefficiencies by comparing current data from these systems with datacollected a year ago.In preparation for the end of the <strong>GP</strong>-B mission, which is fastapproaching, we have begun delegating tasks to complete our finalmission report, which we will deliver to NASA in July.<strong>GP</strong>-B PRINCIPAL INVESTIGATOR FRANCIS EVERITTHONORED BY NASAFollowing is a copy of the press release we sent out earlier this week,announcing this award.<strong>Stanford</strong> experimental physicist Francis Everitt has been awarded aNASA Distinguished Public Service Medal. NASA Deputy DirectorFred Gregory presented the medal to Everitt on April 27 at an awardsceremony at NASA Headquarters in Washington, D.C. Everitt isprincipal investigator of the <strong>Gravity</strong> <strong>Probe</strong> B (<strong>GP</strong>-B) experiment, acollaboration between <strong>Stanford</strong> University, NASA and LockheedMartin Corp. that is testing predictions of Albert Einstein's 1916general theory of relativity (his theory of gravitation) by means of fourultra-precise gyroscopes that have been orbiting the Earth in a satellitefor just over a year.Everitt obtained his doctorate at the University of London (ImperialCollege) in 1959 for research under Nobel laureate P. M. S. Blackett.He then spent two years at the University of Pennsylvania working onliquid helium. In 1962, Everitt joined William Fairbank and LeonardSchiff in the <strong>Stanford</strong> Physics Department as the first full-timeresearch worker on the <strong>GP</strong>-B experiment. His efforts advanced thestate of the art in the areas of cryogenics, magnetics, quantum devices,telescope design, control systems, quartz fabrication techniques,metrology and, most of all, gyroscope technology. His leadership asthe principal investigator for <strong>GP</strong>-B advanced the <strong>GP</strong>-B program fromthe concept and technology development stages to the experiment'slaunch on April 20, 2004, and its ensuing orbital operations.“None of us at the beginning had any idea how long it would take forthe <strong>GP</strong>-B spacecraft to fly and take the science data,” Everitt said whenasked about the long life of the project. “But speaking for myself, Ihave never been bored.”<strong>Gravity</strong> <strong>Probe</strong> B was developed on the <strong>Stanford</strong> campus in the W. W.Hansen Experimental Physics Laboratory (HEPL). The current onorbit<strong>GP</strong>-B mission operations center (MOC) is located in HEPL,where the science data is currently processed as well. From the MOC,the <strong>GP</strong>-B spacecraft is commanded with ground antennas in Alaska or<strong>Gravity</strong> <strong>Probe</strong> B — <strong>Post</strong> <strong>Flight</strong> Analysis • Final <strong>Report</strong> March 2007 503
Norway or through the NASA space net. HEPL supports a number ofcollaborative scientific research programs that cross traditionaluniversity departmental boundaries. The <strong>GP</strong>-B space mission itselfwas a successful interdepartmental collaboration of the <strong>Stanford</strong>Physics and Engineering departments.“HEPL is one of the few places in the United States where aninterdisciplinary experiment such as <strong>Gravity</strong> <strong>Probe</strong> B could besuccessfully carried out,” said HEPL Director Robert Byer, a professorof applied physics.20 MAY 2005—GRAVITY PROBE B MISSIONUPDATEMission Elapsed Time: 395 days (56 weeks/12.95 months)Science Data Collection: 266 days (38 weeks/8.72 months)Current Orbit #: 5,830 as of 5:00 PM PSTSpacecraft General Health: GoodRoll Rate: Normal at 0.7742 rpm (77.5 seconds per revolution)Dewar Temperature: 1.82 kelvin, holding steadyCommand & Data Handling (CDH): B-side (backup) computer incontrol, Multi-bit errors (MBE): 1 (Gyro Suspension System on5/20/05), Single-bit errors (SBE): 8 (daily average)At the most recent weekly review of all spacecraft subsystems, one ofour <strong>GP</strong>-B mission directors remarked that this past week has been oneof the quietest and smoothest since launch. Our telescope pointingand guide star capture times continue to be excellent. To minimizenoise in the SQUID Readout Electronics (SRE), the ExperimentControl Unit (ECU) is now only being powered on for a few hourseach week in order to obtain a set of readouts, such as the dewartemperature, that are provided We have also begun some preliminarySQUID calibration signal tests. These tests involve turning oncalibration signals on one pair of SQUIDs for one day, while turningthese signals off on the other pair of SQUIDS. The next day, we reversethe procedure, turning off the calibration signals on the first pair ofSQUIDs and vice versa. At the end of the test, we will compare theresults. These tests do not in any way affect the science data collection,but they help us evaluate the performance of the four SQUIDS relativeto each other.by the ECU.Because these final instrument calibration tests place controlledtorques (forces) on the gyros, they cannot be performed until after thedata collection has been completed.27 MAY 2005—GRAVITY PROBE B MISSIONUPDATEMission Elapsed Time: 402 days (57 weeks/13.18 months)Science Data Collection: 273 days (39 weeks/8.95 months)Current Orbit #: 5,933 as of 5:00 PM PSTSpacecraft General Health: GoodRoll Rate: Normal at 0.7742 rpm (77.5 seconds per revolution)Dewar Temperature: 1.82 kelvin, holding steadyCommand & Data Handling (CDH): B-side (backup) computer incontrol, Multi-bit errors (MBE): 0, Single-bit errors (SBE): 15 (dailyaverage)The spacecraft has entered its third solstice or full-sun period of themission. During these periods, the plane of the spacecraft's orbit isperpendicular with respect to the sun's position for about two weeks.Thus, the sun shines broadside on the spacecraft throughout eachorbit around the Earth. As in previous full-sun periods, some finetuning of various spacecraft systems is required to counter the effectsof temperature increases in the dewar shell and the electronics boxesmounted in the bays of the spacecraft frame.Preliminary SQUID calibration signal tests, described in last week'sMission Director's Summary, are continuing. These tests do not affectthe science data collection, but they help us evaluate the performanceof the four SQUIDS relative to each other.Also, development of procedures for the final set of instrumentcalibration tests that will occur in August, just before the liquid heliumin the dewar is exhausted, are continuing. Likewise, the plans for twofull-day simulations, during which the Mission Operations Team willrehearse executing these procedures and work through any issues orproblems, are being finalized.3 JUNE 2005—GRAVITY PROBE B MISSION UPDATEPreparations for the end of the <strong>GP</strong>-B mission are now in full swing.Various chapters of our final mission report, which we will deliver toNASA late this summer, are currently being drafted. Procedures forthe final set of instrument calibration tests, which will occur in August,just before the liquid helium in the dewar is exhausted, are now beingcreated. The mission operations team will practice using theseprocedures during two upcoming calibration phase simulations.Mission Elapsed Time: 409 days (58 weeks/13.40 months)Science Data Collection: 280 days (40 weeks/9.18 months)Current Orbit #: 6,036 as of 5:00 PM PSTSpacecraft General Health: GoodRoll Rate: Normal at 0.7742 rpm (77.5 seconds per revolution)Dewar Temperature: 1.82 kelvin, holding steadyCommand & Data Handling (CDH): B-side (backup) computer incontrol, Multi-bit errors (MBE): 2 (in SRE computer on 5/30), Singlebiterrors (SBE): 7 (daily average)504 March 2007 Appendix C — Weekly Chronicle of the <strong>GP</strong>-B Mission
Late last Thursday, Gyro #2 transitioned from its normal digitalsuspension to analog backup suspension mode. This gyro was resuspendedin digital mode last Saturday, 28 May 2005, and it hasremained digitally suspended since that time. The root cause of thistransition is still under investigation.gyros are located in slightly different positions on the quartz block,we must apply small voltages to their suspension systems to flythem drag-free around Gyro #3's position. The feed-forward termis an adjustment factor for anticipating the position of the othergyros in order to prevent error build-up. Our initial calculation ofthe feed-forward term prior to launch was fairly accurate, and we'vebeen using it thus far in the mission. However, based on 13 monthsof flight data, we are able to update this term to be even moreaccurate, which we did this past week. We will now use the updatedfeed-forward term for the duration of the science (data collection)phase.• Increasing the preload voltage on science gyro #3 to 1.5V for a brieftime. The Gyro Suspension System (GSS) for each gyro has a“preload voltage” and a “control voltage.” You can think of thepreload voltage as coarse positioning and the control voltage as finepositioning. Generally, we like to keep these voltages about equal.However, right now as part of our calibration tests, we arepurposely changing the preload voltage for a brief time to see theeffect of this asymmetry. Note that we can perform this calibrationtest while remaining in drag-free flight.Last Sunday, 20 May 2005, the SQUID Readout Electronics (SRE)computer experienced two multi-bit errors (MBEs). One of theseerrors was located in a data buffer location that cleared itself, thusremoving the error. The second error was located in a section ofprogram code that is not planned for use. In response, the MissionOperations team has since removed this code module from thecomputer's database, so that it cannot be accessed inadvertently.Various planned preliminary calibration tests are continuing,including some tests of Gyro #3 and the drag-free system. Such testsare standard operating procedure on experimental missions. Duringthese tests, we purposely vary certain parameters that would not beexpected to change greatly during the experimental portion of themission for the purpose of characterizing instrument componentperformance. In order to maximize the length of the science datacollection phase of the <strong>GP</strong>-B mission, we are currently running somepreliminary calibrations that can safely be performed while we are stillcollecting science data. Our final calibration tests, which must becompleted before the helium in the dewar is depleted, involve placingtorques (forces) on the gyros, so we can only perform these tests afterdata collection is finished—early in August.10 JUNE 2005—GRAVITY PROBE B MISSIONUPDATEMission Elapsed Time: 416 days (59 weeks/13.64 months)Science Data Collection: 287 days (41 weeks/9.41 months)Current Orbit #: 6,139 as of 4:30 PM PSTSpacecraft General Health: GoodRoll Rate: Normal at 0.7742 rpm (77.5 seconds per revolution)Dewar Temperature: 1.82 kelvin, holding steadyCommand & Data Handling (CDH): B-side (backup) computer incontrol, Multi-bit errors (MBE): 1 (in SRE computer on 6/6), Single-biterrors (SBE): 8 (daily average)Over the past two weeks, we have performed several routineadjustments to various systems on the spacecraft and continued ourpreliminary calibration tests. These included:• Updating the feed-forward term of the backup drag-free controller.The spacecraft is flying drag-free around Gyro #3, which meansthat this gyro is treated as its center of mass. Since the other three• Starting a new readout calibration cycling plan where we operatethe calibration signal on either SQUID's #1 and #2, or SQUIDs #3and #4, with the other pair off. (We toggle the paris every 24 hours.)This is another of the preliminary calibration tests that we arecurrently conducting.On Monday 6 June 2005, a multi-bit error (MBE) occurred in theSQUID Readout Electronics (SRE) computer. A preliminary analysisof this error suggests that the memory location in which the erroroccurred is not being used, and most likely, this MBE is benign.However, if after further investigation, this is not the case, we willreboot the SRE computer to clear the error.Finally, another Heat Pulse meter test to re-check the level of thehelium remaining in the dewar is scheduled for Monday, 13 June 2005.If the results of this test correlate well with previous results, this will bethe last heat pulse test of the mission.17 JUNE 2005—GRAVITY PROBE B MISSIONUPDATEMission Elapsed Time: 423 days (60 weeks/13.87 months)Science Data Collection: 294 days (42 weeks/9.64 months)Current Orbit #: 6,242 as of 4:30 PM PSTSpacecraft General Health: GoodRoll Rate: Normal at 0.7742 rpm (77.5 seconds per revolution)<strong>Gravity</strong> <strong>Probe</strong> B — <strong>Post</strong> <strong>Flight</strong> Analysis • Final <strong>Report</strong> March 2007 505
Dewar Temperature: 1.82 kelvin, holding steadyCommand & Data Handling (CDH): B-side (backup) computer incontrol, Multi-bit errors (MBE): 0, Single-bit errors (SBE): 8 (dailyaverage)The <strong>GP</strong>-B spacecraft is beginning to move out its full-sun “season,”and it is once again being eclipsed from sunlight by the Earth for aportion of each orbit. Because of the geometry of the spacecraft's polarorbit around the Earth, and the Earth's orbit around the sun, thespacecraft experiences two “seasons” when the plane of the spacecraft'sorbit is perpendicular with respect to the sun's position for about twoweeks. Thus, the sun shines broadside on the spacecraft throughouteach orbit around the Earth. During these full-sun periods, theAttitude Reference Platform (ARP) containing the star trackers andother equipment heats up, causing it to move slightly, andconsequently we must adjust certain parameters to counteract thismotion. Then, as the full-sun season comes to an end, we re-adjustthese parameters back to their normal settings.A final heat pulse test was run on the dewar this past Monday, 13 June2005. The results of this test indicate that the liquid helium in thedewar will run out towards the beginning of September. This result isconsistent with previous heat pulse measurements, so this was the lastheat pulse measurement we will perform.Preliminary SQUID calibration signal tests described in previousMission Director's Summaries are continuing. These tests do not affectthe science data collection, but they help us evaluate the performanceof the four SQUIDS relative to each other.is currently not in use. Thus, a memory patch was prepared anduploaded to the spacecraft, and this event had no further impact onthe mission.On Wednesday, 22 June 2005, as part of our ongoing instrumentcalibration tests, we switched the spacecraft's drag-free control fromgyro #3 to gyro #1. The purpose of this switch is to determine whetheror not certain gyro control data values that have been uniquelyobserved on gyro #3 are a function of the drag-free system or gyro #3itself. The process of moving drag-free operation from gyro #3 to gyro#1 went very smoothly, and we intend to continue drag-free operationaround gyro #1 for the remainder of the science phase of the mission.1 JULY 2005—GRAVITY PROBE B MISSION UPDATEMission Elapsed Time: 437 days (62 weeks/14.32 months)Science Data Collection: 308 days (44 weeks/10.10 months)Current Orbit #: 6,449 as of 3:00 PM PSTSpacecraft General Health: GoodRoll Rate: Normal at 0.7742 rpm (77.5 seconds per revolution)Dewar Temperature: 1.82 kelvin, holding steadyCommand & Data Handling (CDH): B-side (backup) computer incontrol, Multi-bit errors (MBE): 1 (in GSS computer on 6/30), Singlebiterrors (SBE): 15 (daily average)This past week was relatively quiet for <strong>GP</strong>-B mission operations.Several routine adjustments were made in various spacecraft systems,and preliminary instrument calibration tests are continuing.24 JUNE 2005—GRAVITY PROBE B MISSIONUPDATEMission Elapsed Time: 430 days (61 weeks/14.01 months)Science Data Collection: 301 days (43 weeks/9.87 months)Current Orbit #: 6,345 as of 3:00 PM PSTSpacecraft General Health: GoodRoll Rate: Normal at 0.7742 rpm (77.5 seconds per revolution)Dewar Temperature: 1.82 kelvin, holding steadyCommand & Data Handling (CDH): B-side (backup) computer incontrol, Multi-bit errors (MBE): 1 (in main CCCA computer on 6/20),Single-bit errors (SBE): 9 (daily average)Last Monday, 20 June 2005, a multi-bit error (MBE) occurred in the B-Side (backup) main computer (CCCA). Our resident computer experttraced the location of this error to a thruster initialization routine thatDuring the mission up to this point, we have been cycling certainapplications on and off in the SQUID Readout Electronics (SRE) andTelescope Readout Electronics (TRE) computers during Guide StarValid (GSV) and Guide Star Invalid (GSI) periods to ensure that thesecomputers have adequate margin for memory scrubbing, whichautomatically corrects single-bit errors (SBEs). Based on recentengineering tests, we have determined that leaving these applicationson all the time, instead of cycling them on and off, doubles the lengthof the memory scrub period, which doubles the likelihood of thesecomputers sustaining a multi-bit error (MBE) composed of two SBEsin a single memory word during a scrub cycle. However, based on theengineering tests and on-orbit experience, we have determined thatthe probability of sustaining an MBE composed of two SBEs wasdeemed to be an acceptable level of risk. The advantage of keepingthese applications enabled all the time is that it provides simultaneousdata on trapped flux and the London moment, in addition to thescience pointing (relativity) data.506 March 2007 Appendix C — Weekly Chronicle of the <strong>GP</strong>-B Mission
On Wednesday 29 June 2005, members of our Anomaly Review Boardpresented information about our <strong>GP</strong>-B anomaly review process to aNASA group studying anomaly resolution best practices at NASA'sAmes Research Center here in Mountain View, CA.On Thursday, 30 June 2005, a multi-bit error (MBE) occurred in abenign location in the Gyro Suspension (GSS) computer for gyro #2.This memory location was subsequently patched, restoring its propervalue.8 JULY 2005—GRAVITY PROBE B MISSION UPDATEMission Elapsed Time: 444 days (63 weeks/14.56 months)Science Data Collection: 315 days (45 weeks/10.33 months)Current Orbit #: 6,553 as of 5:30 PM PSTSpacecraft General Health: GoodRoll Rate: Normal at 0.7742 rpm (77.5 seconds per revolution)Dewar Temperature: 1.82 kelvin, holding steadyCommand & Data Handling (CDH): B-side (backup) computer incontrol, Multi-bit errors (MBE): 0, Single-bit errors (SBE): 6 (dailyaverage)As of Mission Day 444, the <strong>Gravity</strong> <strong>Probe</strong> B vehicle and payload are ingood health. All four gyros are digitally suspended in science mode.The spacecraft is flying drag-free around Gyro #1.Last Saturday, 2 July 2005, a <strong>GP</strong>S channel alignment error flag wastriggered in the spacecraft's B-side (backup) Global PositioningSystem (<strong>GP</strong>S) as it passed over the Earth's north magnetic pole. Wehave seen this same behavior twice before with the A-side (main) <strong>GP</strong>Sreceiver, and in both previous cases there was no discernible effect onthe <strong>GP</strong>S system performance. An analysis of this latest event is inprogress, and if necessary, we will reboot the <strong>GP</strong>S system.Otherwise, all was quiet and nominal on-board the <strong>GP</strong>-B spacecraftduring this year's 4th of July holiday weekend. Because its orbit did notpass over North America last Monday evening, the telescope detectorson-board the spacecraft did not register any brilliant bursts ofpyrotechnics in the skies over U.S cities.Yesterday, we performed a calibration test on gyro #3 (formerly thedrag-free gyro) in which the gyro rotor was electrically “nudged” tovarious pre-defined positions within its housing. About 45 minutesinto this test, the Gyro Suspension System (GSS) for gyro #3automatically switched from digital to analog suspension mode.Analog suspension is used primarily as a backup mode that holds agyro rotor securely to keep it from striking the housing wall and allowsonly coarse positioning of the rotor. By contrast, digital suspensionmode is computer-controlled; it puts less torque on the rotor andenables its position within the housing to be controlled with extremelyhigh precision. Yesterday evening, we sent commands to re-suspendgyro #3 in digital mode, and the calibration tests are continuing todayand into the weekend. Due to the nature of this calibration test and theperformance history of gyro #3, we will not be surprised if ittransitions to analog mode again during the second phase of thiscalibration test.performance stabilizes during this period because the Sun is no longerheating up the spacecraft's attitude reference platform (ARP), wherethe navigational rate gyros and star trackers are mounted, on theforward dome of the dewar.As we have reported recently, our measurements indicate that thesuperfluid helium in the dewar will be exhausted in approximatelyeight weeks—during the period of maximum ATC stabilization. Thissituation has raised some questions about how to proceed through thefinal two months of the mission. Our original plan was to stopcollecting relativity data 3-5 weeks before the helium runs out and tospend those final weeks of the mission exclusively running calibrationtests of the science instruments. Some of these tests involve placingtorques (forces) on the gyros, and we cannot use the science datacollected from a gyro while it is undergoing such a test. Anothercalibration test involves purposely moving the telescope's pointingaxis away from our guide star, IM Pegasi, to a different star and thenback again. Clearly, we cannot collect any science data during thistelescope pointing test.However, our plan for spending the final 3-5 weeks of the missionexclusively running calibration tests is not cast in stone, and we arecurrently at a point of making some trade-off decisions in this regard.For example, we have determined that it is possible to perform thegyro torquing calibration tests on an individual gyro, while the othergyros continue to collect science data. (We are performing such acalibration test on gyro #3 right now.) To address these issues andtrade-offs, our <strong>GP</strong>-B management and science teams spent the entireday today at an off-site meeting. The decisions resulting from this offsitemeeting will determine our course of action for the remainder ofthe mission, and we will report on these decisions in an upcomingMission News story.In conjunction with today's off-site meeting, yesterday we had a visitfrom Tony Lyons, our NASA Program Manager at NASA's MarshallSpace <strong>Flight</strong> Center (MSFC) in Huntsville, Alabama and his boss,Tony Lavoie, Director of Space Systems Programs at MSFC. TonyLavoie assumed his current role at the Marshall Center last October,and he had never before visited <strong>GP</strong>-B. So, instead of our usual dailyall-hands meeting yesterday, we began the day with a briefpresentation to both of our MSFC visitors by <strong>GP</strong>-B PrincipalInvestigator, Francis Everitt, <strong>GP</strong>-B Program Manager, Gaylord Green,and several <strong>GP</strong>-B staff members.ANALYZING END OF MISSION TRADE-OFFSTowards the beginning of June, the spacecraft transitioned out of itstwo-week full sun season to once again being eclipsed from the Sun forpart of each orbit. Furthermore, the position of the Earth relative tothe Sun has been changing so that the Sun's light is now movingtowards the rear of the spacecraft, and this orientation will continuethrough August and September. During this period, the spacecraft'sAttitude and Translation Control (ATC) performance will be the moststable, giving us the “cleanest” data of the entire mission. The pointingThe presentation included an overview of the program for the benefitof Tony Lavoie, followed by a status update on the spacecraft and datacollection. Following the presentations, Francis Everitt, GaylordGreen, and <strong>GP</strong>-B co-founder Bob Cannon took both of our MSFC<strong>Gravity</strong> <strong>Probe</strong> B — <strong>Post</strong> <strong>Flight</strong> Analysis • Final <strong>Report</strong> March 2007 507
visitors on a tour of the <strong>GP</strong>-B facilities, including our MissionOperations Center (MOC), the Anomaly Resolution Board Room(ARB), and the display of <strong>GP</strong>-B technology in the lobby of ourbuilding.15 JULY 2005—GRAVITY PROBE B MISSIONUPDATEMission Elapsed Time: 451 days (64 weeks/14.79 months)Science Data Collection: 322 days (46 weeks/10.56 months)Current Orbit #: 6,655 as of 4:30 PM PSTSpacecraft General Health: GoodRoll Rate: Normal at 0.7742 rpm (77.5 seconds per revolution)Dewar Temperature: 1.82 kelvin, holding steadyCommand & Data Handling (CDH): B-side (backup) computer incontrol, Multi-bit errors (MBE): 0, Single-bit errors (SBE): 8 (dailyaverage)As of Mission Day 451, the <strong>Gravity</strong> <strong>Probe</strong> B vehicle and payload are ingood health. All four gyros are digitally suspended in science mode.The spacecraft is flying drag-free around Gyro #1.The Poker Flats ground station in Alaska has been experiencinghardware problems, and for this reason, we have had to re-schedulesome of our data telemetry sessions at other NASA TDRSS groundstation facilities. We have recently run tests at the McMurdo station inAntarctica, and we successfully completed a data capture session fromMcMurdo this past Monday, 11 July 2005, after some last-minutescrambling to get the connection properly set up. We have also beenusing the Wallops ground station in Virginia.On Wednesday, 12 July 2005, we completed a paper simulation of thecalibration procedures we will be performing towards the very end ofthe mission, just before the helium runs out, to move our telescopefrom our guide star, IM Pegasi, to a nearby star and back to IM Pegasi.As reported last week, gyro #3 transitioned into analog backupsuspension mode during the first phase of a calibration test that beganon Thursday, 7 July 2005, that involves electrically “nudging” the gyrorotor to various pre-defined positions within its housing. We restoredgyro #3 to digital suspension last Thursday evening and continuedphase 2 of the test last Friday. We suspected that the root cause of thetransition to analog mode was likely due to a known “race” condition,which occurs when the gyro rotor reaches a low threshold, set by thehardware. For this reason, we suspected that gyro #3 would transitionto analog mode again during the second phase of the calibration test,and this was the case last Friday. We again returned gyro #3 to digitalsuspension and completed the test successfully.Yesterday, 13 July 2005, marks the one-year anniversary of our fullspeedgyro spin-up in space (gyro #4 was spun up to 105 Hz/6,300rpm). That was a very tense and exciting time in the MissionOperations Center (MOC) here at <strong>GP</strong>-B. Also yesterday, we usedultraviolet light to reduce the electrostatic charge on all four gyros.508 March 2007 Appendix C — Weekly Chronicle of the <strong>GP</strong>-B Mission
Very small amounts of charge build continually build up on the gyrorotors throughout the mission. When the charge build-up reaches asufficiently high level, we use ultraviolet light to reduce the charge. Welast performed this procedure on during the week of 15 April 2005.22 JULY 2005—GRAVITY PROBE B MISSIONUPDATEMission Elapsed Time: 458 days (65 weeks/15.02 months)Science Data Collection: 329 days (48 weeks/10.79 months)Current Orbit #: 6,757 as of 4:00 PM PSTSpacecraft General Health: GoodRoll Rate: Normal at 0.7742 rpm (77.5 seconds per revolution)Dewar Temperature: 1.82 kelvin, holding steadyCommand & Data Handling (CDH): B-side (backup) computer incontrol, Multi-bit errors (MBE): 0, Single-bit errors (SBE): 8 (dailyaverage)As of Mission Day 458, the <strong>Gravity</strong> <strong>Probe</strong> B vehicle and payload are ingood health. All four gyros are digitally suspended in science mode.The spacecraft is flying drag-free around Gyro #1.Preliminary calibration testing of gyros #1, #2, and #4, which does notplace torques (forces) on the gyros, continued this past week. Also, wecontinued calibration testing of gyro #3, which involved electrically“nudging” the gyro #3 rotor to various pre-defined positions within itshousing. During this test, gyro #3 transitioned into analog suspensionmode. However, anticipating this condition, we automatically resuspendedthe gyro rotor and increased the gyro bridge excitationvoltage during the calibration test. Based on the performance of gyro#3, we will now include the auto-suspension and increased excitationvoltages when running this test on the other three gyros.29 JULY 2005—GRAVITY PROBE B MISSIONUPDATEMission Elapsed Time: 465 days (66 weeks/15.29 months)Science Data Collection: 329 days (49 weeks/11.05 months)Current Orbit #: 6,860 as of 1:00 PM PSTSpacecraft General Health: GoodRoll Rate: Normal at 0.7742 rpm (77.5 seconds per revolution)Dewar Temperature: 1.82 kelvin, holding steadyCommand & Data Handling (CDH): B-side (backup) computer incontrol, Multi-bit errors (MBE): 2, Single-bit errors (SBE): 8 (dailyaverage)Preliminary calibration testing of gyros #2, #3, and #4 continued thisweek and will be completed by Monday. These calibrations do notimpact science data collection, but they do help us learn more aboutthe characteristics of these gyros. These tests included a modulation ofthe Gyroscope Suspension System (GSS) preloads at roll rate, aSQUID configuration test, and a SQUID off test.On Thursday, we performed the final heat pulse meter to determinethe amount of liquid helium remaining in the dewar. Preliminaryanalysis supports previous estimates for the helium lifetime. Finalresults of this test are pending analysis.5 AUGUST 2005—GRAVITY PROBE B MISSIONUPDATEOn Wednesday, 20 July 2005, Dr. Anne Kinney, Director of theUniverse Division in NASA's Science Mission Directorate, spent theday here at <strong>Stanford</strong>, meeting with various research teams andreviewing the status of <strong>GP</strong>-B and several other joint <strong>Stanford</strong>-NASAmissions/experiments that fall under her jurisdiction at NASAHeadquarters. This was Dr. Kinney’s first on-site visit to <strong>GP</strong>-B, so theday began with a brief tour of the <strong>GP</strong>-B facilities, followed by a seriesof briefings and discussions. At the end of the day, Dr. Kinney gave avery interesting lecture to a standing room only audience from the<strong>Stanford</strong> physics and aerospace community on the topic of “BluePlanets, Black Holes.”Mission Elapsed Time: 472 days (67 weeks/15.53 months)Science Data Collection: 343 days (50 weeks/11.28 months)Current Orbit #: 6,962 as of 1:00 PM PSTSpacecraft General Health: GoodRoll Rate: Normal at 0.7742 rpm (77.5 seconds per revolution)Dewar Temperature: 1.82 kelvin, holding steadyCommand & Data Handling (CDH): B-side (backup) computer incontrol, Multi-bit errors (MBE): 0, Single-bit errors (SBE): 8 (dailyaverage)With more than eleven months of science data captured, the mission isproceeding well. Over the past week, we completed preliminarycalibration tests and prepared for the final calibration phase in lateAugust. Preliminary calibration testing of gyros #2, #3, and #4included a modulation of the Gyroscope Suspension System (GSS)preloads at roll rate, a SQUID configuration test, and a SQUID off test.On July 28, we performed the final heat pulse meter test to determinethe amount of liquid helium remaining in the dewar. The resultssupport previous estimates for the helium lifetime. Based on this final<strong>Gravity</strong> <strong>Probe</strong> B — <strong>Post</strong> <strong>Flight</strong> Analysis • Final <strong>Report</strong> March 2007 509
test, we are planning on running final calibrations from August 15 toSeptember 1, 2005. If any time remains after that, further calibrationswill be performed at a different roll rate.12 AUGUST 2005—GRAVITY PROBE B MISSIONUPDATEMission Elapsed Time: 479 days (68 weeks/1.31 years)Science Data Collection: 350 days (51 weeks/11.51 months)Current Orbit #: 7,006 as of 1:00 PM PSTSpacecraft General Health: GoodRoll Rate: Normal at 0.7742 rpm (77.5 seconds per revolution)Dewar Temperature: 1.82 kelvin, holding steadyCommand & Data Handling (CDH): B-side (backup) computer incontrol, Multi-bit errors (MBE): 0, Single-bit errors (SBE): 7 (dailyaverage)With nearly a full year of science data captured, the mission isproceeding well. This past week, we made some routine adjustmentsduring our final week of nominal science data collection. Theseadjustments included updating the star tracker star magnitudes,running an SRE calibration (SQUID Readout Electronics), updatingthe control gyro z-bias, and power cycling the ECU (ElectronicsControl Unit).On Monday, August 15th, we will begin the final calibration phase ofthe mission. In this phase, we will be maneuvering the spacecraft tonearby stars and then back to the guide star to calibrate the GyroscopeSuspension System (GSS). This phase will last two weeks, endingaround August 29th. If any helium remains, further calibrations willbe performed at a different vehicle roll rate. Because of the nature ofthese calibrations, the science (data gathering) phase of the missionwill end as soon as we begin these calibrations. By that point, we willhave collected 352 days (or 11.5 months) of science data—a greatsuccess!Note: During this final calibration phase, our weekly updates will belimited to the Mission Director's Summary, as our communicationsand public affairs team members will be concentrating their efforts onour End-of-Mission activities and our final report to NASA.510 March 2007 Appendix C — Weekly Chronicle of the <strong>GP</strong>-B Mission
C.5 Instrument Calibration Phase: 8/19/05 – 9/30/0519 AUGUST 2005—GRAVITY PROBE B MISSIONUPDATEMission Elapsed Time: 486 days (69 weeks/ 16 months)IOC Phase: 129 days (4.2 months)Science Phase: 352 days (11.6 months)Final Calibration Phase: 5 daysCurrent Orbit #: 7,169 as of 1:00PM PSTSpacecraft General Health: GoodRoll Rate: Normal at 0.7742 rpm (77.5 seconds per revolution)Gyro Suspension System (GSS): Drag-free off during calibrationphaseDewar Temperature: 1.82 kelvin, holding steadyGlobal Positioning System (<strong>GP</strong>S) lock: Greater than 98.0%Attitude & Translation Control (ATC): X-axis attitude error: 166.9marcs rmsY-axis error: 254.5 marcs rmsCommand & Data Handling (CDH): B-side (backup) computer incontrolMulti-bit errors (MBE): 1 (in GSS#1 Computer on 8/17/05)Single-bit errors (SBE): 10 (daily avg.)As of Mission Day 486, the <strong>Gravity</strong> <strong>Probe</strong> B vehicle and payload arein good health and all subsystems are performing nominally.The final calibration phase officially began at 6:26am (PST) onMonday when the drag-free gyro (Gyro #1) was transitioned to “dragfreeoff.” After setting the gyro preloads to the IOC levels of 10V(Initialization & Orbit Checkout Phase), we maneuvered the spacevehicle to point at HD216235, a star one degree away from the guidestar. On Tuesday, we returned to the guide star and resumed drag-freeoperation. On Wednesday and Friday, we are repeating thesemaneuvers to the neighboring star (HD216235). The aim of thesecalibrations is to place tight constraints on potential systematic errors.The calibrations are scheduled to be completed by 31 August. Withany remaining helium, further calibrations will be performed at adifferent spacecraft roll rate.DR. NANCY ROMAN VISITS <strong>GP</strong>-BTwo notable events related to <strong>GP</strong>-B occurred this past week. First, thispast Tuesday and Wednesday, we were honored with a visit from Dr.Nancy Roman, one of the nation's leading scientists in the spaceprogram.Roman received her Ph.D. in astronomy from the University ofChicago in 1949. She began her career doing astronomy research instellar distances and motions at the University of Chicago's YerkesObservatory and also teaching graduate courses there. In 1959, Romanjoined NASA, and from 1960-1979, she served as Chief of theAstronomy and Relativity Programs in the NASA Office of SpaceScience. In her position at NASA, Roman was very influential increating astronomical research satellites such as the CosmicBackground Explorer (COBE) and the Hubble Space Telescope (HST).On Monday, 15 August 2005, the <strong>Gravity</strong> <strong>Probe</strong> B mission concludedthe science phase of the mission and transitioned to the finalcalibration phase of the mission. In total, the mission collected sciencedata for 352 days (11.6 months) during its 7,000+ orbits around theEarth with an extremely high data capture rate for that time (99.0%).She also oversaw the development of a number of ground and spaceresearch programs, including <strong>Gravity</strong> <strong>Probe</strong> B. In fact, Roman helpedorganize a NASA-sponsored two-day seminar, held at <strong>Stanford</strong> in July1961, in which over 30 distinguished physicists, engineers, andaerospace experts from all over the U.S. gathered to discuss thepossibilities of testing Einstein's theories of relativity in space. Some ofthe ideas discussed at that seminar—most notably the concept of adrag-free satellite—are currently being used in the <strong>GP</strong>-B mission.After retiring from NASA in 1979, Dr. Roman continued working as a<strong>Gravity</strong> <strong>Probe</strong> B — <strong>Post</strong> <strong>Flight</strong> Analysis • Final <strong>Report</strong> March 2007 511
contractor at the Goddard Space <strong>Flight</strong> Center. Throughout hercareer, Dr. Roman has been a spokesperson and advocate of women inthe sciences.This past week was Dr. Roman's first trip to <strong>Stanford</strong> since 1979, butshe has been following the progress of <strong>Gravity</strong> <strong>Probe</strong> B through ourweekly updates. During her visit, she sat in on several mission statusbriefings, she met with scientists and engineers on the <strong>GP</strong>-B team, sheattended a student presentation session and had lunch with thestudents and staff, and she toured the <strong>GP</strong>-B development labs andMission Operations Center. We've included some photos from Dr.Roman's <strong>GP</strong>-B visit, plus a black and white NASA photo taken early inher career, in this week's highlights on our Web site. You can readmore about Dr. Nancy Roman athttp://solarsystem.nasa.gov/people/profile.cfm?Code=RomanN.REX GEVEDEN APPOINTED ASSOCIATE NASAADMINISTRATORAlso in the news this past week, NASA Administrator Michael Griffinnamed Rex Geveden as the agency's associate administrator. In thiscapacity, Geveden has oversight for all the agency's technical missions'areas and field center operations. He will be responsible forprogrammatic integration between NASA's mission directorates andfield centers. In November 2004, Geveden moved from NASA'sMarshall Space <strong>Flight</strong> Center (MSFC) in Huntsville, AL to NASAHeadquarters in Washington DC to become NASA Chief Engineer.He has been serving as acting associate administrator since June 2005.26 AUGUST 2005—GRAVITY PROBE B MISSIONUPDATEMission Elapsed Time: 493 days (70 weeks/ 16.2 months)—IOC Phase: 129 days (4.2 months)—Science Phase: 352 days (11.6 months)—Final Calibration Phase: 12 daysCurrent Orbit #: 7,272 as of 1:00PM PSTSpacecraft General Health: GoodRoll Rate: Normal at 0.7742 rpm (77.5 seconds per revolution)Gyro Suspension System (GSS): Drag-free off during calibrationphaseDewar Temperature: 1.82 kelvin, holding steadyGlobal Positioning System (<strong>GP</strong>S) lock: Greater than 98.0%Attitude & Translation Control (ATC): X-axis attitude error: 127.7marcs rmsY-axis error: 181.5 marcs rmsCommand & Data Handling (CDH): B-side (backup) computer incontrolMulti-bit errors (MBE): 1 (in GSS#2 computer on 8/26)Single-bit errors (SBE): 10 (daily avg.)Gyro #1 Drag-free Status: Backup Drag-free mode (OFF duringcalibration maneuvers)As of Mission Day 493, the <strong>Gravity</strong> <strong>Probe</strong> B vehicle and payload are ingood health and all subsystems are performing nominally.The <strong>Gravity</strong> <strong>Probe</strong> B mission has continued with the final calibrationphase this week, which it began ten days ago. Last Friday, the spacevehicle was pointed toward HD216635 (the one-degree star) for thethird time in five days and then returned to IM Pegasi for theweekend. On Monday, we maneuvered the space vehicle towards ZetaPegasi (aka Homam or HD 214923/ HR 8634), which is our sevendegreestar.On Wednesday, the space vehicle was returned to the guide star (IMPeg) after spending ~30 hours on Zeta Pegasi. Later this week, we willperform DC mis-centering on Gyros #1, #2 and #4, and GSS torquecalibrations on Gyros #1 and #4 with five hours of nominal sciencebetween the two tests. Three additional visits to the one-degree starhave been added to the schedule starting August 26.The calibrations are scheduled to be complete by next Wednesday(August 31). The projected helium depletion date remains Friday,September 2. With any remaining helium, further calibrations will beperformed at a different spacecraft roll rate (0.5 rpm).POINTING AT A LUCKY STARPrior to moving to NASA Headquarters, Geveden held variousleadership positions at MSFC. He served as deputy director of theMarshall Center from July 2003-November 2004. Prior to that, he wasdeputy director of the MSFC Science Directorate, leading research anddevelopment projects in space science, materials science,biotechnology, earth science and space optics. Geveden was projectmanager for several successful efforts, including the Optical TransientDetector and Lightning Imaging Sensor satellites, which produceddata for the world's first global map of lightning.However, we here at <strong>GP</strong>-B have a special connection with RexGeveden. From 1995-2003, Geveden was the NASA MSFC ProgramManager overseeing <strong>GP</strong>-B’s final development and testing, andreadying the spacecraft for launch. Geveden has long been a staunchsupporter of <strong>GP</strong>-B, and we wish him every success in his new positionat NASA. You can read the NASA press release announcing Geveden’sappointment last week at:http://www.nasa.gov/home/hqnews/2005/aug/HQ_05227_geveden.htmlAs noted in the Mission Director's summary above, we are now in thefinal days of our instrument calibration testing. Last week, we slewedthe on-board telescope (and the spacecraft) away from the guide star,IM Pegasi, to point at a neighboring star about one degree away. The512 March 2007 Appendix C — Weekly Chronicle of the <strong>GP</strong>-B Mission
neighbor star we chose has no proper name, only catalog numberssuch as HD 216635, and with an average V magnitude of 6.61 it issomewhat fainter than IM Pegasi (V magnitude 5.89). We kept thetelescope pointed at HD 216635 for about half an hour and thenslewed the telescope back to IM Pegasi. Over the course of last week,we repeated this procedure a total of five times. Then, this pastMonday, 22 August 2005, we slewed the telescope and spacecraft tothe star named Homam (aka Zeta Pegasi or HD 214923), which isabout seven degrees away from IM Pegasi and considerably brighter(average V magnitude 3.40). This time, we kept the telescope andspacecraft pointed at Homam for about 30 hours before returning toIM Pegasi.Ostriches” and Na’ir Sa’d al Bahaim, “The Bright Fortunate One of theTwo Beasts” were also in use among the Arabs. The Chinese, for someunknown reason, connected the star with thunder.Zeta Pegasi is computed to be about 210 light years away, with anactual luminosity about 145 times brighter than our Sun. On our Website this week, we have posted photos of HD 216635, IM Pegasi, andZeta Pegasi, along with sky charts produced by the Voyager III SkySimulator from Carina Software (http://www.carinasoft.com) thatshows the locations of these stars. The star photos, as well as much ofthe information about these stars came from the various Web pages ofthe Centre de Donnees astronomiques de Starsbourg—CDS(http://cdsweb.u-strasbg.fr/), including the Simbad astronomicaldatabase (http://simbad.u-strasbg.fr/sim-fid.pll) and the Aladininteractive sky atlas (http://aladin.u-strasbg.fr/aladin.gml).2 SEPTEMBER 2005—GRAVITY PROBE B MISSIONUPDATEThe reason we are performing these slewing tests is to measure andcalibrate the amount of torque (force) placed on the sciencegyroscopes by intentionally mis-aligning the telescope axis from thegyroscope spin axes by relatively large factors of first one, and thenseven degrees. At the beginning of the science phase of the mission, wealigned both the telescope and the spin axes of all four gyroscope withthe guide star, IM Pegasi to an accuracy level of a few arcseconds.During the science phase of the mission, we kept the telescope alignedwith the guide star to within 100-150 milliarcseconds. (an arcsecond is1/3600th of a degree, and a milliarcsecond is 1/1000th of anarcsecond). By design, the spin axes of the gyroscopes are aligned withthe axis of the telescope, which is also the roll axis of the spacecraft,and as long as these alignments are maintained, the non-relativistictorques on the gyros average out. However, during these finalcalibrations, we intentionally break these alignments, forcing thetelescope first one degree and then seven degrees away from the gyrospin axis alignments, and we can then determine the extent to whichthese misalignments place torques on the gyro spin axes. Clearly, giventhe nature of these final calibration tests, they could not be performedwhile we were still collecting science data, which is why they were leftto be performed at the very end of the experiment.Mission Elapsed Time: 500 days (71 weeks/ 16.4 months)—IOC Phase: 129 days (4.2 months)—Science Phase: 352 days (11.6 months)—Final Calibration Phase: 19 daysCurrent Orbit #: 7,376 as of 1:30PM PSTSpacecraft General Health: GoodRoll Rate: Normal at 0.7742 rpm (77.5 seconds per revolution)Gyro Suspension System (GSS): All 4 gyros digitally suspendedDewar Temperature: 1.82 kelvin, holding steadyGlobal Positioning System (<strong>GP</strong>S) lock: Greater than 98.5%Attitude & Translation Control (ATC): X-axis attitude error: 140.0marcs rmsY-axis error: 186.4 marcs rmsCommand & Data Handling (CDH): B-side (backup) computer incontrolMulti-bit errors (MBE): 0Single-bit errors (SBE): 8 (daily avg.)Gyro #1 Drag-free Status: Backup Drag-free mode (OFF during somecalibration maneuvers)On Mission Day 500, the <strong>Gravity</strong> <strong>Probe</strong> B vehicle and payload are ingood health and all subsystems are performing nominally.As of today, there is still an ever-thinning film of superfluid helium inthe dewar, and thus calibration tests, which began 19 days ago,continued throughout this past week. Over the course of last weekendand early this week, we thrice slewed the telescope (and spacecraft) to“visit” the star HD 216635, which is about one degree northwest of IMPegasi, and then back to IM Pegsi.The star, Homam or Zeta Pegasi, was not one of our initial candidatesto be used in the final calibrations, but it was selected by our telescopeteam because it emits light in the blue range of the spectrum, whereasIM Pegasi emits light in the red range of the spectrum. Homam is alsomuch brighter than IM Pegasi, as noted above, and thus this latestcalibration test was not only useful for examining torques on thegyros, but also for evaluating the telescope performance on a brighterstar with a different color of light.Burnham’s Celestial Handbook (a three-volume compendium ofastronomical information), gives the following information about thename Homam, by which Zeta Pegasi is also known:Homam, probably comes from the Arabic phrase Sa’d al Humam, the“Lucky Star of the Hero,” though Thomas Hyde derived it from AlHammam, which seems to mean “The Whispering One.” According toR. H. Allen, the names Sa’d al Na’amah, “The Lucky Star of the<strong>Gravity</strong> <strong>Probe</strong> B — <strong>Post</strong> <strong>Flight</strong> Analysis • Final <strong>Report</strong> March 2007 513
On Wednesday, we visited the star HR Pegasi (HD 216672), which isabout 0.4 degrees west of IM Pegsi. We had previously visited this starduring the Initialization and Orbit Checkout (IOC) phase of themission in June 2004, as a test to confirm that the star we were using asthe guide star was, in fact, IM Pegasi. (You can read about ourprevious visit to HR Pegasi in our 11 June 2004 update.Thus far during these final calibration tests, our visits to HD 216635and to Zeta Pegasi were predominately in a north-south plane, relativeto IM Pegasi. Our visit to HR Pegasi this past Wednesday was our firstcalibration test with a star located in the east-west plane, with respectto IM Pegasi. Continuing this line of exploration, yesterday and todaywe completed several visits to locations less than one degree west, andless than one degree east of IM Pegasi. No stars visible to the on-boardtelescope exist in these recently visited locations, so we used data fromour star trackers and our standard navigational gyroscopes, which areaccurate to within 20 arcseconds, to determine the positions of these“virtual stars.” Since the purpose of these calibrations is to evaluate theeffects of telescope mis-alignments on the science gyros, greaterpointing accuracy is not required for these excursions.We have postponed our previous plans to slow down the spacecraft'sroll rate until after the helium in the dewar is fully depleted. Over thisweekend, we will continue making calibration tests similar to those wehave been performing, and if the helium lasts into next week, we willperform other types of calibration tests. Once the helium is depleted,the <strong>GP</strong>-B flight mission will officially end.Tony Lyons, NASA's program manager for <strong>GP</strong>-B from Marshall Space<strong>Flight</strong> Center in Huntsville, AL, has been here at <strong>Stanford</strong> all week,participating with our team in these final days of the mission.<strong>GP</strong>-B MISSION NEWS—THE FINAL DAYSThis past week marks a major transition point in the <strong>GP</strong>-B program.Exactly 16.4 months after a picture-perfect launch on 20 April 2004,we have come to the end of the <strong>GP</strong>-B flight mission. Literally any daynow, the supply of superfluid helium—the coolant that hasmaintained the cryogenic temperatures necessary for our SQUID gyroreadouts to function—will be exhausted.Right now, there is an ever-thinning layer of superfluid liquid heliumlining the dewar, and there will come a point where the last of thisliquid helium has “sweated” out through the porous plug, leaving onlyhelium gas inside the dewar. (See our Mission News story of 29 July2005 for a description of the porous plughttp://einstein.stanford.edu/highlights/hlindex.html.) As this finalhelium gas begins to pas through the porous plug, the pressure in thedewar will begin to drop, causing the temperature in the <strong>Probe</strong> to rise.We don't know whether this transition will happen gradually orsuddenly (as was the case with NASA's COBE spacecraft), but we willknow that we have reached this point when our telemetry data shows arise in the temperature sensors on the bracket that houses the SQUIDgyro readout controllers and the temperature sensors on the telescopedetector packages. When the temperature in the <strong>Probe</strong> reaches about 7kelvin, we will begin to lose superconductivity in the niobium gyrorotor coatings, and the SQUID gyro readouts will gradually cease todetect the London moments in the gyros. At this point, it be no longerbe possible to determine the spin axis orientation of the sciencegyroscopes, although the Gyro Suspension Systems (GSS) willcontinue to indicate the position of each gyro rotor within its housingto great precision. Also, with no helium propellant left, the spacecraftwill no longer be able to maintain a drag-free orbit.The 650 gallons of helium that filled the dewar at launch has lastedexactly the length of time planned. We collected 50 weeks of sciencedata-just two weeks short of the year's worth of data we had hoped tocollect. Furthermore, we lost less than 1% of the data collected totelemetry and/or spacecraft hardware problems. We have nowcompleted all of the vital planned calibration tests that needed to bedone with the gyro readouts still functioning, and we are using thesefinal days of helium to perform additional tests that will be valuable tothe data analysis now in process. In short, <strong>GP</strong>-B has been a remarkablysuccessful mission.There is an air of triumph here at <strong>Stanford</strong>, but there is also a note ofsadness. Having become a very tight-knit team, we are saddened thattoday is the last day of work on <strong>GP</strong>-B for a number of our colleagues,especially those from Lockheed Martin Corporation. Thus, thisafternoon, we all gathered in the conference room where we've beenholding daily status meetings since before launch, and we spent a fewminutes raising toasts to our successful mission and to the futureendeavors of our colleagues who will be moving on to new jobs nextweek.Regarding the <strong>GP</strong>-B spacecraft, the experiment, and the remainingmembers of the team, following is a brief overview of what's in store.Next Tuesday, when we return from the Labor Day holiday, <strong>GP</strong>-B willbe a much quieter place. Our science team is already well into the long,painstaking process of analyzing the data. A small spacecraft514 March 2007 Appendix C — Weekly Chronicle of the <strong>GP</strong>-B Mission
operations crew, including several <strong>GP</strong>-B graduate students who arebeing cross-trained for these duties, will continue to monitor thespacecraft's system status, send commands to it when necessary, andregularly, though much less frequently, download various types of datavia NASA telemetry satellites and ground stations.We will use magnetic torquers—long electromagnets mounted on thespacecraft frame—to slow down the spacecraft's roll rate from 0.7742rpm to 0.5 rpm or less and to control the spacecraft's orientation inorbit. For about two weeks, we will perform a number of tests onvarious electronic systems in the spacecraft. For example, we want tocompare various performance characteristics of the GSS system after ithas “warmed up” to its performance in a cryogenic superconductivestate. Finally, in about a month, we will spin down all four sciencegyros to speeds slow enough that they will not be in danger ofshattering, should they lose suspension and touch their housing walls.At this point, the spacecraft could be used by other scientists to makevarious non-relativitistic measurements. For example, it could be usedfor experiments in geodesy (measuring the shape of Earth'sgravitational field) and aeronomy (measuring atmospheric density).We are in the process of exploring the interest in further use of the<strong>GP</strong>-B spacecraft for such experiments with a number of scientists.One last note: All of us on the <strong>GP</strong>-B team are deeply saddened by thehorrific disaster and unfathomable human tragedy that has beenunfolding in Gulf Coast this past week. Our hearts and prayers go outto the countless victims.9 SEPTEMBER 2005—GRAVITY PROBE B MISSIONUPDATEMission Elapsed Time: 507 days (72 weeks/ 16.6 months)—IOC Phase: 129 days (4.2 months)—Science Phase: 352 days (11.6 months)—Final Calibration Phase: 26 daysCurrent Orbit #: 7,482 as of 4:30PM PSTSpacecraft General Health: GoodRoll Rate: Normal at 0.7742 rpm (77.5 seconds per revolution)Gyro Suspension System (GSS): All 4 gyros digitally suspendedDewar Temperature: 1.82 kelvin, holding steadyGlobal Positioning System (<strong>GP</strong>S) lock: Greater than 96.5%Attitude & Translation Control (ATC): X-axis attitude error: 149.7marcs rmsY-axis error: 179.9 marcs rmsCommand & Data Handling (CDH): B-side (backup) computer incontrolMulti-bit errors (MBE): 0Single-bit errors (SBE): 8 (daily avg.)Gyro #1 Drag-free Status: Backup Drag-free mode (OFF during somecalibration maneuvers)On Mission Day 507, the <strong>Gravity</strong> <strong>Probe</strong> B vehicle and payload are ingood health and all subsystems are performing nominally.The helium in the dewar has lasted throughout this past week, andthus we have continued with the calibration tests that we began overthree weeks ago. These tests involve slewing the telescope (andspacecraft) to “visit” stars (both real and virtual) in the neighborhoodaround the guide star, IM Pegasi. In each case, we visit a neighboringlocation for a period of time and then lock back onto IM Pegasi forseveral hours. The purpose of these tests is to calibrate, in detail, thetorques imparted onto the science gyroscopes by purposely misaligningthe telescope (and spacecraft roll axis) from the direction ofthe gyro spin axes.Last weekend, we visited a “virtual star” (location where no starsvisible to the telescope exist) located 0.1 degree in the direction ofneighboring star HD 216635, northwest of IM Pegasi. We remained atthis location for 24 hours and then returned to IM Pegasi for 16 hours.We then repeated this procedure, visiting a location 0.1 degrees in theopposite direction. Then, this past Tuesday we visited a virtual starlocation halfway to the Star HR Pegasi (HD 216672), which is locatedto the west of IM Pegasi. After dwelling in that location for 24 hours,we again returned to IM Pegasi. And, on Thursday, we visited a virtuallocation 0.3 degrees towards HD 216635, remained there for 24 hoursand then returned to IM Pegasi.<strong>Gravity</strong> <strong>Probe</strong> B — <strong>Post</strong> <strong>Flight</strong> Analysis • Final <strong>Report</strong> March 2007 515
Gyro Suspension System (GSS): All 4 gyros digitally suspendedDewar Temperature: Not AvailableGlobal Positioning System (<strong>GP</strong>S) lock: Greater than 99.8%Attitude & Translation Control (ATC): 137.8 marcs rms (as of 9/15)Y-axis error: 176.4 marcs rms (as of 9/15)Command & Data Handling (CDH): B-side (backup) computer incontrolMulti-bit errors (MBE): 0Single-bit errors (SBE): Not AvailableGyro #1 Drag-free Status: Backup Drag-free mode (OFF during somecalibration maneuvers)As of Mission Day 514, the <strong>Gravity</strong> <strong>Probe</strong> B vehicle and payload are ingood health, with all subsystems performing nominally. We still havehelium remaining in the dewar, and the spacecraft is currently flyingdrag-free around Gyro #1.This coming weekend, if we still have helium remaining, we will visitsimilar virtual star locations, or possibly real stars, within a 4-degreeradius of IM Pegasi, each time visiting a neighboring location forseveral hours and then returning to IM Pegasi. And, as long as there isstill helium, we will continue similar tests into next week…andbeyond.<strong>GP</strong>-B MISSION NEWS—THE HELIUM JUST KEEPS ONFLOWING…Like Energizer Bunny® that “keeps on going,” the helium in the <strong>GP</strong>-Bdewar just keeps on flowing. Our dewar specialists assure us that weare, indeed, well into the final days—or possibly hours—of helium.But when will the helium actually run out? That's anybody's guess (wehave a pool going amongst the remaining team members here at<strong>Stanford</strong>).Estimating the amount of liquid helium remaining in a 650 gallonThermos bottle, orbiting 400 miles above the Earth, requires complexcalculations, and there are many variables at play. Also, there is aconsiderable margin of error in these calculations. Our <strong>GP</strong>-B dewarspecialists, who modeled the dewar's life cycle and have been trackingits performance, have purposely remained conservative in theirlongevity estimates of the helium, so as to ensure that there would beenough helium to perform the most important calibration tests.Following the initial tests, we have been working our way through aprioritized list of further tests that will be beneficial in analyzing thescience data. As long as the helium continues to flow, we will continueworking our way through this list. The consensus here is that thehelium will very likely run out by the beginning of next week. But, if itlasts longer, we will simply continue performing these tests.The helium in the dewar has now surpassed its estimated lifetime bymore than two weeks. We have thus continued working our waythrough a prioritized list of calibration tests. Most of these tests haveinvolved slewing the telescope (and spacecraft) to “visit” stars (bothreal and virtual) in the neighborhood around the guide star, IM Pegasi.In each case, we visit a neighboring location for a period of time andthen lock back onto IM Pegasi for a number of hours. The purpose ofthese excursions to neighboring stars is to precisely calibrate thetorques imparted onto the science gyroscopes by purposelymisaligning the telescope axis (and spacecraft roll axis) by varyingamounts from the direction of the gyros' spin axes.Last Friday, we visited a virtual star (place where no stars visible to thetelescope exist) located 0.1 degrees west of our guide star, IM Pegasi, inthe direction of neighboring star HR Pegasi. We remained fixed onthat virtual star location for 48 hours and then returned to IM Pegasi,where we remained for 24 hours.While locked onto IM Pegasi, we switched drag-free control from gyro#1 to gyro #3 in order to perform some calibration tests on gyro #1.During this calibration test, the pressure in the dewar dropped, andthe spacecraft experienced thruster instability in the z-axis direction(along the spacecraft/telescope roll axis). This behavior was similar toinstabilities that we had previously seen in June 2004, during theInitialization and Orbit Checkout (IOC) phase of the mission. Theroot cause is under investigation, but there is some speculation thatthis may be the result of a micrometeorite striking the spacecraft. Torectify this situation, we switched the operating mode of our microthrusters to “open loop”—that is, turning off the thruster pressuresensors and relying instead on pre-defined thruster calibration curvesto control thruster flow. We will leave the micro thrusters in open loopmode until the helium is depleted.When the helium actually does run out, we will post a notice on ourWeb site and send out a message to the subscribers of our <strong>GP</strong>-BUpdate email list. NASA will also issue a news release, and we will thenpost the content of that release on our Web site and send it to ouremail subscribers. Stay tuned….16 SEPTEMBER 2005—GRAVITY PROBE B MISSIONUPDATEMission Elapsed Time: 514 days (73 weeks/ 16.85 months)—IOC Phase: 129 days (4.2 months)—Science Phase: 352 days (11.6 months)—Final Calibration Phase: 33 daysCurrent Orbit #: 7,586 as of 5:30PM PSTSpacecraft General Health: GoodRoll Rate: Normal at 0.4898 rpm (2.04 minutes per revolution)516 March 2007 Appendix C — Weekly Chronicle of the <strong>GP</strong>-B Mission
Alpha Pegasi, Zeta Pegasi, HR Pegasi, IM Pegasi, and HD 216635—allthe stars in the neighborhood of IM Pegasi that we have visitedrecently.Last Tuesday, 13 September, we visited the very bright (magnitude2.45) neighboring star Alpha Pegasi (also known as Markab or HD218045), located about 3.25 degrees south of IM Pegasi. We remainedlocked on Alpha Pegasi for 12 hours. Upon returning to returning toIM Pegasi. We switched drag-free control back to gyro #1.Then, last Wednesday, we sent commands to the spacecraft todecrease its roll rate from 0.7742 rpm (77.5 seconds per revolution) to0.4898 rpm (122.5 seconds per revolution). This resulted in someinterference with a SQUID calibration signal, and the frequency of thecalibration signal was subsequently changed, eliminating this issue.The spacecraft has since been performing nominally at the slower rollrate.Finally, today, we initiated procedures to de-fluxing the SQUIDS—that is, removing electromagnetic flux from the SQUIDs by heatingthem up a few kelvins, and then allowing them to cool back down totheir normal cryogenic operating temperature of 1.8 kelvin. Assumingthat we still have helium remaining this weekend and next week, thisprocess is a prelude to performing several gyro housing explorationtests, followed by a switch from backup to primary drag-free mode.<strong>GP</strong>-B MISSION NEWS—RUNNING ON EMPTY, AND VISITINGTHE BRIGHTEST STAR IN THE CONSTELLATION PEGASUSIf you drive a car, you have likely experienced—at least once—thesituation where the needle on your car's gas gage moves into the redzone, and the light comes on indicating that the gas tank is nearlyempty. But, unless you've been in this situation a few times with anyparticular car, you don't know for sure how much farther you candrive before the engine finally sputters and stops running. This isessentially the situation with our <strong>GP</strong>-B spacecraft right now. We knowthat we're in the “red zone” with our helium very nearly depleted, buthow many more orbits will actually be sustained is basically anyone'sguess.And so, continuing our prioritized calibration tests, last week wevisited the star Alpha Pegasi (aka Markab/HD 218045/ HR 8781),located about 3.25 degrees southward of IM Pegasi. Alpha Pegasi isone of the defining stars in the constellation Pegasus, the flying horse.It is approximately 110 light years away, and its luminosity is about 95times greater than our Sun. In fact, the designation of “Alpha” Pegasimeans that it is the brightest star in the constellation Pegasus. A set ofcomposite photos from the Palomar Observatory Sky Surveys (POSSIand POSSII) accompanying this week's Mission News story on ourWeb site clearly show the comparative luminosity or brightness ofAt this time of year in North America, the constellation Pegasus isclearly visible above the Eastern horizon during the evening hours, asshown in the sky charts accompanying this week's Mission News onour <strong>GP</strong>-B Web site.As we noted last week, as long as we still have helium in the dewar, wewill continue working our way through our prioritized list ofcalibration tests. When the helium actually does run out, we will post anotice on our Web site and send out a message to the subscribers ofour <strong>GP</strong>-B Update email list. NASA will also issue a news release, andwe will then post the content of that release on our Web site and sendit to our email subscribers.23 SEPTEMBER 2005—GRAVITY PROBE B MISSIONUPDATEMission Elapsed Time: 521 days (74 weeks/ 17.08 months)—IOC Phase: 129 days (4.2 months)—Science Phase: 352 days (11.6 months)—Final Calibration Phase: 40 daysCurrent Orbit #: 7,688 as of 4:00PM PSTSpacecraft General Health: GoodRoll Rate: Normal at 0.4898 rpm (2.04 minutes per revolution)Gyro Suspension System (GSS): All 4 gyros digitally suspendedDewar Temperature: Not AvailableGlobal Positioning System (<strong>GP</strong>S) lock: Greater than 99.4%Attitude & Translation Control (ATC): 128.0 marcsY-axis error: 170.8 marcsCommand & Data Handling (CDH): B-side (backup) computer incontrolMulti-bit errors (MBE): 1 (in GSS#3 computer on 9/23)Single-bit errors (SBE): 7 (daily average)Telescope Readout (TRE): NominalGyro #1 Drag-free Status: Backup Drag-free mode (OFF during somecalibration maneuvers)On Mission Day 521, the <strong>Gravity</strong> <strong>Probe</strong> B vehicle and payload remainin good health, with all subsystems performing nominally. We stillhave some helium in the dewar, and the spacecraft is flying drag-freearound Gyro #1.<strong>Gravity</strong> <strong>Probe</strong> B — <strong>Post</strong> <strong>Flight</strong> Analysis • Final <strong>Report</strong> March 2007 517
The helium in the dewar has now surpassed its estimated lifetime bymore than three weeks, and thus, our dewar team has been analyzingthe calculations and underlying assumptions on which their heliumlifetime predictions were originally made. (See the Mission News storybelow for more information about this.)Meanwhile, we have continued working our way through ourprioritized list of calibration tests. Last weekend, we completed theprocess of de-fluxing the SQUIDS—that is, removing electromagneticflux from the SQUIDs by heating them up a few kelvins, and thenallowing them to cool back down to their normal cryogenic operatingtemperature of 1.8 kelvin.On Monday, we attempted to switch from backup to primary dragfreeoperation on gyro #1. For various reasons, including a misconfigurationof the ATC system prior to the mode switch, the attemptfailed, and we reverted to backup drag-free mode on gyro #1.On Tuesday, we visited a virtual star 0.1 degrees east of IM Pegasi, inthe opposite direction from HR Pegasi. We remained locked in theposition for 48 hours, while the telescope team performed some darkcurrent calibration tests, and then we returned and re-locked thetelescope onto IM Pegasi on Thursday. We then attempted again toswitch from backup to primary drag-free mode on gyro #1, and againthe attempt failed. We are currently investigating the possible causesof this failure, and we plan to try this switch again nextweek...assuming that we still have helium in the dewar.<strong>GP</strong>-B MISSION NEWS—REVISING THE HELIUM LIFETIMEPREDICTIONSOur dewar team made its initial helium lifetime predictions by makingcalculations based on the results of several heat pulse meter tests thatwere performed at various points throughout the mission and someassumptions derived from the scientific literature and experience ofother spacecraft that used a helium-based cryogenic system.and the helium gas inside the dewar are in a state of thermalequilibrium. That is, they are both are maintaining the sametemperature due to close thermal contact between the liquid and gas.An alternative assumption is that there is poor thermal contactbetween the helium liquid and gas in the dewar, due to the low thermalconductivity of the vapor. If this is the case, the temperatures of theliquid and gas are not necessarily in equilibrium over the time scale ofthe measurement. That is, over short time scales, a temperatureincrease in the liquid helium does not necessarily result in acorresponding temperature increase in the helium vapor bubble.(Equilibration does ultimately occur, but over a longer time scale.)Taken to their extremes, these two assumptions result in two limitingcases for the helium depletion:1) Strong thermal contact between the two helium phases (the thinlayer of liquid helium coating the dewar wall and the bubble of heliumvapor in the center of the dewar are in thermal equilibrium over theshort time frame of the measurement—the initial assumption)2) Weak thermal contact between the two helium phases (a change intemperature in the liquid phase has little effect on the temperature ofthe gas bubble over the time scale of the measurement; rather, it takesmany hours for the helium vapor bubble to reach equilibrium with theliquid helium).The dewar team's initial predictions for the helium longevity werebased on the first assumption, which yielded the 5 September heliumdepletion date. However, if the second assumption is used, thelongevity of the helium increases by 5-6 weeks. In other words, theupper bound on the helium longevity, based on the secondassumption, places the helium depletion date around mid October. Itis most likely that the actual conditions inside the dewar liesomewhere between these two bounding assumptions. And, judgingfrom the dewar's performance thus far, it appears that the thermalcontact between the helium phases is weaker than was originallyassumed.As we have noted these past few weeks, as long as we still have heliumin the dewar, we will continue working our way through ourprioritized list of calibration tests. When the helium actually does runout, we will post a notice on our Web site and send out a message tothe subscribers of our <strong>GP</strong>-B Update email list. NASA will also issue anews release, and we will then post the content of that release on ourWeb site and send it to our email subscribers.30 SEPTEMBER 2005—GRAVITY PROBE B MISSIONUPDATEThe dewar team's initial calculations suggested that the helium in thedewar should have been depleted sometime around Labor Day (5September 2005). Because the helium has now lasted three weekslonger than the initial predictions, the dewar team has been reexaminingtheir calculations and the underlying assumptions used tomake them. The team has checked and re-checked their calculations,and it appears that no errors were made. This has led them to reevaluatethe assumptions underlying these calculations.Inside the dewar, there is some amount of superfluid liquid heliumand some amount of helium vapor (gas). The initial longevitycalculations were based on the assumption, as suggested by theliterature and performance of other spacecraft, that the helium liquidMission Elapsed Time: 528 days (75 weeks/ 17.3 months)—IOC Phase: 129 days (4.2 months)—Science Phase: 352 days (11.6 months)—Final Calibration Phase: 43 days (1.3 months)—Science II Phase: 4 daysCurrent Orbit #: 7,792 as of 4:00PM PSTSpacecraft General Health: GoodRoll Rate: Normal at 0.4898 rpm (2.04 minutes per revolution)Gyro Suspension System (GSS): All 4 gyros digitally suspendedDewar Temperature: 5.632 kelvin and risingGlobal Positioning System (<strong>GP</strong>S) lock: Greater than 95.0%Attitude & Translation Control (ATC): N/AY-axis error: N/ACommand & Data Handling (CDH): B-side (backup) computer incontrolMulti-bit errors (MBE): 0Single-bit errors (SBE): 7 (daily average)Gyro #1 Drag-free Status: OFF518 March 2007 Appendix C — Weekly Chronicle of the <strong>GP</strong>-B Mission
On Mission Day 528, the <strong>Gravity</strong> <strong>Probe</strong> B vehicle and payload are ingood health, with all subsystems performing nominally. The dewar isnow depleted of liquid helium, and this has affected varioussubsystems, as summarized below. Drag-free mode has been turnedoff.week's Mission News section when a colleague stopped by and said, “Itappears that we've run out of helium.” Suddenly, my dilemma of whatto write about this week was a non-issue.Yesterday at 1:55 pm Pacific Daylight Time, the last of the liquidhelium in our dewar transitioned to the gas phase, and the scienceinstrument began to warm. The team correctly assessed the status ofthe dewar, based on a set of pre-approved indicators, and they beganrunning our planned Helium Depletion Procedure.As of 9:30 am PDT this morning, the temperature in the dewar hadrisen from 1.8 to 5.6 kelvin, and it is slowly continuing to rise.Likewise, the temperature in SQUID Readout Electronics (SRE) hadrisen to 7 kelvin, but as of our 10:00 am PDT status meeting thismorning, the dewar was still cold enough for the SRE to providereadouts of the gyros' spin axes. As the SRE temperature continues torise, we will gradually lose these readouts.I grabbed my camera and dashed off to our Mission OperationsCenter (MOC). In recent weeks, our MOC has been relatively quiet,and typically there have only been a handful of people there at anygiven time. But, yesterday afternoon, the MOC was teeming withactivity, reminiscent of the days when we spun up the gyros in thesummer of 2004.The evidence was clearly visible on the dewar monitor screen. Thepressure display had suddenly taken a nose-dive. Elsewhere in theMOC, <strong>GP</strong>-B scientists and engineers were clustered around the statusmonitors representing their respective areas of expertise, engaged inanimated conversations. Meanwhile, our mission operations teammembers, headphones and microphones in place, werecommunicating with a NASA ground station, arranging for extratelemetry time.This past Monday, 26 September 2005, we made a third attempt toswitch from backup drag-free mode to primary drag-free mode ongyro #1. This latest attempt also failed, but for a different reason.Configuration issues were determined to be the root cause in each ofthe first two failures, and these issues were addressed prior to makingthis 3rd attempt on Monday. Analysis later this week showed thatMonday's failed attempt was consistent with similar failures we hadseen during the Initialization and Orbit Checkout (IOC) phase of themission in July and August, 2004, and it was likely due to un-modeledforces between the gyro rotor and its housing.As was the case during IOC, these issues could have been resolved withfurther experimentation and fine tuning the Attitude and TranslationControl system (ATC). However, given the imminent depletion of thedewar's helium supply, we decided to return the spacecraft to its stablescience configuration (backup drag-free mode, locked on the guidestar) and remain in this configuration until the helium ran out—whichas it turned out, happened three days later.Our science team is interested in comparing the data collected inscience configuration during this past week with the science data theycollected prior to beginning gyro torque calibrations in mid August.<strong>GP</strong>-B MISSION NEWS—THE DAY THE DEWAR DIEDAs we have been anticipating for some time now, the moment finallyarrived yesterday when the liquid helium in the dewar ran out. I wassitting in my office, thinking about what I was going to write in thisThere were some tense moments when all were patiently awaiting thedownload of more data that would confirm, unequivocally, that theliquid helium was depleted. We were also attempting to turn on theExperiment Control Unit (ECU) on the spacecraft so that we couldreceive some important data, such as the current temperature in thedewar. It took several hours to arrange all the necessary telemetrypasses, send the required commands to the spacecraft, and download<strong>Gravity</strong> <strong>Probe</strong> B — <strong>Post</strong> <strong>Flight</strong> Analysis • Final <strong>Report</strong> March 2007 519
the all the spacecraft status data. By late evening, it was clear that theliquid helium in the dewar had run out, and that the dewar andSQUIDs were slowly beginning to warm up.This morning, at our daily all hands meeting-the last of our dailyspacecraft status meetings-the room was packed. The word was outthat we had run out of helium, and everyone came to hear the details.At the end of the meeting, <strong>GP</strong>-B program manager, Gaylord Green,and <strong>GP</strong>-B principal investigator, Francis Everitt, each congratulatedthe team on their superb performance in working with one of the mostcomplex spacecraft ever launched. We then assembled in front of the<strong>GP</strong>-B building for a group photo, and the next to last chapter in thelong and colorful history of <strong>GP</strong>-B came to a close.AMERICAN PIE—GYRO STYLE(With apologies to Don McLean)A long, long time ago....I can still remember how that dewar used to make me smileAnd I knew if I had my chanceThat I could make those gyros danceAnd Francis would be happy for a while.But September 1st had come and goneThe helium went on and onNo time for celebrationAnother calibration....I can't remember if I criedRemembering how hard we'd triedAnd I was filled with a sense of prideThe day the dewar died....REFRAINSo, bye-bye, our friend in the skyTied my SQUID to the dewar,But the dewar was dry,And the good ol’ boys, drinking coffee and wine,Singing this’ll be the day that I die,This’ll be the day that I die….The gyros spun a little slow,So Gaylord said increase the roll.And gyro drift was truly low,The day the dewar died...We will continue to post these weekly updates for another week or so,while we perform some final tests as the spacecraft warms up. We willthen transition to less frequent updates-either bi-weekly or monthlyasthere will be little news to report from week to week during thecoming year of data analysis.For now, we leave you with a song, written by Rob Brumley (ourformer gyro expert), Greg Gutt (one of our former SQUID experts),with help from Bill Bencze (our deputy program manager forengineering).520 March 2007 Appendix C — Weekly Chronicle of the <strong>GP</strong>-B Mission
DSummary Table of <strong>Flight</strong> Anomalies<strong>Gravity</strong> <strong>Probe</strong> B — <strong>Post</strong> <strong>Flight</strong> Analysis • Final <strong>Report</strong> March 2007 521
522 March 2007 Appendix D — Summary Table of <strong>Flight</strong> Anomalies
This appendix contains a table summarizing the complete set of 193 anomalies/observations that the <strong>GP</strong>-BAnomaly Review Board (ARB) worked through during the IOC period from 20 April 2004 through 13 October2005. In the table, all formal anomalies are shown in boldface type.These anomalies have been divided in the four ARB categories as follows:1. 5 Major Anomalies (2 in IOC) These anomalies had the potential to endanger the safety of thespacecraft and/or the payload.2. 12 Medium Anomalies (9 in IOC) These anomalies did not endanger the safety of the space vehicle butdid impact the execution of planned timeline3. 6 Minor Anomalies. (3 in IOC) These anomalies did not endanger the safety of the space vehicle and didnot stop the execution of the timeline. However, they did require actions to mitigate or correct the issue.4. 170 Observations. (94 in IOC) Observations are off-nominal or unexpected behavior of the spacevehicle that was not an operational or functional issue and does not violate any limits, but did warrantattention over time. These can be considered vehicle “squawks”.Figure D-1. Anomaly Type Trends during the missionThe large table that comprises the bulk of this appendix presents a summary of all identified anomalies:description, root cause, and corrective action taken. The observations listed there—essentially very small andeasy to resolve anomalies—may be further categorized as follows:(A) Analysis items—Items still in work to understand the root cause (for open items only).(T) Tune items—Out of spec features resolved with on-orbit tuning of the spacecraft or payload.(O) Ops issues—Unexpected behavior due to an operations, mission planning, or other “human” error.(F) Features—Unexpected functionality that has no long term effect on the mission. This category alsoincludes routine issues, such as correcting double bit errors in processor memory.(N) Non-issues—Expected behavior not initially understood by the individual making the observation.<strong>Gravity</strong> <strong>Probe</strong> B — <strong>Post</strong> <strong>Flight</strong> Analysis • Final <strong>Report</strong> March 2007 523
Figure D-2 below shows the distribution of these categories across the major space vehicle subsystems. Becausethe vehicle is a system, not a collection of independent components, an observation may span more than onesubsystem.TuneItemsAnalysisitemsATCGSSTRESRECDHCOMDewarFigure D-2. Observation categories by subsystemThe key observation that can be made is that the two systems that could not be completely tested on the ground– the GSS and ATC systems – gathered a disproportionately large number of observation items. The othersystems had the advantage of being nearly fully testable in the lab and thus the operational bugs could beworked out prior to launch. Since the ATC and GSS require the space environment to function completely, theyrequired the most adjustment once on orbit.GMA29 14 7 2 6 1 1 602 4 1 7Features 6 28 2 10 19 2 3 6 1 2 2 5 86NonissuesOpsissues5 2 1 3 1 3 1 1 2 195 4 1 2 1 13Sum 47 52 10 15 21 4 13 1 6 1 1 2 3 9<strong>GP</strong>SEPSGyroPMTCSECUSum524 March 2007 Appendix D — Summary Table of <strong>Flight</strong> Anomalies
DateSeveritySubtypeTitle Description Root cause Corrective Action1 20-Apr-04 Obs F RAV4 Status RAV4 does not indicate"open".2 20-Apr-04 Obs F SS1 Aliveness TestActivated3 20-Apr-04 Obs T Thruster 2 & 14 showslow pressure4 20-Apr-04 Obs F Vatterfly temp sensornoisy reading5 20-Apr-04 Medium Star sensor lack ofacquisitionSS1 aliveness test activated,but mapped to no-op macro64.Thrusters 2 & 14 – very lowpressures (most are 4-5 mV,2 & 14 at -.1) (Saturated.)Vatterfly temp sensor noisyreadingStar sensor not properlyidentifying reference stars;attitude solution form starsensor processing erraticKnown issue with RAV valves(CARD 255).Result of bright objectdetection and subsequentinternal reset of star sensorelectronics.Thruster biasNoise in ECU seen duringground testing.Vehicle initial conditions(mass imbalance,alignments, star sensorsettings) generated datathat the star sensorprocessing algorithm wasunable process successfully.None; valve confirmedopen once thrusters beganworking.Disable this safemode test.Adjust thruster biases sapart of item 005.NoneSwitch to magnetometerbasedattitudedetermination algorithm,adjust magnitude and errorgate thresholds, tunecontrol gyro biases andcross products of inertia,update star sensoralignment matrices.Reacquisition procedureupdated based on-orbitperformance.6 20-Apr-04 Obs T Orbit modelingmismatch.7 21-Apr-04 Obs T Various star tracks thatare not aligned with rollHard to fit orbit modelingwith TDRS GSFC data.Various star tracks that arenot aligned with roll8 21-Apr-04 Obs F SEU observation Multi-bit and single biterrors seen on <strong>Flight</strong>computers; caused Anomaly#034 C&DH B side switchResidual venting of guardtank after launchATC off-tune after initialorbit insertion.Radiation eventsNone; wait for guard tankto complete venting.Tune ATC system (gyrobiases, thruster biases)Increase frequency of SEUmonitoring of CCCA.<strong>Gravity</strong> <strong>Probe</strong> B — <strong>Post</strong> <strong>Flight</strong> Analysis • Final <strong>Report</strong> March 2007 525
DateSeveritySubtypeTitle Description Root cause Corrective Action9 21-Apr-04 Medium Bias torque observed onvehicleBias torque on vehicle seenin telemetry data; large massflow from dewar throughthruster system.Thruster 6 malfunctioning;producing excessive,uncontrollable thrust. Likelyroot cause: foreign objectcontamination of thrusterIsolate thruster 6 (via TIV),adjust other thruster biasesand control modes (do notuse pressure feedback),update pseudo-inversematrix between ATCcontroller and thrusters.10 21-Apr-04 Obs N SRE SupplementalHeater on; SRE at 30 degCForward SRE SupplementalHeater on; AFT SRE at 30 degCHeater on per planNone11 21-Apr-04 Medium Dropouts on forwardantenna to TDRSSPoor link margins whenoperating on transponder A(forward) that caused poorcommand links, delayedTDRSS lockup.Most likely: (Mfgrassessment) low level out-ofband oscillation in thesecond LNA stage of thereceiver input. Hardwareproblem with transponderas provided bymanufacturer, not detectedat unit or system leveltesting. Limited to this unitonly.All forward transpondercontacts are 125/1K,transmitter commandedon/off in SV load, not byground command12 21-Apr-04 Obs T SPRU inrush currentexceed the red limit aftereclipse.13 21-Apr-04 Obs N Battery heater controlauthority lower thanexpectedSPRU inrush current exceedthe red limit after eclipse.Limits set too tight to "fresh"batteriesAdjust the limits andmonitor performance~half the battery heaters areon full time, the other halfalways off - resulting in lessTCS authority than expectedN/A - further analysisshowed pallet heatersworking properly aftervehicle temps stabilizedNone14 21-Apr-04 Obs N GSS3 Load defaultscompare may have loaderrorGSS3 Load defaults comparemay have load errorN/A - data dump showed noerror.None526 March 2007 Chapter D — Summary Table of <strong>Flight</strong> Anomalies
DateSeverity15 21-Apr-04 Obs F SRE Bracket temperaturetrending upwardShould have gone to 4K,instead, not decreasing. Newset point 2.5 and is stable at2.5K.16 21-Apr-04 Obs F P9B SM Test Activated P9B safe mode test triggeredshortly after P9A test wasactivated (value wentnegative).17 22-Apr-04 Obs T TRE –XA channel limit -XA channel at 9.99 Vviolation18 22-Apr-04 Medium Backup to digital failedon gyros 2 & 3SubtypeTitle Description Root cause Corrective ActionGyros 2, 3 failed to maketransition to science leveldigital control after initiallevitation in backup mode.Feature of algorithm; doesnot affect overall opeationLikely cause: data spike ingauge.Detectors have not yet beenbalanced on orbit.High gyro charge from initiallevitation off wall (300 mV)Document feature for opsteam.Disable P9 safemode andmanually monitor valveduring spinup.Run balance algorithm pertimeline plan.Increase control authorityin digital mode viaparameter update,discharge gyroscopes,switch back to nominalscience level preloads.19 23-Apr-04 Obs T OD in track thrustingobservedEstimate of drag (Cd) from avalue of 2.2 to about 1.2.Thruster biasesAdjust thruster biases.20 24-Apr-04 Obs F Spikes in ECU Data (GMASDTs)Spurious spikes in some ofECU data / open Obs 20(GMA SDTs?) No change inthermal control of GMA fromSDT spikes.Noise in ECU seen duringground testing.None21 24-Apr-04 Obs N Zone 5 Pressure Increase Increased pressure on Zone5 GMA pressure sensor22 24-Apr-04 Obs T GS Valid too early GS invalid flag start late endearly; extraneous light inscope --> Ops change.(former Obs 22)23 25-Apr-04 Obs N SQUID 2 railed duringSRE temperature rollmod testSQUID 2 railed during SREtemperature roll mod testGas leakage through GMAvalves; expectedGuide star valid widow toobig to exclude all earthshineThermal transient pushedSQUID limitsNoneTighten guide star validwindow.Re-set base temperatureand re-run trest.<strong>Gravity</strong> <strong>Probe</strong> B — <strong>Post</strong> <strong>Flight</strong> Analysis • Final <strong>Report</strong> March 2007 527
DateSeverity24 26-Apr-04 Obs F Noise on GSS FSU muxmonitors25 26-Apr-04 Obs F Transient temperatureincrease on the porousplug temperaturedifferential26 26-Apr-04 Minor LPS voltage trendingdownSubtypeTitle Description Root cause Corrective Action"hair" like data seen on allGSS health monitors; not onposition dataTemperatures have beenconsistently 4 mK apart. Asevere transient occurred 2to 3 mK apart.Corresponding GTtremendous drop of 0.3 K.Liquid point sensor, whichindicates possible porousplug breakthrough, wastrending toward yellowregion after TIV6 closure.Low level cross coupling ofmonitors in GSS forwardbox.Calibration of temperaturesensorSmall bias in liquid pointsensor data givingerroneous indication.None. Data is useable as is.Use independent means toverify a suspectedbreakthrough condtion.Use two independentmethods to identifybreakthrough conditions.27 27-Apr-04 Medium LV1 Neither Indicatesopen or closedAfter leakage vatterfly valve1 (LV1) initial opening,telemetry indicates that thevalve is in an intermediatestate, neither fully opened orclosedInsufficient durationspecified in valve commandtemplate to open valvecompletely.Increase duration to openand close the valve incommand templates.28 27-Apr-04 Obs N SAA Flag only set on halfof passes29 28-Apr-04 Obs F Station 200 TemperatureVariation30 28-Apr-04 Obs T SQUID 1, 3, 4 railedduring transition to gainlevel 5SAA Flag only getting sethalf the time it is expected tobe set.Temperature oscillation seenin SQUID bracketSQUID 1, 3, 4 railed duringtransition to gain level 531 29-Apr-04 Obs F TRE Data Spikes There are intermittent dataspikes in the TRE currenttelemetry.Flag only valid during guidestar valid per designGas in dewar wellTune-up issue with minimizelow pass filter algorithmRadiation events intelescope detector.32 29-Apr-04 Obs N SRE bus current jump SRE bus current jump Known issue with currentsensor used in SRENoneFlux flux will drive offresidual gas.Adjust algorithmparameters and re-deliverNoneNone528 March 2007 Chapter D — Summary Table of <strong>Flight</strong> Anomalies
DateSeveritySubtypeTitle Description Root cause Corrective Action33 30-Apr-04 Obs F Delta in 32 K and 2 K datavaluesThe 32 K and the 2 K data forthe same mnemonics arenot matching up exactly inTCAD.34 3-May-04 Major SV switched to B-side Spacecraft autonomouslyswitched to B-side C&DH(CCCA, ACE, IU, CTU, SSR).Feature of timing of ECUsample table.Multiple unrecoverabledouble bit errors (DBE) inCCCA memory. DBE mostlikely due to a radiationevent.Watch.Recover spacecraft andpayload to A-side systems.Review DBE safemodeentry criteria.35 3-May-04 Medium Possible porous plugchoking - high thrusterflowHigh thruster flow rates andpotential porous plugbreakthrough indicationsnoted after a CSTOLcommand to reconfigure theATC system after the A-034,“SV switch to B-side)Mis-configuration of ATCsystem; SW set for gyro lowmode, but control gyrohardware is in high modeand resulted in largecommanded thrust. CSTOLtemplate was in error; ITFtesting of template hadinsufficient fidelity to catcherror.Analysis and correction ofCSTOL procedures toproperly configure thehardware and softwaresystems.36 7-May-04 Obs T Prime drag-freeperformanceFailed first attempt at dragfreeon Gyro4This item tracking all opendrag-free issuesInsufficient ATC controlauthority to maintain dragfreesuspension on gyro 4.Use backup drag-free asprogram baseline37 10-May-04 Obs N Observer on followingspin up38 10-May-04 Obs F Spurious noise on ProtonDetector V channel39 11-May-04 Obs N Snapshots not beingprocessed or missing pertimeline needsObserver on following rollupPart of roll up templateNoneSpurious noise on ProtonDetector V channelNone at this timeWatchSome GSS snapshots notbeing processed or missingper timeline needsCorrupted data from groundstationRe-deliver and processclean data.<strong>Gravity</strong> <strong>Probe</strong> B — <strong>Post</strong> <strong>Flight</strong> Analysis • Final <strong>Report</strong> March 2007 529
DateSeverity40 11-May-04 Obs T Dwell scan aborted Dwell scan aborted due toATC mis-configuration of rollrate41 11-May-04 Obs T High He Mass Flowduring drag-free42 12-May-04 Obs T TRE +XA Ch Clipping/ATCdwell Scan issue43 12-May-04 Obs T Change of rotor chargeafter high-voltagecheckout44 13-May-04 Medium CSS reasonablenesssafemode activated45 13-May-04 Obs O Misconfiguration AFTversus FWD antennaSubtypeTitle Description Root cause Corrective ActionHigh He Mass Flow duringdrag-free (as observed bydewar telem)TRE +XA channel clipping.Change of rotor charge afterhigh-voltage checkout ongyros 4 & 1Coarse Sun Sensorreasonableness testtriggered safemode:stopped timeline, switchedto ACE B, safed GMA valves,reconfigured COM to125/1K.Following A-044, AFT andFWD transmitters weremisconfigured.46 14-May-04 Obs F Double-bit error tracking No automatic method oftracking double bit errors.47 14-May-04 Obs F Science Gyro 2 Largeposition excursion seenwith shutter activation48 16-May-04 Obs T Dewar main Tank temprising faster thanexpected during fluxflushScience Gyro2 Largeposition excursion seen withshutter activationDewar main Tank temprising faster than expectedduring flux flushAbort due to momentarilyexceeding commandedmass flow with combinationof drag-free and roll-downmaneuver.Thruster biases.DMA balance algorithm notgenerating a good balancesolution.Field emission of electronsin HV configuration withrotor off-center.CSS reasonablenessalgorithm misinterpretedsun sensor data as SV wentfrom full sun to eclipseperiod.Operations misconfiguationoftranspondersTemplates not available aspart of pre-launch set.Shutter generating largerthan anticipated mechanicaltransient.Larger than expected gas inwell between probe anddewar.Adjust mass flow limits toallow for sufficient massflow or separate dwell scanand drag-free maneuvers.Update thruster biases toeliminate excess mass flow.Update algorithm andredeliver.Discharge rotor andcontinue tests.Disable SM response;modify VMS macros to onlyuse/look at CSS in ATCbackup modes. VMSmacros updated followingFSW 3.4.3 upload.Explicit commands in loadare now used to commandthe transponders on andoff.Develop and delivertemplates to perform DBEmonitoring.Do not use shutter;abandon in place.Increase null dump tomaintain dewartemperature.530 March 2007 Chapter D — Summary Table of <strong>Flight</strong> Anomalies
DateSeveritySubtypeTitle Description Root cause Corrective Action49 17-May-04 MAJOR SM activated - High bodyratesHigh body rates observed(pointing) that activatedsafemode following fluxflush. Significant attitudeexcursions observed over anumber of days, degradingcommunications.Thruster 8 failed during highflow conditions followingflux flush. Failed openthruster caused porous plugto choke prior to thruster 8isolation. Most likely rootcause is foreign objectcontamination of thruster 8.Disable Thruster 8 (via TIV).Rebuild and reload ATCcontroller (FSW) to thrusterselection algorithm tocompensate for loss ofthrusters 6, 8. Update andinstall related VMS macros.50 18-May-04 Obs N Vatterfly valve stateupon SM (Anomaly #49)entry changed to closed,but we believe the valveremained openVatterfly valve state uponSM (Anomaly #49) entrychanged to closed, but webelieve the valve remainedopenFeature of ECU telemetrysampling scheme.Non-issue51 20-May-04 Obs T GSS low voltagecheckout failed tocomplete on Gyros 2 & 3Preliminary analysis oftelemetry indicates GSS lowvoltage checkout failed tocompleteHigh gyro charge from initiallevitation off wall (300 mV)Discharge rotor andcontinue tests.52 20-May-04 Obs T Dewar micro-tempvariation at orbital androll period53 21-May-04 Obs T GSS2 reduced stabilitymargins during uncagedcheckoutDewar micro-temp variationat orbital and roll periodResidual thermal couplingto probe from environmentAdjust tank temperatureand watch.Indications of reducedstability margins of sciencegyro 2 during uncagedcheckoutInsufficient stability marginfor gyro 2 at originalmodulation frequency,possibly due todisconnected ground planeIncrease frequency of drivevoltage from 20 to 30 Hz.54 25-May-04 Minor Unexpected turn off ofgyro1 High VoltageGyro1 de-levitatedunexpectedly during Gyro2suspension operation. Thegyroscope was not spinningat a significant rate at thispoint in the mission.Template error; a templatecloning error left the Gyro 1HV off commands in all fourgyro’s “science mission presuspend”templates. ITF hadinsufficient fidelity to detectthis error when tested.100% review of all GSStemplates (~250 items) forcloning errors or misplacedcommands. Correct anyerrors found, retest.<strong>Gravity</strong> <strong>Probe</strong> B — <strong>Post</strong> <strong>Flight</strong> Analysis • Final <strong>Report</strong> March 2007 531
DateSeveritySubtypeTitle Description Root cause Corrective Action55 30-May-04 Obs F UV Bias Setting TemplateFailure56 30-May-04 Medium Gyro 1 and 4 unexpectedchange to analogbackupAfter 2 attempts, UV Bias forGyro 3 set to 0 instead of thedesired -3 resulting in slowdischarge rate.Gyros 1, 4 transitionedautonomously to analogbackup control during gyrotorque calibration (1Hz cals)dry-runs. Gyro 4 touchedwall during transition at lowspin speed.Interface issue between FSWand GSW; exact causeunknownOverly aggressive preloadimbalances used during dryruns, causing the digitalcontroller to lose control ofthe rotor. Tested OK in ITF,but ITF had insufficientfidelity to model on-orbitforces and biases.Directly send commands toGSS rather than routingthem through CCCA.Rewrite and test templatesbased on groundexperience andconservative estimates ofcontroller stability margins.Retest and verifyfunctionality.57 1-Jun-04 Obs F High Dewar ShellTemperatureDewar shell temperature 20deg higher than prediction.58 3-Jun-04 Obs N Bright Object Events Sun Bright Object Test hasbeen generating eventssince it was enabled for SG4spinup59 3-Jun-04 Obs F Science Gyro oscillations Science Gyro oscillationsoccurred during thrusteroscillation that occurredprior to anomaly 49.60 4-Jun-04 Obs T Spin Ax align preload inphasePreloads on all three axesmove in phase during theinitial spin axis alignmenttest; should movedifferentially on X, Y onlyThermal model analysisindicated earth shine(albedo) is 10x greater thanoriginally modeled andaccounts for most of theeffect. Root cause:insufficient or detachedinsulation around conesection of the dewar.Star sensor naturallyidentifies bright objects(sun, earth, moon) andgenerates such eventsExcessive and erratic thrustgenerated during thruster 8failureError in setup of spin axisalignment algorithmCorrelate info with thermalmodel and use for lifetimepredictions.none.Isolate thruster 8 (peranomaly 49)Correct parameters andredeliver templates.532 March 2007 Chapter D — Summary Table of <strong>Flight</strong> Anomalies
DateSeveritySubtypeTitle Description Root cause Corrective Action61 6-Jun-04 Obs F CCCA 10Hz Timeouts 3 CCCA 10Hz timeout eventshave been countedCCCA under high workoadat start of guide star valid.Occasional single instanceof 10 Hz interrupt overrundetected due to stackup ofCCCA processing tasks. Notand issue if overrun occursinfrequently.Watch62 6-Jun-04 Obs T Lost Star from ScienceTelescopeLost Star from ScienceTelescope in mode 1BRoot cause: bug with gyrobias averaging algorithm.Correct and re-deliver gyrobias algorithm (loaded withFSW 3.4.3)63 7-Jun-04 obs T Telescope star trackingnot adequate for scienceduring initial mode 1BcheckoutTelescope star tracking notadequate for scienceATC off-tune after initialguide star acquisitionOptimize ATC parameters64 8-Jun-04 obs F DC offset in SQUIDobserved during GSvalid/GS InvalidtransitionSmall SQUID output shiftsoccurred at shutteropen/close events onlywhen GSS is HV mode.Electromechanicalinteraction of suspensionwith SQUID.Watch; does not occur inGSS low voltage modes.65 9-Jun-04 obs F Delay in fwd acquisition,transponder yellow templimitDelay in fwd acquisition,transponder yellow templimitMost probable cause ofdelayed acquisition on fwdtransponder was frequencyshift caused by hightransponder temperature.None; temporary conditiondeveloped during item 11root cause investigation.66 11-Jun-04 Obs A GSS1 C axis control effortnoiseGSS1 Z axis control effortshows 10 nm "digital" typenoise occasionally seen;position spikes on Zcorrelate.Probable root cause:thermal issues on GSSsuspension cables. Does notshow up in scienceconfiguration.Watch.67 14-Jun-04 Obs F Gyro 2 dropped out ofdigitalGyro 2 dropped out ofdigitalLikely root cause: raceconditions in the analogarbiter state machine due toholding the gyro forextended periods near thelow backup threshold.when positioning gyro offcenter,stay 1um away frombackup threshold.<strong>Gravity</strong> <strong>Probe</strong> B — <strong>Post</strong> <strong>Flight</strong> Analysis • Final <strong>Report</strong> March 2007 533
DateSeverity68 16-Jun-04 Medium Decline in <strong>GP</strong>S lock <strong>GP</strong>S lock time ratiodecreased from a nominal98% to 35% over a few dayperiod, roughly 60 days intomission.69 19-Jun-04 Obs T GSS Cal14 Sequence Gyros 1-4 did not re-centerat conclusion of CalSequence70 24-Jun-04 Obs T Thruster 12 bottomingout during roll-up to 0.6rpm71 27-Jun-04 Obs T Loss of Star Sensor IDs athigher roll rates72 28-Jun-04 Obs F <strong>GP</strong>S First Failure TestActivated73 29-Jun-04 Obs O SSR not in playbackmode during playbackpass74 29-Jun-04 Obs T Roll down is less thanexpectedSubtypeTitle Description Root cause Corrective ActionThruster 12 commandedcompletely closed duringroll-up to 0.6 rpm. Mayreduce ATC dynamic range.At 0.6 and 0.9 rpm, initial staridentifications decreasedresulting in attitude errors<strong>GP</strong>S First Failure TestActivatedSSR not in playback modeduring playback passSV roll down only to 0.7 rpm,0.5 rpm expected.Likely cause: SEU or longperiodsoftwareerror/overrun.Template scheduling error.Thruster pressure sensorbiasMost probable causes are:1) Gyro Bias errors, 2) sensorgate strategy, 3) star attitudecorrection weighting gain.Insufficient time allowed insafemode test for receiver tolock onto <strong>GP</strong>S constellationTemplate schduling error.The excess mass flow wentnegative for substantialportions of the roll downperiod, causing the vehicleto abort the roll downduring those times. Sensedrates on X and Y were largerthan expected.Reboot of unit cleared theproblem; <strong>GP</strong>S continues toperform as expectedfollowing reboot.Schedule templates incorrect order.Adjust pressure sensor biasto eliminate bottom-outRemaining actions: Updateprocedure for re-ID andlock on after possiblefuture loss of stars (in work)Increase first failure testtimeout duration.Shedule templates incorrect order.Command slower roll downrates.534 March 2007 Chapter D — Summary Table of <strong>Flight</strong> Anomalies
DateSeverity75 1-Jul-04 Minor Magnetometer testtriggered safemode80 2-Jul-04 Obs T GSS2 multi-bit error Double bit error in snapshotsection of SRAM (nonexecutable)SubtypeTitle Description Root cause Corrective ActionMagnetometerreasonableness testtriggered safemode macro;switched to B-sidemagnetometer.Recovery load for the FSW3.4.3 reboot mis-configuredthe magnetometersafemodes. Should havebeen “off” in recovery load.Audit future recovery loadsfor proper management ofmagnetometer safemodes.76 30-Jun-04 Obs Corruption of Science(L2) database77 1-Jul-04 Obs A ATC Massflow/Dewarmassflow determinationdisagreement78 2-Jul-04 Obs N High gyro charge inspinup mode79 2-Jul-04 Obs N GMA heater thermostatvariabilityCorruption of Science (L2)databaseDewar temperature (MT andHEX) indicates highermassflow estimated greaterthan 10 mg/s.Indicated gyro charge of~1.5 V in Spin UpGMA heater and BE_Htrcoming on same time81 7-Jul-04 Obs F High single bit errorcount and rate in CCCA-AHigh single bit error countand rate in CCCA-A82 9-Jul-04 Obs T Lost guide star Guide star was lost in duringa pass in the South AtlanticAnomaly83 9-Jul-04 Obs O G1x3x transition to lowbackupG1x3x transition to lowbackupInternal database errorDiffering calibration ofmeasuring methods formass flow. Time character ofresults are consistent.User interpretation error;procedure was correct.Gradual change in thermalcharacter of SV as sun anglechanges over the missionRadiation eventRadiation event, watch item.Radiation events intelescope detector.Template scheduling issue;transitioned from DCpreload config to chargemeasurement configwithout going through theAC preload configuration.Reprocess L2 data from L1data.Continue of crosscalibration/correlation ofATC and DewarmeasurementsNone.Expected behavior.Upload patch to correctmemoryWatchIncrease size of SAAkeepout window; adjusttelescope sanity checkparameters to exclude baddata points.Update GSS standardtransition sequences withproper sequence<strong>Gravity</strong> <strong>Probe</strong> B — <strong>Post</strong> <strong>Flight</strong> Analysis • Final <strong>Report</strong> March 2007 535
DateSeverity84 13-Jul-04 Obs F Slightly elevated solarradiation85 13-Jul-04 Obs F Gyro 2 possible floatingground plane86 15-Jul-04 Obs O Control Gyro A switchedto “High” mode87 16-Jul-04 Obs F High Gyro4 Spindownduring Gyro2 SpinupSlightly elevated solarradiation. Greater than 10MEV particle count.Gyro 2 possible floatingground planeControl Gyro A to “High”mode when previouslycommanded “Low” modeGyro4 spun down from105.8 to 90.77 Hz duringGyro2 spinup88 23-Jul-04 Obs F ATC Cross Coupling Pitch/yaw appears to havesome cross-coupling89 23-Jul-04 Obs T Spin Axis Alignmentrates less than expected90 23-Jul-04 Obs O Anomalous spin down ofgyro 191 25-Jul-04 Obs O Gyro 1 switched toanalog backup modeSubtypeTitle Description Root cause Corrective ActionObserved rates about 25%of expected ratesGyro 1 spun down duringcavity exploration activitieswhile scouting new locationfor full spinup.Gyro 1 switched to spinupanalog backup mode duringHV qualification of spinupposition.92 26-Jul-04 Obs F Large solar flare Large solar flare, >10 MeVprotons peaked at 2000 PFUat 26Jul04 2200ZSun spot activity.Likely cause: disconnect ofground wire to one half ofground plane.Template coding error; ITFhas insufficient fidelity todetect error.Larger than expected gasleakage from spinupchannel of gyro 2 duringgyro 4 spinup.Cross coupling due toremoval of gyro bias errorswhen transitioning out ofgyro hold.Insignificant centrifugalbulge due to low spin speed.Positioning gyroscope tooclose to housing wall duringcavity exploration.Likely root causes: 1)computer heartbeat glitchdue to high processorloading, 2) radiation event inGSS analog electronics, 3)race-mode condition in GSSarbiter.Solar activity in Sun.Level below danger limitsoutlined in Solar Flarecontingincy procedure.WathcNone at this time; stillunder investigation.Correct error and re-delivertemplate.Tune position of to be spunup subsequently (1, 3) tominimize leakage flow.No action required.Manually tune algorithm toproduce alignment indesired direction.Do not command gyroposition to within 2 um ofthe spindown positionduring spinup operations.Recover gyro to digitalsuspension and watchperformance.Safe vehicle per solar flarecontingency procedure.536 March 2007 Chapter D — Summary Table of <strong>Flight</strong> Anomalies
DateSeverity93 27-Jul-04 Obs F MSS 10Hz timing spike MSS 10Hz timing spike from91% to 97%94 31-Jul-04 Obs T Telescope SignalsSaturated3 of 8 detectors aresaturatedCCCA under high workloadat start of guide star valid.Occasional single instanceof 10 Hz interrupt overrundetected due to stackup ofCCCA processing tasks. Notand issue if overrun occursinfrequently.Thermal changes in the<strong>Probe</strong> and/or warmelectronics generated slightdrift. Corrected via regulardetector balancingoperationsWatchWatch and balance asrequired. Adjust TRE gain toavoid saturation.95 2-Aug-04 Obs F Multibit Error in GSS 4 Multibit Error in GSS 4 Radiation event. Correct error with softwarepatch.96 9-Aug-04 Obs T Gyro4 spin axis motionerratic97 9-Aug-04 Obs F Star Sensor SM testactivation98 9-Aug-04 Obs T High mass flow duringdrag-free opsSubtypeTitle Description Root cause Corrective Action99 10-Aug-04 Obs O Vehicle attitudeexcursion after gyro biasupdatesGyro 4 spin axis motion notconsistent with spin axisalignment theory; showspolhode modulatedsensitivityStar Sensor Alivenesssafemode test 1 activated;mapped to 64 (no-op)Higher mass flow (8 mg/sest) seen during primecompared to BU drag-freeops on Gyro1Vehicle attitude excursionafter gyro bias per PPCR #133Insignificant centrifugalbulge due to low spin speed.Bright object dataoverwhelming star sensorprocessorThruster biases and GSScontrol effort biases.Incorrect gyro bias updatesManually tune algorithm toproduce alignment indesired direction.Feature of star sensor; noaction required.Tune out thruster biases;continue root cause on GSScontrol efforts.Install correct bias updates.<strong>Gravity</strong> <strong>Probe</strong> B — <strong>Post</strong> <strong>Flight</strong> Analysis • Final <strong>Report</strong> March 2007 537
DateSeveritySubtypeTitle Description Root cause Corrective Action100 13-Aug-04 Obs F CCCA 10 Hz timeout CCCA 10 Hz processingtimeout occurs occasionallyat start of guid star valid.CCCA under high workoadat start of guide star valid.Occasional single instanceof 10 Hz interrupt overrundetected due to stackup ofCCCA processing tasks. Notand issue if overrun occursinfrequently.Watch.101 12-Aug-04 Obs T Common mode signalobserved on telescopedetectors102 12-Aug-04 Obs F <strong>GP</strong>S channel alignmenterror bit = true103 20-Aug-04 Obs T Desire to improve rmspointing performancefor science104 21-Aug-04 Obs T SQUID BracketTemperature Out ofLimitsCommon mode signalobserved on telescopedetectors.<strong>GP</strong>S channel alignment errorbit = trueDesire to improve pointingperformance for scienceShould be within +/- 5 Volts,but is going as high as +/- 10Volts105 17-Aug-04 Obs T Roll Phase Variation Since roll up from 0.52 to0.75, roll phase variation hasincreased.106 8-Aug-04 Obs O Forward link mutualinterferenceReceiver B (aft antenna)indicated momentarydetector lock and two otheroccasions the same receiverdid not acquire the forwardsignal apparently due tosome interference.Sub-optimal detector gains(balance); Improvementsgained via tuning of on orbitparameters.Radiation event.Sub-optimal gains in theATC control loop;Improvements gained viatuning of on orbitparameters.<strong>Probe</strong> thermal variationswhile moving to a newsetpointStill under investigationMutual interference withAURA or AQUA spacecraftoperating in ourtransponder band(scheduling issue)ATC parameteroptimizationReset <strong>GP</strong>S receiver.ATC parameteroptimizationReset bracket temperaturesetpoint.ATC parameteroptimizationWork with SN (GSFC) groupto identify points ofinterference and applyschedule keepout times.538 March 2007 Chapter D — Summary Table of <strong>Flight</strong> Anomalies
DateSeverity107 31-Aug-04 Obs F Double Bit Error in CCCAMemory108 Insert Time Obs F <strong>GP</strong>S Fwd +Y antennashows temperaturedropouts109 8-Sep-04 Obs F Double Bit Error in CCCAMemory110 10-Sep-04 Obs T Backup drag-freeperformance111 13-Sep-04 Obs F Elevated solar radiationlevelsThere was a double bit error(DBE) at 244/00:41Z while inSouth Atlantic Anomaly(SAA).TL_<strong>GP</strong>Sfwdant_pY showsdropouts to -65C from -16 to-25C when warming.There was a double bit error(DBE) at 252/02:16Z while inSouth Atlantic Anomaly(SAA).Performance of backupdrag-free is marginal at rollrate.112 15-Sep-04 Obs F SRE Multi-Bit Error MBE detected to haveoccurred in SRE code on9/1/04 @ 10:22:28; noimmediate impact113 16-Sep-04 Obs F MBE in the SRE MBE detected to haveoccurred on 9/16/04 @~20:00Z; no immediateimpact114 17-Sep-04 Obs F Excessive PB Data Seq.Errors115 24-Sep Medium Gyro3 in low backup;drag-free terminated.SubtypeTitle Description Root cause Corrective ActionRadiation event.(Preliminary) intermittentfailure of space vehicletemperature sensor.Radiation event. MBEoccurred in noncriticalRational function calls.GSS biasWatch.Watch; look for changes asvehicle comes out oufeclipse seasonDumped area of CCCAmemory containing MBE.Ran patch procedure toclear from memory.Drag-free gain wasincreased and updates ingyro biases improvedperformance.100pfu (>10MeV) exceeded Radiation event Closely monitored solaractivity. Radiation levelsreturned to nominal.Alaska and Wallops GNcontacts indicated excessivesequence errors.Safe Modes 2, 7, 11, 59triggered, causing thevehicle to roll down to 0.6rpm.Radiation eventRadiation eventGN antenna pointingMost probable cause issome vehicle motioncreated a large control efforton gyro 3, causing it to gointo backup.No effect on mission. MBElocation is in Science Slopedefault values and will notaffect function.SRE rebooted as part of Obs#122 recovery.Scheduled more playbackpasses. SSR pointer reset ifexcessive sequence errors.Vehicle commanded backto drag-free on SG#1 androll rate commanded backto nominal value.<strong>Gravity</strong> <strong>Probe</strong> B — <strong>Post</strong> <strong>Flight</strong> Analysis • Final <strong>Report</strong> March 2007 539
DateSeverity116 26-Sep-04 Obs F SG3 to LB1 Gyro3 transitioned to lowbackup due to position spikeon a single gyro axis.117 28-Sep-04 minor Oscillation in DF1 totalforceA 3.7 minute period, 1.5E-6m/s^2 oscillations seen inGS1 control efforts duringdrag-free. After drag-freemode terminated, effectdecayed over ~6 hours.118 30-Sep-04 Obs T Star tracker jumps Jumps in Star tracker Z-errormonitor at roll frequency,~30-40arc-sec119 1-Oct-04 Obs F GS3 DBE Counterincrementing120 7-Oct-04 Obs T Long GS Acquisitiontimes121 18-Oct-04 Obs F Gyro 1 Transitioned toLB1SubtypeTitle Description Root cause Corrective ActionMulti-bit error flagged inbenign portion of GSS3payload processorAcquisition times at start ofGuide_Star_Valid have beenten minutes or longer; twominutes is nominalDrag-free Gyro 1Transitioned to Analog BackUp. Safemode Macro 7activated122 20-Oct-04 Obs F Multiple MBEs in SRE 2 MBEs detected to haveoccurred in SRE at 10/8/04 at1:13:25 in FFT and at10/13/04 at 00:18:35 inSQ_Bracket_Temp_CtrlRadiation eventMost probable cause is thedrag-free system pumpingat the natural resonancefrequency of the helium indewar.ARP/star sensor motionRadiation eventGyro biases neededupdating due to ARP motioncaused by thermalvariations.Position spike on a singlegyro axis.Radiation eventGyro 3 resuspended indigital mode and excitationvoltage was increased.Updated DFS loop gain tothe launch value andoscillation is damping out.Decreased star sensor FOVto 0.4 degrees to reducelikelihood of future largespikes.Memory patch procedurebuilt and implemented.Gyro bias updated on the Xand Y axes.Went to backup drag-freefor Gyro 3. Gyro 1resuspended in digitalmode.Rebooted SRE to clearMBEs.123 2-Nov-04 Obs F MBE in GSS4 MBE detected to haveoccurred in GSS4 inSnapshot buffer 10, a noncriticalareaRadiation eventNormal overnight dumpingof snapshots cleared theMBE540 March 2007 Chapter D — Summary Table of <strong>Flight</strong> Anomalies
DateSeverity124 2-Nov-04 Obs T ATC Pointing variation Pointing varies when ineclipse vs. when in sunMost probable cause isthermally induced ARPmotion125 6-Nov-04 Obs T TRE channel railed TRE MX-A channel railed Most probable cause istemperature change in TREbox126 11-Nov-04 Medium SRE 1Hz Aliveness testactivatedSubtypeTitle Description Root cause Corrective ActionSafemodes 2, 3, 7, 11, 15, 59,and 60 activatedMost probable cause isinteraction between theSQUID bracket temp controlalgorithm and the MBE inthe BTC areaImplemented roll notchfilter in rate gyro pathduring GV.Readjusted 2 TRE clampvoltagesMacro 60 updated toprevent dropping out ofdrag-free if safemodeactivates.127 22-Nov-04 Obs F Ratio of MBE to SBE isapprox 10x higher thanpre-launch predictionHigher than expected SBEand MBE rates in SRE andGSSRadiation induced MBEerrors resulting fromcomponent selection of nonrad-hard computer memory.No known method toreduce the SBE/MBE ratesnow that <strong>GP</strong>B in orbit.128 24-Nov-04 Obs N Star tracker Atemperature trending upSS-A TE cooler and lenstemperature showing a 1-2degree rise over the last fewdaysAs SS warms, the tempapproaches the 10 degreesetpoint from the cold sideNo issue – temp below 10degree setpoint. Seen inweekly ATC trend plots.129 4-Dec-04 Medium ADA unrecoverableexception in ATCephemerisSafemodes 2, 5, 7, and 59activatedPoor satellite geometrycaused large DOPscombined with only 4satellites in view generateda spurious velocity solution.Recovered to drag-freewithin 7 hours of event andcaptured guide star within23 hours of event.130 9-Dec-04 Obs N Spurious CCCA MBEindicated in RTWorksBC_TlmDiag06 changedstate, causing RTWorks to goredDiagnostic test was runduring a 2k pass and left theTlmDiag06 pointing at adifferent memory locationthan expected by RTWorks.Red limit cleared by itselfwhen another diagnostictest was run during a 32kpass. Ops procedure beingupdated.131 9-Dec-04 Obs O Loss of guide star afterroll notch filterparameter loadLoss of guide star after rollnotch filter parameter loadOverly aggressive ATC notchon rate gyros during GSVReacquired guide star<strong>Gravity</strong> <strong>Probe</strong> B — <strong>Post</strong> <strong>Flight</strong> Analysis • Final <strong>Report</strong> March 2007 541
DateSeverity132 20-Dec-04 Obs F Uncorrelated elevatedproton monitor activity133 27-Dec-04 Obs N Higher than expectedflow rateSubtypeTitle Description Root cause Corrective ActionProton monitor showselevated activitySF_P_IntErrSp showsdecreasing trend134 4-Jan-05 Obs F GSS1 Double bit error DBE indicated in GSS1telemetry135 10-Jan-05 Obs F <strong>GP</strong>S Alignment Bit Set <strong>GP</strong>S alignment bit indicatestelemetry issue136 10-Jan-05 Obs F GSS1 DBE DBE indicated in“VecFromPartofArray”function GSS1137 17-Jan-05 Obs F MBE in SRE MBE in SRE detected on2005/017-14:53138 17-Jan-05 Obs T Charge Measurement ondrag-free gyroCharge rate significantlylower on gyro 3 (drag-freegyro) than other gyros139 19-Jan-05 Obs F ITF UPS failed UPS connected to someworkstations in the ITF failedafter a building powerfailure. ITF shut down.Failure appears to be digitalin nature, possibly thermalrelatedSeasonal issue, in eclipsewith less sunlight whentelescope looks at EarthRadiation eventSingle event upset duringpassage over South PoleRadiation eventRadiation eventATC was taking out thecontrol effort modulationson gyro 3.Possible computer circuitboard failure in UPS.Proton monitorcommanding andrebooting provedunsuccessful, however lossof Proton Monitor poses nothreat to missionIncreased mdot_outIdentified to be in a spinupparameter set location,which is not being used atthis time. Corrected viapatch procedure.<strong>GP</strong>S operating nominallywith this fault. No rebootrequired.Peek procedure run todetermine exact location ofDBE. Patch procedure runto clear the DBE.Code analysis verified MBEis in unused part of table.Turned off chargemeasurement on gyro 3.Went to new 14 secinstance D02 on gyros1,2,4. Turned chargemeasurement on gyro 3back on at 23 sec.Replaced PC boards in UPSunit. Pod G not affected.542 March 2007 Chapter D — Summary Table of <strong>Flight</strong> Anomalies
DateSeverity140 20-Jan-05 Minor Large solar flare Large solar event and loss ofguide starSolar event blinded sciencetelescopeSpace vehicle reconfiguredto science configuration.No long term issuesremain.141 20-Jan-05 Obs F MBE in SRE MBE detected at 159501296 Radiation event SRE rebooted142 26-Jan-05 Obs F Increase in CCCA SBEerror rate for 4 minutesSubtypeTitle Description Root cause Corrective ActionIncrease in CCCA SBE errorrate occurring duringsubsequent scrub cycles143 28-Jan-05 obs F MBE in CCCA MBE in CCCA detected at2005/028-17:30144 15-Feb-05 Obs F TRE thermal disturbanceafter DAS switchDecaying oscillation in A-side detector high signalobserved for 15 consecutiveorbits 2005/43-09:05 to2005/44-09:201 Stuck bit in the A-sideflight computerRadiation eventSwitching of SRE-A DASboards caused thermaltransient in TRE-A, resultingin oscillatory Detector Highsignals.After the B-side switch, theplan is to stay on the B-sideflight computer for the restof the mission.MBE found to be in usedarea of Ping buffer. Clearedby patch procedure.No more SRE-A DAS boardswitches are planned. If aswitch is planned, scheduleall switch templates duringGSI, >15 min before GSV.145 15-Feb-05 Obs T Reduction of excessmass flow when gyro Bturned on146 23-Feb-05 GroundObsExcess mass flow reducedseconds after gyro B turnedonF ITF SRE-A time-out 1Hz and 10Hz timeouts inthe ITF SRE-A147 2-Mar-05 Obs T Poor pointingperformance due to SAA148 2-Mar-05 Major B-Side SafemodeRecoveryPoor pointing performanceduring and after SAApassageB-side Safemode recovery.Scrub rate failedExtra ATC control effortrequired to counteract gyroB torque accounts for excessmass flow decrease.Payload processor controlblock was corrupted.If TRE gain is too high, ATCpointing slopes roll over.Gyro B turned off. A-sideperforms better at roll thanB-side, and A-side gyro tostay on for control.Swap Aft SRE-A with SRE-Band attempt transition.Reduced SAA circle from 43to 35 deg and notch filterto 45 deg circle. Reduced A-side gains to 9.2 simultaneous MBEs. Followed B-side recoveryprocedure. Recoveryactivities for this anomalyrolled over to Anomaly 152(CCCA-B Reboot)<strong>Gravity</strong> <strong>Probe</strong> B — <strong>Post</strong> <strong>Flight</strong> Analysis • Final <strong>Report</strong> March 2007 543
DateSeverity149 5-Mar-05 Obs T Few stars being trackedon star tracker BSubtypeTitle Description Root cause Corrective ActionNever acquired roll starswith B-side tracker after theB-side switch on 2005/63.150 6-Mar-05 Obs F MBE in CCCA MBE in B-side of CCCAdetected at 2005/65-00:36Z151 6-Mar-05 Obs F MBE in GSS4 MBE in GSS4 detected at2005/65-19:15152 15-Mar-05 Major CCCA-B Reboot CCCA Reboot at 2005/74-7:38:27 caused by MBE inCCCAOperator error; telemetrymonitor was providing staletelemetry which wasmistaken to be updated.Radiation eventRadiation eventRadiation eventSet feedforward commandand wait 1 orbit to confirm.MBE found to be in thesysinit of the CCCA. Clearedby patch procedure.Cleared by patchprocedure.Followed B-side recoveryprocedure. Recoveryactivities for this anomalyrolled into Anomaly 156(CCCA-B Reboot)153 15-Mar-05 OBs F MBE in CCCA Side B MBE in CCCA-B detected at2005/74-07:10154 15-Mar-05 Obs O Loss of ECU telemetryafter B-side reboot(Anomaly 152)Received no ECU telemetryafter the B-side reboot(Anomaly 152) on 2005/74-7:38:27155 17-Mar-05 Obs F 4 MBEs in GSS2 4 MBEs in GSS2 detected at2005/76-05:15156 18-Mar-05 Major CCCA-B Reboot CCCA Rebooted to B-side at2005/77-15:20:49157 27-Mar-05 Obs F MBE in GSS4 MBE in GSS4 detected at2005/86-06:00158 29-Mar-05 Obs F MBE in GSS2 MBE in GSS2 detected at2005/88-13:50159 1-Apr-05 Obs T Underdamped dewarpressure oscillationsMain tank pressure isoscillating 3uK peak to peakwith a period of 120hrs.Radiation eventWhen the CCCA reboots, itcomes up on RT7. The ECUwas on RT8 after the Mar-4-05 reboot.Radiation eventRadiation eventRadiation eventRadiation eventHeat exchanger’s efficiencycausing underdampedconditionMBE cleared by Anomaly152 (CCCA-B Reboot).ECU switched back to RT7.Plan is to not go back toRT8.Cleared by patchprocedureFollowed B-side recoveryprocedure. Vehiclereturned to scienceconfigurationTimeline stopped, patchprocedure ran to clear MBE.MBE in benign area, clearedby patch procedureReduced dewar gain by 20xto improve performance.544 March 2007 Chapter D — Summary Table of <strong>Flight</strong> Anomalies
DateSeverity160 14-Apr-05 Obs F Mdot change after gyrodischargeUsing more mass flow forcontrol after 4/13/05 gyrodischarge. Observed in allthree axes.161 30-Apr-05 Obs F MBE in CCCA MBE in CCCA detected on2005/120-12:21162 5-May-05 Obs O Elevated cross-trackresidualsHigh cross-track residuals ina pattern not seen before.Unknown force on thespacecraft could bemodifying the orbit plane163 20-May-05 Obs F DBE in GSS2 DBE in GSS2 observed at2005/140-10:47Z164 24-May-05 Obs F DBE in CCCA DBE detected via TlmDiag6in CCCA location 0x36E50165 24-May-05 Obs N Data processingdetected non-existentclock resetSubtypeTitle Description Root cause Corrective ActionData processing detected aclock reset in data stream;no clock reset happened onSV.Change in gyro potentialcausing bias changes whichmay correlate to Mdot outchange.Radiation eventIncorrect OD solutionRadiation eventRadiation eventSKS sent ASCII file instead ofbinary. Auto data processingalgorithms mis-identified aclock reset on SV.Adjusted z-bias to examineeffect on X and Y.MBE in a benign area,cleared by patchprocedure.Cross track residualsreturned to nominal.The DBE is in the benignGSS2 snapshot buffer andwill clear itself aftersnapshots are taken as partof the timeline.Patch affected area of GSSmemory.Request SKS to resend filein proper format.166 27-May-05 Obs F Gyro 2 in analog backup Gyro 2 in analog backup Radiation event Resupend usingcontingency templates intimeline.167 30-May-05 Obs F 2 MBEs in SRE 2 MBEs in SRE Radiation event None; MBEs will clear onlySRE is power cycled. Foundto be benign168 31-May-05 Obs T Loss of Guide Star Loss of Guide Star Large radiation signature onATC telescope slopescorrupted data in ATC rollnotch filterNotch filter to be turned offprior to SAA passes<strong>Gravity</strong> <strong>Probe</strong> B — <strong>Post</strong> <strong>Flight</strong> Analysis • Final <strong>Report</strong> March 2007 545
DateSeverity169 04-Jun-05 Obs F MBE in SRE MBE in SRE detected on DOY155170 05-Jun-05 Obs N Spike in TRE ScienceSlopesUnexpected light spike inTRE Science Slopes;consistent with seeng abright object.Radiation eventMost likely cause is anothersatellite passed into the fieldof view.None; MBEs will clear onlySRE is power cycled. Foundto be benign171 20-Jun-05 Obs F MBE in CCCA MBE in thruster current data Radiation event MBE cleared by patchprocedure.172 30-Jun-05 Obs F MBE in GSS-2 MBE in benign area of GSS-2code.173 02-Jul-05 Obs F <strong>GP</strong>S channel alignmenterror<strong>GP</strong>S channel alignment errorflags toggled true174 07-Jul-05 Obs F Gyro 3 in low backup Gyro 3 in low backup. Likelycauses: Radiation inducedarbiter or known racecondition.175 07-Jul-05 Obs O Drag-free safemode Drag-free safemodetriggered on attemted dragfreeentry to Gyro 1176 08-Jul-05 GroundObsSubtypeTitle Description Root cause Corrective ActionNITF GSS 4 AFT Unable todo external syncGSS 4 in the ITF does not do10Hz sync on external clockbut does sync to 1553.177 12-Jul-05 Obs A <strong>GP</strong>-B Roll Error Phase Develop an improved modeland better understanding ofthe roll phase error178 N (number skipped indatabase)MBE cleared by patchprocedure.Radiation eventRadiation eventMis-configured drag-freesafemodesSync cable damagedATC roll phase affected byARP motionNoneMBE cleared by patchprocedure.No impact to vehicle healthor <strong>GP</strong>S data; flag would becleared by <strong>GP</strong>S receiverreset (not executed)Resupend usingcontingency templates intimeline.Update templates forproper configurationCable repaired duringmove to <strong>Stanford</strong><strong>Post</strong>-process star trackerinformation on the ground.179 03-Aug-05 Obs F MBE in CCCA MBE in CCCA Radiation event MBE cleared by patchprocedure.546 March 2007 Chapter D — Summary Table of <strong>Flight</strong> Anomalies
DateSeverity180 03-Aug-05 Obs N Aft SRE-A in ITF Negative transition in the aftSRE-A in the ITF181 17-Aug-05 Obs MBE's in GSS_1 MBE's in Mission Criticalareas182 19-Aug-05 Obs N Excess Mass Flowviolates yellow limit.Excess mass flow violatedyellow limit.Sync cable damagedRadiation eventExpected condition basedon day's operationsCable repaired duringmove to <strong>Stanford</strong>MBE cleared by patchprocedure.Update RTWorks with newlimits to prevent errantlimit flags.183 26-Aug-05 Obs F MBE in GSS-2 MBE in benign area of GSS2 Radiation event MBE cleared by patchprocedure.184 24-Aug-05 Obs F Channel Alignment Errorin <strong>GP</strong>SChannel Alignment Error in<strong>GP</strong>S185 11-Sep-05 Obs N Pressure Drop in Dewar Dewar Pressure dropped, Zbias railed and thrusters 16and 10 went unstable.Radiation eventHigh dewar pressure andflow rates generatedconditions similar to Anom59.MBE cleared by patchprocedure.Command open loop on allthrusters.186 22-Sep-05 Obs F MBE in GSS 3 MBE in GSS 3 Radiation event MBE cleared by patchprocedure.187 26-Sep-05 Obs O ATC drag-free did notshut down on GSS DFterminationFollowing an attempt atPrime DF, the ATC did notshut down properly whenthe GSS resumed controlafter Prime DF attempt.Thusters randomly fired upto 5mN limit until manuallyshut down188 29-Sep-05 Minor END OF HELIUM END OF HELIUM189 30-Sep-05 Obs A GSS2 transitioned tobackup190 04-Oct-05 Obs A GSS 1 and GSS 3transitioned to analogbackupSubtypeTitle Description Root cause Corrective ActionGSS2 transitioned to backupduring dewar/probewarmupGSS 1 and GSS 3 transitionedto analog backupRoot casue found to be thatthe response to SMACRO7was disabled.Position spikes on GSSbridge due to warmingprobePosition spikes on GSSbridge due to warmingprobeRe-enable SMACRO7 for allprime DF operationNone; wait for dewar towarmNone; wait for dewar towarm<strong>Gravity</strong> <strong>Probe</strong> B — <strong>Post</strong> <strong>Flight</strong> Analysis • Final <strong>Report</strong> March 2007 547
DateSeverity191 04-Oct-05 Obs A GSS1-4 rotors heldagainst wallSubtypeTitle Description Root cause Corrective ActionGSS1-4 rotors held againstwall192 16-Oct-05 Obs F MBE in GSS1 MBE in GSS1; GSS1 already inHBU193 13-Oct-05 Obs O MOC server performancedegradationMoc server performancedegraded to the point wherethe system was unusablePotential root cause:actuation of mechanicalcaging system by warmingprobeRadiation eventProcess overloaded due totoo many applicationsrunning at once duringpost-mission codedevelopment ops.None.MBE cleared by patchprocedure.Conform to MOC/MCRprocess and monitorsystem health during alltest runs of new code548 March 2007 Chapter D — Summary Table of <strong>Flight</strong> Anomalies
E<strong>Flight</strong> Software Applications SLOC<strong>Gravity</strong> <strong>Probe</strong> B — <strong>Post</strong> <strong>Flight</strong> Analysis • Final <strong>Report</strong> March 2007 549
550 March 2007 Appendix E — <strong>Flight</strong> Software Applications SLOC
Table E-1below lists the source lines of code (SLOC) for the various <strong>GP</strong>-B flight software applications and theirsub-components. 59,000 lines of ADA and 2.3 MB of memory were required to implement the FSW featuresrequired by <strong>GP</strong>-B. At run time, the FSW expands to 3.5 MB in the CCCA SRAM after heap, stack, an otherdynamic storage is allocated.Detailed requirements and functional descriptions of the FSW components can be found in Lockheed MartinDocument #P086580: SCSE-15, <strong>Gravity</strong> <strong>Probe</strong> B <strong>Flight</strong> Software Requirements Specification.Table E-1. Mission Support Software (MSS) Software Lines Of Code (SLOC) DetailMSS Software Lines Of Code (SLOC) DetailReqIDFSWNetStatisticsLevel 1CSC58989 2.3 MBLevel2 CSC Level 3 CSC Level 4 CSC Unit Source Name SLOCMemorySizeMSS MissionSupportSWMSS MissionSupportSWMSS MissionSupportSWMSS MissionSupportSWMSS MissionSupportSWMSS MissionSupportSWMSS MissionSupportSWMSS MissionSupportSWMSS MissionSupportSWDMP DataMgmtProcessingDMP DataMgmtProcessingdebug_io.1.ada 81debug_io.2.ada 74generic_datatypes.1.ada 100 200generic_datatypes.2.ada 99 176int_io.1.ada 3 128stack_class.1.ada 34stack_class.2.ada 93time_io.1.ada 8 24time_io.2.ada 14 144application_process_id.1.ada 20application_process_id.2.ada 4<strong>Gravity</strong> <strong>Probe</strong> B — <strong>Post</strong> <strong>Flight</strong> Analysis • Final <strong>Report</strong> March 2007 551
ReqIDLevel 1CSCDMP DataMgmtProcessingDMP DataMgmtProcessingLevel2 CSC Level 3 CSC Level 4 CSC Unit Source Name SLOCSCH SchedulerProcessingSCH SchedulerProcessingSCH SchedulerProcessingSCH SchedulerProcessingSCH SchedulerProcessingSCH SchedulerProcessingSCH SchedulerProcessingSCH SchedulerProcessingSCH SchedulerProcessingSCH SchedulerProcessingSCH SchedulerProcessingSCH SchedulerProcessingSCH SchedulerProcessingSCH SchedulerProcessingSCH SchedulerProcessingSCH SchedulerProcessingSCH SchedulerProcessingSCH SchedulerProcessingSCH SchedulerProcessingmemory_access.1.ada 12memory_access.2.ada 96 1476binary_semaphore.1.ada 19 48binary_semaphore.2.ada 38 760ccsds_time.1.ada 71 32ccsds_time.2.ada 193 2556counting_semaphore.1.ada 20 48counting_semaphore.2.ada 37 740discretes.1.ada 16discretes.2.ada 47 800external_interrupts.1.ada 8 24external_interrupts.2.ada 50 1032hss_sequence_01.2.ada 31 200hss_sequence_02.2.ada 27 288hss_sequence_03.2.ada 2hss_sequence_04.2.ada 39 476mss_status.1.ada 68 320mss_status.2.ada 58 2304mutual_exclusion_semaphore.1.adamutual_exclusion_semaphore.2.ada15onboard_timer.1.ada 1130 412MemorySize552 March 2007 Appendix E — <strong>Flight</strong> Software Applications SLOC
ReqIDLevel 1CSCLevel2 CSC Level 3 CSC Level 4 CSC Unit Source Name SLOCSCH SchedulerProcessingSCH SchedulerProcessingSCH SchedulerProcessingSCH SchedulerProcessingSCH SchedulerProcessingSCH SchedulerProcessingSCH SchedulerProcessingSCH SchedulerProcessingSCH SchedulerProcessingSCH SchedulerProcessingSCH SchedulerProcessingSCH SchedulerProcessingSCH SchedulerProcessingSCH SchedulerProcessingIOP Input OutputProcessingIOP Input OutputProcessingIOP Input OutputProcessingIOP Input OutputProcessingIOP Input OutputProcessingIOP Input OutputProcessingIOP Input OutputProcessingIOP Input OutputProcessingonboard_timer.2.ada 22 380p10hz_sequence_01.2.ada 47 404p10hz_sequence_02.2.ada 72 628p10hz_sequence_03.2.ada 250 1700p10hz_sequence_04.2.ada 75 556p1hz.2.ada 171 1084protected_fifo.1.ada 19protected_fifo.2.ada 35scheduler.1.ada 2 24scheduler.2.ada 225 3244task_priorities.1.ada 12tlm_status.1.ada 16 32vehicle_time.1.ada 24 56vehicle_time.2.ada 60 2208io_directive.1.ada 203 484io_directive.2.ada 193 15756io_telemetry.1.ada 12 32level_discrete_fifo.1.ada 4 2244packet_identifier.1.ada 25 112packet_identifier.2.ada 14 200uplink.1.ada 21 32uplink.2.ada 165 7584MemorySize<strong>Gravity</strong> <strong>Probe</strong> B — <strong>Post</strong> <strong>Flight</strong> Analysis • Final <strong>Report</strong> March 2007 553
ReqIDLevel 1CSCLevel2 CSC Level 3 CSC Level 4 CSC Unit Source Name SLOCMemorySizeIOP Input Outputuplink.display_buffer.2.ada 2 8ProcessingIOP Input Outputuplink_check.1.ada 16 24ProcessingIOP Input Outputuplink_check.2.ada 211 10812ProcessingHSS High Speed Serial cdhs_protocol.1.ada 21HSS High Speed Serial cdhs_protocol.2.ada 23HSS High Speed Serial downlink.1.ada 10 24HSS High Speed Serial downlink.2.ada 54 460HSS High Speed Serial hss_interface.1.ada 18HSS High Speed Serial hss_interface.2.ada 76 964HSS High Speed Serial hss_interface.check_errors.2.ada 11 320HSS High Speed Serial cdhs.1.ada 98 2016HSS High Speed Serial cdhs.2.ada 121 7260HSS High Speed Serial cdhs_command_type.1.ada 231 448HSS High Speed Serial gps_cdhs.1.ada 42 472HSS High Speed Serial gps_cdhs.2.ada 48 2220HSS High Speed Serial gps_io.1.ada 2HSS High Speed Serial gps_io.2.ada 449 9280HSS High Speed Serial high_level_discrete.1.ada 34 248HSS High Speed Serial high_level_discrete.2.ada 53 1736HSS High Speed Serial low_level_discrete.1.ada 34 248HSS High Speed Serial low_level_discrete.2.ada 65 1880BCP Bus 1553 Protocol bus1553.1.ada 117 32BCP Bus 1553 Protocol bus1553.2.ada 416 25868BCP Bus 1553 Protocol hw_buffer.1.ada 101 952BCP Bus 1553 Protocol hw_buffer.2.ada 272 14316BCP Bus 1553 Protocol hw_command_type.1.ada 124 256BCP Bus 1553 Protocol hw_telemetry_type.1.ada 212 1708BCP Bus 1553 Protocol ace_buffer.1.ada 76 868BCP Bus 1553 Protocol ace_buffer.2.ada 73 4420BCP Bus 1553 Protocol ace_command_type.1.ada 125 336BCP Bus 1553 Protocol ace_host.1.ada 42 24BCP Bus 1553 Protocol ace_host.2.ada 87 4356BCP Bus 1553 Protocol ace_telemetry_type.1.ada 81BCP Bus 1553 Protocol ss_buffer.1.ada 83 2024BCP Bus 1553 Protocol ss_buffer.2.ada 181 2580BCP Bus 1553 Protocol ss_command_type.1.ada 97 680BCP Bus 1553 Protocol ss_host.1.ada 72 176554 March 2007 Appendix E — <strong>Flight</strong> Software Applications SLOC
ReqIDLevel 1CSCLevel2 CSC Level 3 CSC Level 4 CSC Unit Source Name SLOCBCP Bus 1553 Protocol ss_host.2.ada 267 9264BCP Bus 1553 Protocol ss_telemetry_type.1.ada 183 96BCP Bus 1553 Protocol transponder_buffer.1.ada 81 2104BCP Bus 1553 Protocol transponder_buffer.2.ada 63 1104BCP Bus 1553 Protocol transponder_command_type.1.ada 100BCP Bus 1553 Protocol transponder_host.1.ada 94 88BCP Bus 1553 Protocol transponder_host.2.ada 430 23724BCP Bus 1553 Protocol transponder_telemetry_type.1.ada 127CID Computer AndInterface DiagnosticsTMP Telemetrytelemetry.1.ada 36 24ProcessingTMP Telemetrytelemetry.2.ada 503 12692ProcessingTMP Telemetrycommlink.1.ada 4 24ProcessingTMP Telemetrycommlink.2.ada 12 304ProcessingPFT Programmable format_table.1.ada 48 24Format TelemetryPFT Programmable format_table.2.ada 89 108388Format TelemetryPFT Programmable monitor_set.1.ada 15Format TelemetryPFT ProgrammableFormat Telemetrymonitor_set.2.ada 506 38752PFT ProgrammableFormat TelemetryPFT ProgrammableFormat TelemetryPFT ProgrammableFormat TelemetryPFT ProgrammableFormat TelemetryMDP Memory DumpProcessingMDP Memory DumpProcessingTTE Record Time TaggedEventsTTE Record Time TaggedEventsprimary_programmable_telemetry.1.adaprogrammable_telemetry.1.ada 13programmable_telemetry.2.ada 65secondary_programmable_telemetry.1.ada4 29044 3064ccca_memory_dump.1.ada 24 276ccca_memory_dump.2.ada 112 3992event_log.1.ada 38event_log.2.ada 91MemorySize<strong>Gravity</strong> <strong>Probe</strong> B — <strong>Post</strong> <strong>Flight</strong> Analysis • Final <strong>Report</strong> March 2007 555
ReqIDLevel 1CSCLevel2 CSC Level 3 CSC Level 4 CSC Unit Source Name SLOCTTE Record Time TaggedEventsTTE Record Time TaggedEventsTTE Record Time TaggedEventsTTE Record Time TaggedEventsTTE Record Time TaggedEventsADB ApplicationDatabase ReadoutADB ApplicationDatabase ReadoutTFB Transfer FrameBuilderTFB Transfer FrameBuilderTFB Transfer FrameBuilderTFB Transfer FrameBuilderTFB Transfer FrameBuilderTFB Transfer FrameBuilderTFB Transfer FrameBuilderTFB Transfer FrameBuilderTFB Transfer FrameBuilderTFB Transfer FrameBuilderTFB Transfer FrameBuilderTFB Transfer FrameBuilderTFB Transfer FrameBuilderTFB Transfer FrameBuilderTFB Transfer FrameBuilderevent_supervisor.1.ada 34event_supervisor.2.ada 219primary_event_supervisor.1.ada 3 7500secondary_event_supervisor.1.ada 3 7508system_event_log.1.ada 2 4316database_dump.1.ada 31 64database_dump.2.ada 86 6288fifo_queue.1.ada 32fifo_queue.2.ada 32frame_header.1.ada 51 128frame_header.2.ada 17 144primary_channel.1.ada 3 6324recorder.1.ada 5recorder.2.ada 22 408regular_packet.1.ada 4 11312rolling_buffer.1.ada 7rolling_buffer.2.ada 40secondary_channel.1.ada 3 6396source_packet_class.1.ada 49source_packet_class.2.ada 116special_packet.1.ada 4 3656telemetry_channel.1.ada 12MemorySize556 March 2007 Appendix E — <strong>Flight</strong> Software Applications SLOC
ReqIDLevel 1CSCLevel2 CSC Level 3 CSC Level 4 CSC Unit Source Name SLOCTFB Transfer FrameBuilderTFB Transfer FrameBuilderTFB Transfer FrameBuilderTFB Transfer FrameBuilderCHP Command HandlerProcessingCHP Command HandlerProcessingCHP Command HandlerProcessingCHP Command HandlerProcessingCHP Command HandlerProcessingCHP Command HandlerProcessingCHP Command HandlerProcessingCHP Command HandlerProcessingCHP Command HandlerProcessingCHP Command HandlerProcessingRTC Real TimeCommandsRTC Real TimeCommandsSPC Stored ProgramCommandsSPC Stored ProgramCommandsSPC Stored ProgramCommandsSPC Stored ProgramCommandsSPC Stored ProgramCommandsSPC Stored ProgramCommandstelemetry_channel.2.ada 46telemetry_data.1.ada 16telemetry_data.2.ada 16 52transfer_frame.1.ada 29 48command_class.1.ada 210 1368command_class.2.ada 434 11172command_dataset_class.1.ada 41 444command_dataset_class.2.ada 299 7988command_envelope_class.1.ada 32 268command_envelope_class.2.ada 23sw_mailbox_class.1.ada 64 104sw_mailbox_class.2.ada 182 6600telecommand_packet.1.ada 36 176telecommand_packet.2.ada 123 6884rtc_processor.1.ada 16 112rtc_processor.2.ada 153 3904MemorySizegeneral_spcp_a.1.ada 2 14732general_spcp_b.1.ada 2 14732general_spcp_c.1.ada 2 14732general_spcp_d.1.ada 2 14732general_spcp_e.1.ada 2 14732general_spcp_f.1.ada 2 14732<strong>Gravity</strong> <strong>Probe</strong> B — <strong>Post</strong> <strong>Flight</strong> Analysis • Final <strong>Report</strong> March 2007 557
ReqIDLevel 1CSCLevel2 CSC Level 3 CSC Level 4 CSC Unit Source Name SLOCSPC Stored ProgramCommandsSPC Stored ProgramCommandsSPC Stored ProgramCommandsSPC Stored ProgramCommandsSPC Stored ProgramCommandsSPC Stored ProgramCommandsSPC Stored ProgramCommandsSPC Stored ProgramCommandsSPC Stored ProgramCommandsSPC Stored ProgramCommandsSPC Stored ProgramCommandsSPC Stored ProgramCommandsSPC Stored ProgramCommandsSPC Stored ProgramCommandsSPC Stored ProgramCommandsSPC Stored ProgramCommandsSPC Stored ProgramCommandsSPC Stored ProgramCommandsSPC Stored ProgramCommandsSPC Stored ProgramCommandsSPC Stored ProgramCommandsMBL Memory BlockLoadsglobal_variables.1.ada 21 632global_variables.2.ada 45 1492max_spcs.1.ada 2mission_spcp.1.ada 2 14732safemode_spcp_1.1.ada 2 14732safemode_spcp_2.1.ada 2 14732spc_data_array.1.ada 4 150000spc_data_array.2.ada 6 256spc_data_index_array.1.ada 6 60000spc_data_index_array.2.ada 6 256spc_list.1.ada 17 200spc_list.2.ada 210 5388spc_processor.1.ada 66spc_processor.2.ada 458spc_tag_array.1.ada 14 168spc_tag_array.2.ada 47 928spc_time_indicator_array.1.ada 6 2504spc_time_indicator_array.2.ada 6 256spc_time_value_array.1.ada 5 100000spc_time_value_array.2.ada 6 256vms_spcp.1.ada 2 14732ccca_memory_load.1.ada 10 80MemorySize558 March 2007 Appendix E — <strong>Flight</strong> Software Applications SLOC
ReqIDLevel 1CSCLevel2 CSC Level 3 CSC Level 4 CSC Unit Source Name SLOCMBL Memory BlockLoadsIMP Initial MSSProcessingIMP Initial MSSProcessingIMP Initial MSSProcessingIMP Initial MSSProcessingIMP Initial MSSProcessingIMP Initial MSSProcessingSRM Solid StateRecorderManagementSRM Solid StateRecorderManagementSRM Solid StateRecorderManagementSRM Solid StateRecorderManagementSRM Solid StateRecorderManagementSRM Solid StateRecorderManagementSRM Solid StateRecorderManagementSRM Solid StateRecorderManagementSRM Solid StateRecorderManagementSRM Solid StateRecorderManagementSRM Solid StateRecorderManagementccca_memory_load.2.ada 90 4644initialize_mailboxes.2.ada 194 1048eeprom_tables.1.ada 10fsw.2.ada 9 56initialize_fsw.2.ada 6 56initialize_mss.2.ada 57 976load_spc_tables.2.ada 25epoch_block_type.1.ada 184 1724epoch_host.1.ada 19 64epoch_host.2.ada 281 7376srm_dram.1.ada 89 1744srm_dram.2.ada 417 19004srm_eeprom.1.ada 89 160srm_eeprom.2.ada 640 22652srm_processing.1.ada 130 176srm_processing.2.ada 967 22368ssr_controller.1.ada 25 24ssr_controller.2.ada 41 476MemorySize<strong>Gravity</strong> <strong>Probe</strong> B — <strong>Post</strong> <strong>Flight</strong> Analysis • Final <strong>Report</strong> March 2007 559
ReqIDLevel 1CSCSRM Solid StateRecorderManagementSRM Solid StateRecorderManagementVMS Vehicle ModeSelectVMS Vehicle ModeSelectMFU MathematicalFunctionsMFU MathematicalFunctionsMFU MathematicalFunctionsMFU MathematicalFunctionsMFU MathematicalFunctionsMFU MathematicalFunctionsMFU MathematicalFunctionsMFU MathematicalFunctionsMFU MathematicalFunctionsMFU MathematicalFunctionsATP AttitudeAndTranslation ControlProcATP AttitudeAndTranslation ControlProcLevel2 CSC Level 3 CSC Level 4 CSC Unit Source Name SLOCActuator AndSensor ProcessingSCP Spacecraft SensorProcessingSCP Spacecraft SensorProcessingssr_management.1.ada 284 680ssr_management.2.ada 270 4020vehicle_mode_select.1.ada 18 92vehicle_mode_select.2.ada 72 2996generic_utilities.1.ada 124 24generic_utilities.2.ada 162gnc.1.ada 63 160gnc.2.ada 97 3264leap_utilities.1.ada 280leap_utilities.2.ada 325 152utility.1.ada 75utility.2.ada 122 244utility_atc.1.ada 69utility_atc.2.ada 404 10416transfer_1hz_10hz.1.ada 49 4528transfer_1hz_10hz.2.ada 62 2360gyro_processing.1.ada 54 232gyro_processing.2.ada 141 7756MemorySize560 March 2007 Appendix E — <strong>Flight</strong> Software Applications SLOC
ReqIDLevel 1CSCLevel2 CSC Level 3 CSC Level 4 CSC Unit Source Name SLOCPLP Payload SensorProcessingPLP Payload SensorProcessingACC ActuatorCommandsACC ActuatorCommandsAttitude ControlProcessingACL Attitude ControlLawACL Attitude ControlLawACG Attitude CommandGeneratorACG Attitude CommandGeneratorASA Attitude StarAcquisitionARC Attitude ReferenceAnd CorrectionARC Attitude ReferenceAnd CorrectionARC Attitude ReferenceAnd CorrectionARC Attitude ReferenceAnd CorrectionARC Attitude ReferenceAnd CorrectionARC Attitude ReferenceAnd CorrectionARC Attitude ReferenceAnd CorrectionARC Attitude ReferenceAnd CorrectionARC Attitude ReferenceAnd CorrectionARC Attitude ReferenceAnd CorrectionARC Attitude ReferenceAnd CorrectionARC Attitude ReferenceAnd Correctiondfs_processing.1.ada 92 408dfs_processing.2.ada 256 16148thruster_cmd_gen.1.ada 102 656thruster_cmd_gen.2.ada 344 22820att_control.1.ada 78 480att_control.2.ada 306 19620cmd_generator.1.ada 134 440cmd_generator.2.ada 562 27416att_propagation.1.ada 23 88att_propagation.2.ada 90 4060css_processing.1.ada 75 264css_processing.2.ada 286 16456mss_processing.1.ada 65 264mss_processing.2.ada 146 8908sensor_select.1.ada 25 112sensor_select.2.ada 148 6708squid_processing.1.ada 81 536squid_processing.2.ada 461 22360st_processing.1.ada 70 128MemorySizest_processing.2.ada 255 13436<strong>Gravity</strong> <strong>Probe</strong> B — <strong>Post</strong> <strong>Flight</strong> Analysis • Final <strong>Report</strong> March 2007 561
ReqIDLevel 1CSCLevel2 CSC Level 3 CSC Level 4 CSC Unit Source Name SLOCMemorySizeARC Attitude Reference star_proc.1.ada 277 816And CorrectionARC Attitude Reference star_proc.2.ada 735 51804And CorrectionTQC Torque Calculation torque_est.1.ada 43 120TQC Torque Calculation torque_est.2.ada 106 6544OBS Observer Control observer.1.ada 46 144LawOBS Observer Control observer.2.ada 213 19528LawTranslation ControlProcessingTCL Translation Control trans_control.1.ada 77 896LawTCL Translation Control trans_control.2.ada 232 19608LawTCG Translationtrans_cmd_gen.1.ada 21 48Command GeneratorTCG Translationtrans_cmd_gen.2.ada 79 3992Command GeneratorTRF TranslationReferenceTFC Total Forceforce_sum.1.ada 30 96CommandTFC Total Forceforce_sum.2.ada 130 9560CommandGGF GG Force Estimate force_est.1.ada 50 536GGF GG Force Estimate force_est.2.ada 135 12372THC Thruster Commanddewar_processing.1.ada 157 112ProcessingTHC Thruster Commanddewar_processing.2.ada 611 25964ProcessingTHC Thruster Commandmts_distribution.1.ada 43 104ProcessingTHC Thruster Commandmts_distribution.2.ada 154 10952ProcessingTHC Thruster Commandpseudo_inverse.1.ada 17 56ProcessingTHC Thruster Commandpseudo_inverse.2.ada 65 4904ProcessingTHC Thruster Commandthruster_curve_fit.1.ada 121 4400ProcessingTHC Thruster CommandProcessingthruster_curve_fit.2.ada 11461 325348562 March 2007 Appendix E — <strong>Flight</strong> Software Applications SLOC
ReqIDLevel 1CSCLevel2 CSC Level 3 CSC Level 4 CSC Unit Source Name SLOCOTC Orbit Trim ControlLawOTC Orbit Trim ControlLawMBP Mass BalanceProcessingEphemerisAnd <strong>GP</strong>SProcessingorbit_trim.1.ada 42 48orbit_trim.2.ada 137 5820MemorySizeEMP Ephemeris Modelcommon_ephemeris_db.1.ada 14 48ProcessingEMP Ephemeris Modelcommon_ephemeris_db.2.ada 53 1868ProcessingEMP Ephemeris Modelephemeris.1.ada 143 448ProcessingEMP Ephemeris Modelephemeris.2.ada 732 31228ProcessingEMP Ephemeris Modelmoon.1.ada 50 40ProcessingEMP Ephemeris Modelmoon.2.ada 308 10384ProcessingEMP Ephemeris Modelsun.1.ada 29 48ProcessingEMP Ephemeris Modelsun.2.ada 190 6748ProcessingMFP Magnetic Fieldmagmodel.1.ada 20 56ProcessingMFP Magnetic Fieldmagmodel.2.ada 96 5968ProcessingOEP Orbital Eventorbital_events.1.ada 210 368ProcessingOEP Orbital Eventorbital_events.2.ada 643 28728ProcessingVAP Velocity Aberration velocity_aberration.1.ada 48 248VAP Velocity Aberration velocity_aberration.2.ada 147 8360TFM Transformationtransforms.1.ada 117 824MatricesTFM Transformationtransforms.2.ada 432 19840MatricesSMP Safemodesafemode_check_application.1.ada 32ProcessingSMP SafemodeProcessingsafemode_check_application.2.ada 95<strong>Gravity</strong> <strong>Probe</strong> B — <strong>Post</strong> <strong>Flight</strong> Analysis • Final <strong>Report</strong> March 2007 563
ReqIDLevel 1CSCLevel2 CSC Level 3 CSC Level 4 CSC Unit Source Name SLOCSMP SafemodeProcessingSMP SafemodeProcessingVSM Vehicle SubsystemMonitoringDMM Data Mgmt SystemMonitorsDMM Data Mgmt SystemMonitorsDMM Data Mgmt SystemMonitorsDMM Data Mgmt SystemMonitorsDMM Data Mgmt SystemMonitorsDMM Data Mgmt SystemMonitorsDMM Data Mgmt SystemMonitorsDMM Data Mgmt SystemMonitorsDMM Data Mgmt SystemMonitorsDMM Data Mgmt SystemMonitorsDMM Data Mgmt SystemMonitorsDMM Data Mgmt SystemMonitorsDMM Data Mgmt SystemMonitorsDMM Data Mgmt SystemMonitorsDMM Data Mgmt SystemMonitorsDMM Data Mgmt SystemMonitorsDMM Data Mgmt SystemMonitorsDMM Data Mgmt SystemMonitorsDMM Data Mgmt SystemMonitorssafemode_test.1.ada 21safemode_test.2.ada 40 1376ccca_check.1.ada 32 216ccca_check.2.ada 163 5500cdhs_check.1.ada 34 200cdhs_check.2.ada 225 6764check_1553_errors.1.ada 2check_1553_errors.2.ada 16 296data_input_10hz_check.1.ada 34 264data_input_10hz_check.2.ada 246 7496data_input_1hz_check.1.ada 16 520data_input_1hz_check.2.ada 14 4316error_messages.1.ada 30 256error_messages.2.ada 29 940gps_check.1.ada 33 192gps_check.2.ada 138 4884memory_scrub_interface.1.ada 2 24memory_scrub_interface.2.ada 41 744scrubfns.1.ada 33uplink_safing_check.1.ada 41 136MemorySize564 March 2007 Appendix E — <strong>Flight</strong> Software Applications SLOC
ReqIDLevel 1CSCLevel2 CSC Level 3 CSC Level 4 CSC Unit Source Name SLOCDMM Data Mgmt SystemMonitorsEPM Electrical PowerSystem MonitorsEPM Electrical PowerSystem MonitorsTSM Thermal SystemMonitorsTSM Thermal SystemMonitorsASM ATC SystemMonitorsASM ATC SystemMonitorsASM ATC SystemMonitorsASM ATC SystemMonitorsASM ATC SystemMonitorsASM ATC SystemMonitorsASM ATC SystemMonitorsASM ATC SystemMonitorsPSM Payload SystemMonitorsPSM Payload SystemMonitorsPSM Payload SystemMonitorsPSM Payload SystemMonitorsPSM Payload SystemMonitorsPSM Payload SystemMonitorsSRP SafemodeResponseProcessingSRP SafemodeResponseProcessinguplink_safing_check.2.ada 139 4668eps_check.1.ada 32 136eps_check.2.ada 119 4232temperature_limits_check.1.ada 32 200temperature_limits_check.2.ada 139 5284atc_10hz_check.1.ada 68 876atc_10hz_check.2.ada 506 16768atc_1hz_check.1.ada 42 144atc_1hz_check.2.ada 185 6764control_gyro_check.1.ada 49 240control_gyro_check.2.ada 228 6992sun_presence_detect.1.ada 29 168sun_presence_detect.2.ada 45 2088gyro_spinup_check.1.ada 48 360gyro_spinup_check.2.ada 333 12736payload_check.1.ada 37 376payload_check.2.ada 264 8788payload_temp_check.1.ada 42 392payload_temp_check.2.ada 351 10308safemode_macros.1.ada 44 184safemode_macros.2.ada 106 3852MemorySize<strong>Gravity</strong> <strong>Probe</strong> B — <strong>Post</strong> <strong>Flight</strong> Analysis • Final <strong>Report</strong> March 2007 565
ReqIDLevel 1CSCSRP SafemodeResponseProcessingSRP SafemodeResponseProcessingEPP EPSSupportProcessingEPP EPSSupportProcessingLevel2 CSC Level 3 CSC Level 4 CSC Unit Source Name SLOCBSP Battery SupportProcessingBSP Battery SupportProcessingBSP Battery SupportProcessingBSP Battery SupportProcessingTSP ThermalSupportProcessingPayloadSupportProcessingsafemode_response.1.ada 21 24safemode_response.2.ada 149 3828eps_processing.1.ada 16 24eps_processing.2.ada 60 1768battery_processing.1.ada 194 256battery_processing.2.ada 927 38824charge_control.1.ada 179 520charge_control.2.ada 699 29584STP Snapshotgss_snapshot.1.ada 3 1072ProcessingSTP SnapshotProcessingSTP Snapshotsnapshot.1.ada 9ProcessingSTP Snapshotsnapshot.2.ada 31ProcessingSTP Snapshotsnapshot_data.1.ada 9 416ProcessingSTP Snapshotsre_snapshot.1.ada 3 1232ProcessingSTP SnapshotProcessingSQP SQUID Processing ccca_pit.1.ada 86 112SQP SQUID Processing ccca_pit_command.1.ada 42 96SQP SQUID Processing ccca_pit_command.2.ada 146 3780SQP SQUID Processing payload.1.ada 113 616SQP SQUID Processing payload_host.1.ada 64 384MemorySize566 March 2007 Appendix E — <strong>Flight</strong> Software Applications SLOC
ReqIDLevel 1CSCLevel2 CSC Level 3 CSC Level 4 CSC Unit Source Name SLOCMemorySizeSQP SQUID Processing payload_host.2.ada 195 6564SQP SQUID Processing payload_io.1.ada 44 3360SQP SQUID Processing payload_io.2.ada 86 2112SQP SQUID Processing router_command.1.ada 12 88SQP SQUID Processing router_command.2.ada 41 712SQP SQUID Processing squid.1.ada 128 328SQP SQUID Processing squid_health_checks.1.ada 55 384SQP SQUID Processing squid_health_checks.2.ada 568 14080SQP SQUID Processing squid_init.1.ada 157 268SQP SQUID Processing squid_init.2.ada 1744 54096SQP SQUID Processing squid_offset.1.ada 39 368SQP SQUID Processing squid_offset.2.ada 285 6836SQP SQUID Processing squid_tlm.1.ada 37 1916SQP SQUID Processing sre.1.ada 188 448SQP SQUID Processing sre_host.1.ada 15 88SQP SQUID Processing sre_host.2.ada 113 2768SQP SQUID Processing sre_pit_distributor.1.ada 2SQP SQUID Processing sre_pit_distributor.2.ada 555 14476SQP SQUID Processing sre_pit_format.1.ada 402SQP SQUID Processing sre_tlm.1.ada 113 2744SQP SQUID Processing sre_tlm.2.ada 56 1792SQP SQUID Processing tre.1.ada 68 232SQP SQUID Processing tre.2.ada 42SQP SQUID Processing tre_tlm.1.ada 57 1280SQP SQUID Processing tre_tlm.2.ada 28 48PSU Payload Processorinterprocessor.1.ada 8 24MgmtPSU Payload Processorinterprocessor.2.ada 35 452MgmtPSU Payload Processorpp_buffer.1.ada 99 2340MgmtPSU Payload Processorpp_buffer.2.ada 275 9908MgmtPSU Payload Processorpp_command_Mgmttype. 59 3041.adaPSU Payload Processorpp_host.1.ada 55 48MgmtPSU Payload ProcessorMgmtpp_host.2.ada 292 9704<strong>Gravity</strong> <strong>Probe</strong> B — <strong>Post</strong> <strong>Flight</strong> Analysis • Final <strong>Report</strong> March 2007 567
ReqIDLevel 1CSCGUP GSS Processing gss.1.ada 155GUP GSS Processing gss_host.1.ada 52GUP GSS Processing gss_host.2.ada 257GUP GSS Processing gss_pit.1.ada 43GUP GSS Processing gss_pit_command.1.ada 20 288GUP GSS Processing gss_pit_command.2.ada 38 932GUP GSS Processing gss_pit_distributor.1.ada 2 24GUP GSS Processing gss_pit_distributor.2.ada 220 6064GUP GSS Processing gss_pit_format.1.ada 203GUP GSS Processing gss_tlm.1.ada 103 4224GUP GSS Processing gss1_host.1.ada 3 7860GUP GSS Processing gss2_host.1.ada 3 7860GUP GSS Processing gss3_host.1.ada 3 7860GUP GSS Processing gss4_host.1.ada 3 7860GUP GSS Processing roll_angle_data_filter.1.ada 55 1224GUP GSS Processing roll_angle_data_filter.2.ada 117 5452GUP GSS Processing spin_axis_allignment.1.ada 63GUP GSS Processing spin_axis_allignment.2.ada 275EUP ECU Processing ecu_command_type.1.ada 133 80EUP ECU Processing ecu_interface.1.ada 204 24EUP ECU Processing ecu_interface.2.ada 1423 58588EUP ECU Processing ecu_io.1.ada 155 2756EUP ECU Processing ecu_io.2.ada 459 19748EUP ECU Processing ecu_pid.1.ada 89 4888EUP ECU Processing ecu_pid.2.ada 677 41856EUP ECU Processing ecu_telemetry_type.1.ada 115 88OSS OperatingSystem SWbiccfns.1.ada 51OSS OperatingSystem SWOSS OperatingSystem SWOSS OperatingSystem SWOSS OperatingSystem SWLevel2 CSC Level 3 CSC Level 4 CSC Unit Source Name SLOCbus_1553_device_driver_interface.1.ada209hssfns.1.ada 21rscfns.1.ada 55sysio.1.ada 45MemorySize568 March 2007 Appendix E — <strong>Flight</strong> Software Applications SLOC
FAcronyms & Abbreviations<strong>Gravity</strong> <strong>Probe</strong> B — <strong>Post</strong> <strong>Flight</strong> Analysis • Final <strong>Report</strong> March 2007 569
570 March 2007 Appendix F — Acronyms & Abbreviations
AcronymAA/DA/TAberr.ABPACAcACEACLACOACSACSLACUACUAdaAdaADARTSADDAADPADRAFAFBAFMAFSCNAFSC DHAFSDAGSAGSUAhAIAIPSAlALRMAmAMTANVOAOSDefinitionanalysisAnalog/DigitalAcceptance TestAberrationAft BackplaneAlternating Currentelement - ActiniumAttitude Control ElectronicsAft Communication LinkAdministrating Contracting OfficerAft Clock SupportAdvance Continuous SimulationLanguageAttitude Control UnitAft Control UnitAda Computer Programming LanguageComputer software languageAda-based Design Approach for RealTimes Systems methodologyAnalog to Digital & Digital to AnalogAcceptance Data PackageAcceptance Data ReviewAir ForceAir Force BaseAir Force ManualAir Force Satellite Control NetworkAir Force System Command DesignHandbookAir Force Space Systems DivisionGN station in Poker flats, AlaskaAdvanced Gyro Suspension UnitAmpere HourAction ItemsAstrological Image processing systemelement - AluminumAttitude Reference Platform LaunchRestraint Mechanismelement - AmericiumAft Monitor/TimingAccept No Verbal OrdersAcquisition of SignalAcronymAPAPCAPCAPIDAPMAPPROAqARArARARARBARCARCSECAROARPASASAsASCIIASUATAtATCATCATCATCSATMATPATPATPATPATPATPAuAUTAVGAWBDefinitionArgument of PerigeeAllocated Prime CostAllocated pool chargeApplication Process IdentificationAft Power ModuleAir Force Plant Representative Officeelement - SilverAcceptance Reviewelement - ArgonAccident Risk Assessment <strong>Report</strong>ArbiterAmes Research CenterarcsecondAfter Receipt of OrderAttitude Reference PlatformActive Scheduler Scheduling OperatorArtificial Starelement - ArsenicAmerican Standard Code forInformation InterchangeAft Suspension UnitAcceptance Testelement - AstatineAdvanced Technology Center formerlyRD&DAft Test CardAttutude & Translation ControlSubsystemAttitude & Translation Control SystemAtmosphereAutomated Test ProcedureAutomation Grnd. S/W SubsystemAcceptance Test ProcedureATC ProcessingAuthorization To ProceedAutomated Test Procedureelement - GoldAutomation Grnd. S/W SubsystemAverageIn Accordance withelement - Boron<strong>Gravity</strong> <strong>Probe</strong> B — <strong>Post</strong> <strong>Flight</strong> Analysis • Final <strong>Report</strong> March 2007 571
AcronymDefinitionAcronymDefinitionB&PBid and ProposalCALCCalculateB/SecBits per SecondCAMComputer-Aided ManufacturingBaelement - BariumCAMCost Account ManagerBBQBar B QueCARCorrective action requestBCCBattery Conditioning ConsoleCARDConstraints and Restrictions DocumentBDBoardCASBCost account standard boardBeelement - BerylliumCASEComputer Aided Software EngineeringBERBhBiBITBkbldgBOLBOMBPSBPSBrBSBSSBSSBTCBUSBWCCC&DHC&DHSC&DHUC.G.C/ACACACaCADCADAMCALCALCal.Bit Error Rateelement - Bohriumelement - BismuthBuilt-In-Testelement - BerkeliumbuildingBeginning of LifeBill of MaterialsBelville Preload SystemBits Per Secondelement - BromineBootstrap SoftwareBoot Strap Software CSCIBoot Strap Software S/W SubsystemBinary Time CodeBackup Safemode SoftwareBandwithDegrees Celsiuselement - CarbonCommand & Data HandlingCommand & Data Handling SystemCommand & Data Handling UnitCenter of <strong>Gravity</strong>Corrective ActionCaliforniaCorrective Actionelement - CalciumComputer-Aided DesignComputer-Aided Design andManufacturingCalibration Mission Phase [L+15 monthsto L+18 months]CaliforniaCalibrationCBSCCBCCBCCCCCCACCSDSCCTCCWCDCDCDCDCDCdC&DHSCDHSCDRCDRLCeCEICETCfCfACFECFGcfmCFPCGCGCCCA Boot Strap Software S/WSubsystemChange Control BoardLMMS Change Control BoardCommand Control Computer FunctionGrnd. S/W SubsystemCommand/Control Computer AssemblyConsultant Committee for Space DataSystemsCommand & Control Trim FunctionGrnd. S/W SubsystemCounter ClockwiseCenter DirectorCompact discCenter DirectorChange DirectiveCoefficient of DragCd element - CadmiumCommand and data handlingCommand and data handling systemCritical Design ReviewCDRL Contractor Data Requirements ListCe element - CeriumContract End ItemCommand Extraction Tools Grnd. S/WSubsystemelement - CaliforniumHarvard-Smithsonian Center forAstrophysicsCustomer Furnished EquipmentConfiguration Grnd. S/W SubsystemCubic Feet per MinuteCustomer Furnished PropertyCenter of <strong>Gravity</strong>Control Gyroscope on ARP572 March 2007 Appendix F — Acronyms & Abbreviations
AcronymDefinitionAcronymDefinitionCGControl GyrosCSCIComputer Software Configuration ItemCGNCommand Generation S/W SubsystemCSEChief Systems EngineerCIContinuous ImprovementCSSCoarse Sun SensorCICICICICICIEMConfiguration ItemConfiguration InspectionConfiguration ItemContinuous ImprovementCritical ItemComputer Integrated Engineering andManufacturingCSTOLCTECTSCTUCTVCTVColorado Spacecraft Test andOperations LaguageCoefficient of Thermal ExpansionCommand and Telemetry Software CSCICommand & Telemetry UnitCompatiblility Test VanCommand and Telemetry VanCILCritical Items ListCUColorado UniversityCKTCircuitCUCommand UnitCLACoupled loads AnalysisCuelement - CopperClelement - ChlorineCWClockwiseCILCritical Items ListD-logDiscrepancy LogCMCenter of MassDAData AnalysisCMCMCmCmdCmdGenCMMCMMCMPCMXCNCCNTCRCoCOBECOMCOMCOTSCPAFCPICPUCrcryo.CsCSCConfiguration ManagementCritical Milestoneelement - CuriumCommandCommand GeneratorCommon Minor MaterialCoordinate Measuring MachineConfiguration Management PlanCommanding Grnd. S/W SubsystemComputer Numerical ControlledComposite Neck Tubeconfiguration Registerelement - CobaltCosmic Background ExplorerCommanding Grnd. S/W SubsystemComputer Output MicroficheCommercial-Off-The-ShelfCost Plus Award FeeCost Performance IndexCentral processing unitelement - ChromiumCryogenicselement - CesiumComputer Software ComponentDAC as inSRE DACDACDACDASDAS as inSRE DASDASDASdBDbdBidBicdBmDBDBRDBRODBSDBSDCDCAADCDDigital to Analog ConverterData Aquisition and ControlDigital to Analog ConverterDirectory of Approved SuppliersDigital to Analog SignalData Analysis SubsystemData Aquisiton SystemDecibelelement - Dubniumdecibel isotropic Unit of power withrespect to isotropic leveldecibel isotropic Unit of power withrespect to isotropic leveldecibel miliwatt unit of power withrespect to one miliwattDatabasData Base Readout Grnd. S/WSubsystemDatabae ReadoutData Base Grnd. S/W SubsystemDatabase Grnd. S/W SubsystemDirect CurrentDefense Contract Audit AgencyDepth of discharge<strong>Gravity</strong> <strong>Probe</strong> B — <strong>Post</strong> <strong>Flight</strong> Analysis • Final <strong>Report</strong> March 2007 573
AcronymDefinitionAcronymDefinitionDCMADCMCDec.deg.DELDel.DEMUXDESDFDDIDDIFFDIGDig.DIPDIPDIPDMDMDMDMADMADMPDMRDMSDOCDefense Contractor ManagementAgencyDefense Contractor ManagementCommandDeclinationDegreeDeorbit, Entry, and LandingDeliverDemultiplexerData Encryption StandardData Flow DiagramData Item DescriptionDifferentialDigital Image GenerationDigitalDesignated Inspection PointDisplay Input ProcessorDual Inline PackageData ManagementDisassembly ManualDocking MechanismDetector Mount AssemblyDirect Memory AccessData Management ProcessingDetailed Mission RequirementData Management SystemDocumentDRDDRIDSMDSMCDSNDSPDTADTODTODyE&POECDECEFECIECIFECOECPECUEDACEDDEDPEDREEE2EEEEData Requirement DescriptionData Resources Inc.Data Systems ManagerDirect Simulation Monte CarloDeep Space NetworkDigital Signal ProcessorData Analysis grnd. S/W SubsystemDetailed Test ObjectivesDetailed Test Objectiveselement - DysprosiumEducation and Public OutreachExpected Completion DateEarth Center Earth FixedEarth Center InertialEarth Center Inertial FixedEngineering Change OrderEngineering Change ProposalExperiment Control UnitError detection and correctionEngineering Development DewarEvent Data Processing Grnd. S/WSubsystemEingineering Data Reduction softwareElectrical EngineerEnd to EndElectrical, Electronic andElectromechanical PartsDODDODDOFDOTDPDPADPADPMDPRODRDRDRDRDRAMDepartment of DefenseDepth of dischargeDegrees of FreedomDepartment of TransportationData ProcessingDetector Package AssemblyDestructive Physical AnalysisDeputy Program ManagerDefense Plant Representative OfficeDiscrepancy <strong>Report</strong>Data RequirementData Resources Inc.Discrepancy <strong>Report</strong>Dynamic Random Access MemoryEEPROMEFDE<strong>GP</strong>EGSEGSEEH&SEIRPEIRRELECELEXELVEMElectrically Erasable ProgrammableRead out Only MemoryEngineering <strong>Flight</strong> DewarEphemeris & <strong>GP</strong>S Processing S/WSubsystemEngineering ground stationElectronic Ground Support EquipmentEnvironmental Health & SafetyEffective Isotropic Radiated PowerExternal Independent Readiness ReviewElectricalElectronicsExpendable Launch VehicleEngineering Memo574 March 2007 Appendix F — Acronyms & Abbreviations
AcronymDefinitionAcronymDefinitionEMElectrical ModuleFCIFinal Configuration ItemEMCElectromagnetic CompatibilityFCIFunctional Configuration UnitEMIElectromagnetic InterferenceFCLForward Communication Link BoardEMUElectromagnetic unitFCSRFlexible eliptical solar reflectorESDElectrostatic DischargeFD<strong>Flight</strong> DirectorEOLEnd of LifeFDF<strong>Flight</strong> Dynamics FacilityEOLEnd Of LineFDF<strong>Flight</strong> Data FileEOSEarth Observing SystemFeelement - IronEOSEarth Observation SatelliteFE<strong>Flight</strong> EquivalentEOSElectrical OverstreeFEEForward Equipment EnclosureEOSEmergency Oxygen Supply/SystemFEPFront End ProcessorEPElectrical PowerFEPFront end processorE&POEducation and Public OutreachFEPFront end processor hardwareEPPEPS Support Processing S/W SubsystemFEPIFront End processor Interfacee SoftwareEPSElectrical Power SubsystemFETField Effect TransistorErelement - ErbiumFEU<strong>Flight</strong> Equivalent UnitERRExternal Independent Readiness ReviewFFTFast Fourier TransformEselement - EinsteiniumFHFlex HoseESDElectrostatic DischargeFIGFigureESDEstimating System DescriptionFISTFirst Integrated System TestESDElectrostatic DischargeFISTOPFirst Integrated System Test OperationESTEastern Standard TimeFLLFlux Locked LoopESTEstimateFLT<strong>Flight</strong>ETEEnd-to-EndFMFrequency modulationEUEngineering Unit FunctionFmelement - FermiumEuelement - EuropiumFMFailure ModeEUEngineering UnitFMFrequency ModulationEWRFFFAFAFAFAFABFBDFBPFCFCCMFCIEastern and Western RangeDegrees Fahrenheitelement - FluorineFailure AnalysisFinal AssemblyAssymptoic Spend SpeedFully AutomatedForward Aft BusFunctional Block DiagramForward Backplane<strong>Flight</strong> ComputerFacilities capital cost of moneyFinal Configuration Item,FMECAFMRFMRFMXFnFOFOFOFORFOSRFPFPDLRAFailure modes, effects, and criticalityanalysisFacility modification requestForward Mode RegisterFrame Extractor Grnd. S/W SubsystemFunctionFailed OperationFiber OpticsForeign Object<strong>Flight</strong> Operations ReviewFlexible optical solar reflector<strong>Flight</strong> Prototype FormForward Pricing Direct Labor RateAgreement<strong>Gravity</strong> <strong>Probe</strong> B — <strong>Post</strong> <strong>Flight</strong> Analysis • Final <strong>Report</strong> March 2007 575
AcronymDefinitionAcronymDefinitionFPGAField Programable Gate ArraysGHzGigahertzFPRAForward Pricing Rate AgreementGIGuide Star InvalidFQHFQTFrFRFRIFRMFRRFSSFSFS&SFSUFSWFTFTPFTFTftpFUFUTFWDGgGGGaGaAsgal.GBGBSGCMGCRGDSGeGenGFEGFIGhe<strong>Flight</strong> Qualification HardwareFormal Qualification Testelement - FranciumFailure RateFridayForward Regulation Module<strong>Flight</strong> Readiness Review<strong>Flight</strong> Spin SpeedFail Safe<strong>Flight</strong> Systems and ServicingForward Suspension Unit<strong>Flight</strong> Software<strong>Flight</strong>File Transfer ProtocolFull TimeFull-Time Equivalentfile transfer protocol<strong>Flight</strong> UnitFixed Umbilical Tower atSLC-2WForwardGaussGramsgravity constantguideelement - GalliumGallium ArsenideGallonsGigabyte<strong>GP</strong>BPP Boot Strap Software S/WSubsystemGround Control Message at GSFCGSE Control RoomGround Data Systemelement - GermaniumGenerationGovernment Furnished EquipmentGovernment furnished InformationGaseous HeliumGIDEPGMGMAGMOCGMTGNGnd.GndRTGOPGOWG<strong>GP</strong>-B<strong>GP</strong>BPP<strong>GP</strong>S<strong>GP</strong>S<strong>GP</strong>S-ppGREASGRGTGrmsGRTGSGSEGSEGSFCGSIGSSGSTDNGSUGSVGSWGSWGSWGTGTGTUGTUGovernment Industry Data ExchangeProgramGas ModuleGas Management Assembly<strong>GP</strong>-B Mission Operations CenterGreenwich Mean Time same as UTCGround network controlled by WFFGroundGround Real TimeGround Operations PlanGround Operation Working Group<strong>Gravity</strong> <strong>Probe</strong> B<strong>GP</strong>B Payload ProcessorGallons Per SecondGlobal Positioning System<strong>GP</strong>B Payload ProcessorGeneric resource, Event, & ActivityScheduler sw for mission planning, partof STKGuam Remote Ground station SN facilityRoot Mean Square Acceleration g'sGermanium Resistance ThermocoupleGuide StarGround Support EquipmentGround Servicing EquipmentGoddard Space <strong>Flight</strong> CenterGovernment Source InspectionGyro Suspension SystemGoddard Space <strong>Flight</strong> Tracking and DataNetworkGyro Suspension UnitGuide Star ValidGSU / PMSU Support SoftwareGround SoftwareGSS Support Software S/W SubsystemGround TestGuard TankGround Test UnitGround Test Unit576 March 2007 Appendix F — Acronyms & Abbreviations
AcronymDefinitionGTU-2 Ground Test Unit #2GUIGraphical User InterfaceGVGuidestar ValidGVGlobal VariablesGyro GyroscopeHelement - HydrogenHAHazard AnalysisHBK HandbookHBK Hartebeesthoek, South Africa - CSNESGround StationHDOS Hughes Danbury Optical Systems, Inc.HDWE HardwareHeHeliumHeelement - HeliumHEPL Hansen Experimental Physics Labs at<strong>Stanford</strong>HEX Heat Exchanger, HexadecimalHEX Heat ExchangerHEX HexadecimalHfelement - HafniumHgelement - MercuryHHS US Department of Health and HumanServicesHIVOS High-Vacuum Orbital SimulatorHLD High Level DiscreteHLD HoldHoelement - HolmiumHOL Higher-Order LanguageHPF Hazardous Processing FacilityHQHeadquartersHRHuman ResourcesHr.HoursHselement - HassiumHSHeat ShieldHSHigh SpeedHSHorizon SensorHSC Honeywell Space XComputerHSIF Hardware/Software Integration facilityHSS High Speed SerialHST Hubble space Telescopehtr.HeaterAcronymHVAHWHzIII/FI/OIACIARIAWICDICNICWGIDIDAIDCIDDIDRIEIERSIFIIRVILRSInInd.Ind.Ind.IOCIOCIONetIPDUIPTIrIRIR&DIRASIRDIRRIRSDefinitionHigh Voltage Amp/BridgeHardwareHertzElectric currentelement - IodineInterfaceInput / OutputInventory account codeIndependent Annual ReviewIn Accordance withInterface Control DocumentInterfacility Communications NetInterface Control Working GroupIdentificationImage Divider AssemblyInter-Departmental CommunicationInterface Design DocumentInternal Design ReviewIndustrial EngineerInternational Earth Rotation ServiceInterfaceImproved Inter-Range VectorInternational Laser Ranging Serviceelement - IndiumIndicatorInductanceIndustrialInitial Operations CapabilityIndirect Operating CostsNASA's IP Operational NetworkInternet Protocol Data UnitIntegrated Product Teamelement - IridiuminfraredIndependent Research andDevelopmentInfrared Astronomy SatelliteInterface Requirements DocumentIndependent Readiness ReviewInterface Requirements Specification<strong>Gravity</strong> <strong>Probe</strong> B — <strong>Post</strong> <strong>Flight</strong> Analysis • Final <strong>Report</strong> March 2007 577
AcronymDefinitionIRUInertial Reference UnitISAInstruction Set ArchitectureI/OInput/OutputIonet Ionet IP Operational NetworkITIntegrated TestI & T Integration and TestingITFIntegrated Test FacilityITUInternational TelecommunicationsUnionIUInterface UnitIV&V Independent Verification & ValidationIWG Interface Working GroupJJoulesJACAC Joint Audit Administration CommitteeJFET Junction Field Effect TransistorJPAJob Package AuthorizationJPLJet Propulsion Laboratoryk Notation for 1000KKelvin temperature scale, notation for1024 = 210Kelement - PotassiumKKelvin temperature scaleKKelvink Notation for 1000kbit kilobitsKbits 1024 bitskgKilogramkg-m Kilogram*Meterkhps Kilobits per SecondkHz KilohertzKOLH Potassium HydroxideKrelement - KryptonLLaunchLLeftLLengthLLevelLLiterLLowLLumenLaelement - LanthanumLabLaboratoryAcronymLADLANLASPLBlbs.LDLDBLEAPLEOLEULHeLHSDLiLLDLMLMLMMSLMTOLOCCLRLrLRLSBLTDLTDLuLVLVALWRμMMAMBM&PMGSM/SM/SMADefinitionActivate/Deactivate Grnd. S/WSubsystemLocal Area NetworkLaboratory for Atmosphere and SpacePhysicsPoundsPoundsLeak DetectorLoad Builders Grnd. S/W SubsystemLockheed Environment for AutomaticProgrammingLow Earth OrbitLab Engineering UnitLiquid heliumLiquid Helium Supply Dewarselement - LithiumLow Level DiscreteLockheed MartinLockheed MartinLockheed Martin Missiles & SpaceLockheed Martin Technical OperationsLaunch Operations Control CenterLaser Reflectometerelement - LawrenciumLaser ReflectometerLaunch Services BuildingLift To DragLimitedelement - LutetiumLaunch VehicleLow Voltage AmplifierLong Wave RadiationMicroMeterMultiple AccessMega ByteMaterials and processesMcmurdo Anartica Ground StationMainstageMeters per SecondMultiple Access on TDRSS578 March 2007 Appendix F — Acronyms & Abbreviations
AcronymDefinitionAcronymDefinitionMABEMAFMARmarsmasMBMbpsMbpsMBRSMCBMdMDAMEMECOMEDAMELVMETMeVmfgr.MFRmgMgmgMgmt.Mgr.MGSEMHFMHzMILMIL-HDBKMIL-STDmin.MIPSMISMIWGmKMkMLIMultiple Access BeamformingEquipmentMultiple Access ForwardMultiple Access ReturnmilliarcsecondsmilliarcsecondsMegabyteMega-Bits per secondMega-Bits Per SecondIntegrated Product TeamMake or Buyelement - MendeleviumMcDonnell Douglas AerospaceMechanical EngineerMain engine cut-offMcIntyre Electronics Design Associates,Inc.Medium Expendable Launch VehicleMission Elapsed TimeMega Electron-VoltsmanufacturingManufactureMilligramselement - MagnesiumMilligramsManagementManagerMechanical Ground Support EquipmentMedium High FrequencyMegahertzMilitary, as in military standardMilitary HandbookMilitary StandardminuteMillions of Instructions per SecondManagement Information System, usedto track cost & scheduleMission Integration Working GroupMillikelvinMarkMulti-Layer InsulationmmMMAMMDMMDMMFDMnmNmMoMOMO&DAmo.MOBMOBLASMOMOCMOCCMO&DAMOIMONMOPMORMORRMORTMOSESMOSSMPMPBMPHMPSMPTMPTMRBMRDMROMRRMSMSMSMSMillimeterMoving Mechanical AssemblyMean Mission DurationMean Mission DurationMulti-Mission <strong>Flight</strong> Dynamicselement - ManganeseMilli Newton Newton-Meterelement - MolybdenumMission OperationsMission Operations & Data AcquisitionMonthMake or BuyMobile Satellite Ranging StationMission OperationsMission Operation CenterMission Operations Control CenterMission Operations & Data AcquisitionMoment of InertiaMondayMission Operations PlanMission Operations ReviewMission Operations Readiness ReviewMission Operations TeamMission Operations, SystemsEngineering, and SoftwareMission Operations Support SoftwareMission PlanningMaterial Review Boardmiles per hourMission Planning SoftwareMission Planning Terminal at GSFCMultiple Use TransporterMaterial Review BoardMission Requirements DocumentMemorey Readout- A type of datapacket from the spacecraftMission Requirements RequestMargin of SafetyMass SpectrometerMaster SwitchMaterial Science<strong>Gravity</strong> <strong>Probe</strong> B — <strong>Post</strong> <strong>Flight</strong> Analysis • Final <strong>Report</strong> March 2007 579
AcronymDefinitionAcronymDefinitionMSMaterial SpecificationNdelement - NeodymiumMSMilestoneNDINon Destructive InspectionsMSMilitary StandardNeelement - NeonMSMission SpecialistNECNational Electrical CodeMSBMost Significant BitNEINonExplosive InitiatorMSFCMarshall Space <strong>Flight</strong> CenterNEINonExplosive InitiatorMSMMiscellaneous fabricating materialsNFPANational Fire Prevention AssociationMSPMiscellaneous small partsNGDCNational Geographic Data CenterMSPSPMSSMSSMSTMissile System Prelaunch SafetyPackageMagnetic Sensing SystemMission Support SoftwareMission Timeline Grnd. S/W SubsystemNHBNiNiCDNISTNASA Handbookelement - NickelNickel CadmiumNational Institute of Standards &TechnologyMTMain tankNMNASA MilestoneMtelement - MeitneriumnmnanometerMTMain TankNMNASA ManualMTMMass Trim MechanismNMNASA MilestoneMTRMagnetic Tape RecorderNoelement - NobeliumMTRMotorNo.NumberMTSMUAMUFMUFMUXmVmwNN/AN/CNaNARANASANASCOMNAVCENNbNBPNBPHeNCCNCRMagnetic Torquing SystemMaterial Usage ListModel Uncertainty FactorModel Uncertainty FactorMultiplexerMilliVoltmw Milliwatelement - NitrogenNot ApplicableNo Changeelement - SodiumNational Archives and RecordsAdministrationNational Aeronautics and SpaceAdministrationNASA Communications Network SystemNaval Centerelement - NiobiumNormal Boiling PointNormal Boiling Point HeliumNetwork Control Center at GSFCNonConformance <strong>Report</strong>NOAANpNRAONRTNSPARNSSDCNVRNSTSnWOOABOASISOASIS-CCOBEODODOHAONROps.National Oceanic and AtmosphericAdministrationelement - NeptuniumNational Radion Astometric ObservatoryNon-Real-TimeNonStandard Part Approval RequestNational Space Sciences Data CenterNonvolitile ResidueNational Space Transportation SystemNanoWattelement - OxygenOperations Advisory BoardOperations and Science InstrumentSupportOperations & Science InstrumentSupport - Command & ControlOvercome By EventsOrbit DeterminationOuter DiameterOperational Hazards AnalysisOffice of Naval ResearchOperations580 March 2007 Appendix F — Acronyms & Abbreviations
AcronymDefinitionAcronymDefinitionORBOperations Advisory BoardPBOMPriced Bill of MaterialsORIOperational Readiness InspectionsPCPersonal ComputerORTOperational Readiness TestpCPicoCoulombOselement - OsmiumPCAProgram Commitment AgreementOSOperating SystemPCBProgram Control BoardOsc.OscillatorPCBPrinted Circuit BoardOSCFOSHAOSSOSSOTDOTSPP/cm2P/LPaPAPaPaPAPAPAPACOPAFPALPALPAMPLPAPMRPAPRPara.Parall.Parall.PASRPbOperations Support Computing Facilityat GSFCOccupational Safety and HealthAct/AdministrationOperating System SoftwareOperating System Software S/WSubsystemOrbital Tracking DataOff-The-Shelfelement - PhosphorusProtons per Centimeter SquaredPayloadPascalProduct Assuranceelement - ProtactiniumPascalProduct AssurancePortable AntennaPublic AffairsPrincipal Administrative ContractingOfficerPayload Attachment FittingProduct Assessment LaboratoryProduct Assessment LaboratoryProgram Approved Materials andProcess ListProduct Assurance ProgramManagement RepresentativeProduct Assurance ProgramRepresentativeParagraphParallaxParallelProduct Assurance SupplyRepresentativeelement - LeadPCBPCMPCOPDPdPDPDCPDFPDLPDRPDTPDTLPDUPHAPHSLPIPIDPINDPINDPIPPITPITPKPLPLFPSLAPMPMPmPMPMPMPMPMProduct Change/Control BoardPulse Coded ModulationPCO Procurement Contracting OfficerProportional Plus Derivativeelement - PalladiumProportional Plus DerivativeProgram Data CenterProgrammable Data FormatterProgram Design LanguagePreliminary Design ReviewProduct Development TeamProduct Development Team LeaderPower Distribution UnitPreliminary Hazard AnalysisProgram Hardware/Software ListPrincipal InvestigatorProgram Instruction DocumentParticle Impact Noise DetectionPayload Integration PlanProductivity Improvement ProgramProcessor Interface TableProduct Improvement TeamPeakPayloadPayload FairingProject Service Level AgreementProgram ManagementProof Masselement - PromethiumProgram ManagementProgram ManagerProof MassProton MonitorPulse Modulation<strong>Gravity</strong> <strong>Probe</strong> B — <strong>Post</strong> <strong>Flight</strong> Analysis • Final <strong>Report</strong> March 2007 581
AcronymPMPMAPMCPMEPMETPMSPMSUPNPoPOPOCPOCCPODPODSPOIPPIPPLPPMPPSPRPRPrPRPRDPreproc.Preps.PROMPRRPRTPSCPSCNPSIPSIDpsigPSPPSLAPtPTDefinitionPump ModulePreliminary Mission AnalysisProgram Management CouncilProof Mass ElectronicsPayload Mission Elapsed TimePerformance Management SystemProof Mass Suspension UnitPart Numberelement - PoloniumPurchase OrderPoint Of ContactProgram Operations Control Center atGSFCNot an acronym, its a cluster ofcomputersPassive Orbital Disconnect StrutsProduct of inertiaProducer price indexPreferred parts listParts Per MillionPulse Per SecondPlanning for RadiationPurchase requestelement - PraseodymiumPlanning for RadiationPayload Requirements DocumentationPreprocessingPreparationsProgrammable read-only memoryPreliminary Requirements ReviewPlatinum Resistance ThermometerPayload Software and ComputingPreliminary Specification Change NoticePounds per Square InchPounds per square inch differentialPounds per square inch gaugePayload Support Processing S/WSubsystemProject Sevice Level Agreementelement - PlatinumPacific TimeAcronymPTPTPTPTSPuPV WAVEPWAPWBPWHQAQBQBAQBSQEQPSKQUIKSCATRRRRRRRRRR&MR&RR&RR/OR/OR/TR/TRaRAANDefinitionPart TimePartPointPortable Test Systemelement - PlutoniumProduct which produces graphical datarepresentationsPrinted Wiring AssemblyPrinted Wiring BoardPayload Wire HarnessQuality AssuranceQuartz BlockQuartz Block AssemblyQuartz Block SupportQuality EngineerQuadri Phase shift keyingQuick Scatterometer, a NASA EarthsatelliteRadiusRangeRankineRatioRearReliabilityResistanceRightRollRepair and MaintenanceRemove and ReplaceRendezvous and RecoveryReadoutRolloutReal TimeReceiver/Transmitterelement - RadiumRight Ascension of Ascending Noderads Energy absorbed per unit mass 1 rad =100 ergs/gramRAM Random Access MemoryRAM Responsibility Assignment MatrixRAV Remote Actuating Valve582 March 2007 Appendix F — Acronyms & Abbreviations
AcronymDefinitionAcronymDefinitionRbRBDRCTURCVRRD&DRDBMSelement - RubidiumReliability Block DiagramRemote Command and Telemetry UnitReceiverResearch & Development DivisionRelational Data Base ManagementSystemRTworksRuSSSSReal-Time monitoring, display, logging& cntrl sw by Talarian Corpelement - RutheniumSecondselement - SulfurSecondssimilarityReelement - RheniumSAASouth Atlantic AnomalyREResponsible EngineerS&MASafety & Mission AssuranceRearthRadius of the EarthS/CSpacecraftREEResponsible Equipment EngineerSNSpace Network (TDRSS)Rev.ReviewS/VSpace VehicleRFRadio FrequencyS/WSoftwareRfelement - RutherfordiumSWSISN Web Service Interfacerfradio frequencySASolar arrayRFPRequest For ProposalSACScience Advisory CommitteeRGAResidual Gas AnalyzerSACESunshade Assembly Control ElectronicsRhelement - RhodiumSADMSolar Array Deployment MechanismRIDReview Item DispositionSAESystem Acceptance ReviewRISERLCCRMSRnROMROR/OROSATrpmRRRSERSSRTRTRTworksRtHzRTIRTOSRTSAReusable Integrated SpacecraftEnvironmentRemote Launch Control CenterRoot Mean Squareelement - RadonRough order of magnitudeRead Only MemoryReadoutRoentgensatelliteRevolutions per minuteReadiness ReviewResponsible Software EngineerRoot Sum Squaredreal timeroom temperatureExpert system and graphical displaysoftwareroot - hertzRT SW Initialization Grnd. S/WSubsystemReal-Time Operating System CSCIReal-Time Structured AnalysisSAFESAFSSAOSARSARMSASNSATSbSCScSCSCSCBSCCSC/PLscc/ssccHe/sSCCSSCITSolar array flight experimentStandard Autonomous File ServerSmithsonian Astrophysical ObservatorySystem Acceptance ReviewSolar Array Release MechanismSolar array switch networkSAT Saturdayelement - AntimonySpacecraft, Sapphire Carrier Telescopeelement - ScandiumSapphire CarrierSpacecraftSoftware Change BoardStress Corrosion ControlSoftware PayloadHelium flow rate in cubic cm per sec atstandard temp & pressureHelium flow rate in cubic cm per sec atstandard temp & pressureStandard Cubic Centimeters Per SecondStandard Change Integration andTracking<strong>Gravity</strong> <strong>Probe</strong> B — <strong>Post</strong> <strong>Flight</strong> Analysis • Final <strong>Report</strong> March 2007 583
AcronymSCMOSCMTSCNSCPASCPMSCRSCSASCSESDSDBSDPSDPFSDRSDRLSDRLSDTSESeSESESEAKRSECSECOSEERSEISFHeSEUSFWSGSgSGSGISGSSHASHSSiSIMSIASICDefinitionSpacecraft Mission OperationsSubcontract Management TeamSpecification Change NoticeSpacecraft Product AssuranceSpacecraft Program ManagementSoftware Change RequestSpacecraft SafetySpacecraft Systems EngineeringSilicon DiodeSmall Disadvantaged BusinessSoftware Development PlanSensor Data Processing Facility at GSFCSoftware Discrepancy <strong>Report</strong>Subcontractor Data Requirements ListSupplier Data requirements ListStructural Dynamic TestSystems Engineeringelement - SeleniumSupport EquipmentSystems EngineeringCompany building solid state recorderScott Eric Anderson Karen RaySecondSustainer Engine Cut OffSystem Evaluation and EstimationResourcesSupport Equipment InstallationSuperfluid HeliumSingle Event UpsetSoftwareScience Gyroscopeelement - SeaborgiumScience GyroscopeSilicon Graphics, Inc.<strong>Stanford</strong> Science Ground Stationsubsystem hazard analysisScheduler S/W Subsystemelement - SiliconSimulationScience Instrument Assemblyspecialized item controlAcronym DefinitionSIN<strong>GP</strong>BPP Initialization S/W SubsystemSINDA Systems Improve NumericalDifferencing AnalyzerSIO<strong>GP</strong>BPP I/O Processing S/W SubsystemSIRTF Space Infrared Telescope FacilitySLCSpace Launch ComplexSLC-2 Space Launch Complex -2SLRSatellite Laser RangingSLVR System Level Verification ReviewSLVR System Level Validation ReviewSMScience MissionSmelement - SamariumSMScience MissionSMD Science Mission DewarSMDN Suspect Material Deficiency NoticeSME Solar Mesosphere ExplorerSMON Suspect Material Deficiency NoticeSMP Software Management PlanSMP Safe Mode Processing S/W SubsystemSMP Software Management PlanSMS Structures and Mechanisms SubsystemSnelement - TinSNScience NetworkSNSerial NumberSNOE Student Nitric Oxide ExplorerSOC Space Operations Center or ScienceOperations CntrSOPDT Spacecraft Operations ProductDevelopment TeamSOW Statement of WorkSPARC SUN computer model typeSPARCS Solar Pointing Attitude Rocket ControlSystemSPC Statistical Process ControlSPC Stored Program CommandsSPG SV Parameter Generation Grnd. S/WSubsystemSPRINT Telephone CompanySPRU Standard Power Regulator UnitSQA Software Quality AssuranceSQE Software Quality Engineer584 March 2007 Appendix F — Acronyms & Abbreviations
AcronymSQSSQUIDSrSRAMSRBSRBSRESRISRRSRSSSSSS/SSSASSBSSBSSDSSESSESSHASSMSSPSSRSSWSSWSTSTSTSTSTSTAsta.STANSTARSTDSTDSTDANDefinitionSQUID Support Processing S/WSubsystemSQUID Superconducting QuantumInterference Deviceelement - StrontiumStatic Random Access MemorySoftware Review BoardSolid Rocket BoosterSQUID Readout Electronics<strong>Stanford</strong> Research InstituteSoftware Requirements ReviewSoftware Requirements SpecificationStar SensorSun ShadeSubsystemS-band Single AccessSource Selection BoardStation Status BlockSpace System DivisionSoftware Support EnvironmentSpace Support EquipmentSubsystem hazard analysisSupport systems moduleSystem Safety PlanSolid State RecorderSQUID/Science Telescope SoftwareSQUID/ST Support Software S/WSubsystemScience TelescopeSpace TelescopeSpace TransportStationSun Sensor/TrackerStation - z axis location on <strong>Probe</strong>station<strong>Stanford</strong> UniversityScientific and Technical <strong>Report</strong>Standard, as in military standardSoftware Test DescriptionSpaceflight Tracking and DataAcquisition NetworkAcronymSTDNSTESTEPSTKSTOLDefinitionSpaceflight Tracking and Data NetworkSpecial test equipmentSatellite Test of the EquivalencePrincipleSatellite Tool KitSystem Test and Operations LanguageSTP Standard Temperature and pressure 293K and 1 atmSTPSoftware Test PlanSTP Standard Temperature and pressure -293 K and 1 atmSTSSpace Transportation SystemSTSSpace Transportation SystemSTSST Support Processing S/W SubsystemSTU Shuttle Test UnitSU<strong>Stanford</strong> UniversitySUN <strong>Stanford</strong> Unix NetworkSUN <strong>Stanford</strong> Unix NetworkSUN SundaySUS Start-Up SoftwareSUS Start Up Software S/W SubsystemS/VSpace vehicleSVSpace vehicle spacecraft and payloadSVsolenoid ValveSVSunnyvaleSWSoftwareSWAD Shop work authorizing documentSWAR Software Acceptance ReviewSWCDR Software Critical Design ReviewSWCI Software Customer InspectionSWPDR Software Preliminary Design ReviewSWRI Southwest Research InstituteSWSI Station Status BlockSWSTR Software System Test ReviewSYBASE Relational Data Base ManagementSoftwareTTemperatureTtestTTimeTTopT/Vthermal vacuum<strong>Gravity</strong> <strong>Probe</strong> B — <strong>Post</strong> <strong>Flight</strong> Analysis • Final <strong>Report</strong> March 2007 585
AcronymDefinitionAcronymDefinitionTaelement - TantalumTMLTotal Mass LossTAGTechnical advisory groupTOPEXTopographical ExplorerTAOThermal Acoustic OscillationTOPSTerminal on-line pricing systemTAITARTbTBDInternational Atomic TimeTelemtry Anomaly <strong>Report</strong>element - TerbiumTo Be Determined - <strong>Stanford</strong> willprovide inputTQSMTPMTMATMLTelemetry Quality and StatusMonitoringTechnical performance measureTemperature, moitor and alarmTotal Mass LossTBD-UTo Be Determined by <strong>Stanford</strong>UniversityTPOCCTransportable Payload Operations CntrlCenterTBD PLTBRTBSTo Be Determined - Lockheed Payloadwill provide inputTo be resolvedTo be ScheduledTRETRRTSPTelescope Readout ElectronicsTest Readiness ReviewThermal Support Processing S/WSubsystemTcelement - TechnetiumTSSThermal synthesizer systemTCADTCSTelemetry Checking, Analysis andDisplayThermal Control SubsystemTT&CTT&CTelemetry, Tracking & ControlTelemetry, Tracking &Command/ControlTCSTemperature/Thermal Control SystemTUTelemetry unitTDPTelemetry Data Processing SoftwareTUETuesdayTDRSTracking and Data Relay SatelliteTURFTSTDRSS User RF Test SetTDRSSTracking and Data Relay Satellite SystemTVThermal VacuumTeelement - TelluriumTVACThermal VacuumTELTelemetry Grnd. S/W SubsystemUelement - UraniumTELTelescopeU.S.United StatesTEMTechnical exchange meetingUAZUniversity of ArizonaTemp.TemperatureUNUnited NationsTETTFBThTHUTiTIMTIVTlTmTMTMTMTM+ATelemetry Extraction Tools Grnd. S/WSubsystemTelemetry Format Builder Grnd. S/WSubsystemelement - ThoriumThursdayelement - TitaniumTechnical interchange meetingThruster Isolation Valveelement - Thalliumelement - ThuliumTelemetryTemperature MonitorTime ManagementTemperature Monitor and AlarmUISUPSUPSUSUSAFUTUTUVVVVVVV&VUmbilical Interface SystemUninterruptible Power Supply/SystemUnited Parcel ServiceUnited StatesUnited States Air ForceUniversal timeUniversity of TexasUltravioletElectric Voltelement - VanadiumValveVelocityVoltsVerification & Validation586 March 2007 Appendix F — Acronyms & Abbreviations
AcronymDefinitionVac. VacuumVAFB Vandenberg Air Force BaseVCM Volatile Condensable MaterialVCO Voltage-Controlled OscillatorVCM Volatile Condensable MaterialVCS Vapor Cooled ShieldsVDD Version Description DocumentVESVehicle and Environment Simulatorverif. VerifiedVESVehicle and Environment SimulatorVIM Vehicle Information MemoVLBI Very Long Baseline InterferometryVMVacuum ModuleVRCM Verificate Request Compliance MatrixVRIC Vendor Request for Information orChangeVRSD Verification Rqmt and Spec DocumentWElectric WattWelement - Wolframw/ withWBS Work Breakdown StructureWDISC WSC Data Interface Service CapabilityWED WednesdayWFF Wallops <strong>Flight</strong> FacilityWGS Wallops Ground Station (Wallops island)WIP Work in ProgressWSWork StationWSC White Sands Complex (TDRSS)WSG Wallops Scheduling Group (GN)WSGT White Sands Ground Terminalw/o withoutWOTIS Wallops Orbital Tracking InformationSystemWRWestern RangeWRR Western Range RequirementWSGS White Sands Ground StationWTR Western Test RangeWWW World Wide WebXeelement - XenonXPT Real-Time Expert System Grnd. S/WSubsystemAcronymXTLYYbyrYRSZnZOEZrDefinition<strong>Flight</strong> SW Extraction Tools Grnd. S/WSubsystemelement - Yttriumelement - Ytterbiumyearyearselement - ZincZone of Exclusionelement - Zirconium<strong>Gravity</strong> <strong>Probe</strong> B — <strong>Post</strong> <strong>Flight</strong> Analysis • Final <strong>Report</strong> March 2007 587
588 March 2007 Appendix F — Acronyms & Abbreviations