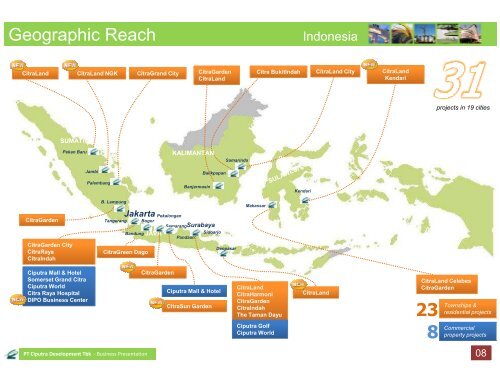
Geographic Reach Indonesia<strong>CitraLand</strong><strong>CitraLand</strong> NGKCitraGrand CityCitraGarden<strong>CitraLand</strong>Citra BukitIndah<strong>CitraLand</strong> City<strong>CitraLand</strong>Kendariprojects in 19 citiesSUMATRAPekan BaruKALIMANTANSamarindaJambiPalembangBanjarmasinBalikpapanKendariCitraGardenCitraGarden CityCitraRayaCitraIndahB. LampungTangerangJakartaBandungCitraGreen DagoPekalonganBogorJAVASemarangSurabayaSidoarjoPandaanDenpasarMakassar<strong>Ciputra</strong> Mall & HotelSomerset Grand Citra<strong>Ciputra</strong> WorldCitra Raya HospitalDIPO Business CenterCitraGarden<strong>Ciputra</strong> Mall & HotelCitraSun Garden<strong>CitraLand</strong>CitraHarmoniCitraGardenCitraIndahThe Taman Dayu<strong>Ciputra</strong> Golf<strong>Ciputra</strong> World<strong>CitraLand</strong><strong>CitraLand</strong> CelebesCitraGarden238Townships &residential projectsCommercialproperty projectsPT <strong>Ciputra</strong> <strong>Development</strong> Tbk - Business Presentation 08
To simplify the presentation of the analysis, we combined the countries of origin into 14 regions oforigin based upon a slightly adjusted version of the United Nations Statistics Division’s compositionof macro geographical regions.3.5 Control variablesBesides the 2008 GDP per capita from the World Bank (2012), all controls variables are obtainedfrom the PISA student and school surveys. The control variables at the student level are gender, age,parental background, whether the student is in (pre-)vocational education as opposed to generaleducation and whether the students is in upper secondary school as opposed to lower secondaryschool. Parental background is measured by an index that describes the student’s economic, social,and cultural status. An internationally comparable version of education levels (lower versus uppersecondary education) is based on the International Standard Classification of Education (ISCED) level.We did not include variables available in PISA regarding student’s studying efforts, because theymight be both intermediary and control variables at the same time. Moreover student’s studyingeffort indicators of 15-years-old students have a weak validity.The control variables at the school level are school composition, a number of school input variables,and a range of other school characteristics. The school average and variation in parental backgroundand the percentage of students in a school who speak a language other than the test language athome measure different school composition aspects. School inputs are the student-teacher ratio,teacher shortages, shortage in instruction material, and whether the school is responsible for thecurriculum and assessment. Other school characteristics are the school type (public, privategovernment-dependent, or private government-independent school), whether school achievement istracked by an education authority; school competition in the area, school location, school size, andthe use of ability grouping.4. Estimation MethodWe use random effect models, which are estimated using maximum likelihood, to take into accounterror terms for countries, schools, and individuals. Equation (1) below shows the model where welook at the relation between tracking (#ofTracks c ) and migrant students’ performance (Test isc ),taking into account school selection policies (vector EntrReq sc , which contains two dummies forschool policies regarding prior performance), for student i in school s in country c. Our main interestlies with the interaction EntrReq sc ∗ #ofTracks c ′ . We control for a vector of individualcharacteristics, including parental background (Student isc β 1 ), a vector of school characteristics(School sc ) and GDP per capita (GDPpc c ). Equation (2) looks at whether the relation betweenparental background (PB isc ) and number of tracks differs when school policies are taken intoaccount. To look at these differential effects our main interest lies with the interaction PB isc ∗#ofTracks c ′ . Separate error terms for countries (u c and v c ), schools (u sc and v sc ), and individuals(ε isc and ε isc ) are necessary, since students are nested within schools within countries. If we wouldignore the nested data structure, we would implicitly assume that all observations are independentfrom each other. This would lead to a downwards bias of the standard errors. More attention to aTRACKING, SCHOOLS’ ENTRANCE REQUIREMENTS AND THE EDUCATIONAL PERFORMANCE OF MIGRANT STUDENTS 11