Introduction Optional Reading Workshop Content - Bivio
Introduction Optional Reading Workshop Content - Bivio
Introduction Optional Reading Workshop Content - Bivio

Create successful ePaper yourself
Turn your PDF publications into a flip-book with our unique Google optimized e-Paper software.
that is steady or slightly increasing. Typically we will want to see the same behavior forgross Margin and Operating Margin.1. The attached SSG shows that Pre-tax Profits have been increasing faster than Sales forthe past 5 years. (The Pre-tax Profit line is rising faster than the Sales line on the SSGSection 1 graph and the values in Section 2A for the past 5 years are increasing.) The tophalf of the Morningstar Profitability table provides insight into how management is doingthis.2. Starting at the top of the Morningstar table we see that since year 2000 the Cost OfGoods Sold (GOGS) has been decreasing slightly. This produces a slight increase inGross Margin.3. SG&A expense has been decreasing significantly and is the primary reason for thenoticeable increase in Operating Margin.4. Net Interest Income is small and produces a minor upward shift in Earnings BeforeTaxes (EBT) margins. The values in the table match those in SSG Section 2A.5. Tax Rate has decreased a little. All of these result in an impressive increase in the NetProfit margin; with SG&A reduction being the dominant contributor.For future reference, the following is an example of a cause for concern.Start with the assumption that management anticipates that gross margin will bedecreasing.Also assume that management can delay SG&A and R&D spending for awhile.A red flag would be a recent reduction in Gross Margin that is offset by reducedSG&A and/or R&D expenses so that EBT Margin was not reduced.The bottom portion of the table uses the Dupont equation, shown below, to start with NetProfit Margin and arrive at Return on Equity.Return on Equity = (Net Profit / Sales) X (Sales / Assets) X (Assets / Equity)Return on Equity = Net Profit Margin X Asset Turnover X Financial LeverageAs previously noted the Net Profit Margin has been increasing. Yet the table and SSGSection 2B show ROE is about constant or slightly decreasing. The Dupont equationshows why.Note that:1. Asset Turnover has been steadily decreasing.2. This has offset the increase in Net Profit Margin so that Return on Assets (NetProfit/Assets) is about constant.
3. Financial Leverage has varied somewhat, but has not been a significant contributor.For now, just note that Asset Turnover for BBBY has been decreasing. We will get backto this in Session 4.In some cases decreasing Asset Turnover may be a warning signal. For example, itcould indicate that a company is paying too much for acquisitions or obtaining subparreturns on Capital Expenditures.Next, it will be informative to look at data available on the Reuters site. Open anotherinstance of your browser and log onto: www.reuters.comEnter BBBY in the Quotes box and when the page opens click on Ratios. Scroll down tothe summary table of Profitability Ratios. Profit Margin information is presented incomparison to its Industry, Sector, and the S&P 500.Scroll back up and click on Financial Statements. This will produce a display of fivequarters of Income data. Click on Annual to display five years of data. Scroll down andnote the amount of detail.Return to the Morningstar window and click on Financial Statements. This displays tenyears of data, but with less detail than Reuters. I tend to look at the Morningstar data firstto see the longer term trends; then switch to Reuters for additional detail.Tomorrow we will look at the very important measures of Turnover (Efficiency).
PTP growth greater than Sales growth for the past 5 years.EPS growth greater than Sales growth; very slightly less than PTP growth.ROE decreasing somewhat.No Long Term Debt
either or both can be an early warning signal. Pay particular attention to the TTMvalues relative to the past year or two.Next consider the Payables Period. Conventional wisdom is that higher values aredesirable for increasing cash flow. This is fine if the creditors agree to a slow pay policy.An important exception to this occurs when a company becomes short of cashbecause receivables and/or inventory are increasing. Then an increasing PayablesPeriod reinforces the warning signal given by increasing receivables and inventory.Look at the data for BBBY. Things look pretty good. There are no receivables. Days ofInventory has been relatively steady. Over time management has been taking longer topay bills. This is probably not a problem. Just make a mental note to check on this whenwe look at the Balance Sheet and Liquidity tomorrow.Look at the bottom of the table. It shows Asset Turnover that was discussed yesterday. Italso shows Fixed Asset Turnover; which has been more constant than Asset Turnover.Just make a mental note to look at this tomorrow.Finally, I want to reiterate that using the data in this table to track Inventory Turnover,Receivables Turnover and Payables Period can provide very useful warning signals.Also, it will be shown in Session 5 that these ratios are very important supplements to theCash Flow tables provided by both Morningstar and Reuters.Tomorrow we will look at Liquidity and Leverage.
RAW 2005 TurnoverRatio Analysis I-Club-List <strong>Workshop</strong>, Part 10Date: Thur. Feb. 12, 1998Leader: Jay BerrySubject: Turnover RatiosThis is the tenth part of the Ratio Analysis <strong>Workshop</strong>. It contains adiscussion of the Turnover Ratios:Examples of RatiosPrice/Value RatiosLiquidity RatiosLeverage RatiosTurnover (or Activity) RatiosReceivables TurnoverInventory TurnoverAssets TurnoverProfitability RatiosTURNOVER (OR ACTIVITY) RATIOSTurnover Ratios are indicators of how well company management is usingavailable assets to generate sales and cash. It is desirable for theseratios to have high values.RECEIVABLES TURNOVER RATIOThe Receivables Turnover Ratio is defined as:SalesReceivables Turnover = -----------ReceivablesThis ratio is an indicator of how much time elapses before payment isreceived for a credit sale. In general it is considered desirable for acompany to have a high Receivables Turnover Ratio. However, the time ittakes to collect receivables varies greatly for different industries.RECEIVABLES TURNOVER RATIO EXAMPLESAssume that a company has annual sales of 400 million and receivablesof 100 million.Sales 400Receivables Turnover = ----------- = --- = 4.0Receivables 100This indicates that receivables are 1/4 of annual sales. Hence it takesabout 3 months for customers to pay for their credit purchases.Another company with the same sales but with receivables of 50 millionwould have a Turnover Ratio of 8. Its customers would be paying fortheir credit purchases in about 1.5 months.ANOTHER WAY OF LOOKING AT THE RATIOIt is very common for services that provide ratio data to expressReceivables Turnover in terms of the number of days of sales itrepresents. The calculation is:360 daysAverage Receivables Collection Period = -------------------------Receivables Turnover RatioAND ANOTHER WAY OF LOOKING AT THE RATIOPage 1
RAW 2005 TurnoverA very useful variation of Receivables Turnover is to compare thepercentage change in receivables and the percentage change in sales. Ifthe percentage changes are the same then the Receivables turnover isremaining constant. This is just another way of saying that as acompany grows and increases its sales, then receivables will tend toincrease by the same percentage. However, if the percentage change inreceivables is significantly higher than the percentage change in salesthen there is a high probability that some of those increasedreceivables will never be collected. This can lead to an "unexpectednegative earnings surprise" when the allowance for doubtful accounts isincreased several quarters into the future. The following discussion ofthe Inventory Turnover Ratio covers this in more detail.MY OPINIONIt is advisable to track the Receivables Turnover Ratio of a company ona quarterly basis. A significant decrease in the value of this ratio(customers are taking longer to pay) is an early warning that problemsare developing. In practice I use the percentage change methoddescribed in the preceding paragraph. For me, this has proved to be oneof two very reliable early warning indicators. The second one is - lookdown about two inches.PEER REVIEWThe Market Guide Ratio Comparison report dated 01/16/98 shows thatPepsiCo has a Receivables Turnover Ratio of 14.32 and Coca-Cola has aReceivables Turnover Ratio of 10.74 compared to an industry average of11.62.____________________________________________________________________INVENTORY TURNOVER RATIOThe Inventory Turnover Ratio is defined as:Cost of Goods SoldInventory Turnover Ratio = ------------------InventoryCost of Goods Sold is the total cost of producing the inventory soldduring a year. The value listed for Inventory on the balance Sheetrepresents the cost to produce the inventory that is in stock. TheInventory Turnover Ratio is interpreted in the same manner as theReceivables Turnover Ratio.The preceding comments about tracking percentage changes in receivablesand sales also apply to inventory. A situation where inventory isincreasing much more rapidly than sales is often an early warningsignal. There may be problems on the production line. There may havebeen a decrease in demand for the product. In any case the value of theinventory may have to be written down leading to another "unexpectednegative earnings surprise".DOWNLOAD THE FOLLOWING CASE STUDYAn excellent article on the subject is "Regina - Cleaning Up, orGetting Cleaned Out?" by Phil Keating. A reprint is available on theNAIC web site at http://www.better-investing.org/bits/bits4.html. Anexcerpt from the article is shown below.START OF EXCERPTIgnore the Balance Sheet at Your Peril!Page 2
RAW 2005 TurnoverIt was not necessary to have an MBA or a CFA or even a college coursein financial ratio analysis to quickly determine that something wasvery wrong at Regina. You didn't need to calculate any "fancy" ratiossuch as average days receivables or inventory turnover. Simply look atthe box below, which is data entirely taken from the Value Line sheetin the "Current Position" section.Regina Co., Inc. 1987 1988 %Change(in millions)Sales $128.2 $181.1 41.3%Receivables 27.8 51.1 83.8%Inventories 19.6 39.1 99.5%Cash 0.5 0.9 80.0%Note the change in receivables and inventories from 1987 to 1988.Compare this with the change in sales from 1987 to 1988.You will quickly notice that although sales increased 41.3%,inventories and receivables increased over twice as much from year toyear. At the same time you will note that the absolute level of cash isless than $1 million dollars for a company doing $181 million in sales,ie. cash is equal to only two days worth of sales. Obviously Regina wasnot getting paid in cash for shipments that it was booking as sales,and inventory was piling up at an alarming rate! It turned out that K-mart, the largest customer with over 15% of sales, was returning asdefective over 30% of Regina's merchandise. Other merchants were doinglikewise. Even though a look at the cash position box on the Value Linesheet shows the current ratio is a "superb" 4.09 versus 2.61 the yearbefore, and working capital to sales has increased from 21% to 39%, andcash from 2% to 4% of current liabilities, this company is clearlyheading for bankruptcy? It is right there before your eyes in theburgeoning receivables and inventory figures.END OF EXCERPTSTB STOCK ANALYST PROVIDES PERCENTAGE CHANGESThe STB Stock Analyst (SA) program calculates and displays thepercentage changes similar to those shown in the preceding excerpt. Thepercentage changes in Receivables and Inventory are displayed in the"Balance Sheet" window. The percentage change in quarterly sales isdisplayed by selecting "Recent Q figures" while the "SSG Graph" windowis open. Note that SA calculates the percentage change of sales for themost recent quarter compared to the same quarter a year ago. The"Regina" article uses the most recent four quarters of sales comparedto the previous four quarters. (Note: for SA to perform thesecalculations you must enter the quarterly data or use the NAIC S&PDatafiles.)For those who do not care to purchase SA, it is not difficult to createa spreadsheet to perform the calculations for these and other ratios.TURNOVER RATIOS FROM MARKET GUIDE ARE DIFFERENTThis workshop has suggested that both Receivables Turnover andInventory Turnover should be tracked by comparing the most recentquarterly data with the data for the corresponding quarter a year ago.Market Guide does not use this approach. Check their glossary and youwill find that they use the average of five quarters to calculate bothreceivables and inventory. Just be aware that the values reported byMarket Guide have been "smoothed" by taking the average of fivequarters and will not be as useful for "early warning detection" asPage 3
RAW 2005 Turnoverusing quarterly data. Once again, this illustrates the importance ofknowing how ratio values are calculated in order to interpret themproperly.PEER REVIEWThe Market Guide Ratio Comparison report dated 01/16/98 shows thatPepsiCo has an Inventory Turnover Ratio of 17.40 and Coca-Cola has anInventory Turnover Ratio of 5.75 compared to an industry average of9.16.___________________________________________________________________ASSETS TURNOVER RATIOThe Assets Turnover Ratio is defined as:SalesAssets Turnover = ------------Total AssetsAs with the previous two Turnover Ratios it is desirable for a companyto have a high Assets Turnover value compared to other companies in itsindustry.Total Assets does include Receivables and Inventory since they arecomponents of Current Assets. However, for many companies the value ofFixed Assets (i.e., plant, property and equipment) is a significantcomponent of Total Assets. The value of Fixed Assets are not subject tolarge quarter to quarter changes that might show up in the valuationsof Receivables and Inventory when problems are developing. Therefore,this ratio does not provide the reliable early warning signals typicalof the other two turnover ratios. However, over time it does provide ameasure how effectively Total Assets are being used to generate sales.PEER REVIEWThe Market Guide Ratio Comparison report dated 01/16/98 shows thatPepsiCo has an Assets Turnover Ratio of 1.01 and Coca-Cola has anAssets Turnover Ratio of 1.10 compared to an industry average of 1.06.Page 4
Evaluating Management Session 4Welcome back. Today we are going to look at Liquidity and Leverage. Both of these arebased on data contained in the Balance Sheet.LiquidityLiquidity refers to the ability of a company to meet its short-term financial obligations.The intent of these ratios is to indicate if a company will be able to generate enough cashto pay bills that are coming due in the near future.Typical measures of Liquidity are:LiquidityCurrent RatioQuick RatioOften quoted rules of thumb are that the Current Ratio should be 2 or greater and theQuick Ratio should be 1 or greater. Somewhere I read that these values were originallyintended to apply to manufacturing companies. The norm will differ significantly fordifferent industries.LeverageLeverage ratios measure the extent that a company is relying on debt to fund itsoperations. Long-term debt may not have to be paid off for many years. However,interest on the debt is a fixed expense that must be paid every year. High interestpayments increase the risk that a company may not earn enough to pay the interest ifthere is an unexpected reduction in sales and profit during a bad year.Typical measures of Leverage are:LeverageLong Term Debt to Equity (SSG Section 2C)Total Debt to EquityLong Term Debt to CapitalA rule of thumb is that Long Term debt to Equity should be less than 1. Again, the normwill vary significantly for different industries.<strong>Optional</strong> <strong>Reading</strong>Excerpts from the 1998 workshop are attached for those who want to get into the detailsof Liquidity and Leverage.
Using MorningstarMorningstar combines Liquidity and Leverage into a single category called FinancialHealth.Log onto the Morningstar site. Use BBBY for the example company. Select Key Ratiosand click on the Financial Health tab.The top of the data table contains balance sheet data in a common size format based on apercentage of Total Assets. This format is useful for getting some insight into why AssetTurnover has been declining. Based on past experience my first reaction is to look forbig increases in intangibles (goodwill) to explain the decline.In this case there are no intangibles until 2004. Even then they are only 4 to 5 percentof assets. What does catch my eye though is the long term increase in Cash & ShortTerm Investments. A large cash balance increases Liquidity but it doesn’t generatesales. I am willing to accept this as the reason Asset Turnover has been declining.Now scroll down to the bottom of the data table to see ten years of data for the CurrentRatio, Quick Ratio and Debt/Equity. Morningstar chose to provide data for FinancialLeverage instead of Total Debt to Equity and/or Long Term Debt to Capital.The Current Ratio and Quick Ratio seem to be quite adequate. As noted yesterdaymanagement has slowed the payment of bills. That hasn’t had a noticeable impact onthese ratios. Anyone who is really interested can switch to the Reuters site and comparethe industry averages.Debt/Equity is zero. We already knew that from SSG Section 2C.Financial Leverage has been close to 1.5. This is excellent. Financial Leverage cannot beless than 1. It can be 10 or more for highly leveraged businesses such as banks. AnAppendix with more details about the calculation of Financial Leverage is attached to thismessage.Overall, Liquidity and Leverage are very good.Some people may prefer to look at Balance Sheet data in the conventional format withdollar values instead of percentages. In that case just click on Financial Statements andthen click on 10-Yr Balance Sheet.Using Reuters DataAs in the case of the Income Statement, Reuters provides a Balance Sheet that hassomewhat more detail than Morningstar. The added detail wasn’t needed for BBBY. Butkeep this mind for future studies.
Reuters also provides a summary of recent Financial Strength ratios.Open another instance of your browser and log onto: www.reuters.comEnter BBBY in the Quotes box and when the page opens click on Ratios. Scroll down tothe summary table of Financial Strength Ratios. This table provides a quick comparisonof the company, its Industry, Sector and S&P 500.Data for five ratios are provided. They include three of the four ratios covered byMorningstar plus Total Debt to Equity and Interest Coverage.Tomorrow we will conclude the workshop by looking at the Statement of Cash Flows
substitute Total Assets = Total Liabilities + Equity(E)to obtainFL = Total Liabilities/E + E/E = Total Liabilities/E + 1 = 1 + (Total Liabilities/E)Next expand Total Liabilities (look at the Morningstar data table for guidance).Total Liabilities = Current Liabilities + Long Term Debt(D) + Other Long Term Liab.Divide by E and rearrange terrms.Total Liabilities/E = D/E + (Current Liabilities/E + Other Long Term Liab./E)The final substitution produces:FL = (1 + D/E) + Current Liabilities/E + Other Long Term Liab./ETherefore; FL > (1+ D/E)How much greater depends on the two additional terms. They vary for differentcompanies. They may also vary over time for the same company as can be seen bylooking at the data for BUD.
RAW - LeverageRatio Analysis I-Club-List <strong>Workshop</strong>, Part 9Date: Mon. Feb. 9, 1998Leader: Jay BerrySubject: Leverage Ratios*04This is the ninth part of the Ratio Analysis <strong>Workshop</strong>. It contains adiscussion of the Leverage Ratios.Examples of RatiosPrice/Value RatiosLiquidity RatiosLeverage RatiosLong Term Debt to EquityLong Term Debt to Capital RatioTotal Debt to EquityTurnover (or Activity) RatiosProfitability RatiosLEVERAGE RATIOSINTRODUCTIONLeverage ratios measure the extent that a company is relying on debt tofund its operations. Long-term debt may not have to be paid off formany years. However, interest on the debt is a fixed expense that mustbe paid every year. High interest payments increase the risk that acompany may not earn enough to pay the interest if there is an unexpectedreduction in sales and profit during a bad year.BALANCE SHEETData used to calculate Leverage ratios are contained in the BalanceSheet. Low values for the Leverage ratios contribute to a "strong"balance sheet.Typically major components of Total Assets could be:Current AssetsPlant, Property and Equipment (PPE)Intangible AssetsOther AssetsTypically major components of Total Liabilities could be:Current LiabilitiesLong Term DebtOther Liabilities_________________________________________________________________LONG TERM DEBT TO EQUITY RATIOThe Long Term Debt to Equity Ratio is defined as:BACKGROUNDLong Term DebtLong Term Debt to Equity = --------------EquityArticles often state that the Long term Debt to Equity Ratio should beless than one. This may be appropriate for many manufacturingcompanies. However, utility companies tend to have a relatively stableflow of monthly payments from their customers to cover interestpayments on long term debt. So most utilities can have more long termdebt than equity. Conversely, small start-up companies and technologyPage 1
RAW - Leveragecompanies have very unpredictable cash flows and few assets that couldbe used as collateral for long term debt. These types of companies maynot qualify for long term debt or may find that the cost of debt wouldbe too high (because of higher risk to the lender) and will tend tohave low Long Term Debt to Equity Ratios.LONG TERM DEBT TO EQUITY RATIO EXAMPLEAssume that a company has a balance sheet as shown in the followingtable:Data For Long Term Debt to Equity Ratio ExampleCurrent Assets 300Plant, Property and Equipment 1700Other Assets 0TOTAL ASSETS 2000Current Liabilities 150Long Term Debt 925Other Long Term Liabilities 0Equity 925TOTAL LIABILITIES+ Shareholders Equity 2000Long Term Debt 925Long Term Debt to Equity = -------------- = --- = 1.00Equity 925In this example Long Term Debt equals Equity so the Long Term Debt toEquity ratio is 1.0. That's all there is to the calculation.Someone interested in more detail could look at the notes in thecompany financial reports to determine when the debt has to be paid offor rolled over. Value Line indicates how much debt is due in 5 years(in the CAPITAL STRUCTURE box).PEER REVIEWThe Market Guide Ratio Comparison report dated 01/16/98 shows thatPepsiCo has a Long term Debt to Equity Ratio of 0.56 and Coca-Cola hasa Long Term Debt to Equity of 0.13 compared to an industry average of0.47.The November 14, 1997 Value Line CAPITAL STRUCTURE boxes show thatPepsiCo is paying $250.0 mill. in long term interest and has 6.5xinterest coverage. Coca-Cola is paying $62.0 mill. in long terminterest and has 17x interest coverage. Any comments about theinteraction of long term debt and interest coverage?_______________________________________________________________________LONG TERM DEBT TO CAPITAL RATIOThe Long Term Debt to Capital Ratio is defined as:Long Term DebtLong Term Debt to Capital = --------------CapitalCapital is the sum of Long term Debt plus Equity. So:Page 2
RAW - LeverageLong Term DebtLong Term Debt (LTD) to Capital = -----------------------Long Term Debt + EquityThe Long Term Debt to Capital Ratio uses the same two quantities (LongTerm Debt and Equity) as the Long Term Debt to Equity Ratio. Eventhough the values of the ratios will be different, they convey the sametype of information.If, as in the preceding example, the Long Term Debt to Equity Ratio hasa value of 1.0 (Long Term Debt = Equity) then the Long Term Debt toCapital Ratio will have a value of 0.5.LTD 925LTD to Capital = ------------ = ------- = 0.5LTD + Equity 925+925Users of Value Line may find that it is convenient to use the Long TermDebt to Capital Ratio. This is because Value Line usually shows theratio of Long Term Debt to Capital in the CAPITAL STRUCTURE box.PEER REVIEWMarket Guide does not report a value for this ratio.____________________________________________________________________TOTAL DEBT TO EQUITY RATIOThe Total Debt to Total Equity Ratio is defined as:Total DebtTotal Debt to Equity Ratio = ------------EquityTotal Debt is the sum of Long Term Debt plus Debt Due (a component ofCurrent Liabilities).There are situations where a company may roll-over its Debt Due intonew Long Term Debt. There are also cases where a company continuallykeeps borrowing on a short term basis while having little or no LongTerm Debt. In these cases Total Debt may be a better indicator ofLeverage than Long Term Debt.TOTAL DEBT TO EQUITY RATIO EXAMPLE 1The same Balance Sheet that was used for the long Term Debtto Equity Ratio and the Long term Debt to Capital Ratio examples isshown below with the Current Liability entry separated into twocomponents.Current Assets 300Plant, Property and Equipment 1700Other Assets 0TOTAL ASSETS 2000Current LiabilitiesAccounts Payable 100Debt Due 50Long Term Debt 925Other Long Term Liabilities 0Equity 925Page 3
RAW - LeverageTOTAL LIABILITIES+ Shareholders Equity 2000Total Debt to Total Assets = (925 + 50)/925 = 1.054TOTAL DEBT TO TOTAL ASSETS RATIO EXAMPLE 2Some companies use short term bank loans to fund their operationinstead of taking on long term debt. These short term loans appear onthe balance sheet as Debt Due.The Total Debt to Equity Ratio is useful for tracking the leverage ofcompanies that use short term debt instead of long term debt. Its valueis independent of how the Total Debt is distributed between Long TermDebt and Debt Due (current portion of long term debt plus short termbank loans).As an extreme example to illustrate this point let's modify the balancesheet example that was used in the Long Term Debt to Equity Ratiodiscussion. Assume that the 925 Long Term Debt is transformed to shortterm bank loans and added to the Debt Due component of CurrentLiabilities. Then:Current Assets 300Plant, Property and Equipment 1700Other Assets 0TOTAL ASSETS 2000Current LiabilitiesAccounts Payable 100Debt Due 975Long Term Debt 0Other Long Term Liabilities 0Equity 925TOTAL LIABILITIES+ Shareholders Equity 2000Total Debt to Total Assets = 975/925 = 1.054, just as in thepreceding example.Since there is no Long Term Debt the Long Term Debt to Equity Ratioand the Long Term Debt to Capital Ratio will be zero. Of course theLiquidity Ratios (Current Ratio and Quick Ratio) would look terrible.This again illustrates that it is important to look at a set of ratiosand to understand the interactions between them.PEER REVIEWThe Market Guide Ratio Comparison report dated 01/16/98 shows thatPepsiCo has a Total Debt to Equity Ratio of 1.41 and Coca-Cola has aTotal Debt to Equity Ratio of 0.42 compared to an industry average of0.93.Page 4
RAW - Liquidity***********************************************************************Ratio Analysis I-Club-List <strong>Workshop</strong>, Part 7Date: Mon. Feb. 2, 1998Leader: Jay BerrySubject: Liquidity Ratios - the Current RatioThis is the seventh part of the Ratio Analysis <strong>Workshop</strong>. It begins thediscussion of Liquidity Ratios.*03Examples of RatiosPrice/Value RatiosLiquidity RatiosCurrent RatioQuick RatioLeverage RatiosTurnover (or Activity) RatiosProfitability RatiosThe Current ratio is discussed in this session. The Quick Ratio will bediscussed in part 8.LIQUIDITY RATIOSINTRODUCTIONLiquidity ratios are used to measure the ability of a company to meetits short-term financial obligations. Sometimes the term solvency isused instead of liquidity. The intent of these ratios is to indicate ifa company will be able to generate enough cash to pay bills that arecoming due in the near future.Data used to calculate Liquidity ratios are contained in the BalanceSheet. A Balance Sheet contains details about the Total Assets andTotal Liabilities of a company. Analysts sometimes praise a company bysaying that it has a "strong" or "clean balance sheet". The terms"strong" and "clean" are used interchangeably to indicate that theassets are adequate to pay off the liabilities in a timely mannerduring both good and bad business conditions. High values for theliquidity ratios discussed below are an indication of a "strong"balance sheet with respect to meeting near term obligations. TheLeverage ratios, discussed after the Liquidity ratios, also enter intodetermining if a company has a "strong" balance sheet.____________________________________________________________________CURRENT RATIOThe Current Ratio is defined as:Current AssetsCurrent Ratio = -------------------Current LiabilitiesThe Current Ratio is probably the best known of the liquidity ratios.BACKGROUNDSomewhere, many years ago, I read that the current ratio was the firstratio used by bankers to determine if a company was worthy of receivinga loan. At that time it was considered that a company must have acurrent ratio of 2 or more in order to qualify for a loan. I do notknow how or why this threshold was established. However many books andarticles that discuss the current ratio still use 2 as a thresholdvalue. Sometimes there will be a qualifying statement that the value ofPage 1
RAW - Liquidity2 applies to manufacturing companies; but there is no guidance aboutwhat values should be used for other types of companies. Can anyoneelse provide some insight about appropriate values for the CurrentRatio? For now, my suggestion is to compare the current ratio of acompany with the average for its industry.THE BALANCE SHEETCurrent Assets and Current Liabilities are listed in a company'sBalance Sheet. Current Assets are the first sub-total at the top of thelist of assets. Current Liabilities are the first sub-total at the topof the list of liabilities. Knowledge of the components that are summedto calculate current assets and current liabilities will be helpful forinterpreting the significance of the current ratio.Current Assets are those assets that will normally convert to cashwithin one year or the company's normal business cycle, whichever islonger.Current Assets usually consist of four components:Cash and EquivalentsAccounts ReceivableInventoryOtherNote that the four components are listed in order of the relative timeit usually takes to convert them to cash. Cash and Equivalents arealready in the form of cash. Accounts Receivable represent inventorythat has been sold on credit and delivered to customers; it may take 30to 90 days until the customers pay with cash. Inventory still has to besold; then it will take another 30 to 90 days before payment will bereceived. Other is a catchall category for all other assets that willbe converted to cash sometime within a year.Next consider Current Liabilities. These are liabilities that willnormally be settled with cash within one year. The components ofcurrent liabilities are not as standardized as the components ofcurrent assets. However, typical components of current liabilitiescould include:Accounts payableNotes payable to banksCurrent maturity of long term debtCurrent potion of capital lease paymentsAccrued taxesOtherTHE VALUE LINE CURRENT POSITION BOXValue Line shows current assets and current liabilities in a boxlabeled CURRENT POSITION. This box is located a little over half waydown on the left side of a value Line sheet. The box shows three setsof current position data; data for each of the past two years plus thecurrent position at the end of the most recently reported quarter. Notethat value Line uses the same components for current assets that werelisted above. However, Value Line separates current liabilities intojust three components:Accounts payableDebt dueOtherAccounts payable listed by Value Line is the same as the Accountspayable listed above.Debt due listed by Value Line includes items such as Notes payable toPage 2
RAW - Liquiditybanks, Current maturity of long term debt and the Current portion ofcapital lease payments.Other listed by Value Line includes everything else that contributes tocurrent liabilities.The three components of current liabilities used by Value Line areadequate for this workshop and will be used for the examples thatfollow.S&P shows the Current Assets, Current Liabilities and Current Ratio foreach of the past ten years. S&P does not show the components of eitherCurrent Assets or Current Liabilities.CURRENT RATIO EXAMPLE 1This example illustrates the influence of short term debt on thecurrent ratio.Assume that two companies, A and B, have the components of CurrentAssets and Current Liabilities shown below. The two companies areidentical except that Company B has 100 (million) of Debt Due.Data For Current Ratio Examples 1 and 2Company ACompany BCash 100 100Accounts Receivable 100 100Inventory 100 100Other 0 0------------------------------------------------Total Current Assets 300 300Accounts Payable 100 100Debt Due 0 100Other 0 0----------------------------------------------Total Current Liabilities 100 200Current Ratio 3 1.5The degrading influence of having Debt Due is apparent.CURRENT RATIO EXAMPLE 2This example illustrates that long term debt does not influence thecurrent ratio.Looking back to example 1 assume that Company B still has 100 millionof debt, but that it is not due within one year. The debt might not bedue for two years or even twenty years. In any case there is no DebtDue for either company and they both will have a current ratio of 3.Does this represent a failure of the current ratio? Keep in mind thatthe current ratio is intended to measure short-term liquidity. Theeffect of long-term debt is detected by the Leverage Ratios that willbe discussed later in this workshop. This example does illustrate whyit is important to look at a set of ratios and not rely on the value ofjust one ratio.CURRENT RATIO EXAMPLE 3Page 3
RAW - LiquidityThis example illustrates that just looking at the value of the currentratio is not always adequate.Assume that Company A has developed a problem on its production line.The items coming out the end of the production line are defective insome way. Some of the items are being held for re-work before they canbe sold. Some defective items have been sold and the customers areholding back payment until the problem is corrected. AccountsReceivable and Inventories are increasing. Cash is decreasing. Thesituation is illustrated in the following table.Data For Current Ratio Example 3Company ACash 0Accounts Receivable 150Inventory 150Other 0Total Current Assets 300Accounts Payable 100Debt Due 0Other 0Total Current Liabilities 100Current Ratio 3The Current Ratio is still 3, but the ability of Company A to pay itsbills has definitely decreased. Does this represent a failure of theCurrent Ratio? Possibly. In practice the company would probably haveslowed down in paying its Accounts payable and/or borrowed some moneyso Debt Due would no longer be zero. Either approach would tend tolower the Current Ratio. Even so, the Current Ratio is not always agood ratio for detecting problems associated with Accounts Receivableand Inventory. We will return to this example when Turnover Ratios arediscussed.PEER REVIEWThe Market Guide Ratio Comparison report dated 01/16/98 shows thatPepsiCo has a Current Ratio of 0.67 and Coca-Cola has a Current Ratioof 0.91 compared to an industry average of 0.84.Part 8 will cover the Quick Ratio.+++++++++++++++++++++++++++++++++++++++++++++++++++++++++++++++++++++++From: glsimms@juno.comSubject: Re: Ratio Analysis <strong>Workshop</strong>-Part 7To: i-club-list@better-investing.orgDate: Mon, 02 Feb 1998 13:34:55 ESTI think that this comment really should be made after part 8 of theTutorial but since Jay has so nicely listed the components of CurrentAssets and Current Liabilities, I will make it here.As I believe we will see in the next tutorial, the Quick ratio makes anattempt to remove an item (inventory) that is more difficult to convertto cash in an effort to show just how much cash the company can come upwith on short notice.Last weekend I bought a programmed workbook that runs you throughsome basic ratio calculation. It is: The Motley Fool InvestmentPage 4
Workbook.RAW - LiquidityThey discuss a ratio I'd not heard of before called the Flow Ratio orthe Foolish Flow Ratio.It is defined as (Current Assets - Cash) / Current LiabilitiesTheir idea is that the best companies have low receivables andInventories and high payables. The first two are assets and the latteris a liability.It appears to be a measure of management's quality rather thanliquidity.Low receivables and inventory show a company in control of its destiny.These are usually monitored by two other ratios, Days sales outstandingand Days sales in inventory.High Payables shows that the company is in a position to delay paymentsto the companies it buys from.A ratio below 1.25 is considered good and the lower the number thebetter.This seems like the Return on Equity ratio that monitors severalother ratios (net profit margin x asset turnover x leverage).Has anyone had any experience with this ratio?Does it seem valuable?What do you think?Gary++++++++++++++++++++++++++++++++++++++++++++++++++++++++++++++++++++++++++From: Jay Berry Subject: Re: Ratio Analysis <strong>Workshop</strong>-Part 7To: I-CLUB-LIST Date: Tue, 3 Feb 1998 10:07:24 -0500Gary Simms posted:>> Their idea is that the best companies have low receivables andinventories and high payables ...Low receivables and inventory show acompany in control of its destiny.High Payables shows that the company is in a position to delay paymentsto the companies it buys from.A ratio below 1.25 is considered good and the lower the number thebetter.
RAW - LiquidityWhen a company has very low receivables its tight credit policy may becausing it to loose sales by refusing orders from credit worthycustomers.A company with high accounts payable may be giving up discounts fortimely payment.>>These are usually monitored by two other ratios, Days salesoutstanding and Days sales in inventory.
RAW - LiquidityCash 100 100Accounts Receivable 100 100Total For Quick Ratio 200 200Accounts Payable 100 100Debt Due 0 100Other 0 0Total Current Liabilities 100 200Quick Ratio 2 1The existence of Debt Due causes the Quick Ratio of Company B to beless than for Company A; just as it did in the Current Ratio example.Notice though the quandary for someone who rigidly adhered to arequirement that the Current Ratio must be two or greater and the QuickRatio must be one or greater. Company B fails the test for the CurrentRatio, but passes the test for the Quick Ratio.QUICK RATIO EXAMPLE 2The left side of the table below contains data taken from the tableused for Current Ratio example 3. Remember that examples 1 and 3 forthe Current Ratio involved changing how much value was assigned to thecomponents of Current Assets; the total value of Current Assets did notchange. Note Though that the sum of the two components for thenumerator of the Quick Ratio has decreased from 200 to 150. Hence, forthis example, the Quick Ratio is better for detecting the shift of cashinto inventory.Data For Quick Ratio Example 2Company ACompany ACash 0 0Accounts Receivable 150 150Inventory 150Other 0Total Current Assets 300 Total Quick Assets 150Accounts Payable 100 100Debt Due 0 0Other 0 0Total Current Liabilities 100 100Current Ratio 3 Quick Ratio 1.5The preceding examples were constructed to illustrate situations wherethe Quick Ratio may be more sensitive than the Current Ratio fordetecting decreasing liquidity. In practice this may or may not betrue.Note that the Quick Ratio does not address the possibility that some ofthe Accounts Receivable may never be collected. This will be addressedin the discussion of Turnover Ratios.SUMMARYThe primary purposes for presenting the preceding examples were to:(1) illustrate that looking at the components of Current Assets andCurrent Liabilities may be more useful than just looking at thePage 7
RAW - Liquidityvalue of the Current Ratio and the Quick Ratio and(2) introduce some situations where it will be important to look atadditional categories of ratios.PEER REVIEWThe Market Guide Ratio Comparison report dated 01/16/98 shows thatPepsiCo has a Quick Ratio of 0.27 and Coca-Cola has a Quick Ratio of0.54 compared to an industry average of 0.47.********************************************************************Page 8
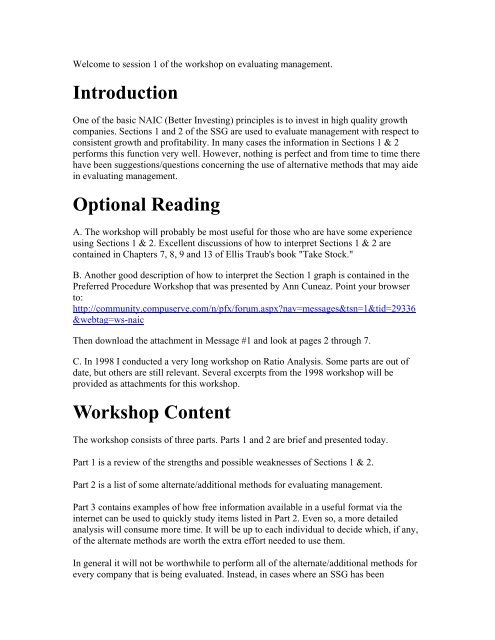
Welcome to Evaluating Management Session 5<strong>Introduction</strong>Today we are going to look at using Cash Flow to evaluate management. There are anumber of definitions for Cash Flow and differences of opinion about how to interpretCash Flow. Getting into these is far beyond the scope of this workshop. Therefore, I amgoing to present an example using the methodology described in detail in a recentworkshop.In October, Diane Graese presented an excellent workshop on using the Statement ofCash Flows (SCF). The SCF workshop used examples of company annual financialstatements with three years of data.The SCF workshop ended with a final exam. For the exam Diane provided a copy of theCONSOLIDATED STATEMENT OF CASH FLOWS and a copy of Section 1 of theSSG for Ballantyne Of Omaha Inc. (BTN) Then she asked:“What conclusions do you draw from each? Is this company worthy of more study andpossibly investment?”Three people responded with answers to the questions. Then Diane provided a copy ofher “ANSWER to Final Exam.”This concluding session of the Evaluating Management <strong>Workshop</strong> describes howCash Flow data provided by Morningstar and Reuters could be used, instead of theCONSOLIDATED STATEMENT OF CASH FLOWS, to answer the Final Examquestions.Review the SCF workshop Final Exam.Three files are attached to this message. They are the two files that were provided for theFinal Exam (forumhandout3.pdf and forumhandout4.pdf) plus the “ANSWER to FinalExam” (forumexamanswer.pdf). I recommend printing these files.Read the “ANSWER to Final Exam” in order to gain an understanding of how data in theCONSOLIDATED STATEMENT OF CASH FLOWS was processed and used. Thisprovides the basis for appreciating the pros and cons for using data provided byMorningstar and Reuters.Using Morningstar Data.The Morningstar and Reuters sites provide more historical data, ten years and five yearsrespectively, but fewer details than company financial statements. Even so, it will beshown that there is enough information to perform most of the analysis methods
described in the SCF workshop. In fact, the format used by Morningstar is very similar tothe format used in the SCF workshop.Cash Flow from OperationsWe will start by concentrating on Cash Flow from Operations (CFO). First, just quicklyobserve the large number of entries in the CONSOLIDATED STATEMENT OF CASHFLOWS. Then look at the second page of the ANSWER and notice how data has beencompressed into a much less cluttered format that draws attention to the “Difference”entry. Morningstar uses a similar format.Point you browser to: www.morningstar.comEnter BTN in the Quotes box (upper left).Scroll down a little until you see Financial Statements on the left. Click on it.Then click the tab for 10-Yr Cash Flows.The table has data for 1996, 1997 and 1998 on the far left. Not exactly the same format asdata on the second page of the ANSWER printout, but close. I do like the format in theANSWER printout. My eye is drawn to the “Difference” entry more than to theequivalent sum of “Deferred Taxes” and “Other” at Morningstar. Even so, the ability toquickly see data for ten years without having to enter data manually appeals to me for aninitial analysis.Read the portion of the ANSWER printout that discusses the large increases in Inventoryand Receivables. It mentiones that ratio analysis could have been used to determine DaysSales and Days Receivables outstanding. This would required additional calculations andwas not deemed necessary for the Final Exam.The situation is somewhat different when using the Morningstar Cash Flow table. Thechanges in Inventory and Receivables are not displayed. However, values for Days Salesand Days Receivables outstanding are provided in the Efficiency Ratios table. Noadditional calculations are needed.To use Morningstar to check if there are increases in Inventory and/or Receivables, clickfirst on Key Ratios and then the Efficiency Ratios tab.Unfortunately there is no data prior to 1997. Even so, the significant increase in DaysSales and Days Inventory from 1997 to 1998 is apparent. This provides the same typewarning signals that are then discussed in more detail in the “ANSWER to Final Exam.”Now return to Financial Statements and 10-Yr Cash Flows.Cash Flow from InvestingThe values for Investing activities closely match those in the printout of theCONSOLIDATED STATEMENTS OF CASH FLOWS. Some small values round out to
zero in the conversion of dollars to millions of dollars. For some reason the acquisition in1997 is placed in “other”. This is one reason to go back to the source document IF yourcursory review indicates something that might be of interest. Many times things getlumped into Other because there are only so many lines on the Morningstar layout. If thenumber in Other is large… there is very likely more detail in the original filings.Even so, it is easy to use the Morningstar table to follow the discussion in the printout ofthe “ANSWER to Final Exam.” Morningstar shows the same increases in Acquisitionsand Capital Expenditures.Cash Flow from FinancingMorningstar shows the stock issuances in 1996 and 1997, stock purchase in 1998 and thechanges in Debt that are mentioned in the “ANSWER to Final Exam.” Some of thechange in Debt was lumped into Other; as in the case of Acquisitions.Using Reuters.Since Reuters provides five years of historical data it can’t be used for the SCF workshopfinal exam. This will not be an issue in more typical cases where we are evaluating themore recent data.Reuters does have some useful features for the typical case of looking at the most recentdata. One of these is the inclusion of quarterly data. Another is that the CFO tablecontains one more category of data that I think is useful. Specifically it separates theMorningstar “Other” category into Non-Cash Items and Changes in Working Capital.Working Capital is defined as Current Assets – Current Liabilities. The change inWorking Capital is often dominated by changes in Inventory and Receivables. So a largenegative value for Changes in Working Capital is a useful warning signal. It would be analert to return to Morningstar and look at the Key Ratios – Efficiency table.ConclusionsEven though Morningstar and Reuters provide fewer details than company financialreports, they are quite adequate for an initial evaluation of Cash Flows. They have theadvantages of providing a longer term perspective and significantly reducing the timeneeded for manual processing of data.FINAL COMMENTSThanks for participating in this workshop. I hope some of the topics will be useful duringyour future evaluations of management.
BALLANTYNE OF OMAHA, INC. AND SUBSIDIARIESCONSOLIDATED STATEMENTS OF CASHFLOWSYEARS ENDED DECEMBER 31, 1998, 1997 AND 19961998 1997 1996Cash flows from operating activities:Net income $ 8,343,734 $ 7,709,339 $ 5,036,693Adjustments to reconcile net income tonet cash provided by operating activities:Depreciation of plant and equipment 1,476,275 783,338 70,040Other amortization 376,948 218,434 137,080Loss on sale of fixed assets 7,297 -- --Deferred income taxes (17,431) (261,265) 14,901Changes in assets and liabilities,net of assets acquired:Accounts receivable (5,243,401) (2,210,958) (3,377,475)Inventories (3,065,576) (4,676,096) (2,594,966)Other current assets 77,776 (2,326) (51,829)Accounts payable (2,561,127) 2,069,566 2,083,256Accrued expenses 104,361 294,212 164,944Income taxes payable 1,254,342 1,352,094 (986,778)Other assets (253,836) (5,420) 5,882------------ ------------ ------------Net cash provided byoperating activities 499,362 5,270,918 901,748------------ ------------ ------------Cash flows from investing activities:Business combinations (3,886,922) (1,150,000) --Capital expenditures (3,594,472) (3,531,913) (1,016,930)Proceeds from sale of equipment 28,500 -- -------------- ------------ ------------Net cash used in investingactivities (7,452,894) (4,681,913) (1,016,930)------------ ------------ ------------Cash flows from financing activities:Proceeds from line of credit 12,229,000 -- --Payments on long-term debt (220,000) (835,744) (7,983,436)Net proceeds from equity offering -- -- 13,650,787Proceeds from employee stock purchase plan 99,561 60,771 58,752Proceeds from exercise of stock options 89,256 1,844,882 227,500Purchase of common stock for treasury (12,351,106) -- -------------- ------------ ------------Net cash provided by (used in)financing activities (153,289) 1,069,909 5,953,603------------ ------------ ------------Net increase (decrease) in cashand cash equivalents (7,106,821) 1,658,914 5,838,421Cash and cash equivalentsat beginning of year 7,701,507 6,042,593 204,172------------ ------------ ------------Cash and cash equivalents at end of year $ 594,686 $ 7,701,507 $ 6,042,593------------ ------------ ------------------------ ------------ ------------See accompanying notes to consolidated financial statements.
S t o c kS e l e c t i o nG u i d e ®The most widely used aid togood investment judgmentCompany: BALLANTYNE OF OMAHA INC Date: Oct 19, 05Prepared by: DMGData source: S & PWhere traded: BTN - AMEXIndustry: Movies & EntertainmentCAPITALIZATION - Outstanding AmountsPreferred %Insiders %InstitutionCommon 0.0 0.0Debt % to Tot.Cap. 0.0 % Pot. Dil. 0.01 VISUAL ANALYSIS of Sales, Earnings and Price200RECENT QUARTERLY FIGURESJun 2005SalesEPS100908070Latest Quarter $13 $0.08Year Ago Quarter $12 $0.06Percentage Change 11.9% 33.3%Scale X 2.0 M 0.1060504030SS30%20SS25%1098765SSSPPPEPE20%15%4PE10%3PE2E5%P11989 1990 1991 1992 1993 1994 1995 1996 1997 1998 1999 2000 2001 2002 2003NAIC Stock Analyst © 1992, National Association of Investors Corporation, 711 West Thirteen Mile Road, Madison Hgts., Michigan 48071