Variable rheology of heavy mineral tailings - Paterson & Cooke
Variable rheology of heavy mineral tailings - Paterson & Cooke
Variable rheology of heavy mineral tailings - Paterson & Cooke

You also want an ePaper? Increase the reach of your titles
YUMPU automatically turns print PDFs into web optimized ePapers that Google loves.
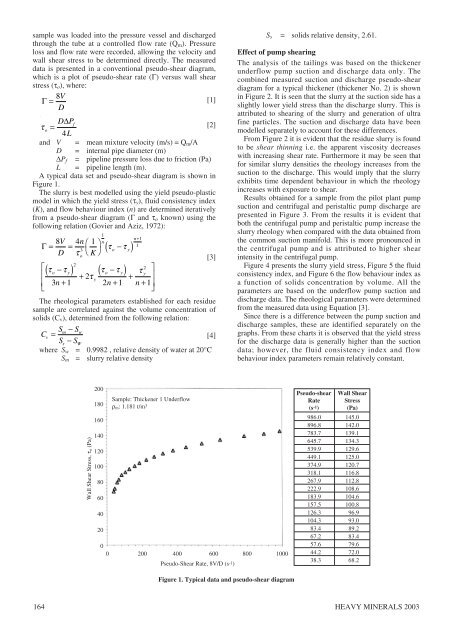
sample was loaded into the pressure vessel and dischargedthrough the tube at a controlled flow rate (Q m ). Pressureloss and flow rate were recorded, allowing the velocity andwall shear stress to be determined directly. The measureddata is presented in a conventional pseudo-shear diagram,which is a plot <strong>of</strong> pseudo-shear rate (Γ) versus wall shearstress (τ o ), where:Γ= 8V [1]DD∆Pfτ [2]o=4Land V = mean mixture velocity (m/s) = Q m /AD = internal pipe diameter (m)∆P f = pipeline pressure loss due to friction (Pa)L = pipeline length (m).A typical data set and pseudo-shear diagram is shown inFigure 1.The slurry is best modelled using the yield pseudo-plasticmodel in which the yield stress (τ y ), fluid consistency index(K), and flow behaviour index (n) are determined iterativelyfrom a pseudo-shear diagram (Γ and τ o known) using thefollowing relation (Govier and Aziz, 1972):8V4nΓ= =⎛ 1⎞3D τ ⎝ K ⎠1n( τo− τy)n+11o[3]2⎡2( τ − ) ( − )⎤oτyτo τy τy⎢ + 2τ+ ⎥y⎢ 3n+1 2n+1 n + 1⎥⎣⎦The rheological parameters established for each residuesample are correlated against the volume concentration <strong>of</strong>solids (C v ), determined from the following relation:Sm− SwCv=[4]Ss− SWwhere S w = 0.9982 , relative density <strong>of</strong> water at 20°CS m = slurry relative densityS s = solids relative density, 2.61.Effect <strong>of</strong> pump shearingThe analysis <strong>of</strong> the <strong>tailings</strong> was based on the thickenerunderflow pump suction and discharge data only. Thecombined measured suction and discharge pseudo-sheardiagram for a typical thickener (thickener No. 2) is shownin Figure 2. It is seen that the slurry at the suction side has aslightly lower yield stress than the discharge slurry. This isattributed to shearing <strong>of</strong> the slurry and generation <strong>of</strong> ultrafine particles. The suction and discharge data have beenmodelled separately to account for these differences.From Figure 2 it is evident that the residue slurry is foundto be shear thinning i.e. the apparent viscosity decreaseswith increasing shear rate. Furthermore it may be seen thatfor similar slurry densities the <strong>rheology</strong> increases from thesuction to the discharge. This would imply that the slurryexhibits time dependent behaviour in which the <strong>rheology</strong>increases with exposure to shear.Results obtained for a sample from the pilot plant pumpsuction and centrifugal and peristaltic pump discharge arepresented in Figure 3. From the results it is evident thatboth the centrifugal pump and peristaltic pump increase theslurry <strong>rheology</strong> when compared with the data obtained fromthe common suction manifold. This is more pronounced inthe centrifugal pump and is attributed to higher shearintensity in the centrifugal pump.Figure 4 presents the slurry yield stress, Figure 5 the fluidconsistency index, and Figure 6 the flow behaviour index asa function <strong>of</strong> solids concentration by volume. All theparameters are based on the underflow pump suction anddischarge data. The rheological parameters were determinedfrom the measured data using Equation [3].Since there is a difference between the pump suction anddischarge samples, these are identified separately on thegraphs. From these charts it is observed that the yield stressfor the discharge data is generally higher than the suctiondata; however, the fluid consistency index and flowbehaviour index parameters remain relatively constant.Wall Shear Stress, τo (Pa)20018016014012010080604020Sample: Thickener 1 Underflowρ m : 1.181 t/m 300 200 400 600 800 1000Pseudo-Shear Rate, 8V/D (s -1 )Pseudo-shear Wall ShearRate Stress(s -1 ) (Pa)986.0 145.0896.8 142.0783.7 139.1645.7 134.3539.9 129.6449.1 125.0374.9 120.7318.1 116.8267.9 112.8222.9 108.6183.9 104.6157.5 100.8126.3 96.9104.3 93.083.4 89.267.2 83.457.6 79.644.2 72.038.3 68.2Figure 1. Typical data and pseudo-shear diagram164HEAVY MINERALS 2003