Ecological Footprint - Region of Peel
Ecological Footprint - Region of Peel
Ecological Footprint - Region of Peel

You also want an ePaper? Increase the reach of your titles
YUMPU automatically turns print PDFs into web optimized ePapers that Google loves.
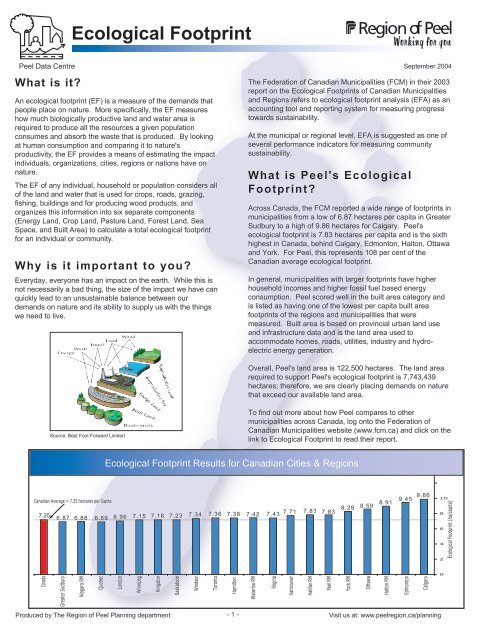
<strong>Ecological</strong> <strong>Footprint</strong><strong>Peel</strong> Data CentreWhat is it?An ecological footprint (EF) is a measure <strong>of</strong> the demands thatpeople place on nature. More specifically, the EF measureshow much biologically productive land and water area isrequired to produce all the resources a given populationconsumes and absorb the waste that is produced. By lookingat human consumption and comparing it to nature'sproductivity, the EF provides a means <strong>of</strong> estimating the impactindividuals, organizations, cities, regions or nations have onnature.The EF <strong>of</strong> any individual, household or population considers all<strong>of</strong> the land and water that is used for crops, roads, grazing,fishing, buildings and for producing wood products, andorganizes this information into six separate components(Energy Land, Crop Land, Pasture Land, Forest Land, SeaSpace, and Built Area) to calculate a total ecological footprintfor an individual or community.Why is it important to you?Everyday, everyone has an impact on the earth. While this isnot necessarily a bad thing, the size <strong>of</strong> the impact we have canquickly lead to an unsustainable balance between ourdemands on nature and its ability to supply us with the thingswe need to live.The Federation <strong>of</strong> Canadian Municipalities (FCM) in their 2003report on the <strong>Ecological</strong> <strong>Footprint</strong>s <strong>of</strong> Canadian Municipalitiesand <strong>Region</strong>s refers to ecological footprint analysis (EFA) as anaccounting tool and reporting system for measuring progresstowards sustainability.At the municipal or regional level, EFA is suggested as one <strong>of</strong>several performance indicators for measuring communitysustainability.What is <strong>Peel</strong>'s <strong>Ecological</strong><strong>Footprint</strong>?September 2004Across Canada, the FCM reported a wide range <strong>of</strong> footprints inmunicipalities from a low <strong>of</strong> 6.87 hectares per capita in GreaterSudbury to a high <strong>of</strong> 9.86 hectares for Calgary. <strong>Peel</strong>'secological footprint is 7.83 hectares per capita and is the sixthhighest in Canada, behind Calgary, Edmonton, Halton, Ottawaand York. For <strong>Peel</strong>, this represents 108 per cent <strong>of</strong> theCanadian average ecological footprint.In general, municipalities with larger footprints have higherhousehold incomes and higher fossil fuel based energyconsumption. <strong>Peel</strong> scored well in the built area category andis listed as having one <strong>of</strong> the lowest per capita built areafootprints <strong>of</strong> the regions and municipalities that weremeasured. Built area is based on provincial urban land useand infrastructure data and is the land area used toaccommodate homes, roads, utilities, industry and hydroelectricenergy generation.Overall, <strong>Peel</strong>'s land area is 122,500 hectares. The land arearequired to support <strong>Peel</strong>'s ecological footprint is 7,743,439hectares; therefore, we are clearly placing demands on naturethat exceed our available land area.Source: Best Foot Forward LimitedTo find out more about how <strong>Peel</strong> compares to othermunicipalities across Canada, log onto the Federation <strong>of</strong>Canadian Municipalities website (www.fcm.ca) and click on thelink to <strong>Ecological</strong> <strong>Footprint</strong> to read their report.<strong>Ecological</strong> <strong>Footprint</strong> Results for Canadian Cities & <strong>Region</strong>s1412Canadian Average = 7.25 hectares per Capita7.256.87 6.88 6.89 6.96 7.15 7.18 7.23 7.34 7.36 7.38 7.42 7.437.71 7.837.838.288.59 8.91 9.45 9.86108642<strong>Ecological</strong> <strong>Footprint</strong> (ha/capita)0Produced by The <strong>Region</strong> <strong>of</strong> <strong>Peel</strong> Planning department- 1 - Visit us at: www.peelregion.ca/planning
<strong>Ecological</strong> <strong>Footprint</strong>The Average <strong>Peel</strong> Resident's<strong>Ecological</strong> <strong>Footprint</strong> byLand/Area Category (%)This diagram illustrates the average ecological footprint or totalland and water area that is required to support a resident <strong>of</strong><strong>Peel</strong> <strong>Region</strong> by land and water category.Pasture Land3%Built Land4%Sea Space2%CD: Census DivisionCMA: Census MetropolitianAreaECOLOGICAL FOOTPRINTSComparing <strong>Footprint</strong>s in the Greater Toronto AreaCanadaToronto (CMA)York <strong>Region</strong>alMunicipality(CD)<strong>Peel</strong> <strong>Region</strong>alMunicipality(CD)September 2004Halton<strong>Region</strong>alMunicipality(CD)Hamilton(CMA)Energy Land 4.00 4.05 4.56 4.23 5.03 4.03Crop Land 1.39 1.48 1.70 1.70 1.70 1.50Pasture Land 0.21 0.22 0.25 0.25 0.25 0.23Sea Space 0.15 0.15 0.18 0.18 0.18 0.22Forest Land 1.14 1.14 1.27 1.16 1.43 1.09Built Area 0.36 0.31 0.32 0.31 0.32 0.31Forest Land17%Total <strong>Ecological</strong><strong>Footprint</strong> (hectares percapita)7.25 7.35 8.28 7.83 8.91 7.37Crop Land21%Comparing the <strong>Ecological</strong><strong>Footprint</strong> InternationallyHow Does Canada Compare? The FCM report found that theaverage Canadian has the third largest ecological footprint inthe world, behind the United States and the United ArabEmirates. Current analysis shows that on average theCanadian ecological footprint is 7.25 hectares. This indicatesthat it takes 7.25 hectares <strong>of</strong> land and sea throughout theworld to support each Canadian.Internationally, ecological footprints in many other countriesare much lower than Canada's as indicated by the followingexamples:• India - 0.86 hectares/person• Pakistan - 0.64 hectares/person• Japan - 4.77 hectares/personSource: WWF Living Planet Report 2002Energy Land53%INFORMATION NEEDED TO CALCULATE AN ECOLGICAL FOOTPRINTHOUSEHOLD ORINDIVIDUALFOOTPRINTCITY, TOWNOR REGIONFOOTPRINTWhat can I do to change mycommunity's and my personalfootprint?While it may not be possible to affect all <strong>of</strong> the variables thatproduce your community's ecological footprint, you canpersonally take action in several ways to reduce yourindividual ecological footprint.If enough individual action is taken we can expect to observeimprovements in the <strong>Region</strong>'s ecological footprint over time.You may wish to try some <strong>of</strong> the following actions in theseareas:Food:• Buy more locally grown and organic food• Buy more unpackaged and unprocessed foods• Eat vegetarian meals more frequentlyMobility:• Drive your car less and carpool whenever possible• If you drive, choose a more fuel efficient vehicle• Use public transit, bike or walk whenever possibleHousing:• Hang clothes to dry - limit the number <strong>of</strong> loads <strong>of</strong> laundry_ that go in your dryer• Reduce the number <strong>of</strong> days you use the air conditionerPractice water and energy conservation• Turn <strong>of</strong>f lights and use energy efficient bulbs and appliances» Amount and type <strong>of</strong> food consumed» Amount and type <strong>of</strong> electricity used» Size <strong>of</strong> house or apartment» Gasoline use» Population density» Average household size» Consumer spending» Energy useTry these simple suggestions and see how much you canreduce your ecological footprint.» Fuel efficiency» Miles travelled by vehicle, transit, bikeand foot» Urban land useProduced by The <strong>Region</strong> <strong>of</strong> <strong>Peel</strong> Planning department- 2 -Note: All Charts and Graphs are reproduced from the <strong>Ecological</strong> <strong>Footprint</strong>s <strong>of</strong>Canadian Municipalities and <strong>Region</strong>s report prepared by AnielskiManagement Inc. for the Federation <strong>of</strong> Canadian Municipalities.Visit us at: www.peelregion.ca/planning