Time-Driven Activity-Based Costing
Time-Driven Activity-Based Costing
Time-Driven Activity-Based Costing

Create successful ePaper yourself
Turn your PDF publications into a flip-book with our unique Google optimized e-Paper software.
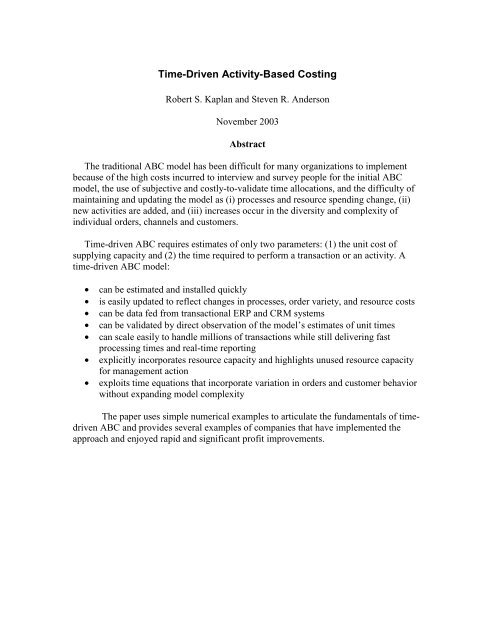
<strong>Time</strong>-<strong>Driven</strong> <strong>Activity</strong>-<strong>Based</strong> <strong>Costing</strong>Robert S. Kaplan and Steven R. AndersonNovember 2003AbstractThe traditional ABC model has been difficult for many organizations to implementbecause of the high costs incurred to interview and survey people for the initial ABCmodel, the use of subjective and costly-to-validate time allocations, and the difficulty ofmaintaining and updating the model as (i) processes and resource spending change, (ii)new activities are added, and (iii) increases occur in the diversity and complexity ofindividual orders, channels and customers.<strong>Time</strong>-driven ABC requires estimates of only two parameters: (1) the unit cost ofsupplying capacity and (2) the time required to perform a transaction or an activity. Atime-driven ABC model:• can be estimated and installed quickly• is easily updated to reflect changes in processes, order variety, and resource costs• can be data fed from transactional ERP and CRM systems• can be validated by direct observation of the model’s estimates of unit times• can scale easily to handle millions of transactions while still delivering fastprocessing times and real-time reporting• explicitly incorporates resource capacity and highlights unused resource capacityfor management action• exploits time equations that incorporate variation in orders and customer behaviorwithout expanding model complexityThe paper uses simple numerical examples to articulate the fundamentals of timedrivenABC and provides several examples of companies that have implemented theapproach and enjoyed rapid and significant profit improvements.
<strong>Time</strong>-<strong>Driven</strong> <strong>Activity</strong> <strong>Based</strong>-<strong>Costing</strong><strong>Activity</strong>-based costing was introduced in the mid-1980s through several HarvardBusiness School cases and articles. 1 While the settings of these cases differed, they allhad one characteristic in common. The resource expenses assigned to an activity weredetermined through interviews, time logs, and direct observation of the amount orpercentage of time people spent on various activities. For example, the costs ofwarehousing goods would be driven to activities − such as Receiving, Inspection, Putaway,Picking, Packing, and Shipping − based on estimates by warehouse personnel ofthe percentage of their time they spent on each of the activities. The project team thencalculated activity cost driver rates, used to assign activity costs to individual products orcustomers, by dividing these activity costs by the outputs of each activity − such asnumber of receipts, number of inspections, number of items picked, and number ofshipments.This procedure for estimating an ABC model, while feasible for initial pilotstudies, has proved difficult and costly to extend to company-wide applications. Also,even after the initial model has been built, updating the model requires essentially reestimatingthrough a new round of interviews and surveys to reflect changes in acompany’s operations. Consequently, ABC models are often not maintained and theircost estimates soon become obsolete. In this paper, we review the problems associatedwith traditional estimation of ABC models. We describe a new approach that is bothsimpler − for estimating and maintaining an ABC model − and also more accurate. Thenew, time-driven approach allows for more heterogeneity in activities, orders, andcustomer behavior without placing burdensome demands for calculating activity, productand customer costs.Estimating a Basic ABC ModelThe standard procedure for estimating a simple ABC model starts with identifyinga collection of resources that perform a variety of activities. For example, consider acustomer service department that performs three activities:• handle customer orders• process customer complaints• perform customer credit checks.Assume that the cost of supplying resources – personnel, supervision, informationtechnology, telecommunications, and occupancy − to perform these activities is $560,000per quarter. In building an ABC model for the customer service department, the systemdesigner asks employees to estimate the percentage of their time spent (or that theyexpect to spend) on the three principal activities they perform. Suppose they estimate2
these percentages as 70%, 10% and 20%, respectively. The ABC system designer alsolearns that the actual (or estimated) quantities of work for the quarter in these threeactivities are:• 9,800 customer orders• 280 customer complaints• 500 credit checksThe system assigns the $560,000 resource cost to activities, based on the timepercentage, and calculates activity cost driver rates as shown below:<strong>Activity</strong> Cost <strong>Activity</strong> Cost<strong>Activity</strong> % Assigned Cost Driver Quantity Driver RateHandle orders 70% $392,000 9,800 $ 40/orderProcess complaints 10% 56,000 280 $200/complaintCheck credit 20% 112,000 500 $224/credit checkTotal 100% $ 560,000The project team then uses the calculated activity cost driver rates to assign theexpenses of the three activities to individual customers based on the number of ordershandled, complaints processed, and credit checks performed for each customer.This approach works well in the limited setting in which it was initially applied,typically a single department, plant or location. Also, many of the initial studies wereone-time events that provided a useful snapshot of the plant’s current economics, such asto identify high cost, inefficient processes and the unprofitable products and customers.Even today, the revelation of high cost processes, products and customers stimulatesnear-term actions (activity-based management) that can lead to near-term and oftendramatic profit improvements.Problems with Estimating and Maintaining ABC ModelsSeveral problems, however, arise when companies attempt to scale up thisseemingly straightforward approach to enterprise-wide models, and to maintain themodel so that it reflects changes in activities, processes, products, and customers. First,the process to interview and survey employees to get their time allocations to multipleactivities is time consuming and costly. Consider the experience of a money centerbank’s brokerage operation. Its traditional ABC model required 70,000 employees atmore than 100 facilities to submit monthly surveys of their time. The company had toprovide 14 full-time people just to manage the ABC data collection, processing andreporting. A $20 billion distributor required several months and about a dozen employeesto update its internal ABC model. The high time and cost to estimate an ABC model andto maintain it – through re-interviews and re-surveys − has been a major barrier towidespread ABC adoption. And, because of the high cost of continually updating theABC model, many ABC systems are updated only infrequently, leading to out-of-dateactivity cost driver rates, and inaccurate estimates of process, product, and customercosts.3
The accuracy of the cost driver rates when they are derived from individuals’subjective estimates of their past or future behavior has also been called into question. 2Apart from the measurement error introduced by employees’ best attempts to recall theirtime allocations, the people supplying the data − anticipating how it might be used −might bias or distort their responses. As a result, operations, sales and marketingmanagers often argue about the accuracy of the model’s estimated costs and profitabilityrather than address how to improve the inefficient processes, unprofitable products andcustomers, and considerable excess capacity that the model has revealed. 3Another problem is that traditional ABC models are difficult to scale. Adding newactivities to the model, such as to introduce heterogeneity within an activity, requires reestimatingthe amount of cost that should be assigned to the new activity. For example,consider the complexity in the activity “ship order to customer.” Rather than assuming aconstant cost per order shipped, a company may wish to recognize the cost differenceswhen an order is shipped in a full truck, in a less than truckload (LTL) shipment, usingovernight express, or by a commercial carrier. In addition, the shipping order may beentered either manually or electronically, and it may require either a standard or anexpedited transaction. To allow for the significant variation in resources required by thedifferent shipping arrangements, new activities must be added to the model, therebyexpanding its complexity. 4As the activity dictionary expands – either to reflect more granularity and detailabout activities performed or to expand the scope of the model to the entire enterprise −the demands on the computer model used to store and process the data escalatedramatically. For example, a company using 150 activities in its enterprise ABC model,and applying the costs in these 150 activities to 600,000 cost objects (products or SKUs,and customers), and running the model monthly for two years requires data estimates,calculations, and storage for more than 2 billion items. 5Such expansion has caused many home grown ABC systems to exceed thecapacity of their generic spreadsheet tools, such as Microsoft Excel ®, or even theirformal ABC software packages, such as ABC Technology’s Oros® . The systems oftentake days to process one month of data, assuming the solution converges at all. Forexample, the automated ABC model for Hendee Enterprises, a $12 million fabricator ofawnings, took three days to calculate costs for its 40 departments, 150 activities, 10,000orders, and 45,000 line items. 6To reduce the computational and storage burden of operating an enterprise-wideABC model, companies often build separate ABC models for each of their sites. But thenthe models do not easily handle products that move between facilities for processing. Forexample, at a steel fabricator and distributor, one particular grade of steel is processedthrough three different facilities before shipment to the customer. Trying to coordinatecost estimates for products traversing multiple ABC models, or for a product assembledfrom components built in separate factories, each with its own ABC model, becomes anessentially impossible task.4
These implementation problems have become obvious to most ABCimplementers. But a subtle and more serious problem arises from the interview andsurvey process itself. When people estimate how much time they spend on a list ofactivities handed to them, invariably they report percentages that add up to 100%. Fewindividuals report that a significant percentage of their time is idle or unused. Therefore,cost driver rates are calculated assuming that resources are working at full capacity. But,of course, operations at practical capacity are more the exception than the rule.ABC cost driver rates should be calculated at practical capacity not at actualutilization. 7 Returning to the numerical example at the beginning of this paper, if thepractical capacity of the resources are not fully used by the demands of handling 9,800customer orders, 280 credit checks, and 500 credit approvals, the cost driver rates shouldbe lower, perhaps significantly lower, than the rates calculated based on actual demands.In summary, the process of calculating activity expenses through interviews,observation and surveys has proven to be time-consuming and costly to collect the data,expensive to store, process and report, difficult to update in light of changingcircumstances, and theoretically incorrect, by suppressing the role for unused capacitywhen calculating cost driver rates.<strong>Time</strong>-<strong>Driven</strong> ABC: A Simple, Accurate ApproachAn alternative approach for estimating an ABC model, which we call “timedrivenactivity-based costing,” addresses all the above limitations. 8 It is simpler, lesscostly, and faster to implement, and allows cost driver rates to be based on the practicalcapacity of the resources supplied. In retrospect, we wish that the evolution of ABC inthe 1980s had taken a different path so that this method could have been implemented atthe outset. But the underlying theory for ABC had not been developed when it was firstintroduced in the mid-1980s so the elegance and conceptual clarity of this new approachwere not obvious at the time.The basis for the new approach is highlighted in an early cost management article,where Robin Cooper articulated the difference between transactional and “effort” costdrivers. 9 Transactional cost drivers count the number of times an activity is performed.Examples include number of production runs, number of setups, number of shipments,number or purchase orders, and number of customer orders. When the resources requiredto perform each occurrence of an activity vary, such as when some setups are moredifficult or complex to do than others, or when some customer orders require more timeand effort to process than others, then simply counting the number of times an activity isperformed gives an inaccurate estimate of the resources required to accomplish the work.The heterogeneity in transactions can be handled in two ways by the ABC system.One is to expand the number of activities, into say handling a simple order, an averageorder, and a complex order. The resource costs then have to be assigned to the three types5
of order-handling activities, and a transactions driver − number of simple, average andcomplex orders − defined for each activity. Alternatively, the cost system can useduration drivers, which estimate the time required to perform the task. Examples ofduration drivers are setup hours, material handling time, and, of course, direct labor hoursand machine hours. While duration drivers are generally more accurate than transactiondrivers, they are also more expensive to measure, so cost system designers have typicallyused transaction drivers whenever they reasonably approximate resource demands byeach occurrence of an activity. 10Most ABC systems, like our numerical example of the customer servicedepartment, use a large number of transaction cost drivers. The cost driver rates arecalculated by dividing the activity expense by the quantity of the transaction cost driver(such as number of setups, or number of customer orders). The calculation yields the costper transaction. The implicit assumption behind this process is that each occurrence of theevent (a setup, a customer order) consumes the same quantity of resources. Thisassumption is the key to the alternative approach for estimating cost driver rates.The essence of activity-based costing and activity-based management is themeasurement and management of the organization’s capacity. 11 For this purpose, ABCsystems require two estimates:1. The unit cost of supplying capacity, and2. The consumption of capacity (unit times) by the activities the organizationperforms for products, services, and customers.Unit Cost EstimateThe new procedure starts, as with the traditional approach, by estimating the costof supplying capacity. Identify the various groups of resources that perform activities. Forexample, for the set of activities performed by people involved in customeradministration, the analyst identifies the front-line employees who receive and respond tocustomer-related requests, their supervisors, and the support resources they require toperform their functions – space, computers, telecommunications, furniture, and,potentially, resources in other support departments (information technology, humanresources, utilities, etc.). In our numerical example, the sum of all these resources is$560,000 per quarter. 12 In addition, as in any well-designed traditional ABC model, theanalyst also estimates the practical capacity of the resources supplied.Measuring practical capacity of a group of resources is not a trivial issue, butneither is it an insurmountable issue. Often practical capacity is estimated as apercentage, say 80% or 85%, of theoretical capacity. That is, if an employee or machinenormally can work 40 hours per week, practical capacity could be assumed to be 32 hoursper week. This estimate allows for 20% of personnel time for breaks, arrival anddeparture, and communication and reading unrelated to actual work performance, and20% of machine time for downtime due to maintenance, repair, and schedulingfluctuations.6
<strong>Activity</strong> Cost Driver<strong>Activity</strong>Unit <strong>Time</strong> (minutes) Rate @ $0.80/minuteHandle customer order 40 $ 32Process customer complaint 220 $176Perform credit check 250 $200These rates are lower than those estimated before. The reason for this discrepancybecomes obvious when we calculate the cost of performing these activities during therecent quarter.<strong>Activity</strong> Unit <strong>Time</strong> Quantity Total Minutes Total CostHandle customer order 40 9,800 392,000 $313,600Process customer complaint 220 280 61,600 49,280Perform credit check 250 500 125,000 100,000Total 578,600 $462,880The analysis reveals that only 83% of the practical capacity (578,600/700,000) ofthe resources supplied during the period was used for productive work (and hence only83% of the total expenses of $560,000 are assigned to customers during this period). Thetraditional ABC system over-estimates the costs of performing activities because itsdistribution of effort survey, while quite accurate − 70%, 10% and 20% of the productivework is the approximate distribution across the three activities − incorporates both thecosts of resource capacity used and the costs of unused resources. By specifying the unittimes to perform each instance of the activity 14 the organization gets both a more validsignal about the cost and the underlying efficiency of each activity as well as the quantity(121,400 hours) and cost ($97,120) of the unused capacity in the resources supplied toperform the activity.With estimates of the cost of resource supply, the practical capacity of theresources supplied, and the unit times for each activity performed by the resources, thereporting system becomes quite simple for each period. Suppose the quantity of activitiesshifts, in the subsequent period, to 10,200 orders handled, 230 customer complaints, and540 credit checks performed. During the period, the costs of each of the three activitiesare assigned based on the standard rates, calculated at practical capacity: $32 per order,$176 per complaint, and $200 per credit check. This calculation can be performed in realtime to assign customer administration costs to individual customers, as transactions fromcustomers occur.The report at the end of the period is both simple and informative:<strong>Activity</strong>Quantity Unit<strong>Time</strong>Total <strong>Time</strong> UnitCostTotal CostAssignedHandle Customer Orders 10,200 40 408,000 $ 32 $ 326,400Process Complaints 230 220 50,600 176 40,480Perform Credit Checks 540 250 135,000 200 108,0008
TotalUsed 593,600 $ 474,880Total Supplied 700,000 $560,000Unused Capacity 106,400 $ 85,120The report reveals the estimated time spent on the three activities, as well as theresource costs required to handle the activity demands. It also highlights the differencebetween capacity supplied (both quantity and cost) and the capacity used. Managers canreview the $85,120 cost of the 106,400 minutes (1,773 hours) of unused capacity andcontemplate actions to reduce the supply of resources and the associated expense.Rather than reduce currently unused capacity, managers may choose to reservethat capacity for future growth. As managers contemplate new product introductions,expansion into new markets, or just increases in product and customer demand, they canforecast how much of the increased business can be handled by existing capacity, andwhere capacity shortages are likely to arise that will require additional spending to handlethe increased demands. For example, the vice president of operations at Lewis-Goetz, ahose and belt fabricator based in Pittsburgh, saw that one of his plants was operating atonly 27% of capacity. Rather than attempt to downsize the plant, he decided to maintainthe capacity for a large contract he expected to win later that year.<strong>Time</strong> EquationsIn general, not all orders are the same and require the same amount of time toprocess. Similarly for handling customer complaints, performing credit checks, or anyother transactional process. We have found that companies can generally predict thedrivers that cause some transactions to be simpler or more complex to process. Forexample, consider an activity to package a chemical for shipment. If the item is already astandard one in a compliant package, the operation may take only 0.5 minutes to get itready for shipment. If the item requires a special package, then an additional 6.5 minutesis required. And if the item is to be shipped by air, an additional 0.2 minutes is requiredto place it in a plastic bag. Rather than define a separate activity for every possiblecombination of shipping characteristics, or use a duration driver for every possibleshipping combination, the time-driven approach estimates the resource demand by asimple equation:Packaging <strong>Time</strong> = 0.5 + 6.5 (if special handling required) + 0.2 (if shipping by air)The data for special handling, method of shipment, and all other shippingcharacteristics are typically already in the company’s ERP system where the order hasbeen entered. Most modern ERP systems provide their users with tools to easily exportthese data to analytic software packages. Order-specific data enable the particular timedemands for any given order to be quickly calculated with a simple algorithm that testsfor the existence of each characteristic affecting packaging time. The time-drivenapproach usually operates with fewer equations than the number of activities used in any9
existing traditional ABC system, while permitting more variety and complexity in orders,products, and customers, and, therefore, delivering more accuracy.<strong>Time</strong>-driven ABC models are usually similar for plants and companies within anindustry because the processes they use are similar. Dave Deinzer, CEO of Denman &Davis, and President of the North American Steel Alliance commented, “For the mostpart, we are all pretty much the same…cutting, sawing, and finishing metal with the sameequipment and the same procedures. You could probably apply the same time-drivenABC model to all of us.” Building an accurate time-based algorithm in one facility willtypically serve as a template that can be easily applied and customized to other plants, oreven other companies in an industry.Another benefit of implementing a time-driven ABC model is the knowledge itgenerates about the efficiencies – unit cost and unit times − of critical business processes.Managers are often surprised by how much time it takes to process a special order or toset up a new customer, or the costs of performing a quality assurance check. Companieshave enjoyed immediate benefits from their models by focusing their improvementefforts on high cost and inefficient processes.And companies are using their time-driven process information in a predictivemanner so that they can modify the behavior of their customers. Wilson-Mohr, anindustrial controls company in Houston, Texas, worked as a subcontractor forEngineering Contractors (EC) on the construction of custom process control systems forrefineries and chemical plants. Its time-driven model revealed, for the first time, the highcost of engineering change orders issued by their ECs such as to replace parts orreconfigure the design. In the past, Wilson Mohr only charged the ECs for the predictedmaterial cost changes from the change orders. Now it could also predict the cost ofadditional sales, design, engineering, and manufacturing labor time that were consumedwhen implementing the change orders. Wilson-Mohr now uses this information proactivelyin its discussions with its ECs about price recovery from engineering changeorders.Model UpdatingManagers can easily update their time-driven ABC model to reflect changes intheir operating conditions. For example, they might learn that the customer departmentperforms more than the three activities specified in the original model. They don’t haveto return to re-interview the personnel in the department. They simply estimate the unittimes required for each new activity identified. As already noted, if managers learn thatall customer orders or all credit checks do not take the same amount of time, they caneasily incorporate the effect of complex versus simple orders by estimating theincremental unit time required when a complex transaction must be handled. Forexample, at Maines Paper and Foodservice, the algorithm for Customer Service time addsthree minutes for special orders, another three minutes if a credit memo is required,decreases the estimate if the order came via an EDI connection, and adds or subtracts10
times for known customer-specific characteristics. In this way, the model evolvesseamlessly as managers learn more about additional variety and complexity in theirprocesses, orders, suppliers, and customers.Managers can also easily update the activity cost driver rates. Two factors causethe activity cost driver rates to change. First, changes in the prices of resources suppliedaffect the hourly cost rate. For example, if employees receive an 8% compensationincrease, the hourly cost increases from $0.80 per supplied minute to $0.864 per minute.If new machines are substituted or added to a process, the cost rate is modified to reflectthe change in operating expense associated with introducing the new equipment.The second factor leading to a change in the activity cost driver rate is a shift inthe efficiency of the activity. Quality (six sigma) programs, other continuousimprovement efforts, reengineering, or the introduction of new technology can enable thesame activity to be done in less time or with fewer resources. When permanent,sustainable improvements in a process have been made, the ABC analyst modifies theunit time estimates (and therefore the demands on resources) to reflect the processimprovement. For example, if a computerized data base is made available to the customeradministration department, the people may be able to perform a standard credit check in30 minutes rather than 250 minutes. The improvement is simple to accommodate; justchange the unit time estimate to 30 minutes and the new activity cost driver rateautomatically becomes $24 per credit check (down from $200). The new rate may besomewhat higher than $24 after the unit cost rate has been increased (above $0.80 perminute) to reflect the cost of the newly-acquired data base and computer system.Following this procedure, an ABC model can be updated based on events ratherthan by the calendar (once a quarter, or annually). Anytime, analysts learn about asignificant shift in the costs of resources supplied, or changes in the resources requiredfor the activity, they update the cost rate estimates. And anytime they learn of asignificant and permanent shift in the efficiency with which an activity is performed, theyupdate the unit time estimate.The key elements for time-driven ABC are, first, estimating the practical capacityof committed resources and their cost, and, second, estimating unit times for performingtransactional activities. The practical capacity should be estimated anyway for doing avalid ABC analysis to avoid distortions and potential death spirals that arise whenexisting products and customers are burdened with the costs of unused capacity. And theunit time estimates are implicit in the very notion of a transaction driver. These unit timesneed not be estimated to four significant digits. Managers use the unit time estimates forstrategic insights, not to monitor and control the performance of individual employeesand equipment. For the strategic insight, a rough estimate, generally within 10 percent,should be adequate. Gross inaccuracies in unit time estimates will eventually be revealedeither in unexpected surpluses or shortages of committed resources. At the time of suchsurprises, analysts can focus on the unit times required by the activities performed bythese resources and obtain updated and more accurate estimates. A cost system used foroperational control, in contrast, needs to monitor closely the resource requirements,11
quality, and cycle times of activities and processes to motivate and capture the smallimprovements from continuous improvement activities.Practical Applications of <strong>Time</strong>-<strong>Driven</strong> ABC<strong>Time</strong>-driven ABC is not a hypothetical improvement to traditional ABC analysis.It has been applied in dozens of companies, helping them to deliver significant profitimprovements quickly.Hunter CompanyThe Hunter Company (disguised name of actual company), a large, multinationaldistributor of scientific products with over 20 facilities, 300,000 customers, and 460,000product SKUs, processes more than one million orders each month. Hunter already hadan existing activity-based costing model that had been built with the assistance of anexternal consulting team. The insights revealed from the model were extremelyinformative but many in the company questioned if the view was worth the climb. Theirmain complaints can be summarized as follows:• The model had been cumbersome to build and maintain. With more than1,000 activities, the monthly survey of department staff of where they hadspent their time was complex and costly. Also, tracking the driverquantities for each activity and customer was difficult.• The model did not reconcile with actual financials since activity costdriver rates had not been updated recently.• Despite the already large number of activities, the model was still notconsidered accurate or granular enough. It did not reflect several importantdifferences between orders. To increase accuracy, more activities wouldhave to be added, and employees would have to be re-interviewed. Also,an additional data extract to track the quantities of the new cost driverswould be required.The existing ABC approach was not easily maintainable, and thus not sustainable.The company called in a software/consulting company to help it implement the timedrivenABC approach. 15 The time-driven approach led to the following changes:For a department, such as the inside sales department, the previous ABCmodel required employees to estimate, each month, the percentage of theirtime spent on their three activities: customer set-up, order entry, and orderexpediting. In the time-driven approach, the ABC team estimated the timerequired to perform each activity. For example, the activity to set-up a newcustomer took 15 minutes. Since a field already existed within Hunter’sERP system that identified whether a customer was new, assigning acustomer set-up cost to a new customer became a simple transaction. Fororder entry, the team learned that every order took about five minutes toenter the basic order information, plus three minutes for each line item onthe order. Again this was a simple calculation to implement since the ERP12
system already tracked the number of line items for each order. Finally,the team learned that order expediting was triggered by a request by thecustomer to rush the shipment, resulting in an additional 10 minutes oftime to coordinate the expediting. The order included a field thatidentified it is a “rush order.” The project team could write a simpleequation to estimate the Inside Sales Department time required for eachorder received:Inside Sales Process <strong>Time</strong> = 15*[New Customer] + 5 + 3*[Number of Line Items]+ 10*[Rush]The Inside Sales Department cost for the order was obtained by multiplying this time bythe cost per minute of Inside Sales Department resources. This process was replicated ineach department to arrive at the total cost of producing, handling, and fulfilling the order.Note that once the team had created the Inside Sales Process algorithm, it did notneed to continually re-interview personnel. Each period, the costs of the departmentwould be assigned based on the volume and nature of the transactions it handled.The Hunter Company identified the following benefits from shifting its ABC modelto the time-driven approach.• It reduced the number of activities to maintain. It transformed 1,200 activities(e.g., set-up new customer, enter orders, expedite orders) to 200 departmentspecific processes (e.g., the equation used to estimate Inside Sales Departmenttime). Also, it could easily update the resource cost of each cost center anddepartments so that its process costs were accurate and current.• Its cost estimates were more accurate since they were based on actualobservations of processing time and actual transaction data, not subjectiveestimates on where and how people spent their time• It was easier to increase model accuracy and granularity, when wanted, for highcost and heterogeneous processes. Adding more elements to the time equationenabled managers to easily add more variety and complexity to the model whenrequired. This enabled managers to identify specific SKUs, customers, andprocesses where improvements could be made.• The model was easier to validate. The calculated total process time, based on alltransactions in a period, could be reconciled to head count (resources suppliedduring the period). If the total process time exceeded the actual resourcessupplied, managers received a signal that some of their unit times were likely toohigh. If total calculated process time was well below the time supplied, butemployees felt they were working at or beyond capacity, managers learned thatsome of their unit times were under-estimated or employees were working lessefficiently than anticipated.• The model provided explicit information on processes operating at or beyondcapacity, and those operating well below capacity. Managers could take action torelieve bottlenecks expected to persist in future periods, or act to reduce capacity13
in departments where any unused capacity was expected to persist for severalperiods into the future.Today, it takes two people, two days per month to load, calculate, validate andreport findings, compared to the 10-person team spending over 3 weeks to maintain theprevious model. Employees now spend time generating increased profits from theinformation rather than just updating and maintaining the information.Klein SteelKlein Steel, a steel service center in upstate New York, distributes more than3,500 products at an average mark-up of 30%. Because of high handling and distributioncosts, however, its net margin was only 1%. It installed a time-driven ABC system thatenabled it to see costs by distribution office, by product, by customer, and by size oforder. By working from an industry template, Klein had such accurate cost andprofitability information within 1-2 months. Among its findings were the following:• twenty-five percent of its customers were unprofitable• the company could not make a profit on any order selling for less than 20percent gross margin – regardless of order size• several entire distribution routes were unprofitable, and• salespersons had been trying for years, unsuccessfully, to increase ordervolume with some unprofitable customers.Klein acted quickly to establish new order acceptance guidelines, providecustomer incentives to consolidate many small orders into a few large ones to reducehandling and shipping costs, enact a new sales commission plans based on netprofitability of customers, and improve processes revealed to be high cost. Klein enjoyedan initial gross profit improvement of 4% and recaptured the cost of installing its newABC system within six months. It was targeting a profit improvement of more than$700,000 annually.Banta FoodsBanta Foods is a Midwest food distributor with revenues of approximately $100million from 2,700 customers. Like Klein Steel, it operated with a razor thin net marginof about 1 percent. Historically, its profit drivers were increasing the number of ordersper day, increasing aggregate revenues, and controlling aggregate expenses. Its timedrivenABC system, installed and running within a few weeks, revealed much moregranularity in its expense structure by tracking costs to products, orders, customers, andterritories. Sales managers learned that a $1,000 order, considered the smallest size tobreakeven, could either be quite profitable or a loss depending on distance to customer,location of product in the warehouse, size of order, frequency of delivery, type of service,14
and credit worthiness of the customer – all of which were now incorporated in thealgorithms in its new time-driven ABC system. Chuck Banta, President and CEO, noted:Your cost to serve is a lot less 50 miles away from your warehouse than it is 200miles away. ABC allowed us to look at all our expenses through that kind oflens.<strong>Based</strong> on the information in its ABC model, Banta instituted an non-negotiableminimum order size, reduced the inventory of unprofitable products, promoted sales ofhigh profit products, negotiated with customers to either reduce or re-price the demandfor high cost services, and offered incentives to its salespersons to increase the net profitsof their customers. It also renegotiated with vendors to recoup the cost of processingcustomer rebates. The general manager of sales used the information to transform hissales representatives from order takers to consultants, helping their customers to becomemore profitable. He reported:Sales people can now increase their gross profit not by simply adding points totheir margin but by knowing which items to sell.By accurately projecting the cost and profits of proposed business, Banta has beenable to take on new business that increased revenues by 35% and net profits by 22 %significantly outperforming its industry and garnering the distinction of “Innovator of theYear” in its industry. 16 With all its initial actions, Banta’s annual profits increased by43%. Additional action plans being implemented are expected to yield an additional 25%increase in profits as shown below:Opportunities Identified Profit Impact (total increase of 70%,equal to 1.4% of revenues)Sales incentives paid on net profits +11%Recover vendor rebate processing costs +20%What-if profit analysis on new business +22%Establish minimum order size +22%Perform vendor reviews + 5%SummaryOver the past 15 years, activity-based costing has enabled managers to see thatnot all revenue is good revenue, and not all customers are profitable customers.Unfortunately, the difficulties of implementing and maintaining traditional ABC systemshave prevented activity-based cost systems from being an effective, timely, and up-todatemanagement tool. The time-driven ABC approach has overcome these difficulties. Itoffers managers a methodology that has the following positive features:1. Easy and fast to implement2. Integrates well with data now available from recently installed ERP and CRMsystems15
3. Inexpensive and fast to maintain and update4. Ability to scale to enterprise-wide models5. Easy to incorporates specific features for particular orders, processes,suppliers, and customers6. More visibility to process efficiencies and capacity utilization7. Ability to forecast future resource demands based on predicted orderquantities and complexityThese characteristics enable activity-based costing to move from a complex,expensive financial systems implementation to becoming a tool that provides meaningfuland actionable data, quickly and inexpensively, to managers.16
About the AuthorsRobert S. Kaplan is the Marvin Bower Professor of Leadership Development atHarvard Business School. Kaplan joined the HBS faculty in 1984 afterspending 16 years on the faculty of the Graduate School of IndustrialAdministration (GSIA), Carnegie-Mellon University. He served as Dean of GSIAfrom 1977 to 1983. Kaplan received a B.S. and M.S. in Electrical Engineeringfrom M.I.T., and a Ph.D. in Operations Research from Cornell University. In1994, he was awarded an honorary doctorate from the University of Stuttgart.Kaplan's research, teaching, and consulting focus on new cost andperformance measurement systems, primarily activity-based costing and theThe Balanced Scorecard. He has authored or co-authored more than 100 papersand ten books. Kaplan received the Outstanding Accounting Educator Award in1988 from the American Accounting Association (AAA), and the 1994 CIMA Awardfrom the Chartered Institute of Management Accountants (UK) for "OutstandingContributions to the Accountancy Profession."Steven Anderson is Chairman and Founder of Acorn Systems, Inc. a consulting andsoftware company with offices in Houston, Austin and Philadelphia that specializes inprofit management and other decision automation software tools that help boost theoperating profits of their clients. In 1996, Mr. Anderson founded Acorn and pioneeredthis new time-based approach to ABC. He has written several white papers and articleson this and related subjects. Mr. Anderson is an alumnus of Harvard Business School(Baker Scholar) and McKinsey & Company. He also holds an engineering degree fromPrinceton University, and an accounting post-baccalaureate from University of Houston.He can be reached for advice at (610) 687-8400, x1002, or by e-mail atsanderson@acornsys.com. For additional information on this subject, visit AcornSystems at www.acornsys.com.17
Endnotes1The cases include Schrader Bellows (186-050), John Deere Component Works (A) and (B) (187-101 and –187-108), Siemens EMW (A) (191-006), and Kanthal (A) (190-002). Papers include R. Cooper“The Rise of <strong>Activity</strong>-<strong>Based</strong> <strong>Costing</strong>- Part One: What is an <strong>Activity</strong>-<strong>Based</strong> Cost System?” Journal of CostManagement (Summer 1988): 45-58; R. Cooper “The Rise of <strong>Activity</strong>-<strong>Based</strong> <strong>Costing</strong>- Part Two: When DoI Need an <strong>Activity</strong>-<strong>Based</strong> Cost System?” Journal of Cost Management (Fall 1988): 41-48; R. Cooper “TheRise of <strong>Activity</strong>-<strong>Based</strong> <strong>Costing</strong>- Part Three: How Many Cost Drivers Do You Need, and How Do YouSelect Them?” Journal of Cost Management (Winter 1989): 34-46; R. Cooper and R. S. Kaplan, “MeasureCosts Right: Make the Right Decisions,” Harvard Business Review (September-October 1988).2Steven Anderson “Should More Companies Practice their ABCs?” (September 1997)3C. Argyris and R. S. Kaplan, “Implementing New Knowledge: The Case of <strong>Activity</strong>-<strong>Based</strong><strong>Costing</strong>," Accounting Horizons (September 1994): 83-105.4Steven Anderson and Richard Drobner, “Innovative Approach to ABC Delivers Profound Insightinto Process Costs” (2002)5According to Acorn Systems, Inc., a simple calculation for database size is # activities x total #cost objects (e.g. line items) x # months = 150 x 600,000 x 24 = 2.16 billion items6Steven Anderson “Should More Companies Practice their ABCs?” (September 1997)7Robin Cooper and R. S. Kaplan "<strong>Activity</strong>-<strong>Based</strong> Systems: Measuring the Costs of ResourceUsage," Accounting Horizons (September 1992): 1-13; and “Measuring the Cost of Resource Capacity,”Chapter 7 in R. S. Kaplan and R. Cooper, Cost & Effect: Using Integrated Cost Systems to DriveProfitability and Performance (Boston: HBS Press, 1998): 111-136.8The modified approach was described in Chapter 14 of Cost & Effect: 296-299. It was alsodescribed by Acorn Systems in “Should More Companies Practice their ABCs?” (September 1997)9R. Cooper, “The Two-Stage Procedure in Cost Accounting: Part Two,” Journal of CostManagement (Fall 1997): 39-45.10If different amounts of resources are used each time an activity is performed, then even timeestimates (duration drivers) may not be adequate. In this case, an intensity driver that directly chargesresource cost for each incident of the activity may be required. See Kaplan and Cooper, Cost & Effect: 95-99, for discussion on the nature and trade-offs of transaction, duration, and intensity cost drivers.11Kaplan and Cooper, “Measuring the Cost of Resource Capacity,” Cost & Effect.12By assumption, the $560,000 of expenses are committed for the upcoming period; they are notexpected to vary based on the actual number of customer orders processed, complaints handled, or creditchecks performed13Steven Anderson “Should More Companies Practice their ABCs?” (September 1997)14Alternatively, at considerably higher expense, the company could have used a duration driver tomeasure the actual length of time required to perform each instance of the activity.15The company is Acorn Systems (www.acornsys.com) .16ID Magazine, April 7, 200318