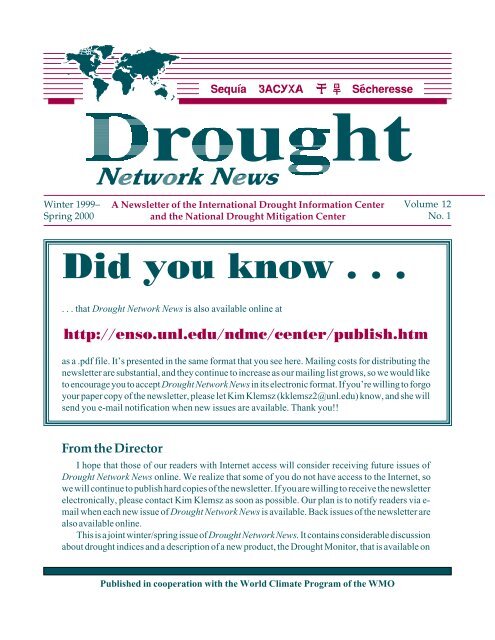
Did you know . . . - the National Drought Mitigation Center
Did you know . . . - the National Drought Mitigation Center
Did you know . . . - the National Drought Mitigation Center

Create successful ePaper yourself
Turn your PDF publications into a flip-book with our unique Google optimized e-Paper software.
<strong>the</strong> World Wide Web. This new product is <strong>the</strong> resultof a partnership formed in spring 1999 between <strong>the</strong>Joint Agricultural Wea<strong>the</strong>r Facility of <strong>the</strong> U.S. Departmentof Agriculture, <strong>the</strong> Climate Prediction <strong>Center</strong>of <strong>the</strong> <strong>National</strong> Oceanic and Atmospheric Administration,and <strong>the</strong> <strong>National</strong> <strong>Drought</strong> <strong>Mitigation</strong> <strong>Center</strong>at <strong>the</strong> University of Nebraska. The <strong>Drought</strong> Monitorintegrates climate information and information from avariety of indices to determine drought severity across<strong>the</strong> United States. This product is updated weekly andhas been well received by technical specialists, policymakers, <strong>the</strong> media, and commercial groups. I encouragereaders to visit <strong>the</strong> <strong>Drought</strong> Monitor website(http://enso.unl.edu/monitor/) to learn more aboutthis activity and to consider how this approach mightbe modeled for o<strong>the</strong>r countries or regions.As some of <strong>you</strong> <strong>know</strong>, for <strong>the</strong> past two years Ihave been involved in <strong>the</strong> preparation of a book ondrought. This book, <strong>Drought</strong>s: A Global Assessment,was published in two volumes in December 1999 byRoutledge as part of a series on natural hazards anddisasters. Routledge will eventually publish sevenbooks as part of this series. Ano<strong>the</strong>r volume, Storms,is also available, and a volume on floods should beavailable very soon. A more detailed description of<strong>Drought</strong>s is provided on page 21 of this issue.Readers are encouraged to submit articles, announcementsof workshops and conferences, ando<strong>the</strong>r information of interest to our network membersto <strong>Drought</strong> Network News. The deadline for submissionfor <strong>the</strong> next issue is May 25, 2000.Donald A. WilhiteContentsCharacteristics of <strong>Drought</strong> in Kerala, India ..................................................................................... 3Using <strong>the</strong> SPI to Identify <strong>Drought</strong> ................................................................................................... 6Revisiting <strong>the</strong> SPI: Clarifying <strong>the</strong> Process ..................................................................................... 13An Introduction to <strong>the</strong> <strong>Drought</strong> Monitor ....................................................................................... 15Announcements ............................................................................................................................ 212 Vol. 12, No. 1, Winter 1999–Spring 2000
Characteristics of <strong>Drought</strong> in Kerala, IndiaKerala state in India, which is <strong>the</strong> first area of <strong>the</strong>country to experience <strong>the</strong> southwest monsoon, has amoist and wet climate. Kerala is in <strong>the</strong> extremesouthwestern part of <strong>the</strong> Indian subcontinent; it bordersKarnataka state in <strong>the</strong> north, Tamil Nadu in <strong>the</strong>east, and <strong>the</strong> Arabian Sea in <strong>the</strong> west (Figure 1). Theentire state is one of <strong>the</strong> 35 meteorological subdivisionsin India.Kerala’s climate is tropical monsoon and tropicalsavanna, according to Koppen’s climatic classification(Figure 1). The state normally experiences excessiveseasonal rainfall, with hot summers (except in <strong>the</strong>extreme sou<strong>the</strong>rn districts like Trivandrum, wheredry season and hot summer climate prevails). Thethree main seasons of <strong>the</strong> state are <strong>the</strong> hot seasonK A R NCannanoreLakshadweep SeaTropical monsoon:Seasonally excessiverainfall, hot summerTropical savannah:Seasonally dry,hot summerAKozhikodeT AAlleppeyKKERALA100 80 60 40 20 0 100MalappuramTrichurAPalghatErnakulamKottayamQuilonTrivandrumIdukkiIndian OceanFigure 1. Climatic classification of Kerala.T A MI LN A DU(March–May), southwest monsoon season (May–September), and nor<strong>the</strong>ast monsoon season (October–February).The annual rainfall of <strong>the</strong> state varies from 3,800mm over <strong>the</strong> north to 1,800 mm in <strong>the</strong> extreme south.The potential rainy season for Kerala is <strong>the</strong> southwestmonsoon period, which contributes more than 80%of <strong>the</strong> annual rainfall. The monsoon rain decreasesfrom <strong>the</strong> north to <strong>the</strong> south. In recent years, a trend ofdecreasing rainfall has been seen both in seasonalrainfall and 10-day extreme rainfall duration.There is significant rainfall variation in north andsouth Kerala. North and south Kerala have tworainfall distribution subzones. In north Kerala, nor<strong>the</strong>astmonsoon rainfall shows a decreasing trend andcontributes about 15% of <strong>the</strong> annual rainfall. Thismay adversely affect cultivation of <strong>the</strong> second ricecrop in <strong>the</strong> area. Southwest monsoon rain, whichcontributes 82% of <strong>the</strong> area’s total rainfall, does notshow any increasing trend. Similarly, in south Kerala,southwest and nor<strong>the</strong>ast monsoon rains have decreasedby 5% and 8.3%, respectively. Mean annualrainfall is also decreasing in south Kerala.The decreasing rainfall over <strong>the</strong> region, late onsetof <strong>the</strong> monsoon, failure of <strong>the</strong> monsoon, and break in<strong>the</strong> monsoon in <strong>the</strong> state lead to many drought situations.Kerala had severe dry spells and droughts in1983, 1985, 1986, and 1987, even though <strong>the</strong> statehas a wet climate. There were dry spells of 5 and 4weeks in 1985 and 1986, respectively, during <strong>the</strong>southwest monsoon period.Damage due to drought was particularly significantin Kerala in 1987. About 1,500 villages in 14districts were affected, and 9.82 lakh 1 hectares ofcropland and 6 lakh cattle were also affected. DuringJanuary–May 1987, <strong>the</strong> entire Kerala region wasaffected by drought. About 30% of <strong>the</strong> rabi season11 lakh = 100,000<strong>Drought</strong> Network News3
paddy crop was lost, and cash crops like coconuts,arcanuts, cashews, and bananas were damaged, resultingin a loss of Rs. 1,000 crores.Kerala also experienced a significant drought in1983. About 323,000 hectares of paddy were lost, atan estimated cost of Rs. 106.86 crores. O<strong>the</strong>r majorcash crops affected were coconuts, rubber, coffee,and tea. In Ernakulam district of Kerala, 36,000hectares of paddy were lost; in Tiruchur, 33,000hectares were lost. Coconut losses of Rs. 14 croresand Rs. 11 crores were reported in Kozikode andTrivandrum districts and Kottayam district, respectively.In 1989, drought resulted in <strong>the</strong> loss of 60% of<strong>the</strong> cropped area in Kerala, and about 3 millionkilograms of tea, worth one crores rupees, wi<strong>the</strong>redunder stress and drought.Figure 2 shows <strong>the</strong> departure of seasonal rainfallfrom normal for different years (1981–87) in <strong>the</strong>region. Summer rains were deficient (-80%) in 1983.The southwest monsoon was about 40% of normalduring 1989 in <strong>the</strong> state. Similarly, <strong>the</strong> nor<strong>the</strong>astmonsoon was highly deficient in 1986. Large rainfalldeficiencies in <strong>the</strong> various districts of <strong>the</strong> state areshown in Table 1. Figures 3a–3c reveal large waterdeficits in almost all of <strong>the</strong> representative stationsduring December to April. The seasonal dry periodand water deficits led to severe dry spells and droughts.Departure from Normal (%)40200-20-40-60Summer RainSW MonsoonNE Monsoon-801981 1982 1983 1984 1985 1986 1987Districts 1983 1984 1985 1986 1987Alleppey 21 -17 -5 -26 -17Cannanore -5 -2 1 -15 -35Ernakulam 16 9 1 19 -24Idukki -20 -3 1 1 -45Kasargode NA -3 -14 -8 -33Kottayam -28 -15 -14 -15 -28Kozikode 15 -7 -5 -14 -43Mallapuram 12 19 -7 -18 -50Palghat 17 4 2 -8 -48Pattinamathi. NA -24 -21 -35 -50Quilon 29 -18 -5 -21 -29Trichur 2 -4 -5 -25 -23Trivandrum -22 -57 -29 -44 -37Wayanad -16 9 -18 -31 -68Table 1. Percentage departure of rainfall from normal fordistricts of Kerala.The low pressure waves from <strong>the</strong> east (<strong>the</strong> Gulf ofThailand), which move across <strong>the</strong> South Bay ofBengal toward Tamil Nadu, may temporarily increaserainfall over Kerala. Also, an upper troposphericeasterly jet stream with an axis of 12°N isbelieved to influence <strong>the</strong> rainfall over <strong>the</strong> state. However,a detailed study is needed to determine this.During weak monsoons and droughts in Kerala,<strong>the</strong> orographic contribution is almost nil, but this is notattributed to a weaker westerly component during <strong>the</strong>dry spell. The Nepha (or cloud) analysis from satellitepictures over Kerala also gives good informationabout drought. During 1966, a year of weak monsoonsand drought, satellite pictures showed a zone ofcloudiness shifting far into sou<strong>the</strong>rn India. Duringdrought situations over <strong>the</strong> state, <strong>the</strong>re is no high-levelmoving system of waves in <strong>the</strong> upper troposphericeasterlies.During <strong>the</strong> drought of 1966, high-level waveflows were more or less straight easterly flows withless speed variation than in a good strong monsoonseason. Cloud analysis during active and strong monsoonssuch as occurred in 1967 shows at least 7 oktasof cloudiness on any given day over <strong>the</strong> state, extendingfrom <strong>the</strong> interior of <strong>the</strong> sou<strong>the</strong>rn peninsula acrossFigure 2. Precipitation departure from normal for Kerala,1981–87.4 Vol. 12, No. 1, Winter 1999–Spring 2000
Water Deficit (mm)180160140120100806040Rainfall20PET0Dec. Jan. Feb. Mar. Apr.Figure 3a. Seasonal water deficit, Alleppey, Kerala.Kerala southward and westward (1,200 km from <strong>the</strong>Kerala coast of <strong>the</strong> Arabian Sea). There is also asecondary maxima of 7 oktas of cloudiness south of<strong>the</strong> equator. This type of situation did not exist during<strong>the</strong> 1966 drought over <strong>the</strong> state. Thus cloud analysisand orographic rainfall patterns may give a goodindication of <strong>the</strong> drought situation in a wet state likeKerala.K. K. NathanWater Technology CentreIndian Agricultural Research InstituteNew Delhi 110 012IndiaWater Deficit (mm)25020015010050RainfallPET0Dec. Jan. Feb. Mar. Apr.Figure 3b. Seasonal water deficit, Palghat, Kerala.Water Deficit (mm)20015010050RainfallPET0Dec. Jan. Feb. Mar. Apr.Figure 3c. Seasonal water deficit, Calicut, Kerala.<strong>Drought</strong> Network News5
Using <strong>the</strong> SPI to Identify <strong>Drought</strong>This article was written in response to <strong>the</strong> recentanalysis of drought in Turkey by Komuscu (1999).The study showed <strong>the</strong> relationship between droughtduration, drought frequency, and drought time scaleusing <strong>the</strong> Standardized Precipitation Index (SPI):whereSPI = (X ik- X i)ó ió i= standardized deviation for <strong>the</strong> ith stationX ik= precipitation for <strong>the</strong> ith station and kth observationX i= mean precipitation for <strong>the</strong> ith stationThe index has <strong>the</strong> advantages of being easilycalculated, having modest data requirements, andbeing independent of <strong>the</strong> magnitude of mean rainfalland hence comparable over a range of climatic zones.It does, however, assume <strong>the</strong> data are normally distributed,and this can introduce complications forshorter time periods. Komuscu claims that <strong>the</strong> SPI hasnot been widely applied or tested and employs <strong>the</strong>drought classes suggested by McKee et al. (1995),reproduced here in Table 1.The SPI is of course <strong>the</strong> same as <strong>the</strong> StandardizedRainfall Anomaly, defined by Jones and Hulme(1996) and widely used in <strong>the</strong> analysis of desiccationin drylands. Figure 1 shows a typical example of suchuse, depicting <strong>the</strong> widely reported downward trend inSahelian rainfalls (only continental Sahelian stationsare employed after <strong>the</strong> suggestions of Ba et al. [1995],Janicot et al. [1998], and Nicholson and Palao [1993]that o<strong>the</strong>r parts of West Africa belong to a differentclimate regime). Komuscu’s assertion that <strong>the</strong> SPI isunderused for drought assessment appears to becorrect, in that it is <strong>the</strong> persistence of <strong>the</strong> negativeanomalies that receives most attention ra<strong>the</strong>r than anexamination of <strong>the</strong>ir intensity or impact (for example,see Hulme, 1992). That is, rainfall anomalies are usedto investigate desiccation ra<strong>the</strong>r than drought (seeAgnew, 1995, for fur<strong>the</strong>r discussion). The purpose ofthis paper is <strong>the</strong>n to question <strong>the</strong> values assigned to <strong>the</strong>SPI for drought classes and to suggest alternative,more rational thresholds. The effect of using differentdrought classes is investigated using annual rainfallsfrom <strong>the</strong> Sahelian region of West Africa, and <strong>the</strong>SPI Probability Komuscu (1999) and Proposed newof occurrence McKee et al. (1995) drought classesdrought classesLess than -2.00 0.023 Extreme droughtLess than -1.65 0.050 Extreme droughtLess than -1.50 0.067 Severe droughtLess than -1.28 0.100 Severe droughtLess than -1.00 0.159 Moderate droughtLess than -0.84 0.201 Moderate droughtLess than -0.50 0.309 No droughtLess than 0.00 0.500 Mild drought No droughtTable 1. Probabilities for different standardized rainfall anomalies.6 Vol. 12, No. 1, Winter 1999–Spring 2000
21.5Standardized Rainfall Anomaly10.50-0.5-1-1.5-21930 1940 1950 1960 1970 1980 1990Figure 1. Standardized annual precipitation anomalies for <strong>the</strong> continental Sahel (Burkina Faso, Mali, and Niger), using <strong>the</strong>1961–90 base period.problem of changing <strong>the</strong> base averaging periods ispresented.What is Meteorological <strong>Drought</strong>?This question has been addressed time and again(Agnew and Anderson, 1992; Wilhite, 1993), and ithas often been stated that no universal definition ofdrought exists. There is little to be gained by reproducinga long list of conflicting definitions that merelyillustrate <strong>the</strong> diverse interests of those who investigatedrought. Most definitions anyway can be resolvedinto a generic statement that drought is caused by animbalance between water supply and demand. Hencedrought can be defined in terms of both supplyreduction and demand increase, and <strong>the</strong>re are numerousdefinitions of hydrological, agricultural, ecological,and economic drought that demonstrate this.Many, however, agree with Palmer (1965) and Beranand Rodier (1985) that drought is essentially a meteorologicalphenomenon. The analysis below adoptsthis perspective—that examining <strong>the</strong> occurrence ofmeteorological drought is <strong>the</strong> most fundamental requirementof any investigation.The second premise of this account is that droughtis an abnormal occurrence. This is an equally importantpoint and it is <strong>the</strong> reason why it is suggested thatTable 1 should not be used without modification fordrought analysis. In McKee’s classification (McKeeet al., 1995), all negative indexes (SPI) are taken toindicate <strong>the</strong> occurrence of drought; this means for50% of <strong>the</strong> time, drought is occurring. This is clearlynonsense! It also raises <strong>the</strong> notion of “persistent<strong>Drought</strong> Network News7
drought,” which confuses drought with desiccation.Based on Warren and Khogali (1992), droughtcan be distinguished from desiccation as follows:• <strong>Drought</strong> occurs when moisture supply is abnormallybelow average for periods of up to 2 years.• Desiccation is a period of aridization broughtabout by climate change lasting decades. Thusdrought requires short-term relief, whereas desiccationrequires longer-term measures such asresettlement and land use change.When desiccation takes place, one can expect anincrease in drought frequency, but a definition ofdrought that assumes any precipitation below <strong>the</strong>mean constitutes a drought will lead to exaggeratedclaims for climate change. Better that drought isdefined as an abnormal event and that a significantchange in climate is required for drought to becomepersistent.New SPI Intensity ClassesThe occurrence of drought has been widely reportedfor sou<strong>the</strong>rn England in <strong>the</strong> 1990s, giving riseto concerns about low flows in <strong>the</strong> rivers of <strong>the</strong> region(Marsh et al., 1994; Acreman and Adams, 1998):The Environment Agency reported today that groundwaterlevels are so low in South East England that <strong>the</strong>environment and water supplies will be at risk nextyear if <strong>the</strong> wea<strong>the</strong>r remains drier than average thiswinter. (Env. Agency Press Release 04/11/1997:113/97)Approaches to <strong>the</strong> definition of low flows can bedivided into those that examine flow statistics, thosethat model hydrological processes, and those thatemploy biological/habitat conditions. Procedures forlow flow estimation in gauged and ungaugedcatchments have been produced for <strong>the</strong> United Kingdomby <strong>the</strong> Institute of Hydrology (Gustard et al.,1.41.21Cumecs0.80.60.40.2019751980 1985 1990 1995 2000Gade Bulb . Gade Q95 Bulb. Q95Figure 2. Daily flows for <strong>the</strong> Bulbourne and Gade rivers in Hertfordshire, with low flow thresholds Q95 plotted.8 Vol. 12, No. 1, Winter 1999–Spring 2000
90Percentage Occurrence80706050403020100ExtremeSevereModerateMildNo <strong>Drought</strong>AgnewMcKeeFigure 3. <strong>Drought</strong> classes (McKee et al., 1995, and author) for annual rainfalls in <strong>the</strong> continental Sahel region between 1931and 1990, based on <strong>the</strong> 1961–90 averaging period.1992). Claussen (1995) summarized <strong>the</strong> statisticalapproaches for low flow determination in gaugedcatchments:• 7-day minimum (annual and 10-year minimum)• 1-day minimum (median annual)• 90% and 95% percentile exceedance• Base flow index (ratio of baseflow to total flow)The Q95(1) (<strong>the</strong> 95 percentile from <strong>the</strong> 1-dayflow duration curve) is commonly used and is calculatedhere for two drought-prone rivers, <strong>the</strong> Gade and<strong>the</strong> Bulbourne, which flow in catchments some 40km north of London. The Environment Agency(1997, p. 54) described conditions in this region:The cause of low flows in rivers is attributable to acombination of factors, which include lack of rainfall. . . seasonal fluctuations in <strong>the</strong> chalk water table, andwater abstraction . . . Over <strong>the</strong> period October 1996 toSeptember 1997, rainfall and groundwater rechargein <strong>the</strong> East Chilterns [were] 88% and 51% of <strong>the</strong> longtermaverage respectively.Figure 2 shows <strong>the</strong> 1990s increase in low flows in<strong>the</strong>se rivers and <strong>the</strong> use of <strong>the</strong> Q95 threshold todemarcate abnormal deficits (curiously, annual rainfallshave been increasing in this region during <strong>the</strong>20 th century, but <strong>the</strong> winter to summer rainfall ratiohas also increased, as low rainfalls in summer are nowmore frequent). It is suggested that climatologistsshould learn from <strong>the</strong>ir hydrologist colleagues andemploy a threshold similar to Q95 for defining meteorologicaldrought.The SPI drought thresholds recommended here<strong>the</strong>refore correspond to 5%, 10%, and 20% probabilities.Hence drought is only expected 2 years in 10 andextreme drought only 1 year in 20. This, it is believed,is a more realistic drought frequency than that used byKomuscu, and it corresponds to <strong>the</strong> employment of<strong>the</strong> term abnormal occurrence, as used in o<strong>the</strong>rbranches of environmental science.The impacts of changing <strong>the</strong> drought class boundariesare exemplified in Figure 3, based on <strong>the</strong> dataused to draw Figure 1. It is evident that little changeis made for extreme drought conditions, but <strong>the</strong> mostimportant effect is to reduce <strong>the</strong> incidence of mildmeteorological droughts. It may seem curious that<strong>the</strong>re are a large number of no-drought years (68% or86% for McKee et al. [1995] or <strong>the</strong> author’s classes,respectively) given <strong>the</strong> widespread reports of drought<strong>Drought</strong> Network News9
<strong>Drought</strong> McKee et al. 1961–90 1931–60 Agnew 1961–90 1931–60class (1995) base period base period base period base periodSPI value McKee McKee SPI value Agnew AgnewExtreme
765Standardized Rainfall Anomaly43210-1-2-3-4-5-6-71930 1940 1950 1960 1970 1980 1990Mean Max MinFigure 4. Average standardized precipitation anomalies for <strong>the</strong> continental Sahel using <strong>the</strong> 1961–90 base averaging periodand <strong>the</strong> maximum and minimum anomalies observed at individual stations.through time. Hence purely statistical definitions ofmeteorological drought should be treated with caution.Perhaps of equal significance is <strong>the</strong> omissionwithin <strong>the</strong> SPI of any assessment of persistence. It israre that drought in any one year causes major hardship.It is <strong>the</strong> sequence of low rainfalls that createsdifficulties. For example, in England <strong>the</strong> drought of1976 was really caused by <strong>the</strong> low rainfalls in <strong>the</strong>preceding year, while <strong>the</strong> drought of 1992 was <strong>the</strong>result of <strong>the</strong> low rainfalls from 1988. The SPI <strong>the</strong>reforeneeds to be developed from merely classifyingintensities to include drought sequences, and <strong>the</strong>selection of appropriate averaging periods needs moreattention.Ac<strong>know</strong>ledgmentsThe annual rainfall totals were generously providedby <strong>the</strong> Climate Research Unit at <strong>the</strong> University of EastAnglia. The river flow data was provided by <strong>the</strong>Environment Agency, United Kingdom.C. T. AgnewDepartment of GeographyUniversity College London26 Bedford WayLondonWC1H OAPUnited KingdomReferencesAcremen, M.; and B. Adams. 1998. Low Flows, Groundwaterand Wetland Interactions. Vol. 1, Issues Report to <strong>the</strong><strong>Drought</strong> Network News11
Environment Agency, UKWR and NERC. Institute of Hydrology,Wallingford, UK.Agnew, C. T. 1995. “Desertification, drought and developmentin <strong>the</strong> Sahel.” In A. Binns, ed. People and Environmentin Africa; pp. 137–149. J. Wiley & Sons, Chichester, UK.Agnew, C. T.; and E. Anderson. 1992. Water Resources in <strong>the</strong>Arid Realm. Routledge, London.Agnew, C. T.; and A. Chappell. 1999. “<strong>Drought</strong> in <strong>the</strong> Sahel.”Submitted to GeoJournal.Ba, M. B.; R. Frouin; and S. E. Nicholson. 1995. “Satellitederived interannual variability of West African rainfallduring 1983–88.” Journal of Applied Meteorology 34:411–431.Beran, M. A.; and J. A. Rodier. 1985. Hydrological Aspects of<strong>Drought</strong>. Studies and Reports in Hydrology 39. UNESCO-WMO, Geneva.Claussen, B. 1995. “Discharge data collection and analysisstrategies in low flow studies.” Nordic Hydrology 26:191–204.D’Amato, N.; and T. Lebel. 1998. “On <strong>the</strong> characteristics of <strong>the</strong>rainfall events in <strong>the</strong> Sahel with a view to <strong>the</strong> analysis ofclimatic variability.” International Journal of Climatology18:955–974.Downing, T. 1992. Climate Change and Vulnerable Places.Research Report No. 1. Environmental Change Unit, OxfordUniversity, Oxford, UK.Environment Agency. 1997. Local Environment Agency Plan,Colne consultation report. E. A. Thames region, Reading,UK.Gustard, A.; A. Bullock; and J. M. Dixon. 1992. Low FlowEstimation in <strong>the</strong> U.K. IH Report 108. Institute of Hydrology,Wallingford, UK.Hulme, M. 1992. “Rainfall changes in Africa.” InternationalJournal of Climatology 12:685–699.Janicot, S.; A. Harzallah; B. Fontaine; and V. Moron. 1998.“West African monsoon dynamics and eastern equatorialAtlantic and Pacific SST anomalies (1970–88).” Journal ofClimate 11:1,874–1,882.Jones, P. D.; and M. Hulme. 1996. “Calculating regionalclimatic time series for temperature and precipitation: Methodsand illustrations.” International Journal of Climatology16:361–377.Komuscu, A. U. 1999. “Using <strong>the</strong> SPI to analyze spatial andtemporal patterns of drought in Turkey.” <strong>Drought</strong> NetworkNews 11(1):7–13.Marsh, T. J.; R. A. Monkhouse; N. W. Arnell; M. L. Lees; andN. S. Reynard. 1994. The 1988–92 <strong>Drought</strong>. HydrologicalData UK Series. Institute of Hydrology, Wallingford, UK.McKee, T. B.; N. J. Doesken; and J. Kleist. 1995. “<strong>Drought</strong>monitoring with multiple time scales.” Proceedings of <strong>the</strong>Ninth Conference on Applied Climatology; pp. 233–236.American Meteorological Society, Boston.Nicholson, S. E.; and I. M. Palao. 1993. “A re-evaluation ofrainfall variability in <strong>the</strong> Sahel.” International Journal ofClimatology 13:371–389.Palmer, W. C. 1965. Meteorological <strong>Drought</strong>. Research Paper45. U.S. Wea<strong>the</strong>r Bureau, Washington, D.C.Warren, A.; and M. Khogali. 1992. Assessment of Desertificationand <strong>Drought</strong> in <strong>the</strong> Sudan–Sahelian Region 1985–1991. UNSO, New York.Wilhite, D. A. 1993. “The enigma of drought.” In D. A. Wilhite,ed. <strong>Drought</strong> Assessment, Management, and Planning: Theoryand Case Studies; pp. 3–15. Kluwer Academic Publishers,Boston, Dordrecht, and London.12 Vol. 12, No. 1, Winter 1999–Spring 2000
Revisiting <strong>the</strong> SPI: Clarifying <strong>the</strong> ProcessThe number of applications using <strong>the</strong> StandardizedPrecipitation Index (SPI) around <strong>the</strong> world continuesto increase (e.g., Agnew, pp. 6–12 of thisnewsletter, and Komuscu 1999). However, <strong>the</strong>re arerelatively few publications explaining <strong>the</strong> SPI, andoccasional misconceptions about <strong>the</strong> index have occurred.When <strong>the</strong> SPI was first developed by McKee etal. (1993, 1995), it was meant to address some of <strong>the</strong>limitations that exist within <strong>the</strong> Palmer <strong>Drought</strong> Index(PDI). These first publications were relatively simpleintroductions of <strong>the</strong> SPI to <strong>the</strong> scientific community,appearing in <strong>the</strong> Proceedings of <strong>the</strong> Eighth and NinthApplied Climatology Conferences, respectively,sponsored by <strong>the</strong> American Meteorological Society.In both cases, <strong>the</strong> authors define <strong>the</strong> SPI as <strong>the</strong>“difference of precipitation from <strong>the</strong> mean...dividedby <strong>the</strong> standard deviation.” It is this equation, givenby Komuscu (1999) and repeated by Agnew, thatcauses confusion about <strong>the</strong> SPI.Agnew is correct to point out that <strong>the</strong> “differenceof precipitation from <strong>the</strong> mean divided by <strong>the</strong> standarddeviation” standardizes <strong>the</strong> data and has beencalled <strong>the</strong> “Standardized Rainfall Anomaly” by Jonesand Hulme (1996). Variations of standardized rainfallanomalies have been used with data sets, especiallyanalyzing African rainfall. It is important topoint out, however, that this is not <strong>the</strong> SPI! There is adifference between standardizing precipitation datausing <strong>the</strong> equation above and <strong>the</strong> SPI, and it is easy tomiss this difference. In <strong>the</strong> cases of McKee et al.(1993, 1995) and Komuscu (1999), <strong>the</strong> authors brieflymention that <strong>the</strong> long-term data sets used to determine<strong>the</strong> SPI at any time scale must first be normalized.Readers of <strong>the</strong>se articles may overlook this step. Thenormalization procedure using a probability distributionis a very important feature of <strong>the</strong> SPI and makesit unique. Edwards and McKee (1997) first highlightthis important distinction and give a detailed descriptionof how this is done for <strong>the</strong> SPI. People willfrequently ask, “What is <strong>the</strong> equation of <strong>the</strong> SPI?”Edwards and McKee (1997) illustrate that it is moreof a “process” to determine an SPI value.In 1998, Guttman wrote an article comparing <strong>the</strong>SPI with <strong>the</strong> PDI that contained a more detailedexplanation about determining <strong>the</strong> SPI. Hayes et al.(1999) also contains a detailed description of <strong>the</strong>process. Guttman (1999) went into <strong>the</strong> specificsabout different probability distributions applied to <strong>the</strong>long-term data sets and examined <strong>the</strong> impact of sixdistributions on <strong>the</strong> SPI. The recommendation fromGuttman (1999) is that <strong>the</strong> Pearson Type III distributionis “best” suited to normalize <strong>the</strong> long-term datasets when calculating <strong>the</strong> SPI. Edwards and McKee(1997) used <strong>the</strong> two-parameter gamma distribution tocalculate <strong>the</strong> SPI. Guttman (1999) also recommendedthat <strong>the</strong> procedure be uniform for everyone so thatapplications of <strong>the</strong> SPI would be consistent. Differentsoftware versions to determine <strong>the</strong> SPI are nowavailable from Colorado State University and <strong>the</strong><strong>National</strong> Climatic Data <strong>Center</strong>.Agnew makes ano<strong>the</strong>r very good point aboutidentifying appropriate drought categories, and pointsout that <strong>the</strong> initial categories identified in <strong>the</strong> originalMcKee et al. (1993, 1995) articles had a location forany time period in some stage of “drought” 50% of <strong>the</strong>time. Table 1 below shows <strong>the</strong> NDMC modificationsto <strong>the</strong> categories identified by Agnew in his table onp. 6 of this issue. The term dry is used because that ismore appropriate for short time scales, and <strong>the</strong> categoriesreflect <strong>the</strong> lower percentages that should occurwith dry periods, especially with <strong>the</strong> labels severe andextreme. These categories are also <strong>the</strong> basis for <strong>the</strong>monthly national SPI maps that are displayed on <strong>the</strong><strong>National</strong> <strong>Drought</strong> <strong>Mitigation</strong> <strong>Center</strong>’s website (http://enso.unl.edu/watch/). Guttman (1999) uses <strong>the</strong> samecategories. The Western Regional Climate <strong>Center</strong>2.0 + extremely wet1.5 to 1.99 very wet1.0 to 1.49 moderately wet-.99 to .99 near normal-1.0 to -1.49 moderately dry-1.5 to -1.99 severely dry-2 and less extremely dryTable 1. SPI values.<strong>Drought</strong> Network News13
uses a slightly different set of categories in monthlynational SPI maps displayed on <strong>the</strong>ir website (http://www.wrcc.sage.dri.edu/spi/spi.html). Finally, Agnewsuggested <strong>the</strong> classification of categories based on <strong>the</strong>5%, 10%, and 20% occurrence probabilities, which isalso a very good system (see Agnew’s second tableon p. 10 of this issue).In his article, Agnew brings up ano<strong>the</strong>r importantpoint that needs to be emphasized. Precipitationnormals do shift at all locations depending on <strong>the</strong>period being considered “normal.” Such shifts wouldcertainly have an impact when standardizing precipitationdata, but <strong>the</strong>y also can affect <strong>the</strong> SPI. This iswhy it is hoped that <strong>the</strong> data sets of 100 years, or aslong as possible, could be used in determining <strong>the</strong> SPI.Guttman (1999) recommends at least 50 years of datato compute SPI values for time periods smaller than 12months, and a longer record to compute multiyear SPIvalues is desired.Finally, Agnew reminds everyone that indicesbased on precipitation alone do not take into accountspecific drought impacts. These impacts will varybased on <strong>the</strong> vulnerability of <strong>the</strong> society and environmentof each particular region. The SPI and o<strong>the</strong>rindices are only tools to help decision makers understandevents that are taking place. It is good to haveone or more of <strong>the</strong>se tools, but <strong>the</strong> decision makershave to become familiar with how to apply <strong>the</strong>se toolsand understand <strong>the</strong>ir strengths and limitations in localsituations.The articles by Komuscu (1999) and Agnewdemonstrate that <strong>the</strong> number of drought monitoringapplications using precipitation indices is increasing.We welcome <strong>the</strong> discussion of indices and <strong>the</strong>irapplications in future issues of <strong>Drought</strong> NetworkNews. It is very important that this information relatingto “lessons learned” from a drought monitoring perspectiveis shared with <strong>the</strong> drought planning community.ReferencesEdwards, D. C.; and T. B. McKee. 1997. “Characteristics of20th century drought in <strong>the</strong> United States at multiple timescales.” Climatology Rep. 97–2, Department of AtmosphericScience, Colorado State University, Fort Collins,Colorado.Guttman, N. B. 1998. “Comparing <strong>the</strong> Palmer <strong>Drought</strong> Indexand <strong>the</strong> Standardized Precipitation Index.” Journal of <strong>the</strong>American Water Resources Association 34(1):113–21.Guttman, N. B. 1999. “Accepting <strong>the</strong> Standardized PrecipitationIndex: A calculation algorithm.” Journal of <strong>the</strong> AmericanWater Resources Association 35(2):311–22.Hayes, M. J.; M. D. Svoboda; D. A. Wilhite; and O. V.Vanyarkho. 1999. “Monitoring <strong>the</strong> 1996 drought using <strong>the</strong>Standardized Precipitation Index.” Bulletin of <strong>the</strong> AmericanMeteorological Society 80(3):429–438.Jones, P. D.; and M. Hulme. 1996. “Calculating regionalclimatic time series for temperature and precipitation:Methods and illustrations.” International Journal of Climatology16:361–377.Komuscu, A. U. 1999. “Using <strong>the</strong> SPI to analyze spatial andtemporal patterns of drought in Turkey.” <strong>Drought</strong> NetworkNews 11(1):7–13.McKee, T. B.; N. J. Doesken; and J. Kleist. 1993. “The relationof drought frequency and duration to time scales.”Proceedings of <strong>the</strong> Eighth Conference on AppliedClimatology; pp. 179–84. American MeteorologicalSociety, Boston.McKee, T. B.; N. J. Doesken; and J. Kleist. 1995. “<strong>Drought</strong>monitoring with multiple time scales.” Proceedings of <strong>the</strong>Ninth Conference on Applied Climatology; pp. 233–236.American Meteorological Society, Boston.Michael Hayes<strong>National</strong> <strong>Drought</strong> <strong>Mitigation</strong> <strong>Center</strong>239 L. W. Chase HallUniversity of Nebraska–LincolnLincoln, Nebraska 68583–0749USAe-mail: mhayes2@unl.edu14 Vol. 12, No. 1, Winter 1999–Spring 2000
An Introduction to <strong>the</strong> <strong>Drought</strong> MonitorOriginsThe idea of better monitoring and assessing droughthas been a quest of NDMC director Don Wilhite formore than two decades. He has been an advocate ofbetter climate monitoring, particularly drought monitoring,because drought is a normal, recurring hazardin virtually all of <strong>the</strong> United States. The challenge isto recognize drought, a slow-onset or “creeping”natural disaster, before a region is in <strong>the</strong> middle ofone.The most recent surge in interest in drought aroseduring <strong>the</strong> 1995–96 drought in <strong>the</strong> Southwest andsou<strong>the</strong>rn Great Plains states. At <strong>the</strong> NDMC wediscussed how we could do a better job of trackingand assessing <strong>the</strong> severity of droughts. One questionwe often hear is “How does this drought compare, orrank, to o<strong>the</strong>r droughts or <strong>the</strong> drought of record forthis region or state?” Or “Just how strong or severe isthis drought?” These are complicated questions totackle. We have to take into account spatial extent,intensity, duration, and impacts on people and <strong>the</strong>affected environment. That discussion is for ano<strong>the</strong>rtime.For purposes of understanding vulnerability orrisk, ano<strong>the</strong>r question we have tried to address is“What is <strong>the</strong> degree of usualness or unusualness ofvarious droughts now and in <strong>the</strong> past?” How frequentlyor rarely do we see a drought of this magnitude,and does it occur often enough that we shouldplan for it ra<strong>the</strong>r than simply ac<strong>know</strong>ledge it when itoccurs? In short, can we define <strong>the</strong> difference betweenperception and reality? Our hope is that <strong>the</strong><strong>Drought</strong> Monitor and future research will begin to letus find some of <strong>the</strong> answers to <strong>the</strong>se questions.Until recently, <strong>the</strong>re were no comprehensive nationwideefforts to consolidate or centralize droughtmonitoring activities being conducted by or betweenvarious federal, state, or regional entities. In <strong>the</strong>summer of 1998, I began to correspond with DougLeComte, senior meteorologist with <strong>the</strong> <strong>National</strong><strong>Center</strong>s for Environmental Prediction/Climate Prediction<strong>Center</strong> (NCEP/CPC), who shared his ideaswith us on how we might come up with a classificationsystem for droughts, much in <strong>the</strong> same way <strong>the</strong>Fujita Tornado Intensity Scale (F0–F5) categorizestornadoes and <strong>the</strong> Saffir-Simpson Hurricane System(Category 1–5) rates hurricane strength. Based onLeComte’s first draft, and with <strong>the</strong> help of o<strong>the</strong>rs, weworked on a classification scheme criteria, and as aresult <strong>the</strong> <strong>Drought</strong> Monitor was created.In spring 1999, Don Wilhite and I met withscientists at <strong>the</strong> U.S. Department of Agriculture’sJoint Agricultural Wea<strong>the</strong>r Facility (USDA/JAWF)and <strong>the</strong> <strong>National</strong> Oceanic and AtmosphericAdministration’s Climate Prediction <strong>Center</strong> (NOAA/CPC) to discuss working toge<strong>the</strong>r to address <strong>the</strong> issueof tracking drought. How could we better collaborateand implement an integrated drought monitoringsystem? The signing of <strong>the</strong> <strong>National</strong> <strong>Drought</strong> PolicyAct in <strong>the</strong> summer of 1998 and <strong>the</strong> subsequentformation of <strong>the</strong> <strong>National</strong> <strong>Drought</strong> Policy Commission(NDPC) and its working groups in 1999 nodoubt helped speed up <strong>the</strong> process and fueled interestin such an effort. Monitoring and Prediction was oneof <strong>the</strong> NDPC working groups. Many of <strong>the</strong> keyplayers in <strong>the</strong> climate monitoring realm were exposedto <strong>the</strong> <strong>Drought</strong> Monitor concept and initial prototypesthrough this working group. We introduced <strong>the</strong>drought classification system to <strong>the</strong>m and welcomed<strong>the</strong> many suggestions that followed in this informalpeer review process.As a result of <strong>the</strong> meetings in spring 1999, anagreement was reached between <strong>the</strong> NDMC, USDA,and NOAA to produce and maintain a drought monitoringproduct that would incorporate climatic dataand professional input from all levels. Requests forinput were initially sent out to <strong>National</strong> Wea<strong>the</strong>rService field offices. This was followed up by contactingNOAA’s six regional climate centers (RCCs).We have invited state climatologists to comment onand review <strong>the</strong> weekly product (both map and narrative).Our intent was to create a general assessment ofdrought conditions in <strong>the</strong> United States using <strong>the</strong> most<strong>Drought</strong> Network News15
elevant and current data that each entity involved hadto offer. The selected data were <strong>the</strong>n put into anexperimental product using a new drought classificationsystem approach. The first experimental droughtmap was put out for internal review and comment inMay 1999. An e-mail exploder group was set up andis maintained at <strong>the</strong> NDMC. This allows all reviewersand authors of <strong>the</strong> product to discuss and share <strong>the</strong>irrelevant expertise, viewpoints, and concerns.The experimental tag was short-lived. The<strong>Drought</strong> Monitor quickly evolved into a more permanentproduct as a result of <strong>the</strong> efficient partnershipsbetween USDA, NOAA, NDMC, RCCs, and a fewstate climatologists. No doubt <strong>the</strong> drought in <strong>the</strong>Nor<strong>the</strong>ast in summer 1999 provided an extra incentivefor <strong>the</strong> map. The <strong>Drought</strong> Monitor was officiallylaunched at a joint White House press conferencebetween <strong>the</strong> Department of Commerce (NOAA) andUSDA in August 1999. The <strong>Drought</strong> Monitor hadgone from an experimental bi-weekly map to a fullfledgedoperational product in a few months. With <strong>the</strong>support of USDA’s chief meteorologist, <strong>the</strong> <strong>National</strong><strong>Drought</strong> <strong>Mitigation</strong> <strong>Center</strong> at <strong>the</strong> University of Nebraska–Lincolnagreed to set up and maintain <strong>the</strong>home page for <strong>the</strong> <strong>Drought</strong> Monitor (http://enso.unl.edu/monitor/monitor.html).Since its unveiling, <strong>the</strong> <strong>Drought</strong> Monitor has beenwell received by people from a wide variety ofbackgrounds and trades. The media has been especiallyquick to pick up on and use <strong>the</strong> new product toinform <strong>the</strong>ir readers and listeners. Producers, commoditybrokers, congressional delegations, and federal/stateagencies also are using this product. Theyseem to like <strong>the</strong> simplicity and ease of use of <strong>the</strong>product (see Figure 1), ra<strong>the</strong>r than having to learnabout ano<strong>the</strong>r new index.The ConceptThe <strong>Drought</strong> Monitor consists of a color map,showing which parts of <strong>the</strong> United States are sufferingfrom various degrees of drought, and accompanyingtext. The text describes <strong>the</strong> drought’s currentimpacts, future threats, and prospects for improvement.The <strong>Drought</strong> Monitor is a syn<strong>the</strong>sis of severaldifferent scientific drought indices. It is by far <strong>the</strong>most user-friendly national drought monitoring product,and it is particularly well suited for use bymainstream media because it represents state-of-<strong>the</strong>artscientific expertise and is packaged as a timely,colorful, unambiguous map. Currently, <strong>the</strong> WorldWide Web is <strong>the</strong> main means of distributing <strong>the</strong><strong>Drought</strong> Monitor. NOAA also distributes <strong>the</strong> mapthrough <strong>the</strong>ir internal channels. The obvious advantagesto using <strong>the</strong> web are that <strong>the</strong>re are no distributioncosts and <strong>the</strong> information is instantly available andalways current. The obvious disadvantage is that noteveryone has access to <strong>the</strong> web. Our focus to thispoint has been how to best disseminate <strong>the</strong> product in<strong>the</strong> most timely manner.No single definition of drought works in allcircumstances, so water planners rely on indices ordata in various forms, and most often depicted in mapor graphic form, to recognize droughts. The authorsof <strong>the</strong> <strong>Drought</strong> Monitor also rely on <strong>the</strong> input ofseveral key indices and ancillary indicators fromdifferent agencies to create <strong>the</strong> final map, which isposted each Thursday. The seven key parametersmaking up <strong>the</strong> current scheme are <strong>the</strong> Palmer <strong>Drought</strong>Index, Crop Moisture Index, CPC Soil MoistureModel (percentiles), USGS Daily Streamflow (percentiles),Percent of Normal Precipitation, USDA/NASS Topsoil Moisture (percent short and veryshort), and a remotely sensed Satellite VegetationHealth Index. The final color map summarizes all ofthis information in an easy-to-read format that showswhere drought is emerging, lingering, and subsiding.Classification: D0–D4The idea is to classify droughts on a scale fromzero to four (D0–D4), with zero indicating an abnormallydry area and four reflecting a region experiencingan exceptional drought event (likened to a droughtof record). The drought intensity categories are basedon six key indicators and many supplementary indicators.The <strong>Drought</strong> Monitor summary map andnarrative identify general drought areas, labelingdroughts by intensity from least to most intense. D0areas (abnormally dry) are ei<strong>the</strong>r drying out and16 Vol. 12, No. 1, Winter 1999–Spring 2000
February 8, 2000 Valid 7 a.m. ESTU.S. <strong>Drought</strong> MonitorD1(A)Map focuses on widespread drought.Local conditions may vary.D rought type: used onlyw hen impacts differDEPARTMENT OF COMMERCEUNITED STATES OF AMERICAA = AgricultureW = WaterF = W ildfire dangerP lus (+) = Forecast to intensify next two weeksM inus (-) = Forecast to diminish next two weeksN o sig n = No chang e in drought classification forecastReleased Thursday, Feb. 10, 2000Figure 1. The <strong>Drought</strong> Monitor (http://enso.unl.edu/monitor/monitor.html).<strong>Drought</strong> Network News17
possibly heading into drought or recovering fromdrought but still experiencing lingering impacts (ornot yet back to normal or wet conditions).Categories: A, W, and FThe <strong>Drought</strong> Monitor also shows which sectorsare presently seeing <strong>the</strong> majority of impacts due todrought, using labels of A, W, or F. An A representsimpacts on agriculture (crops, livestock, range orpasture). Water (W), or hydrological, impacts showthat <strong>the</strong> region is experiencing an impact on some partof <strong>the</strong> water supply system. In determining whe<strong>the</strong>r touse this label, we look at how droughts affectstreamflow, snowpack, groundwater, and reservoirs.An F is used when abnormally high risks of firedanger are observed.ForecastsWe use <strong>the</strong> two week forecasts (5 day and 6–10day) to determine if <strong>the</strong> drought is intensifying ordying out. Intensifying drought is indicated by a plus(+) sign after <strong>the</strong> drought classification; decreasingdrought is indicated by a minus (-) sign after <strong>the</strong>drought classification.drought. Efforts are underway to better forecast, withhigher confidence, fur<strong>the</strong>r into <strong>the</strong> future.Currently, seasonal forecasts issued by <strong>the</strong> CPCare taken into account, but <strong>the</strong>y are not used indetermining intensity trends. We do <strong>know</strong> that somestrong relationships exist between dryness or droughtin certain parts of <strong>the</strong> United States, depending on <strong>the</strong>season and whe<strong>the</strong>r or not we are in an El Niño or LaNiña phase. The relationship isn’t nearly as strong,however, in <strong>the</strong> continental grain-producing regionsthat make up our corn and wheat belts. The problemis addressing <strong>the</strong> non-phase year, especially in <strong>the</strong>summer. In fact, <strong>the</strong> summer months are <strong>the</strong> toughestto predict, regardless of whe<strong>the</strong>r an ENSO event istaking place. Today’s models are much better thanever before, and <strong>the</strong>y will continue to improve ascomputing power increases and we better identifyand understand <strong>the</strong> complex relationships that existbetween our oceans, continents, and atmosphere.Classification ParametersTable 1 illustrates <strong>the</strong> drought severity classificationsystem that exists now. The system was intendedto be flexible, allowing it to continually evolve byresponding to and incorporating <strong>the</strong> latest technologiesand data available in <strong>the</strong> monitoring world.An ExampleAn area shaded and labeled as D2 + (A) is ingeneral experiencing severe drought conditions thatare affecting <strong>the</strong> agricultural sector but at present arenot affecting water supplies. The area is not seeing aheightened fire risk in association with this dryness.In addition, <strong>the</strong> drought looks like it will intensify in<strong>the</strong> next two weeks, according to <strong>the</strong> forecasts.<strong>Drought</strong>s are generally slow in developing andcan be slow in receding, but <strong>the</strong>re are cases (like <strong>the</strong>hurricanes in <strong>the</strong> Nor<strong>the</strong>ast this past summer) inwhich a drought-breaking type of event can speed up<strong>the</strong> recovery process. Even after <strong>the</strong> physical event isover, impacts may linger for months or years, dependingon <strong>the</strong> timing, duration, and intensity of <strong>the</strong>The FutureThe CPC has been experimenting with blendingup to three inputs to produce a weighted objectivedrought index, but this is continually going throughadjustments and is only one part of <strong>the</strong> equation welook at when making <strong>the</strong> <strong>Drought</strong> Monitor. Weexpect to see CPC and o<strong>the</strong>rs improve <strong>the</strong> accuracyand confidence of forecasts at all time scales. Thisprocess and product are still evolving as both monitoringand forecasts improve. For example, we alsohope to integrate USDA and o<strong>the</strong>r soil moisturenetwork data into <strong>the</strong> <strong>Drought</strong> Monitor in <strong>the</strong> nearfuture. Interestingly, it is <strong>the</strong> availability and input of<strong>the</strong>se parameters (i.e., soil moisture) that in turn serveas inputs into better models at better resolutions. We18 Vol. 12, No. 1, Winter 1999–Spring 2000
<strong>Drought</strong> Network NewsTable 1. <strong>Drought</strong> severity classification.Category Description Impacts Palmer CPC Soil Daily Percent of USDA/ Satellite<strong>Drought</strong> Moisture Streamflow Normal NASS VegetationIndex or Model (Percentiles) Precipitation Topsoil HealthCrop (Percentiles) Moisture IndexMoisture(% short &Indexvery short)D0 Abnormally Short-term dryness slowing -.6 – -1.9 21–30 21–30
would like to include seasonal (long-lead) forecasts in<strong>the</strong> <strong>Drought</strong> Monitor to give people as much informationas possible (and as soon as possible) to use indecision making.Although <strong>the</strong> maps are based on many inputs, <strong>the</strong>final maps are tweaked to reflect real-world conditionsas reported by numerous experts throughout <strong>the</strong>country. States or water suppliers may be looking atour indicators while also using many o<strong>the</strong>r local dataresources and tailored drought triggers. Our intent isnot to replace any local or state information or subsequentlydeclared drought emergencies or warnings.Instead, we are providing a general assessment of <strong>the</strong>current state of drought around <strong>the</strong> United States,Pacific possessions, and Puerto Rico.We hope we have found a way to better picturethis “freeze-frame” disaster and relay <strong>the</strong> informationto users. Ultimately, it is <strong>the</strong> users who determine howto use <strong>the</strong> information; it is our job to provide <strong>the</strong>mwith <strong>the</strong> best available data and product in a timelyfashion.Mark Svoboda<strong>National</strong> <strong>Drought</strong> <strong>Mitigation</strong> <strong>Center</strong>107 L. W. Chase HallUniversity of Nebraska–LincolnLincoln, Nebraska 68583–0749USAe-mail: msvoboda2@unl.edu20 Vol. 12, No. 1, Winter 1999–Spring 2000
AnnouncementsNew Books<strong>Drought</strong>s: A Global Assessment<strong>Drought</strong>s: A Global Assessment has been published in two volumes by Routledge as part of aseries of definitive works on major hazards and disasters. The series is being published to mark <strong>the</strong> endof <strong>the</strong> International Decade for Natural Disaster Reduction.Donald Wilhite of <strong>the</strong> <strong>National</strong> <strong>Drought</strong> <strong>Mitigation</strong> <strong>Center</strong> is <strong>the</strong> editor of <strong>Drought</strong>s. More than75 leading international researchers in <strong>the</strong> field contributed to <strong>the</strong> volume. Through an extensive rangeof case studies covering <strong>the</strong> most drought-prone and most drought-affected countries, <strong>the</strong> contributorsexamine new technology, planning methodologies, and mitigation actions from recent droughtexperiences worldwide.Following a discussion of <strong>the</strong> critical concepts of drought, <strong>the</strong> book is divided into seven additionalparts that address causes and predictability; monitoring and early warning techniques; impacts andassessment methodologies; adjustment and adaptation strategies; policy, mitigation techniques, andpreparedness methodologies; links between drought and o<strong>the</strong>r global issues; and conclusions andfuture challenges. With its emphasis on both <strong>the</strong> physical and social dimensions of drought andproposed management actions and policies, this volume will be helpful to those seeking a greaterunderstanding of this complex natural hazard.The cost of <strong>the</strong> two-volume set is US$275/UK£225. The ISBN (International Standard BookNumber) of <strong>Drought</strong>s is 0–415–16833–3. In North America, copies may be ordered from Routledgeat 1 (800) 634–7064. Routledge’s United Kingdom customer hotline is 01264 342939 (+44 1264342939), or fax: 01264 343005 (+44 1264 343005). Their website is www.routledge.com.Proceedings of <strong>the</strong> <strong>National</strong> Workshop on Dynamic Crop Simulation Modeling forAgrometeorological Advisory ServicesThe Proceedings of <strong>the</strong> <strong>National</strong> Workshop on Dynamic Crop Simulation Modeling forAgrometeorological Advisory Services has been published. The workshop was conducted at <strong>the</strong><strong>National</strong> Centre for Medium Range Wea<strong>the</strong>r Forecasting (NCMRWF), Department of Science andTechnology, New Delhi, in January 1999. The volume includes papers presented at <strong>the</strong> workshop onvarious <strong>the</strong>mes of crop modeling and <strong>the</strong> recommendations that evolved from <strong>the</strong> deliberations of <strong>the</strong>workshop. S. V. Singh, L. S. Rathore, S. A. Saseendran, and K. K. Singh are <strong>the</strong> editors; <strong>the</strong> volumeis published by <strong>the</strong> NCMRWF. For fur<strong>the</strong>r information and copies of <strong>the</strong> publication, please contactDr. S. A. Saseendran, Scientist, NCMRWF, DST, Mausam Bhavan, Lodi Road, New Delhi–3, India;e-mail: saseendransa@hotmail.com.<strong>Drought</strong> Network News21
ConferencesCentral and Eastern European Workshop on <strong>Drought</strong> <strong>Mitigation</strong>The Central and Eastern European Workshop on <strong>Drought</strong> <strong>Mitigation</strong> will be held April 12–15, 2000, inBudapest, Hungary. The workshop is being presented by <strong>the</strong> Ministry of Agriculture and Rural Development;Ministry of Environmental Protection; and Ministry of Transport, Communication and Water Management of<strong>the</strong> Hungarian Republic.The workshop will provide a forum for discussing various aspects of drought monitoring, strategies, impactassessment, and mitigation, with special regard to <strong>the</strong> central and eastern European (CEE) region. Topics willinclude <strong>the</strong> status of national drought mitigation strategies in <strong>the</strong> CEE countries and impacts of drought ondifferent areas of <strong>the</strong> economy. For more information, contact <strong>the</strong> Budapest Station for Plant Health and SoilConservation, Department of Informatics, Budaörsi út 141–145, H–1118 Budapest, Hungary; telephone: (36–1) 309–1000; fax: +36–1–246–2942.11th Global Warming International Conference and ExpoThe 11th Global Warming International Conference and Expo will be held April 25–28, 2000, in Boston,Massachusetts. The objective of <strong>the</strong> conference is to provide a comprehensive international and interdisciplinaryreview forum for resource and technology managers on global warming, its impacts on all economicsectors, its effective mitigation, and each nation’s compliance with <strong>the</strong> Kyoto Protocol to reduce greenhousegas emissions. Topics include Global Warming and Climate Change; Global Surveillance: Climate Future;Education: Global Change; Human Health in a Changing Climate; Energy and Natural Resource Management;International Law and Policy Making; and State and Local Government Actions. For more information,contact <strong>the</strong> Global Warming International <strong>Center</strong>, P.O. Box 5275, Woodridge, Illinois 60517–0275, USA; fax:+1 630–910–1561; website: http://GlobalWarming.net.New ProductsGLOBE Data SetThe NOAA <strong>National</strong> Geophysical Data <strong>Center</strong> (NGDC) has released <strong>the</strong> Global Land One-kilometerBase Elevation (GLOBE) digital elevation data set. GLOBE is an international effort to create a global digitalelevation model on a nominal 1-kilometer grid. Source data for GLOBE include satellite imagery, aerialphotography, satellite altimetry, cadastral survey data, and hardcopy topographic maps converted to digitalformat. There are two versions of GLOBE: an unrestricted version with full global coverage and no copyrightor security restrictions on its distribution, and a version with high-quality data that honors copyright. GLOBEdata can be obtained via <strong>the</strong> web and as a CD collection. GLOBE data, documentation, and visualizations areavailable at no charge at http://www.ngdc.noaa.gov/seg/topo/globe.shtml. The CD-ROM collection (fourCDs), with documentation, is available from NOAA/NNDC/<strong>National</strong> Geophysical Data <strong>Center</strong>. For moreinformation, contact <strong>the</strong> <strong>National</strong> Environmental Satellite, Data, and Information Service, NOAA <strong>National</strong>Data <strong>Center</strong>s, <strong>National</strong> Geophysical Data <strong>Center</strong>, 325 Broadway, Boulder, Colorado 80303, USA; telephone:(303) 497–6277; e-mail: seginfo@ngdc.noaa.gov; website: http://www. ngdc.noaa.gov/store/.22 Vol. 12, No. 1, Winter 1999–Spring 2000
Material from this newsletter may be reproduced with ac<strong>know</strong>ledgment of <strong>the</strong> source.<strong>Drought</strong> Network News is published three times a year by <strong>the</strong> International <strong>Drought</strong> Information <strong>Center</strong> (IDIC) and <strong>National</strong> <strong>Drought</strong> <strong>Mitigation</strong> <strong>Center</strong>(NDMC). The IDIC and NDMC are part of <strong>the</strong> School of Natural Resource Sciences at <strong>the</strong> University of Nebraska–Lincoln. Funding for <strong>the</strong> newsletter is providedby <strong>the</strong> International Activities Division, <strong>National</strong> Wea<strong>the</strong>r Service/NOAA, through <strong>the</strong>ir cooperative program with <strong>the</strong> World Meteorological Organization, andCooperative State Research, Extension, and Education Service, U.S. Department of Agriculture.<strong>Drought</strong> Network News encourages readers to submit information on current episodes of drought and its impacts; timely reports of response, mitigation,and planning actions of governments and international organizations (successes and failures); recent research results and new technologies that may advance<strong>the</strong> science of drought planning and management; recent publications; conference reports and news of forthcoming meetings; and editorials. If referencesaccompany articles, please provide full bibliographic citations. All artwork must be camera-ready—please provide clear, sharp copies (in black/gray and whiteonly—we are unable to reproduce color artwork) that can be photocopied/reduced without losing any detail. Correspondence should be addressed to<strong>Drought</strong> Network News Telephone: (402) 472–6707IDIC/NDMC fax: (402) 472–6614239 L. W. Chase Hall e-mail: ndmc@enso.unl.eduUniversity of Nebraskawww: http://enso.unl.edu/ndmcP.O. Box 830749Lincoln, NE 68583–0749USASubscriptions to <strong>Drought</strong> Network News may beobtained, free of charge, by contacting Kim Klemsz at<strong>the</strong> street or e-mail address or <strong>the</strong> telephone or faxnumber to <strong>the</strong> left.Director: Donald WilhiteClimate Impacts Specialist: Michael HayesClimate/Water Resources Specialist: Mark SvobodaWater Resources Specialist: Cody KnutsonInformation Specialist: Kelly Helm SmithPublications Specialist: Deborah WoodSecretary: Kim KlemszSystems Analyst: James HinesInstitute of Agriculture and Natural Resources, University of Nebraska-Lincoln<strong>Drought</strong> Network News23