Techniques in oscillatory shear rheology - Indian Institute of ...
Techniques in oscillatory shear rheology - Indian Institute of ...
Techniques in oscillatory shear rheology - Indian Institute of ...

You also want an ePaper? Increase the reach of your titles
YUMPU automatically turns print PDFs into web optimized ePapers that Google loves.
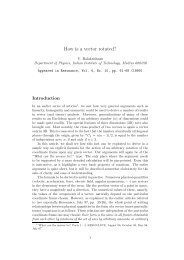
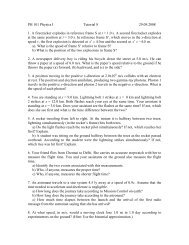
4 Abhijit P. Deshpande1.2 Typical responseExample variations <strong>of</strong> G ′ and G ′′ are shown <strong>in</strong> Fig. 2 for a polymer melt, emulsionand a crossl<strong>in</strong>k<strong>in</strong>g polymer. For the polymer melt (Fig. 2(a)), at very low frequency,viscous behaviour is observed. At higher frequencies, the behaviour is largely governedby the entanglements between polymer molecules. This region is also referredto as the plateau region, due to relatively constant moduli. At very high frequencies,the response is almost elastic. This response is also referred to as the glassy behaviour.It should be noted that the change from viscous to elastic behaviour is observedover a couple <strong>of</strong> decades <strong>in</strong> frequency (a change <strong>of</strong> 100) <strong>in</strong> case <strong>of</strong> Maxwellmodel. However, for most materials this change, if at all observed, occurs over severaldecades. For polymer melts, the moduli change by 4 orders <strong>of</strong> magnitude for a7-8 orders <strong>of</strong> magnitude change <strong>in</strong> frequency.The <strong>rheology</strong> <strong>of</strong> the emulsions is strongly <strong>in</strong>fluenced by the state <strong>of</strong> flocculation[9]. Unflocculated or weakly flocculated emulsions show a crossover po<strong>in</strong>t betweenG ′ and G ′′ . This crossover frequency is associated with a characteristic relaxationtime for the onset <strong>of</strong> the term<strong>in</strong>al or flow region for the emulsion. Highlyconcentrated stabilized emulsions show a gel-like response, imply<strong>in</strong>g G ′ to be largerthan G ′′ and both be<strong>in</strong>g almost constant with respect to frequency. Fig. 2(b) showsthe normalized response <strong>of</strong> emulsions (with different stabilizer concentrations). Asmentioned, G ′ is larger than G ′′ . Both change by an order <strong>of</strong> magnitude <strong>in</strong> the range<strong>of</strong> frequencies <strong>in</strong>vestigated [9]. Therefore, a plateau-like region can be observed asthe overall response. Similar to the entanglement plateau region <strong>in</strong> case <strong>of</strong> polymer,this region <strong>in</strong> emulsions may be due to <strong>in</strong>teractions between emulsifiers fromneighbour<strong>in</strong>g droplets [9].Fig. 2(c) shows evolution <strong>of</strong> l<strong>in</strong>ear viscoelastic response for a sample undergo<strong>in</strong>ggelation. In this case, sodium acrylate is be<strong>in</strong>g crossl<strong>in</strong>ked <strong>in</strong> the presence <strong>of</strong> freeradicalcrossl<strong>in</strong>ker. Initially, G ′ is observed to be lower than G ′′ . With crossl<strong>in</strong>k<strong>in</strong>greaction and network formation, both G ′ and G ′′ <strong>in</strong>crease. Near the gel po<strong>in</strong>t, thereViscoelasticViscousStressElasticFig. 1 Stress stra<strong>in</strong> dur<strong>in</strong>g acycle for different materialsStra<strong>in</strong>
<strong>Techniques</strong> <strong>in</strong> <strong>oscillatory</strong> <strong>shear</strong> <strong>rheology</strong> 5is a crossover <strong>in</strong> G ′ and G ′′ and subsequently G ′ is larger than G ′′ [10]. Once thereaction is complete and gel is formed, both G ′ and G ′′ become constant. G ′ and G ′′for the gel are almost <strong>in</strong>dependent <strong>of</strong> frequency.The overall response to SAOS, as exemplified <strong>in</strong> Fig. 2 is very complex comparedto simplistic response exhibited by Maxwell model, which is characterized by as<strong>in</strong>gle relaxation time. We understand the overall response by analyz<strong>in</strong>g it to be dueto comb<strong>in</strong>ations <strong>of</strong> several relaxation times.1.3 Relaxation time spectrumThe overall material response is visualized <strong>in</strong> terms <strong>of</strong> comb<strong>in</strong>ations <strong>of</strong> severalmechanisms and modes. Each <strong>of</strong> the modes is described <strong>in</strong> terms <strong>of</strong> a Maxwellmodel. Therefore, overall response <strong>of</strong> material can be captured through a combi-ModuliG"G’(a)Frequency10 5 Time (s)Modulus (Pa)10 010 −5G′G′′(b)(c)10 −100 300 600 900 1200 1500Fig. 2 Representative <strong>oscillatory</strong> <strong>shear</strong> response: (a) polymer (b) oil <strong>in</strong> water emulsions [9] (c)evolution dur<strong>in</strong>g gelation [10]
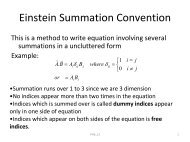
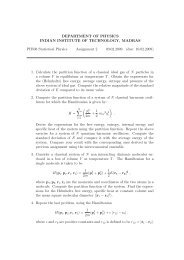
6 Abhijit P. Deshpandenation <strong>of</strong> Maxwell models (or generalized Maxwell model) with each mode correspond<strong>in</strong>gto a relaxation time. The strength <strong>of</strong> each mode may also be different. Therelaxation modulus for Maxwell model is given by,(G(t) = Gexp − t ), (8)λFor material response with several Maxwell modes, the relaxation modulus is,G(t) = G e + ∑G i exp(− t ), (9)iλ iwhere G e , equilibrium modulus is zero for fluidlike materials, and G i , elasticmodulus and λ i are elastic modulus and relaxation time for i th mode. Based on theabove equation, we can def<strong>in</strong>e a relaxation time spectrum, H(λ) as,H(λ) = ∑G i δ (λ − λ i ) . (10)iTherefore, relaxation modulus can be written <strong>in</strong> terms <strong>of</strong> the relaxation time spectrumas,(G(t) = G e + ∑G i δ (λ − λ i )exp − t ). (11)iλSimilarly, we can def<strong>in</strong>e the relaxation modulus based on the cont<strong>in</strong>uous relaxationtime spectrum as,∫ H(λ)G(t) = G e +(−λ exp t )dλ . (12)λThe storage and loss moduli can be written <strong>in</strong> terms <strong>of</strong> relaxation time spectrumas follows,G ′ = ∑iG i ω 2 λ 2i1+ω 2 λ 2i, G” = ∑iAlternately, <strong>in</strong> terms <strong>of</strong> cont<strong>in</strong>uous spectrum,∫ H(λ)ωG ′ 2 ∫λ=1+ω 2 λ 2 dλ , G” =G i ωλ i1+ω 2 λi2(13)H(λ)ω1+ω 2 dλ (14)λ 2Based on these equation, relaxation time spectrum can be estimated from datasuch as <strong>in</strong> Fig. 2 and the mechanisms <strong>of</strong> material behaviour can also be understood<strong>in</strong> terms <strong>of</strong> the distribution <strong>of</strong> relaxation times.An example <strong>of</strong> discrete relaxation time spectrum (referred to as PM spectrum <strong>in</strong>the figure) evaluated from <strong>oscillatory</strong> <strong>shear</strong> data is shown <strong>in</strong> Fig. 3. These data arefor different molecular weights <strong>of</strong> monodisperse polybutadiene samples. Analyticalexpressions for relaxation time spectrum have also been proposed and one exampleis (BSW spectrum <strong>in</strong> the figure) [1],
<strong>Techniques</strong> <strong>in</strong> <strong>oscillatory</strong> <strong>shear</strong> <strong>rheology</strong> 7H(λ) = H e λ n e+ H g λ −n gλ 1 < λ < λ max= 0 λ > λ max , (15)where λ 1 is the shortest measurable relaxation time and λ max is largest relaxationtime <strong>of</strong> the polymer. When tested below 1/λ max (i.e. at stra<strong>in</strong> rate or frequencylower than this value), polymer would show Newtonian viscous behaviour. H e , n eand H g , n g are coefficients to capture the entanglement modes and glassy modes <strong>of</strong>the polymer, respectively.Examples <strong>of</strong> relaxation time spectrum for polymers and an emulsion are given <strong>in</strong>Fig. 1.3. As was observed <strong>in</strong> Fig. 2 with G ′ and G ′′ , there is marked difference <strong>in</strong>the relaxation time spectrum for both the materials.As discussed <strong>in</strong> Sects. 1.1– 1.3, material response can be described <strong>in</strong> terms<strong>of</strong> microscopic mechanisms. These mechanisms for complex fluids, such as poly-Fig. 3 Relaxation time spectrum <strong>of</strong> (a) monodisperse polybutadienes [1] (b) emulsion [9]
8 Abhijit P. Deshpandemers, colloids, gels, liquid crystals, micelles etc, are recognized based on microscopic/molecularcooperative organization [17]. The viscoelastic behaviour <strong>in</strong> thel<strong>in</strong>ear and nonl<strong>in</strong>ear regimes is dependent on how the organization responds to deformation.1.4 L<strong>in</strong>ear and nonl<strong>in</strong>ear responseThe response is termed l<strong>in</strong>ear if scaled change <strong>in</strong> <strong>in</strong>put leads to change <strong>in</strong> the outputwith the same scal<strong>in</strong>g. Describ<strong>in</strong>g l<strong>in</strong>ear response <strong>in</strong> other words, the output <strong>of</strong> acomb<strong>in</strong>ation <strong>of</strong> <strong>in</strong>puts is the same as the comb<strong>in</strong>ation <strong>of</strong> outputs <strong>of</strong> <strong>in</strong>dividual <strong>in</strong>puts.This is also referred to as superposition pr<strong>in</strong>ciple. In the context <strong>of</strong> SAOS, if thestra<strong>in</strong> amplitude is changed by a factor, the stress amplitude <strong>of</strong> the s<strong>in</strong>usoid alsochanges by the same factor. Therefore, material functions such as G ′ and G” arenot functions <strong>of</strong> stra<strong>in</strong> amplitude. The l<strong>in</strong>ear viscoelastic limit (or the maximumstra<strong>in</strong> amplitude at which l<strong>in</strong>ear viscoelastic behaviour is observed) can be found bymeasur<strong>in</strong>g the material functions as functions <strong>of</strong> stra<strong>in</strong> amplitude.The onset <strong>of</strong> nonl<strong>in</strong>ear response is therefore, expected at larger amplitudes <strong>of</strong>stra<strong>in</strong>/stress as discussed <strong>in</strong> Sect. 2. Nonl<strong>in</strong>ear response, <strong>in</strong> the context <strong>of</strong> rheologicalresponse, can be classified as due to large deformations, structural changes andphase transitions [18]. Analysis <strong>of</strong> nonl<strong>in</strong>ear response is complicated, because <strong>in</strong>terplay<strong>of</strong> these factors is difficult to resolve and their mathematical representationsare difficult to propose and solve. However, <strong>in</strong> recent decades, lot <strong>of</strong> progress <strong>in</strong>theoretical and experimental tools has led to significant understand<strong>in</strong>g. The use <strong>of</strong><strong>oscillatory</strong> <strong>shear</strong> <strong>in</strong> the nonl<strong>in</strong>ear regime is an example <strong>of</strong> such endevour.As <strong>in</strong> the case <strong>of</strong> l<strong>in</strong>ear viscoelastic behaviour, several methods can be used toexam<strong>in</strong>e the nonl<strong>in</strong>ear response <strong>of</strong> the materials. These <strong>in</strong>clude creep and recovery,stress relaxation, <strong>oscillatory</strong> <strong>shear</strong> etc. These different methods serve to highlightparticular structure-property relations or they are more relevant for an application.Along with experimental characterization, development and use <strong>of</strong> comprehensivemodels that expla<strong>in</strong> behaviour <strong>of</strong> different materials <strong>in</strong> various methods <strong>of</strong> prob<strong>in</strong>gare cont<strong>in</strong>uously be<strong>in</strong>g undertaken.1.5 SusceptibilityL<strong>in</strong>ear and nonl<strong>in</strong>ear response <strong>of</strong> materials to excitation is <strong>of</strong> <strong>in</strong>terest <strong>in</strong> variousfields such as mechanical, electrical, thermal and their comb<strong>in</strong>ations. The materialproperty relat<strong>in</strong>g the response and excitation is referred to as susceptibility. At lowlevels <strong>of</strong> excitation, l<strong>in</strong>ear response is observed. In other words, the implication is (<strong>in</strong>case <strong>of</strong> <strong>oscillatory</strong> excitation) that the susceptibility is <strong>in</strong>dependent <strong>of</strong> the amplitude<strong>of</strong> excitation.
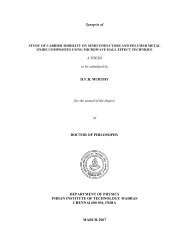
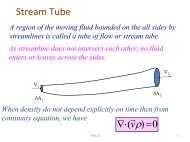
<strong>Techniques</strong> <strong>in</strong> <strong>oscillatory</strong> <strong>shear</strong> <strong>rheology</strong> 9L<strong>in</strong>ear response is usually very important <strong>in</strong> understand<strong>in</strong>g basic mechanismsresponsible for material behaviour. Nonl<strong>in</strong>ear response, on the other hand, is morerelevant for applications and is also more difficult to characterize. Measur<strong>in</strong>g thenonl<strong>in</strong>ear response <strong>of</strong> a material to an excitation is a way to exam<strong>in</strong>e properties,which cannot be characterized by exam<strong>in</strong><strong>in</strong>g the l<strong>in</strong>ear response. Understand<strong>in</strong>gnonl<strong>in</strong>ear effects has led to breakthroughs <strong>in</strong> different materials such as elastic,plastic, viscoelastic, optical materials, ferroelectric, freez<strong>in</strong>g, or dipolar glass transitions,isotropic-liquid crystal transition or b<strong>in</strong>ary mixtures, superconductivity, fieldor heat<strong>in</strong>g effects <strong>in</strong> electrical transport, heat<strong>in</strong>g due to electric field excitation <strong>of</strong>supercooled liquids [24].Similar techniques are used for the analysis <strong>of</strong> nonl<strong>in</strong>ear response <strong>in</strong> these diverseareas. As an example, the response <strong>in</strong> dielectric spectroscopy and mechanical spectroscopycan be understood <strong>in</strong> relation to each other. For small amplitude <strong>of</strong> electricfield, similar to Eq. 7, we can write the relation between electric displacement (D)and electric field (E) as,D = ε ∗ E , (16)where ε ∗ is permittivity <strong>of</strong> material. The modes <strong>of</strong> material response, as discussed<strong>in</strong> earlier sections, can also be identified by exam<strong>in</strong><strong>in</strong>g the dielectric response as afunction <strong>of</strong> frequency. In case <strong>of</strong> <strong>rheology</strong>, load and displacement are measured andanalysis is carried out for stress, stra<strong>in</strong> or stra<strong>in</strong> rate. In case <strong>of</strong> dielectric response,we measure current and voltage and carry out the analysis with electric field, polarisationor electric displacement.When material is subjected to large amplitude <strong>of</strong> electric field, the above equationis no longer valid. However, material behaviour can be described by writ<strong>in</strong>g higherorder terms <strong>in</strong> electric field [3],D = ε ∗ 1 E + ε ∗ 2 E 2 + ε ∗ 3 E 3 +... , (17)where ε n is the permittivity <strong>of</strong> n th order. It can be shown that only the odd poweredterms <strong>of</strong> the above equation are non-zero. In addition to such general descriptions,variety <strong>of</strong> theoretical and experimental tools are common <strong>in</strong> <strong>in</strong>vestigations <strong>of</strong>nonl<strong>in</strong>ear response <strong>of</strong> materials. In the next few sections, various features <strong>of</strong> nonl<strong>in</strong>earresponse <strong>in</strong> <strong>oscillatory</strong> <strong>shear</strong> will be described.2 Oscillatory test<strong>in</strong>g at large amplitudeThe classes <strong>of</strong> overall <strong>oscillatory</strong> rheological response <strong>of</strong> materials can be understoodfrom the diagram shown <strong>in</strong> Fig. 4. The diagram (referred to as Pipk<strong>in</strong> diagram)can be recast <strong>in</strong> the form <strong>of</strong> dimensionless numbers, Weissenberg number(We = ˙γλ) and Deborah number (De = ωλ). At low frequencies, and at lowstra<strong>in</strong> amplitudes, the material response is purely viscous and Newtonian. As mentionedearlier, this is at timescales larger than the largest relaxation time <strong>in</strong> the ma-
10 Abhijit P. Deshpandeterial. With an <strong>in</strong>crease <strong>in</strong> frequency, we observe viscoelastic response at timescalessmaller than the largest relaxation time <strong>in</strong> the material. Depend<strong>in</strong>g on the stra<strong>in</strong> amplitudeor stra<strong>in</strong> rate amplitude, a crossover from l<strong>in</strong>ear viscoelastic to nonl<strong>in</strong>earviscoelastic is observed. At low frequencies, this crossover occurs beyond a threshold<strong>of</strong> stra<strong>in</strong> rate amplitude, while at high frequencies, it occurs beyond a threshold<strong>of</strong> stra<strong>in</strong> amplitude. At very high frequencies, with timescales shorter than the smallestrelaxation time <strong>of</strong> the material, all modes are frozen and an elastic response isobserved.The most common nonl<strong>in</strong>ear viscoelastic measurement is steady <strong>shear</strong> viscosity(where at different stra<strong>in</strong> rates, steady stress response <strong>of</strong> the material is measured).Us<strong>in</strong>g this, we can dist<strong>in</strong>guish different types <strong>of</strong> behaviour such as <strong>shear</strong> th<strong>in</strong>n<strong>in</strong>g,<strong>shear</strong> thicken<strong>in</strong>g etc. The material behaviour, as captured by steady viscosity, is notdependent on the direction <strong>of</strong> rotation; η = η ( ˙γ) = η (− ˙γ).The most common l<strong>in</strong>ear viscoelastic measurement is based on <strong>oscillatory</strong> <strong>shear</strong>,as def<strong>in</strong>ed <strong>in</strong> Sect. 1. Most eng<strong>in</strong>eer<strong>in</strong>g applications may neither <strong>in</strong>volve steady flownor small deformation. Therefore, large amplitude <strong>oscillatory</strong> <strong>shear</strong> (LAOS) is suggestedto <strong>in</strong>vestigate transient behaviour <strong>of</strong> the material at large deformations. It canalso be used to quantify the progressive transition from l<strong>in</strong>ear to nonl<strong>in</strong>ear rheologicalbehavior. At larger amplitudes <strong>of</strong> stra<strong>in</strong>, <strong>oscillatory</strong> <strong>shear</strong> response will benonl<strong>in</strong>ear viscoelastic and has been <strong>in</strong>vestigated for last couple <strong>of</strong> decades. However,only <strong>in</strong> recent few years, LAOS is be<strong>in</strong>g used to elucidate specific features <strong>of</strong>different materials. Some <strong>of</strong> these examples are described briefly <strong>in</strong> Sect. 4.Fig. 4 Digram show<strong>in</strong>g materialresponse at differentfrequencies and stra<strong>in</strong> ratesStra<strong>in</strong> rate amplitudeNewtonian ViscousNonl<strong>in</strong>ear viscoelasticConstant stra<strong>in</strong> amplitudeL<strong>in</strong>ear viscoelasticFrequencyElastic
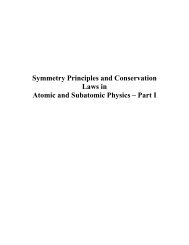
<strong>Techniques</strong> <strong>in</strong> <strong>oscillatory</strong> <strong>shear</strong> <strong>rheology</strong> 112.1 Qualitative description dur<strong>in</strong>g LAOSIn SAOS, the material response, <strong>in</strong> terms <strong>of</strong> stress, is periodic as given <strong>in</strong> Eq. 2. Thestra<strong>in</strong> amplitude limit for observation <strong>of</strong> l<strong>in</strong>ear viscoelastic response (below whichSAOS is usually performed) is small. For many materials, it is less than or around1%. Larger amplitudes, on the other hand imply, stra<strong>in</strong> amplitudes <strong>in</strong> the range <strong>of</strong>10–400%.When material is subjected to LAOS, the overall stress response has been observedto be periodic as well. In both SAOS and LAOS, a certa<strong>in</strong> number <strong>of</strong> cyclesare required before the term<strong>in</strong>al steady behaviour is observed (imply<strong>in</strong>g cyclic responseto be same for n th and (n+1) th cycle). The analysis, <strong>in</strong> both cases, is carriedout once the term<strong>in</strong>al steady behaviour is reached.The overall frequency <strong>of</strong> the term<strong>in</strong>al periodic response, <strong>in</strong> case <strong>of</strong> LAOS as well,is largely the <strong>in</strong>put frequency <strong>of</strong> the stra<strong>in</strong>. When we take a closer look at the cycle,the stress s<strong>in</strong>usoid may be narrower or wider near the peaks when comparedto response if a s<strong>in</strong>gle frequency response were observed. Additionally, the symmetrybefore and after the peak may not be present [8]. Similar features are shownwhen the material is subjected to a given stress and stra<strong>in</strong> response is observed [20].This qualitative response implies that stress response is not governed only by thes<strong>in</strong>usoidal behaviour at the <strong>in</strong>put stra<strong>in</strong> frequency. Therefore, stress response can bevisualized as be<strong>in</strong>g composed <strong>of</strong> various frequencies. The break<strong>in</strong>g <strong>of</strong> the beforeand after stress symmetry also implies that phase differences exist among responseat various frequencies.Example s<strong>in</strong>usoidal response dur<strong>in</strong>g LAOS is shown <strong>in</strong> Fig. 2.1(a,b). Though allthe features mentioned above are shown <strong>in</strong> the figure, the response, at first glance,may not seem very different. Indeed, the effect <strong>of</strong> various experimental errors has tobe carefully considered while analyz<strong>in</strong>g the LAOS data. This is discussed further <strong>in</strong>Sect. 2.4.Fig. 2.1 also shows another example <strong>of</strong> deviation from SAOS cyclic response. Inthis type <strong>of</strong> response (measured for a concentrated suspension [20], there is a departurefrom SAOS behaviour dur<strong>in</strong>g part <strong>of</strong> the cycle. Significant deviations <strong>in</strong> stra<strong>in</strong>rate are observed dur<strong>in</strong>g reversal <strong>of</strong> flow direction, i.e. when stra<strong>in</strong> starts <strong>in</strong>creas<strong>in</strong>gfrom the m<strong>in</strong>imum value or when stra<strong>in</strong> starts decreas<strong>in</strong>g from maximum value.Based on this basic description <strong>of</strong> cyclic response dur<strong>in</strong>g an LAOS experiment,follow<strong>in</strong>g features can be used to quantify the material response:Amplitudes <strong>of</strong> stress and stra<strong>in</strong>: The magnitude <strong>of</strong> first harmonic as function<strong>of</strong> stra<strong>in</strong> amplitude or ratio <strong>of</strong> stress and stra<strong>in</strong> amplitudes can be exam<strong>in</strong>ed forstorage and loss moduli. These properties capture the material response at the samefrequency as the <strong>in</strong>put frequency. These measurements are rout<strong>in</strong>ely made to f<strong>in</strong>dthe range <strong>of</strong> l<strong>in</strong>ear viscoelastic response <strong>of</strong> a material. In these measurements, onecan visualize stress response to be written <strong>in</strong> the form <strong>of</strong>,σ = σ 0 (γ 0 )s<strong>in</strong>(ωt + δ) , (18)
12 Abhijit P. DeshpandeThe above equation states that material response to LAOS is modified (whencompared to that to SAOS) by only the amplitude <strong>of</strong> stress be<strong>in</strong>g dependent onthe stra<strong>in</strong> amplitude. The s<strong>in</strong>usoid is represented by the same function <strong>in</strong> SAOSand LAOS. When σ 0 ∼ constant, l<strong>in</strong>ear viscoelastic response or SAOS behaviour isobserved.The onset <strong>of</strong> nonl<strong>in</strong>ear behaviour and subsequent variation as a function <strong>of</strong> stra<strong>in</strong>amplitude has been exam<strong>in</strong>ed for a large class <strong>of</strong> materials. An example result isshown for poly sodium acrylate gel and cellulose micr<strong>of</strong>ibrils / poly sodium acrylategel <strong>in</strong> Fig. 6. It can be observed that the onset stra<strong>in</strong> (for the nonl<strong>in</strong>ear response)decreased <strong>in</strong> the presence <strong>of</strong> micr<strong>of</strong>ibrils.As another example, the onset stra<strong>in</strong> has been related to the structure <strong>of</strong> a colloidalgel [23]. The structure <strong>of</strong> polymeric solutions and <strong>in</strong>termolecular <strong>in</strong>teractions<strong>in</strong> them can be dist<strong>in</strong>guished based on this response [13]. The decrease <strong>in</strong> G ′ andG ′′ with stra<strong>in</strong> amplitude, as shown <strong>in</strong> Fig. 6 is referred to as stra<strong>in</strong> s<strong>of</strong>ten<strong>in</strong>g. Additionally,depend<strong>in</strong>g on the material, one case observe <strong>in</strong>crease <strong>in</strong> G ′ and G ′′ (stra<strong>in</strong>harden<strong>in</strong>g) and overshoots <strong>in</strong> G ′ and G ′′ followed by decrease [13]. These changescorrespond to changes <strong>in</strong> stress amplitude σ 0 (γ 0 )(Eq. 18).Stress Vs stra<strong>in</strong> dur<strong>in</strong>g a cycle - Lissajous plot: As shown <strong>in</strong> Fig. 1, the stress–stra<strong>in</strong> curves for viscoelastic material subjected to SAOS would be ellipses withdifferent major and m<strong>in</strong>or axes, depend<strong>in</strong>g on the relative contributions <strong>of</strong> viscousand elastic responses (<strong>in</strong> other words, depend<strong>in</strong>g on amplitude <strong>of</strong> stress responseand its phase difference with stra<strong>in</strong>).(a)(b)Fig. 5 (a) Cyclic stress response dur<strong>in</strong>g LAOS, s<strong>in</strong>gle harmonic response as dashed l<strong>in</strong>e (b) examplestra<strong>in</strong> response under LAOS for concentrated suspension [20]
<strong>Techniques</strong> <strong>in</strong> <strong>oscillatory</strong> <strong>shear</strong> <strong>rheology</strong> 13The stress–stra<strong>in</strong> curves, <strong>in</strong> case <strong>of</strong> LAOS are departure from ellipses. This can beunderstood based on the qualitative features shown <strong>in</strong> Fig. 2.1. The departure froml<strong>in</strong>ear response (or the response at the <strong>in</strong>put frequency) is exhibited as stretched anddeformed ellipses. The response be<strong>in</strong>g considered is tress–stra<strong>in</strong>, and therefore thisdeparture is described aga<strong>in</strong> <strong>in</strong> terms <strong>of</strong> s<strong>of</strong>ten<strong>in</strong>g and/or harden<strong>in</strong>g <strong>of</strong> the materialdur<strong>in</strong>g a cycle.LAOS response can therefore be exam<strong>in</strong>ed through stress–stra<strong>in</strong> or stress–stra<strong>in</strong>rate plots. Examples <strong>of</strong> these are shown <strong>in</strong> Fig. 2.1. The plot shown <strong>in</strong> Fig. 2.1(a),is for a vanish<strong>in</strong>g cream. As can be seen, there is significant departure from l<strong>in</strong>earviscoelastic response (or elliptical plot). At larger stra<strong>in</strong>s <strong>in</strong> a cycle, proportionallylarger stress is required for higher stra<strong>in</strong> and therefore this behaviour is referred toas stra<strong>in</strong> harden<strong>in</strong>g dur<strong>in</strong>g the cycle.Stress–stra<strong>in</strong> curves for mucus gel [7] at different stra<strong>in</strong> amplitudes are shown <strong>in</strong>Fig. 2.1(b). Variation <strong>of</strong> G ′ and G ′′ , for the various stra<strong>in</strong> amplitudes was observed tobe m<strong>in</strong>imal. Therefore, little departure from l<strong>in</strong>ear response as described <strong>in</strong> the firstfeature, was observed. However, when Lissajous plots are observed (Fig. 2.1(b)),one can notice a strik<strong>in</strong>g departure from l<strong>in</strong>ear viscoelastic behaviour. Only at lowamplitudes (shown <strong>in</strong> <strong>in</strong>set), one can observe the elliptical plots.Another example <strong>of</strong> cyclic response dur<strong>in</strong>g LAOS is shown for a concentratedparticulate suspensions [20]. The data, which corresponds to Fig. 2.1(c), have beenshown with stress–stra<strong>in</strong> rate plot. A l<strong>in</strong>ear plot would <strong>in</strong>dicate viscous response,with stress and stra<strong>in</strong> rate <strong>in</strong> phase. As mentioned earlier, departure from this behaviouris observed dur<strong>in</strong>g certa<strong>in</strong> duration <strong>of</strong> the cycle.Frequency spectrum: Fourier transform <strong>of</strong> the time doma<strong>in</strong> signal is used to evaluatethe frequency spectrum. The magnitudes <strong>of</strong> the peaks at higher harmonics canbe used to quantify the nonl<strong>in</strong>ear response <strong>of</strong> materials.The deviations from a s<strong>in</strong>usoidal response with a s<strong>in</strong>gle frequency (<strong>in</strong>put frequency)can be captured by analyz<strong>in</strong>g the signal as a comb<strong>in</strong>ation <strong>of</strong> several frequencies[25]. This is shown <strong>in</strong> Fig. 8 with the Fourier Transform <strong>of</strong> the time doma<strong>in</strong>signal. As will be discussed later, higher harmonics (multiples <strong>of</strong> <strong>in</strong>put frequency)10 5 % stra<strong>in</strong>Fig. 6 G ′ and G ′′ as functions<strong>of</strong> stra<strong>in</strong> amplitude forgels [10]G ′ (Pa)10 410 30% CMF0.2% CMF0.5% CMF1% CMF10 210 −2 10 −1 10 0 10 1 10 2
14 Abhijit P. Deshpandeare observed. The <strong>in</strong>tensities <strong>of</strong> higher harmonics is much less than the first harmonic(or the <strong>in</strong>put frequency). It should also be noted that the phase differencebetween stra<strong>in</strong> and various harmonics <strong>of</strong> stress can be different. Therefore, amplitudeand phase <strong>of</strong> each harmonic are <strong>in</strong>dependent characteristics <strong>of</strong> the material.The dependence <strong>of</strong> G ′ and G ′′ on stra<strong>in</strong> amplitude signifies nonl<strong>in</strong>ear viscoelasticresponse. The distortion <strong>of</strong> stress-stra<strong>in</strong> loops (from elliptical shapes) is an <strong>in</strong>dication<strong>of</strong> nonl<strong>in</strong>ear behaviour. Similarly, the presence or absence <strong>of</strong> higher harmonics<strong>in</strong> the material response can be used as an <strong>in</strong>dicator <strong>of</strong> nonl<strong>in</strong>ear or l<strong>in</strong>ear response.However, it is also important to get quantitative measures from all <strong>of</strong> these measurements.Couple <strong>of</strong> the quantitative measures, be<strong>in</strong>g proposed as nonl<strong>in</strong>ear materialfunctions are discussed <strong>in</strong> Sect. 2.3. Additionally, it is important to relate the nonl<strong>in</strong>earresponse as captured by LAOS to physico–chemical processes <strong>in</strong> the material.Therefore, simulation <strong>of</strong> LAOS response with different constitutive models is alsoan important area <strong>of</strong> activity.(a)(b)(c)Fig. 7 Lissajous plots show<strong>in</strong>g (a) nonl<strong>in</strong>ear viscoelastic behaviour [7] (b) deviation from viscousbehaviour [20]
<strong>Techniques</strong> <strong>in</strong> <strong>oscillatory</strong> <strong>shear</strong> <strong>rheology</strong> 152.2 General response <strong>in</strong> LAOSWhen a material is subjected to stra<strong>in</strong> as given <strong>in</strong> Eq. 1, the general stress response<strong>of</strong> the material can be written as,σ(t) =N∑1σ n s<strong>in</strong>(nωt + δ n ) , (19)where σ n and δ n are amplitude and phase lag <strong>of</strong> the n th harmonic. In this equation,σ, a function <strong>of</strong> time, is be<strong>in</strong>g expressed as a Fourier series. In case <strong>of</strong> l<strong>in</strong>earviscoelasticity or SAOS, only the first term <strong>of</strong> this series exists (Eq. 2).The expression for stress can also be written as a series us<strong>in</strong>g complex notation,σ =N∑1G ∗ nγ n . (20)For l<strong>in</strong>ear viscoelastic response, only the first term <strong>of</strong> the summation exists(Eq. 7). Similar to storage and loss modulus <strong>in</strong> case <strong>of</strong> l<strong>in</strong>ear viscoelastic response,we can def<strong>in</strong>e a series <strong>of</strong> storage and loss moduli G ′ n and G ′′n, correspond<strong>in</strong>g to n thharmonic <strong>in</strong> the series <strong>in</strong> Eq. 20. These moduli can also be written <strong>in</strong> terms <strong>of</strong> σ nand phase δ n from Eq. 19.For isotropic liquids and given that viscosity is not a function <strong>of</strong> direction <strong>of</strong>stra<strong>in</strong> rate, it can be shown that only the odd harmonics <strong>of</strong> the above series are nonzero.This is also the case for dielectric properties, where dielectric constants arenot functions <strong>of</strong> the direction <strong>of</strong> electric field. The overall number <strong>of</strong> terms, N canbe arbitrarily large. However, most measurements have been made upto the fifthharmonic due to experimental limitations. The issues related to detection <strong>of</strong> higherharmonics are discussed later <strong>in</strong> Sect. 2.4.The measurement <strong>of</strong> stress, through the torque or force sensors <strong>of</strong> the rheometer,are done discretely at a f<strong>in</strong>ite sample <strong>in</strong>terval (t s ). Based on the sampl<strong>in</strong>g frequency(N s = 1/t s , number <strong>of</strong> data po<strong>in</strong>ts per second), we obta<strong>in</strong> a time series <strong>of</strong> discretemeasurements. This time doma<strong>in</strong> series can be denoted as,(a)(b)Fig. 8 (a) Time doma<strong>in</strong> signal and the correspond<strong>in</strong>g (b) Fourier transform [25]
16 Abhijit P. DeshpandeN s Tσ(t) =∑1σ(k)δ(t −t s k) , (21)where k takes <strong>in</strong>teger values from 1 to N s T and T is the total duration <strong>of</strong> measurement.Alternately, the series can be written as σ(kt s ), where k = 1,2,3...Discrete Fourier transform <strong>of</strong> this time doma<strong>in</strong> series will also be a series <strong>of</strong>N s T complex numbers. The maximum frequency <strong>in</strong> the Fourier doma<strong>in</strong> correspondsto Nyquist frequency = 2π(1/2t s ). With the property <strong>of</strong> Fourier transformlead<strong>in</strong>g to mean<strong>in</strong>gful N/2 terms (symmetric), the resolution <strong>in</strong> frequency doma<strong>in</strong>is 2π(1/2t s ) × (1/(N s T/2)) = 2π(1/T). Therefore, sampl<strong>in</strong>g <strong>in</strong>terval determ<strong>in</strong>esmaximum frequency to which <strong>in</strong>formation can be obta<strong>in</strong>ed, while duration <strong>of</strong> measurementdeterm<strong>in</strong>es the resolution <strong>of</strong> frequency. Larger T also leads to higher signalto noise ratio [26].In the Fourier doma<strong>in</strong>, the <strong>in</strong>tensity <strong>of</strong> n th harmonic peak is <strong>in</strong>dicated by I n . Thealgorithm for identification <strong>of</strong> higher harmonics has to consider the resolution <strong>in</strong> thefrequency doma<strong>in</strong>, as the frequency spectrum will not have frequencies which are<strong>in</strong>tegral multiples <strong>of</strong> each other.This general description will be useful for understand<strong>in</strong>g material behaviour ifwe can propose quantitative measures based on the evaluated variables. ThoughLAOS is be<strong>in</strong>g <strong>in</strong>vestigated for couple <strong>of</strong> decades, only <strong>in</strong> recent times we have thetheoretical and experimental tools to attempt quantify<strong>in</strong>g the response. In the nextsection, couple <strong>of</strong> examples <strong>of</strong> such quantification are discussed.2.3 Proposed material functions <strong>in</strong> LAOSThe moduli G ′ n as def<strong>in</strong>ed <strong>in</strong> previous section are based on the n th harmonic. Whenever,we analyze one <strong>of</strong> these moduli, we do not exam<strong>in</strong>e the overall response, butlook at overall response as contributions from these <strong>in</strong>dividual moduli. Based on thethe time series <strong>of</strong> stress, moduli can be def<strong>in</strong>ed which are not based on an <strong>in</strong>dividualharmonic alone [7],( ) dσG ′ L = ,dγγ=0( ) dσG ′ M = . (22)dγγ=γ 0These moduli will reduce to G ′ <strong>in</strong> case <strong>of</strong> SAOS (l<strong>in</strong>ear viscoelasticity). Additionally,they have geometric <strong>in</strong>terpretation as shown <strong>in</strong> Fig. 9.Other approaches are based on the ratios <strong>of</strong> <strong>in</strong>tensities <strong>of</strong> higher harmonics andfirst harmonic <strong>of</strong> the stress response. For example, coefficient Q is def<strong>in</strong>ed as [14],
<strong>Techniques</strong> <strong>in</strong> <strong>oscillatory</strong> <strong>shear</strong> <strong>rheology</strong> 17Q = 1 I 3γ02 , (23)I 1This coefficient has been claimed to be helpful <strong>in</strong> dist<strong>in</strong>guish<strong>in</strong>g molecular architecture<strong>of</strong> polymers based on LAOS.Through analysis <strong>of</strong> shapes <strong>in</strong> Lissajous plots and Fourier spectra, such materialfunctions are def<strong>in</strong>ed. It should be noted, however, that these material functions willprove useful provided they give <strong>in</strong>sight <strong>in</strong>to material behaviour and help <strong>in</strong> identify<strong>in</strong>gthe microscopic mechanisms <strong>in</strong>volved. Therefore, physical <strong>in</strong>terpretations <strong>of</strong>these material functions are still be<strong>in</strong>g proposed and applied to different complexfluids to exam<strong>in</strong>e their utility.2.4 Experimental issuesIn general, <strong>oscillatory</strong> rheological measurements are difficult at very low and highfrequencies. At very low frequencies, with lower deformation and stra<strong>in</strong> rates, signalto noise ratio is low due the sensitivity <strong>of</strong> sensors (or least count). At higherfrequencies, <strong>in</strong>ertia effects are significant, while the rheometric analysis assumesabsence <strong>of</strong> these. Mechanical and electrical disturbances dur<strong>in</strong>g the operation <strong>of</strong> therheometer can also lead to errors, which may be significant dur<strong>in</strong>g analysis <strong>of</strong> higherharmonics <strong>in</strong> LAOS [26].The presence <strong>of</strong> higher harmonics dur<strong>in</strong>g <strong>oscillatory</strong> <strong>shear</strong> is not always due toterm<strong>in</strong>al nonl<strong>in</strong>ear response <strong>of</strong> the materials. One has to be careful about contributionsfrom sample <strong>in</strong>ertia [5]. It has been shown that dur<strong>in</strong>g startup <strong>of</strong> <strong>oscillatory</strong>flow (dur<strong>in</strong>g the time before the term<strong>in</strong>al steady state is reached), higher harmon-(a)(b)Fig. 9 Proposed elastic moduli and their geometric <strong>in</strong>terpretation for (a) l<strong>in</strong>ear and (b) nonl<strong>in</strong>earviscoelastic behaviour [7]
18 Abhijit P. Deshpandeics are observed. Therefore it is essential to establish the term<strong>in</strong>al periodic responsebefore analyz<strong>in</strong>g the LAOS data [8].Due to small gaps <strong>of</strong> rotational rheometer geometries, it is assumed that flowis one dimensional with tangential velocities. However, at large amplitudes and atthe edges <strong>of</strong> the geometries, secondary flows can develop. These may also lead toseem<strong>in</strong>g deviation from l<strong>in</strong>ear viscoelastic response or the appearance <strong>of</strong> higherharmonics. A homogeneous flow is also assumed (with constant velocity gradient,or stra<strong>in</strong> rate) across the depth <strong>in</strong> the rheometer geometry. Dur<strong>in</strong>g LAOS, the flowmay become <strong>in</strong>homogeneous (<strong>shear</strong> band<strong>in</strong>g; regions <strong>of</strong> different stra<strong>in</strong> rates) andtherefore, analysis <strong>of</strong> steady term<strong>in</strong>al response would be very difficult [17].Even though the presence <strong>of</strong> even harmonics is ruled out due to material symmetryconsiderations, they have been observed <strong>in</strong> several cases [4, 7]. These evenharmonicterms can be observed due to transient responses, secondary flows, viscousheat<strong>in</strong>g or dynamic wall slip. As an example, they have been shown to arise due tomisalignment <strong>of</strong> top and bottom geometry [4]. Edge fracture has also been shownto lead to higher harmonics <strong>in</strong>clud<strong>in</strong>g even ones [17].The <strong>in</strong>tensity <strong>of</strong> (n+1) th harmonic is usually <strong>in</strong> the range <strong>of</strong> 1–10% <strong>of</strong> the n th harmonic.Therefore, <strong>in</strong>tensities <strong>of</strong> successive harmonics are very low and it is difficultto ascerta<strong>in</strong> there significance. Due to these experimental issues, LAOS data need tobe exam<strong>in</strong>ed very closely before physical <strong>in</strong>terpretation <strong>of</strong> material response.3 Constitutive models and LAOSThe l<strong>in</strong>ear viscoelastic models such as Maxwell, Jeffrey’s, standard l<strong>in</strong>ear solidand generalized Maxwell model (comb<strong>in</strong>ation <strong>of</strong> Maxwell model as described <strong>in</strong>Sect. 1.3 are commonly used to describe the <strong>oscillatory</strong> <strong>shear</strong> response [2, 16]. Some<strong>of</strong> the simplistic phenomenological models for large deformations or nonl<strong>in</strong>ear viscoelasticitycan be considered as extensions <strong>of</strong> the l<strong>in</strong>ear viscoelastic models. Forexample, upper convected Maxwell model is,( )∂σσ+λ∂t + v · ∇σ −(∇v)T · σ − σ · ∇v = η ˙γ , (24)where the partial derivative from Eq. 4 has been replaced with upper convectedderivative (given <strong>in</strong> the parenthesis <strong>in</strong> the above equation).The quasi-l<strong>in</strong>ear model such as upper convected Maxwell model or Lodgerubber-like liquid and Oldroyd–B model lead to l<strong>in</strong>ear <strong>shear</strong> stress response forSAOS as well as LAOS [5, 21]. Therefore, they predict s<strong>in</strong>gle harmonic stressresponse, at the same frequency as the stra<strong>in</strong>. However, normal stress differencesare predicted to exhibit second harmonic [5] even at small stra<strong>in</strong>s. Additionally, allthese models predict the presence <strong>of</strong> higher harmonics dur<strong>in</strong>g the <strong>in</strong>itial stages <strong>of</strong>LAOS (before the term<strong>in</strong>al periodicity is established). These results are not surpris<strong>in</strong>gs<strong>in</strong>ce, the quasi-l<strong>in</strong>ear models exhibit no <strong>shear</strong> th<strong>in</strong>n<strong>in</strong>g behaviour. As is ap-
<strong>Techniques</strong> <strong>in</strong> <strong>oscillatory</strong> <strong>shear</strong> <strong>rheology</strong> 19parent from cyclic response <strong>in</strong> Fig. 1 and Fig. 2.1, nonl<strong>in</strong>ear viscous and nonl<strong>in</strong>earelastic behaviour are required to observe harden<strong>in</strong>g/s<strong>of</strong>ten<strong>in</strong>g dur<strong>in</strong>g a cycle.In terms <strong>of</strong> molecular/microscopic theories, these models can be considered tohave fixed entanglement network. Models which consider the transitory nature <strong>of</strong>entanglement network are, therefore, essential to capture the LAOS. To understandthe quantitative variation <strong>of</strong> stress, several molecular based models and phenomenologicalmodels are be<strong>in</strong>g used to analyze the LAOS.It has been shown that many <strong>of</strong> prevalent constitutive equations show the follow<strong>in</strong>gscal<strong>in</strong>g for <strong>in</strong>tensity <strong>of</strong> n th harmonic with stra<strong>in</strong> [19, 29],I n ∝ γ n 0 , (25)The models such as Giesekus, Phan Thien Tanner, F<strong>in</strong>itely extensible Nonl<strong>in</strong>earElastic-P, Marrucci, Leonov, Pom-Pom model show the behavior given by the aboveequation [7, 19]. The degree <strong>of</strong> <strong>shear</strong> th<strong>in</strong>n<strong>in</strong>g can be enhanced or reduced based onthe parameters <strong>of</strong> these models. Attempts are be<strong>in</strong>g made to understand the LAOSresponse for different values <strong>of</strong> these parameters. In various experimental observationsand simulations with the above models at very large amplitudes (>100%),departures from Eq. 25 have been reported.Some <strong>of</strong> these studies highlight that models which are good for nonl<strong>in</strong>ear viscoelasticbehaviour <strong>of</strong> complex fluids (exhibit<strong>in</strong>g <strong>shear</strong> th<strong>in</strong>n<strong>in</strong>g, stra<strong>in</strong> harden<strong>in</strong>g<strong>in</strong> extensional flow, stress growth etc) may not yield quantitative comparison withexperimental observations. Progress is needed on both the factors <strong>of</strong> limited understand<strong>in</strong>g<strong>of</strong> the response <strong>of</strong> microscopic mechanisms to LAOS and limited <strong>in</strong>terpretations<strong>of</strong> experimental measurements.4 LAOS: ExamplesThe follow<strong>in</strong>g list provides a few examples <strong>of</strong> material systems and specific issuesthat have been exam<strong>in</strong>ed with LAOS:• Exam<strong>in</strong>e morphology <strong>of</strong> polymer blend [4], prob<strong>in</strong>g <strong>of</strong> dispersed phase size distribution• Effect <strong>of</strong> flow on drop shape <strong>in</strong> emulsions <strong>of</strong> Newtonian fluids [28]• Concentrated particulate suspension [20]• Effect <strong>of</strong> long cha<strong>in</strong> branch<strong>in</strong>g on <strong>oscillatory</strong> <strong>shear</strong> behaviour [8]• Effect <strong>of</strong> <strong>oscillatory</strong> <strong>shear</strong> on entanglement dynamics <strong>in</strong> polymers [22]• Stra<strong>in</strong> rate frequency superposition <strong>in</strong> s<strong>of</strong>t solids [15]Two examples, based on material functions def<strong>in</strong>ed <strong>in</strong> Eqs. 22 and 23, are given<strong>in</strong> the follow<strong>in</strong>g discussion.Material functions for mucus (Lissajou plots shown <strong>in</strong> Fig. 2.1) are shown <strong>in</strong>Fig. 10 [7]. The response <strong>of</strong> the first harmonic shows not very significant change(a slight decrease) with stra<strong>in</strong> amplitude, while moduli def<strong>in</strong>ed <strong>in</strong> Eq. 22 show differentresponse. The first observation would lead to a conclusion that near l<strong>in</strong>ear
20 Abhijit P. Deshpandeviscoelastic behaviour is observed for almost the whole range <strong>of</strong> amplitudes <strong>in</strong>vestigated.Qualitatively, this behaviour can be described as slightly s<strong>of</strong>ten<strong>in</strong>g behaviour.However, based on G ′ L and G′′ M , one can observe that s<strong>of</strong>ten<strong>in</strong>g/harden<strong>in</strong>g behaviouris quite significant and this was also apparent from Lissajous plots.Fig. 4 shows LAOS measurements on l<strong>in</strong>ear and branched polymer melts [12].The ratios <strong>of</strong> third harmonic to first harmonic (Qγ0 2 ), as def<strong>in</strong>ed <strong>in</strong> Eq.23 were measuredfor several l<strong>in</strong>ear and branched polymers and their blends. Based on simulationswith several models (as shown <strong>in</strong> Eq. 25), we expect this ratio to scale asγ0 2 . Indeed, for many polymeric melts and other materials, this has been observed.However, as the figure shows, presence <strong>of</strong> long cha<strong>in</strong> branch<strong>in</strong>g leads to a slope < 2.Based on these measurements, it is proposed that <strong>in</strong> addition to extensional measurements,LAOS can be a useful tool to assess the effect <strong>of</strong> branch<strong>in</strong>g on rheologicalresponse <strong>of</strong> a polymer melt [12]. Pom-Pom model, developed to describethe behaviour <strong>of</strong> branched polymers, also does not capture the departure <strong>of</strong> scal<strong>in</strong>gfrom 2. Therefore, such results also po<strong>in</strong>t to the challenges <strong>in</strong> constitutive model<strong>in</strong>g<strong>of</strong> complex fluids under LAOS.4.1 Bulk <strong>oscillatory</strong> flowIn this section, an example <strong>of</strong> bulk <strong>oscillatory</strong> flow is presented. Fig. 12 shows acavity (a rectangular box) filled with a given fluid. The top surface <strong>of</strong> this cavity ismoved periodically <strong>in</strong> x-direction. The filled fluid, at each po<strong>in</strong>t <strong>in</strong> the cavity, is alsoexpected to have periodic velocity. This cavity was used to exam<strong>in</strong>e flow <strong>of</strong> differentNewtonian and viscoelastic fluids.A reactive flow, the gelation <strong>of</strong> sodium acrylate was carried out <strong>in</strong> this cuboidalcavity with the top surface undergo<strong>in</strong>g s<strong>in</strong>usoidal periodic motion. The <strong>in</strong>stantaneoustwo-dimensional planar velocity fields dur<strong>in</strong>g gelation were obta<strong>in</strong>ed us<strong>in</strong>gFig. 10 Elastic moduli as afunction <strong>of</strong> stra<strong>in</strong> amplitudefor mucus [7]
<strong>Techniques</strong> <strong>in</strong> <strong>oscillatory</strong> <strong>shear</strong> <strong>rheology</strong> 21Particle Image Velocimetry [11]. Initially, the reaction mixture consists <strong>of</strong> monomeronly, and therefore behaves as Newtonian fluid. However, as crossl<strong>in</strong>k<strong>in</strong>g reactionsprogress, viscoelastic behaviour is developed (as shown <strong>in</strong> Fig. 2(c)). The periodicvariation <strong>of</strong> velocities at different po<strong>in</strong>ts was further exam<strong>in</strong>ed by obta<strong>in</strong><strong>in</strong>g Fouriertransforms <strong>of</strong> the velocities’ time series.Fourier transforms <strong>of</strong> x and y-components <strong>of</strong> velocities at a po<strong>in</strong>t are shown <strong>in</strong>Fig. 13. These Fourier transforms were collected at different times after <strong>in</strong>troduction<strong>of</strong> the <strong>in</strong>itiator. These results show that po<strong>in</strong>t velocities fluctuate at higher harmonicsdur<strong>in</strong>g the time <strong>of</strong> reaction. It is <strong>in</strong>terest<strong>in</strong>g to note that such higher harmonicswere observed neither with Newtonian glycerol/water mixtures nor with viscoelasticpolyacrylamide/water mixtures.Nonl<strong>in</strong>ear response aris<strong>in</strong>g out <strong>of</strong> structural changes has been highlighted <strong>in</strong> thecontext <strong>of</strong> LAOS by show<strong>in</strong>g appearance <strong>of</strong> higher harmonics dur<strong>in</strong>g crystallization<strong>in</strong> a polymer melt [6]. It will be <strong>in</strong>terest<strong>in</strong>g to exam<strong>in</strong>e if such behaviour is observeddur<strong>in</strong>g LAOS experiments dur<strong>in</strong>g gelation.Fig. 11 Scal<strong>in</strong>g <strong>of</strong> I 3 /I 1 with stra<strong>in</strong> amplitude for different (a) l<strong>in</strong>ear and branched polymer meltsand (b) their blends [12]Fig. 12 Periodically drivencavity to observe bulk <strong>oscillatory</strong>flow
22 Abhijit P. Deshpande5 SummaryNonl<strong>in</strong>ear response <strong>of</strong> complex fluids is very important for most applications. Inlast couple <strong>of</strong> decades, nonl<strong>in</strong>ear response is be<strong>in</strong>g exam<strong>in</strong>ed through various approaches.Oscillatory <strong>rheology</strong> at large amplitudes has been shown to be useful <strong>in</strong>analyz<strong>in</strong>g nonl<strong>in</strong>ear response <strong>of</strong> various complex fluids such as polymers, emulsions,suspensions and gels. In this Chapter, a brief description <strong>of</strong> large amplitude<strong>oscillatory</strong> <strong>shear</strong> (LAOS) was provided. Due to advances <strong>in</strong> <strong>in</strong>strumentation and experimentaltools, it is possible to obta<strong>in</strong> large amount <strong>of</strong> data dur<strong>in</strong>g LAOS. Throughanalysis <strong>of</strong> cyclic variation and frequency spectrum, the response can be analyzedto understand the material behaviour. Constitutive models are also be<strong>in</strong>g used tounderstand material response under LAOS.It has been shown that LAOS can highlight the structural changes tak<strong>in</strong>g place<strong>in</strong> the material at large deformations. The quantification <strong>of</strong> the nonl<strong>in</strong>ear response,and more importantly the physical <strong>in</strong>terpretation, are still develop<strong>in</strong>g tools.Acknowledgements The author thanks Subhash Naik, A. Pdmarekha, Sudharshan Parthasarathy,Moumita Sarkar and Manish Gupta for their help with experiments and figures.References1. Baumgaertel M, De Rosa ME, Machado J, Masse M, W<strong>in</strong>ter HH (1992) The relaxation timespectrum <strong>of</strong> nearly monodisperse polybutadiene melts. Rheol Acta 31:75–822. Bird RB, Hassager O (1987) Dynamics <strong>of</strong> polymeric liquids. Wiley3. Blythe T, Bloor D (2005) Electrlectrical properties <strong>of</strong> polymers. Cambridge University Press4. Carotenuto C, Grosso M, Maffettone PL (2008) Fourier Transform Rheology <strong>of</strong> Dilute ImmisciblePolymer Blends: A Novel Procedure To Probe Blend Morphology. Macromolecules,41:4492–45005. Collyer AA, Clegg, DW – Eds (1998) Rheological measurement, Second Edition, Chapman& HallIntensity15 s130 s160 s210 s240 s310 sIntensity15 s130 s160 s210 s240 s270 s310 s(a)0 0.5 1 1.5 2Frequency (f)(b)0 0.5 1 1.5 2Frequency (f)Fig. 13 Fourier transform <strong>of</strong> po<strong>in</strong>t velocity time series [11] (a) x-component <strong>of</strong> velocity (b) y-component <strong>of</strong> velocity
<strong>Techniques</strong> <strong>in</strong> <strong>oscillatory</strong> <strong>shear</strong> <strong>rheology</strong> 236. Dotsch T, Pollard M, Wilhelm M (2003) K<strong>in</strong>etics <strong>of</strong> isothermal crystallization <strong>in</strong> isotacticpolypropylene monitored with <strong>rheology</strong> and Fourier-transform <strong>rheology</strong>. J Phys:Condens MatS923–S9317. Ewoldt RH, Hosoi AE, McK<strong>in</strong>ley GH (2008) New measures for characteriz<strong>in</strong>g nonl<strong>in</strong>earviscoelasticity <strong>in</strong> large amplitude <strong>oscillatory</strong> <strong>shear</strong>. J Rheol 526:1427–14588. Fleury G, Schlatter G, Muller R (2004) Non L<strong>in</strong>ear Rheology for Long Cha<strong>in</strong> Branch<strong>in</strong>g characterization,comparison <strong>of</strong> two methodologies : Fourier Transform Rheology and Relaxation.Rheol Acta 44:174–1879. Guerrero A, Partal P,Gallegos C (2008) L<strong>in</strong>ear viscoelastic properties <strong>of</strong> sucrose esterstabilizedoil-<strong>in</strong>-water emulsions, J Rheol 42(6):1375–138810. Har<strong>in</strong>i M, Deshpande AP (2009) Rheology <strong>of</strong> poly (sodium acrylate) hydrogels dur<strong>in</strong>g crossl<strong>in</strong>k<strong>in</strong>gwith and without cellulose micro-fibrils, J Rheol, 53(1):31–4711. Har<strong>in</strong>i M, Sriram S, Deshpande AP and Pushpavanam S (2008) Variation <strong>of</strong> spatial and temporalcharacteristics <strong>of</strong> reactive flow <strong>in</strong> a periodically driven cavity: Gelation <strong>of</strong> sodium acrylate.Phys Rev E 78:1–812. Hyun K, Baik ES, Ahn KH, Lee SJ (2007) Fourier-transform <strong>rheology</strong> under medium amplitude<strong>oscillatory</strong> <strong>shear</strong> for l<strong>in</strong>ear and branched polymer melts. J Rheol 51(6):1319–134213. Hyun K, Kim SH, Ahn KH, Lee SJ (2002) Large amplitude <strong>oscillatory</strong> <strong>shear</strong> as a way toclassify the complex fluids. J Non-Newtonian Fluid Mech 107:51–6514. Hyun K, Wilhelm M (2009) Establish<strong>in</strong>g a New Mechanical Nonl<strong>in</strong>ear Coefficient Q fromFT-Rheology: First Investigation <strong>of</strong> Entangled L<strong>in</strong>ear and Comb Polymer Model Systems.Macromolecules 42:411–42215. Kalelkar C, Lele A, Kamble S (2009) Stra<strong>in</strong> rate frequency superposition <strong>in</strong> large amplitude<strong>oscillatory</strong> <strong>shear</strong>. arXiv:0910.059116. Larson RG (1998) Structure and <strong>rheology</strong> <strong>of</strong> complex fluids. Oxford University Press, USA.17. Li X, Wang S-Q, Wang X (2009) Nonl<strong>in</strong>earity <strong>in</strong> large amplitude <strong>oscillatory</strong> <strong>shear</strong> (LAOS)<strong>of</strong> different viscoelastic materials. J Rheol 53(5):1255–127418. Malk<strong>in</strong> AYa (1995) Non-l<strong>in</strong>earity <strong>in</strong> <strong>rheology</strong> an essay <strong>of</strong> classification. Rheol Acta 34:27–3919. Nam JG, Hyun K, Ahn KH, Lee SJ (2008) Prediction <strong>of</strong> normal stresses under large amplitude<strong>oscillatory</strong> <strong>shear</strong> flow. J Non-Newtonian Fluid Mech 150:1–1020. Narumi T, See H, Suzuki A, Hasegawa T (2005) Response <strong>of</strong> concentrated suspensions underlarge amplitude <strong>oscillatory</strong> <strong>shear</strong> flow. J Rheol 49(1):71–8521. Prost-Domasky SA, Khomami B (1996) A note on start-up and large amplitude <strong>oscillatory</strong><strong>shear</strong> flow <strong>of</strong> multimode viscoelastic fluids. Rheol Acta 35:21l–22422. Rav<strong>in</strong>dranath S, Wang S-Q (2008) Large amplitude <strong>oscillatory</strong> <strong>shear</strong> behavior <strong>of</strong> entangledpolymer solutions: Particle track<strong>in</strong>g velocimetric <strong>in</strong>vestigation. J Rheo 52(2):341–35823. Shih W-H, Shih WY, Kim S-I, Liu J, Aksay IA (1990) Scal<strong>in</strong>g behaviour <strong>of</strong> the elastic properties<strong>of</strong> colloidal gels. Phy Rev A 42(1):4772–477924. Thibierge C, L’Hote D, Ladieu F, Tourbot R (2008) A method for measur<strong>in</strong>g the nonl<strong>in</strong>earresponse <strong>in</strong> dielectric spectroscopy through third harmonics detection, Rev Sci Instr 79:103905–10391025. Wilhelm M, Mar<strong>in</strong>g D, Spiess H-W (1998) Fourier-transform <strong>rheology</strong>. Rheol Acta 37:399–40526. Wilhelm M, Re<strong>in</strong>heimer P, Ortseifer M (1999) High sensitivity Fourier-transform <strong>rheology</strong>.Rheol Acta 38:349–35627. W<strong>in</strong>ter HH, Mours M (1997) Rheology <strong>of</strong> polymers near liquid-solid transtion. Adv PolymSci 134:165-234.28. Yu W, Bousm<strong>in</strong>a M, Grmela M, Zhou C (2002) Model<strong>in</strong>g <strong>of</strong> <strong>oscillatory</strong> <strong>shear</strong> flow <strong>of</strong> emulsionsunder small and large deformation fields. J Rheol 46(6):1401–141829. Yu W, Wang P, Zhou C (2008) General stress decomposition <strong>in</strong> nonl<strong>in</strong>ear <strong>oscillatory</strong> <strong>shear</strong>flow. J Rheol 53(1):215–238