Towards universal access - libdoc.who.int - World Health Organization
Towards universal access - libdoc.who.int - World Health Organization
Towards universal access - libdoc.who.int - World Health Organization
- No tags were found...

Create successful ePaper yourself
Turn your PDF publications into a flip-book with our unique Google optimized e-Paper software.
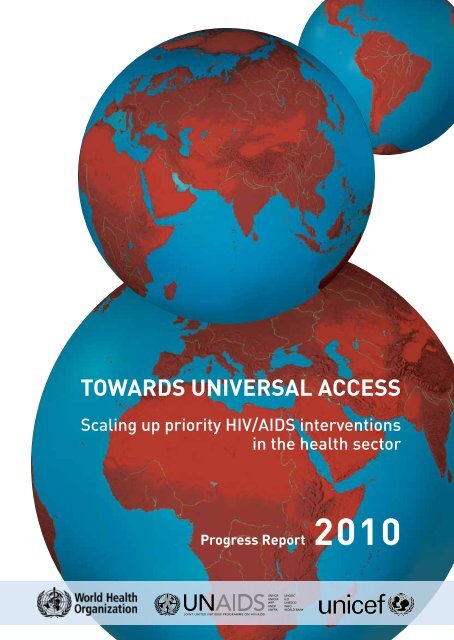
<strong>Towards</strong> Universal AccessScaling up priority HIV/AIDS <strong>int</strong>erventionsin the health sectorProgress Report2010
<strong>access</strong>table of contentsForeword 3Executive summary 51. Introduction 91.1. Data sources and methods 101.2. Structure of the report 112. HIV testing and counselling 132.1. Policies and programmes for HIV testing and counselling 142.2. Availability and uptake of HIV testing and counselling 152.3. Coverage of HIV testing and counselling 172.4. Looking ahead 203. <strong>Health</strong> sector <strong>int</strong>erventions for HIV prevention 233.1. Preventing HIV infection among populations at higher risk for HIV infection 253.1.1. People <strong>who</strong> inject drugs 263.1.2. Men <strong>who</strong> have sex with men 323.1.3. Sex workers 343.2. Selected HIV prevention <strong>int</strong>erventions in the health sector 373.2.1. Male circumcision 373.2.2. Prevention and management of sexually transmitted infections 393.2.3. Blood safety 413.3. New HIV prevention technologies: microbicides and pre-exposure prophylaxis 433.4. Looking ahead 444. Treatment and care for people living with HIV 514.1. Antiretroviral therapy 524.1.1. Global, regional and country progress in <strong>access</strong> to antiretroviral therapy 524.1.2. Access to antiretroviral therapy among women and children 574.1.3. Availability of antiretroviral therapy 594.1.4. Outcomes and impact of scaling up antiretroviral therapy 594.1.5. Prevention and assessment of HIV drug resistance 634.1.6. Antiretroviral drug regimen 654.1.7. Antiretroviral drug price 704.2. Collaborative TB/HIV activities 734.2.1. Decreasing the burden of HIV among people with TB and their community 744.2.2. Decreasing the burden of TB among people with HIV 764.3. Looking ahead 765. Scaling up HIV services for women and children 835.1. Preventing vertical transmission of HIV from mother to child 865.1.1. HIV testing and counselling among pregnant women 865.1.2. Antiretrovirals to prevent mother-to-child transmission of HIV 885.1.3. Antiretroviral prophylaxis for infants born to mothers living with HIV 93PROGRESS REPORT 20101
towards <strong>universal</strong>5.2. Treatment, care and support for women living with HIV and their children 945.2.1. Infant diagnosis 945.2.2. Co-trimoxazole prophylaxis in HIV-exposed children 955.2.3. Antiretroviral therapy for children 965.3. Outcomes and impact of <strong>int</strong>erventions for prevention of mother-to-child transmission of HIV 995.4. Looking ahead 1006. Beyond 2010 105Doing more, more strategically 105Leveraging the global HIV response for broader health and development gains 105<strong>Towards</strong> <strong>int</strong>egrated and strengthened health systems 106Addressing structural barriers through a rights-based approach 106Statistical annexes 108Annex 1. Reported number of facilities with HIV testing and counselling and number of peopleolder than 15 years <strong>who</strong> received HIV testing and counselling, low- and middle-income countries, 2009 108Annex 2. Reported number of targeted service delivery po<strong>int</strong>s for sex workers where sexuallytransmitted infection services are provided (per 1000 sex workers) and prevalence of syphilisamong antenatal care clinic attendees, by country, 2009 112Annex 3. People (all age groups) receiving and needing antiretroviral therapy and coveragepercentages, 2008–2009 114Annex 4. Reported number of people receiving antiretroviral therapy in low- and middle-incomecountries by sex and by age, and estimated number of children receiving and needing antiretroviraltherapy and coverage percentages, 2009 120Annex 5. Preventing mother-to-child transmission of HIV in low- and middle-income countries, 2009 126Annex 6. Estimated numbers of people (all ages combined) and children younger than 15 yearsreceiving and needing antiretroviral therapy and antiretrovirals for preventing mother-to-childtransmission and coverage percentages in low- and middle-income countries by WHO andUNICEF regions, 2009 133Annex 7. Classification of low- and middle-income countries by income level, epidemic level,and geographical, UNAIDS, UNICEF and WHO regions 134Annex 8. List of indicators in the WHO, UNICEF and the health sector response to HIV/AIDS, 2010 139Explanatory notes 1412 TOWARDS UNIVERSAL ACCESS: Scaling up priority HIV/AIDS <strong>int</strong>erventions in the health sector
<strong>access</strong>forewordThis year’s report on HIV/AIDS <strong>int</strong>erventions in the health sector presents strong evidence of progress in the global effortto fight HIV/AIDS, but it also makes clear how much work remains to be done.In 2009, countries, partners and communities succeeded in scaling up <strong>access</strong> to HIV prevention, treatment and care.Important gains have been made towards the goal of eliminating mother-to-child transmission of HIV by 2015. Over halfof all pregnant women living with HIV in low- and middle-income countries received antiretrovirals to prevent HIV frombeing transmitted to their babies, and more children living with HIV are benefiting from treatment and care programmes.Community-driven, rights-based prevention programmes have contributed to lowering the number of HIV infections. WHO’srevised guidelines for antiretroviral therapy now recommend initiation of therapy at an earlier stage of disease and, oncefully implemented, these changes will help to further reduce the morbidity and mortality due to HIV.These advances are all cause for encouragement. Nevertheless, this report also demonstrates that, on a global scale, targetsfor <strong>universal</strong> <strong>access</strong> to HIV prevention, treatment and care will not be met by 2010.Only one third of people in need have <strong>access</strong> to antiretroviral therapy, coverage of prevention <strong>int</strong>erventions is still insufficient,and most people living with HIV remain unaware of their serostatus. Stigma, discrimination and social marginalizationcontinue to be experienced daily by people <strong>who</strong> are the most affected by HIV and hardest to reach in many countries,including people living with HIV, sex workers, injecting drug users, men <strong>who</strong> have sex with men, transgender people,prisoners and migrants.At the same time, the financial crisis and resulting economic recession have prompted some countries to reassess theircommitments to HIV programmes. Reduced funding for HIV services not only risks undoing the gains of the past years,but also greatly jeopardizes the achievement of other Millennium Development Goals, especially those related to maternaland child health.While the global HIV response may have exposed the shortcomings of current health systems, it has also driven moreconcerted action towards addressing broader systemic issues, including human resource capacity, physical infrastructure,supply chains, health financing and information systems.As many countries have shown, the ongoing scale-up of HIV programmes can be successfully leveraged to tackle longstandingsystemic bottlenecks that have prevented other health outcomes from being achieved. We must also strategically<strong>int</strong>egrate HIV/AIDS <strong>int</strong>erventions <strong>int</strong>o national health services, strategies and plans, including those for sexual, reproductive,maternal and child health, tuberculosis, sexually transmitted infections and harm reduction.Special approaches remain necessary to address the particular circumstances and needs of those populations at greaterrisk for HIV infection. Rights-based national strategies must include special efforts to reach the poorest and those <strong>who</strong> aresocially excluded. Programmes must be designed and delivered in ways that ensure equity in <strong>access</strong>, including for childrenand women. Only such a combined commitment to programme planning and delivery, built upon a solid primary health-carePROGRESS REPORT 20103
3. <strong>Health</strong> Sector Interventions forHIV PreventionKey findingsI. Preventing HIV infection among populations at higher risk for HIV infectionn More countries reported conducting surveillance for HIV among selected populations at higher risk for HIV infection.Of 149 low- and middle-income countries surveyed, 42 reported conducting surveillance for HIV amonginjecting drug users versus 41 countries in 2008. The number of countries that reported conducting HIVsurveillance among men <strong>who</strong> have sex with men increased from 44 to 54, and among sex workers from65 to 74.n The median percentage of injecting drug users reached with HIV prevention programmes in the 12 months precedingthe surveys was 32% among 27 countries reporting data in 2009.n Coverage of harm reduction programmes remained limited in 2009. Among 92 reporting countries, 36 hadneedle and syringe programmes, and 33 offered opioid substitution therapy. In countries reporting needleand syringe programmes, the number of syringes distributed per injecting drug user per year was still belowthe <strong>int</strong>ernationally recommended level of 200 syringes per injecting drug user per year.n The median percentage of men <strong>who</strong> have sex with men reached with HIV prevention programmes in the 12 monthspreceding the surveys was 57% among 21 countries reporting data in 2009. Regionally, median coverage in 2009was highest at 63% in Europe and Central Asia.n The median percentage of sex workers reached with HIV prevention programmes in the 12 months preceding thesurveys was 58% among 38 countries reporting data in 2009. The highest median coverage of preventionprogrammes was 76%, observed in Latin America and the Caribbean.II. Selected HIV prevention <strong>int</strong>erventions in the health sectorn Additional progress has been made in scaling up male circumcision programmes in the 13 priority countries ofsub-Saharan Africa. As of January 2010, over 133 000 male circumcisions had been done in six countriesproviding data on service delivery.n The global burden of sexually transmitted infections remains high in most regions of the world. Early identificationand treatment of sexually transmitted infections is a critical element in controlling HIV infection, especiallyamong people with multiple sexual partners.n The availability and safety of blood and blood products for transfusion continues to be an issue of concern, especiallyin low-income countries. While 99% and 85% of donations in high- and middle-income countries, respectively,were screened in a quality-assured manner in 2009, in low-income countries the comparable figure was 48%.23
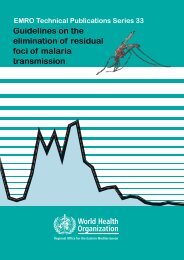
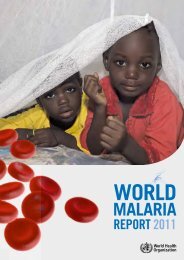
<strong>access</strong>Box 3.7. HIV surveillance of key most-at-risk populations in NigeriaIn order to improve HIV programme planning for high-risk populations, in 2007, a behavioural survey was conducted in Nigeria among brothel- andnon-brothel-based female sex workers, men <strong>who</strong> have sex with men, injecting drug users, transport workers, and men and women in the uniformedservices (armed forces and the police). It was the first time that HIV testing was included in such surveys. The highest HIV prevalence levels, 37%and 30%, were found among brothel-based and non-brothel-based sex workers, respectively. HIV prevalence among those in the armed forces andtransport workers was lower, at 3.1% and 3.7%, respectively, similar to the national adult HIV prevalence estimate of 3.1%.Fig. 3.2. HIV prevalence rates among specific population groups in Nigeria, 2007Total number of people surveyed n =11 175504540Prevalence rates (percentage)35302520151050Brothel basedSWNon-rothel basedSWMSMArmed forcesPoliceTransport workers IDU Adult HIV% estimateSources:1. Adebajo S et al.; Men’s Study Nigeria. HIV and sexually transmitted infections among men <strong>who</strong> have sex with men (MSM) in Nigeria. In: AIDS 2008 – XVIIInternational AIDS Conference, Mexico City, Mexico, 3–8 August 2008 [Abstract no. A-072 -0130-04898].2. Integrated biological and behavioural surveillance survey (IBBSS). Nigeria, Federal Ministry of <strong>Health</strong>, 2007.It is important to design and implement <strong>int</strong>erventionsaimed at reaching partners of sex workers with preventionprogrammes to facilitate both negotiated safer sexpractices between client and worker, and to promote safersex with other non-commercial sex partners. In a studyconducted in Kampala, Uganda in 2009, 573 male partnersof female sex workers were surveyed, of <strong>who</strong>m 461 (84%)were paying and 90 (16%) were non-paying partners.Average HIV prevalence among sex partners was 18.1%(paying: 17.9%, non-paying: 21.1%). HIV prevalence dataamong index female sex workers were not presented. Malesex partners of female sex workers were at substantiallyhigher risk for HIV infection than adult men in the generalpopulation (43).In 2009, 38 countries reported on the percentage of allsex workers reached with HIV prevention programmesin the 12 months preceding the surveys (Table 3.7).The median percentage of sex workers reached by HIVprevention programmes in survey samples was 58%,with considerable regional variations. The highest mediancoverage of prevention programmes was 76%, observedin Latin America and the Caribbean, followed by 60% inEurope and Central Asia, 52% in sub-Saharan Africa, and40% in East, South, and South-East Asia.Fifty-seven countries reported on the percentage of sexworkers <strong>who</strong> tested HIV-positive in samples surveyedbetween 2007 and 2009. The highest HIV prevalence ratesamong sex workers were observed in countries from sub-Saharan Africa, with large regional variations. In Burundi,Cote d’Ivoire, Guinea and Nigeria, reported HIV prevalencerates exceeded 30%, and in Benin, Chad, Gabon and Togo,they were between 20% and 30%.These data clearly demonstrate the need to greatly expandefforts to improve surveillance activities among sex workersand to strengthen prevention efforts, including throughthe removal of punitive laws and the design of tailored<strong>int</strong>erventions.PROGRESS REPORT 201035
towards <strong>universal</strong>Table 3.7. Coverage of HIV prevention programmes for sex workers (2009), a and percentage ofsex workers living with HIV (2007–2009), in reporting low- and middle-income countriesNumber of countries requested toreport (n = 149Sex workers reached with HIV prevention programmes in the past 12 months bNumber of respondents<strong>who</strong> replied “yes” toboth questionsTotal number ofrespondents surveyedPercentage of sexworkers reachedwith HIV preventionprogrammes (%)Number of sex workers<strong>who</strong> tested positivefor HIVSex workers <strong>who</strong> tested positive for HIVTotal number ofrespondents surveyed,tested for HIVPercentage of sexworkers <strong>who</strong> testedpositive for HIV (%)2009 2007–2009Number of countries reporting 38 57Median all reporting countries 58 ...Europe and Central AsiaAzerbaijan 5 300 1.7Belarus 389 453 86 11 173 6.4Bulgaria 473 799 59 5 799 0.6Georgia 107 160 67 3 154 1.9Kazakhstan 1 984 2 249 88 30 2 249 1.3Kyrgyzstan 420 689 61 11 689 1.6Republic of Moldova 71 301 15 b 22 301 6.1 cMontenegro 1 133 0.8Romania 66 202 33 2 202 1.0Russian Federation 34 750 4.5Serbia 3 139 2.2Tajikistan 331 647 51 18 647 2.8Ukraine 1 920 3 248 59 433 3 284 13.2Uzbekistan 903 2 601 71 57 2 601 2.2Regional median ... ... 60 ... ... ...Latin America and the CaribbeanArgentina 74 1 368 5.4Bolivia (Plurinational State of) 27 6 993 0.4Brazil 1 186 2 523 47 129 2 505 5.1Colombia 993 4 714 21 75 4 817 1.6Cuba d 80 083 82 838 97 158 54 537 0.3Dominican Republic 62 1 300 4.8El Salvador 643 789 77 46 848 4.1 bGuatemala 482 520 93 3 298 1.0Honduras 18 796 2.3Mexico 1 069 1 793 60 97 5 690 1.7Panama 194 255 76Regional median ... ... 76 ... ... ...North Africa and the Middle EastDjibouti 70 79 89 16 79 20.3Morocco 23 965 2.4Sudan … … 2 3 328 0.9Tunisia 268 700 38 3 700 0.4East, South and South-East AsiaAfghanistan 3 368 0.8 0 368 0.0Bangladesh 13 5 197 0.3Cambodia … 2 229 14.7 bChina 45 984 61 903 74 357 61 919 0.6India 82 264 31 2 098 42 434 4.9Indonesia 528 5 187 10.2Iran (the Islamic Republic of)Lao People’s Democratic Republic 634 912 70 7 1 425 0.5Malaysia 68 551 12 58 551 10.5Maldives 0 102 0.0Mongolia 618 835 74Myanmar 148 818 18.136 TOWARDS UNIVERSAL ACCESS: Scaling up priority HIV/AIDS <strong>int</strong>erventions in the health sector
<strong>access</strong>Nepal 11 500 2.2Pakistan 441 4 446 10 104 4 446 2.3Papua New Guinea 84 267 32 56 955 5.9Philippines 5 071 9 208 55 23 9 476 0.2Sri Lanka 0 1 032 0.0Viet Nam 2 501 5 291 47 327 10 326 3.2Regional median ... ... 40 ... ... ...Sub-Saharan AfricaAngola 430 1 848 23Benin 592 1 050 56 250 1 013 24.7Burkina Faso 55 616 8.9Burundi 163 410 39.8Chad 201 1 171 17 220 1 098 20.0Comoros 0 100 0.0Cote d’Ivoire 270 760 35.5Democratic Republic of the Congo 325 2 271 14.3Gabon 208 601 35 100 431 23.2Ghana 16 742 34 990 48Guinea 90 101 89 33 101 32.7Madagascar 12 2 288 0.5Mauritania 11 144 7.6Nigeria 700 2 140 32.7Swaziland 143 143 100Togo 212 723 29.3United Republic of Tanzania 237 349 68Regional median ... ... 52 ... ... ...a 2007–2008 coverage data are available online at http://www.<strong>who</strong>.<strong>int</strong>/hiv/data/en.b A number of countries reported sex-specific, instead of general, data on prevention coverage among responding sex workers surveyed. Although this issue may limitcross-country comparability, it is reasonable to assume that most coverage reported for 2009 refers to surveys conducted among female sex workers. Six out of ninecountries reporting coverage among sex workers of both sexes indicated higher coverage among men, mostly reported from targeted <strong>int</strong>ervention sites.Respondentswere asked the following questions: (1) Do you know where you can go if you wish to receive an HIV test? (2) In the past 12 months, have you been given condoms(e.g. through an outreach service, drop-in centre or sexual health clinic)? The numerator of the indicator is the number of respondents <strong>who</strong> replied “yes” to bothquestions, and the denominator is the total number of respondents surveyed.c The percentage has been statistically adjusted, mostly by using the respondent-driven sampling method.d Figure refers to a period of 3 years.3.2. Selected HIV prevention <strong>int</strong>erventions <strong>int</strong>he health sectorThis section focuses on selected prevention <strong>int</strong>erventionsdelivered in health facilities and includes male circumcision,prevention and management of sexually transmittedinfections, and blood safety.3.2.1. Male circumcisionIn countries with a high HIV prevalence and low rates ofmale circumcision, WHO and UNAIDS recommend thatmale circumcision be included as an additional health sector<strong>int</strong>ervention to reduce the risk of heterosexual transmissionof HIV to men (44).Clinical trials from Kisumu, Kenya, Rakai District, Uganda andthe South Africa Orange Farm Intervention Trial showed a53%, 51% and 60% reduction, respectively, in HIV infectionamong men <strong>who</strong> were circumcised (45–47). Recent researchdata also demonstrate the benefits of male circumcisionin relation to heterosexual transmission of HIV as well asprotection against other sexually transmitted infections.In a study conducted among African HIV-1 serodiscordantcouples where the male was HIV-positive, it was observedthat circumcision potentially reduced the risk of male-tofemaletransmission of HIV-1. In a randomized trial carriedout in Uganda to assess the effects of male circumcisionon high-risk human papillomavirus, male circumcision wasfound to reduce the incidence of multiple infections dueto high-risk human papillomavirus in HIV-infected (48) and-uninfected men, and had a beneficial effect on clearance ofhigh-risk 1 human papillomavirus in HIV-negative men (49).Researchers have also found that regardless of the statusof infection with herpes simplex virus-2, male circumcisionmay lead to a reduction in genital ulcer disease (50).Research has also been undertaken to better understand theimplications of large-scale programme implementation. Arecent analysis (51) estimated the overall cost and impact ofrapidly scaling up male circumcision services in 14 countriesin Eastern and Southern Africa with a view to reaching 80%1 High-risk human papillomavirus is confined to certain subtypes with a high riskfor cervical cancer and genital warts.PROGRESS REPORT 201037
towards <strong>universal</strong>of newborns and adult males aged 15–49 years by 2015.It concluded that such an approach would require overallinvestments of US$ 4 billion, but could prevent more than fourmillion adult HIV infections over 15 years (2009–2025) andresult in cost savings of US$ 20.2 billion over the same period.In 2007, WHO and UNAIDS convened a meeting of experts,country managers, policy-makers and implementingpartners. Thirteen countries (Botswana, Kenya, Lesotho,Malawi, Mozambique, Namibia, Rwanda, South Africa,Swaziland, United Republic of Tanzania, Uganda, Zambia andZimbabwe) were identified as priority countries for scaleupof male circumcision based on their epidemiologicalprofiles (44). According to a recent assessment, countrieshave advanced further in expanding <strong>access</strong> to malecircumcision (52). Robust national leadership within a strongpartnership framework remains key to accelerating progress.The support of country champions – for example, traditionalleaders and politicians in Botswana and Kenya – has beenessential to improve uptake, as has been the implementationof partnerships involving national governments, donors andtechnical support agencies.Situational analyses have now been conducted in all 13priority countries. Appropriate policies and strategieson male circumcision are being developed in most ofthem. In 2009, Zimbabwe launched its policy on malecircumcision. In Lesotho, the policy has been approved andshould soon be launched. Service delivery was expanded inKenya from 41 to 230 districts, while in Namibia, Rwanda,South Africa, United Republic of Tanzania and Swaziland,priority districts and sites have been identified for scale-up.Quality assurance strategies, based on WHO’s Guide (53)and Toolkit (54), are being implemented in Swaziland andKenya. Monitoring and evaluation indicators are also beinggradually <strong>int</strong>roduced <strong>int</strong>o routine data collection systemsin Botswana and Kenya. Communication strategies arebeing developed in Kenya, Namibia and Swaziland. Trainingprogrammes have been implemented in almost all prioritycountries. Further research on male circumcision is eitherongoing or planned by countries, focusing on behaviour,communications, community impact, costing, devices formale circumcision, monitoring and service delivery (52).A recent survey (56) gathered data on the status of servicedelivery for male circumcision in six countries as of January2010 (Table 3.8), where over 133 000 circumcisions hadbeen done.While considerable progress has been made in establishingpolicy and strategies, the lack of human resources remainsan important constra<strong>int</strong> for country programming at allBox 3.8. Scaling up male circumcision in Kenya: the rapid results initiative (55)In 2008, the Government of Kenya launched the Voluntary Medical Male Circumcision programme with the objective of circumcising 860 000 menover the four following years. However, with only 40 000 men circumcised between October 2008 and October 2009, a “rapid results initiative”was implemented in 11 districts of Nyanza province, which has the highest HIV prevalence and the lowest male circumcision rates in the country.With the application of the Rapid Results Initiative strategy, 36 077 men were circumcised in 30 working days between November and December2009. An average of 10 male circumcisions was done daily per team, and 39% of men received an HIV test as well. Of all male circumcisions, 55%were performed on adults older than 15 years, 22% for less 12 years old and 23% among 12–15-year-olds. The male circumcision package of careincluded counselling for male circumcision, provider-initiated HIV testing and counselling, clinical examination, management of sexually transmittedinfections and other genitourinary conditions, surgical excision of foreskin using a forceps-guided method, post-operative care and follow up.The Rapid Results Initiative demonstrated that it is possible to expand <strong>access</strong> to and uptake of male circumcision. The required investment using theRapid Results Initiative approach, at US$ 39 per circumcision, was 56% lower than the average recorded in the preceding 13 months. The Initiativealso highlighted the importance of sustaining demand for services through continued social mobilization, as marked fluctuations <strong>int</strong>erfered withthe optimal allocation of staff and supplies, and reduced overall efficiency. Lower than expected rates of testing and follow up are also issues thatmust be addressed as male circumcision is further rolled out.Table 3.8. Update on male circumcision service delivery, selected countries, 2008–Jan 2010 (56)Country Botswana Kenya South Africa Swaziland Zambia ZimbabweProgramme start date Apr 2009 Sept 2008 Jan 2008 Jan 2008 July 2009 May 2009Cumulative number of male circumcisions since programmeimplementation4 326 90 396 14 253 5 122 16 801 3 000Number of male circumcisions (Nov–Dec 09) 580 36 000 1 547 1 816 6 171 1 510Source: Male circumcision for HIV prevention: progress in scale-up (56)38 TOWARDS UNIVERSAL ACCESS: Scaling up priority HIV/AIDS <strong>int</strong>erventions in the health sector
<strong>access</strong>levels, as understaffing is a chronic issue in all the countriesthat are scaling up male circumcision. Current achievementsnotwithstanding, it is necessary to reinforce and strengthennational political support for male circumcision scale-up,reach out to traditional providers and community leadersto promote buy-in and uptake, and accelerate the pace ofservice delivery roll-out. As services are scaled up, it is criticalto closely monitor the implications of male circumcision forwomen and mitigate against any adverse societal effects thatmight negatively impinge on their health.3.2.2. Prevention and management of sexuallytransmitted infectionsThe rapid identification and treatment of sexually transmittedinfections is a key element in controlling the spread of HIV,as sexually transmitted infections synergistically increasethe risk of HIV transmission (57). Scientific evidence suggeststhat sexually transmitted infections increase HIV sheddingin the genital tract of HIV-positive individuals (therebyboosting infectiousness) and disrupt mucosal barriers,leading to increased susceptibility to HIV in HIV-negativeindividuals. 1Various <strong>int</strong>erventions for controlling sexually transmittedinfections have proven effective, including the syndromic1 In low-level or concentrated HIV epidemics, particularly where the prevalenceof sexually transmitted infections is high and their control is poor, treatment ofcurable sexually transmitted infections is likely to have a considerable impacton HIV incidence at the population level. In generalized HIV epidemics witha stable or declining prevalence of HIV infection, the effect of treatment ofcurable sexually transmitted infections on HIV incidence at the populationlevel is not measurable.management of genital ulcer disease and urethral discharge,testing pregnant women and individuals diagnosed withother sexually transmitted infections for syphilis, treatingmale partners of patients with trichomoniasis, providingbrief counselling about risk reduction for HIV and sexuallytransmitted infections, and treating partners of patientswith gonococcal, chlamydial and syphilis infections. These<strong>int</strong>erventions have resulted in a decline in the prevalence ofsexually transmitted infections such as chancroid, syphilisand gonorrhoea in many parts of the world. The control ofsexually transmitted infections may have also contributedto the gradual decline in HIV prevalence in several lowandmiddle-income countries (58). The most recent globalestimates of the incidence and prevalence of sexuallytransmitted infections are from 2005. Unfortunately, theglobal burden of sexually transmitted infections remainshigh in most regions of the world (Box 3.9) (59).Services for sexually transmitted infections are a criticalcomponent of comprehensive HIV prevention programmes.In addition to addressing issues specific to sexuallytransmitted infections, they provide an opportunity tooffer provider-initiated testing and counselling for HIV,and can serve as entry po<strong>int</strong>s to HIV care and treatment<strong>int</strong>erventions. Data on sexually transmitted infections canalso assist in <strong>int</strong>erpreting the epidemiological patterns ofHIV. For example, syphilis infection rates among antenatalcare attendees can provide an early warning of changesin risk behaviour associated with HIV transmission in thegeneral population. Acute sexually transmitted infectionssuch as gonorrhoea and primary and secondary syphilisBox 3.9. Global estimates of the incidence and prevalence of sexually transmitted infectionscaused by Chlamydia trachomatis, Neisseria gonorrhoeae, Treponema pallidum, and TrichomonasvaginalisIn 2005, there were over 448 million new sexually transmitted infections: 101 million new cases of chlamydial infection, 88 million new cases ofgonorrhoea, 11 million new cases of syphilis, and 248 million new cases of trichomoniasis (59).Number of new infections in adult males and females between the ages of 15 and 49 years, 2005 (in millions)Treponema pallidumChlamydia trachomatis Neisseria gonorrhoeaeWHO Region(syphilis)Trichomonas vaginalis TotalAfrican Region 10.0 17.5 3.4 78.8 109.7Region of the Americas 22.4 9.5 2.4 54.9 89.2Eastern Mediterranean Region 5.7 6.5 0.6 12.6 25.4European Region 15.2 4.6 0.3 24.5 44.6South-East Asia Region 6.6 22.7 2.9 38.6 70.8Western Pacific Region 41.6 26.9 1.1 39.1 108.7Total 101 88 11 248 448At any po<strong>int</strong> in 2005, there were 318 million prevalent cases of the four infections; some 98 million adults were infected with Chlamydia trachomatis,31 million with Neisseria gonorrhoeae, 36 million with Treponema pallidum, and 153 million with Trichomonas vaginalis. These infections, however, areonly four of the over 30 infections that can be transmitted sexually. Furthermore, it has been estimated that there were over 23.6 million newcases of herpes simplex virus-2 in 2003. Although these estimates are based on limited data from surveillance and special studies, they indicatethat the global burden of sexually transmitted infections remains high. More accurate estimates require higher-quality data collection on sexuallytransmitted infections at the country and regional levels.PROGRESS REPORT 201039
towards <strong>universal</strong>also serve as biomarkers of HIV and can indicate theeffectiveness of programmes for sexually transmittedinfections (Box 3.10). While broad-based services are wellsuited to address general population needs, in areas withhigh levels of stigma or legal barriers, dedicated servicesfor groups at higher risk for HIV acquisition, such as sexworkers and men <strong>who</strong> have sex with men, may need to beoffered to ensure adequate levels of <strong>access</strong> to the necessaryhealth <strong>int</strong>erventions.Two indicators related to sexually transmitted infectionwere part of the 2010 reporting process. Fifty-one and 77of 193 Member States provided data, respectively, on the (i)number of targeted service delivery po<strong>int</strong>s for sex workerswhere sexually transmitted infection services are provided,per 1000 sex workers, and (ii) on the prevalence of syphilisamong antenatal care attendees (see Annex 2).The overall median among reporting countries was 1.3targeted clinics per 1000 sex workers in 2009, but thisfigure masks important regional variations. Availabilityof targeted clinics per 1000 sex workers was highest insub-Saharan Africa, with 2.0 targeted clinics per 1000sex workers (Table 3.9). The lowest median figure, at0.5, was found in Eastern Europe and Central Asia.While an important indicator of <strong>access</strong>, these data mayunderestimate true coverage, as sex workers may alsoreceive services for sexually transmitted infections innon-targeted clinics.Box 3.10. Assessing the impact of HIV prevention <strong>int</strong>erventions among female sex workers inKarnataka state, India: the Avahan ProjectThe Avahan Project is a large-scale HIV prevention programme focused on most-at-risk groups in the six Indian states with the highest HIV prevalence.Launched in 2003, the Project supports a diverse package of <strong>int</strong>erventions that includes behaviour change communication to promote condomuse, regular screening for sexually transmitted infections, establishment of dedicated sexual health services for sex workers and their partners,identification and syndromic case management of sexually transmitted infections, routine speculum examination, periodic presumptive treatmentevery three to six months for chlamydial infection and gonorrhoea, screening and treatment for syphilis, and HIV counselling and testing. Womenfound to be HIV-positive are provided support and counselling, and referred for care.In order to assess the impact of these <strong>int</strong>erventions on prevalence rates of HIV and sexually transmitted infections, condom use and programmecoverage, baseline (7–19 months after programme initiation) and follow up (28–37 months after programme initiation) <strong>int</strong>egrated biological andbehavioural surveys were conducted among randomly selected female sex workers in five districts in Karnataka state between 2004 and 2009(60). Among the 4712 sex workers <strong>who</strong> participated in the study, over 85% reported contact by a peer educator and having visited a project clinicfor sexually transmitted infection. Comparing baseline and follow-up figures, the assessment found a statistically significant reduction in theprevalence rates of HIV, from 19.6% to 16.4%; high-titre syphilis, from 5.9% to 3.4%; and chlamydial infection and/or gonorrhoea, from 8.9% to7.0%. Reported condom use with repeat clients increased, from 66.1% to 84.1%.The Avahan HIV prevention programme combined sexual risk reduction strategies with improved <strong>access</strong> to sexual health services, resulting inimportant reductions in the prevalence rates of both HIV and sexually transmitted infections. It is an example of how it is possible to successfully<strong>int</strong>egrate service provision for HIV and sexually transmitted infections to most-at-risk groups.Table 3.9. Number of targeted service delivery po<strong>int</strong>s for sex workers where services forsexually transmitted infection are provided, and prevalence of syphilis among antenatal careattendees aRegion Number of countries reporting b (per 1000 sex workers) Number of countries reporting b among antenatal care attendeesMedian number of targetedservice delivery po<strong>int</strong>s for sexworkers where services for sexuallytransmitted infection are providedMedian prevalence of syphilisEastern Europe and Central Asia 9 0.5 6 0.1%East, South, and South-East Asia 15 1.7 17 0.5%Latin America and Caribbean 13 1.2 18 0.5%North Africa and the Middle East 2 4North America 0 0Sub-Saharan Africa 11 2.0 30 1.5%Western and Central Europe 1 2Global total 51 1.5 77 0.7%a Regional medians are not provided if fewer than five countries provided data.b Number of countries requested to report: 193. See Annex 2 for country data.40 TOWARDS UNIVERSAL ACCESS: Scaling up priority HIV/AIDS <strong>int</strong>erventions in the health sector
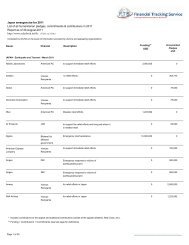
<strong>access</strong>The median reported prevalence of syphilis among antenatalcare attendees was 0.7%, with a high of 1.5% in sub-SaharanAfrica and a low of 0.1% in Eastern Europe and CentralAsia. These averages, however, hide marked differencesin prevalence rates across countries. For example, inMadagascar, syphilis prevalence was 7.7%, and CentralAfrican Republic, Chad, Fiji, Ghana, Grenada, Kiribati,Mozambique, Papua New Guinea, and Zambia all haveprevalences above 5%.It is not possible at this time to assess trends over time dueto the lack of reporting of longitudinal data to WHO; yet, asthe breadth and robustness of monitoring and evaluationsystems improve and more countries contribute data, itis expected that future surveys will generate more andbetter-quality information on services and <strong>int</strong>erventions forsexually transmitted infection.3.2.3. Blood safetyThe WHO Global Database on Blood Safety (GDBS) wasestablished in 1998 to address global concerns aboutthe availability, safety and <strong>access</strong>ibility of blood fortransfusion. The objective of this activity is to collect andanalyse data from all countries on blood and blood productsafety as the basis for effective action to improve bloodtransfusion services globally. A questionnaire, which hasbeen developed as a standardized tool for the collection ofdata, is sent to national health authorities for completion.The questionnaire is based on the WHO Aide-mémoire fornational health programmes: blood safety, which covers thefour major components of the <strong>int</strong>egrated strategy for bloodsafety advocated by WHO (61). 1Data obtained through the questionnaire are supplementedby information collected by experts during on-site visitsto ministries of health and blood transfusion services.As part of ongoing activities, and to supplement morecomprehensive data collection using the standardizedGDBS questionnaire, a list of blood safety indicators anda simplified data collection tool have been developed tocollect information on 20 key quantitative indicators onblood safety. Blood safety indicators have been collectedon an annual basis since 2006. The data collected throughthe GDBS questionnaire and the blood safety indicatorsare analysed and the reports are published on the WHOwebsite (62). This is updated with the availability of thelatest global data. The focus of the analysis is to provideinformation on the current status of blood transfusionservices, assess country needs for improving blood safety,formulate strategic recommendations to countries, plan andimplement activities, and evaluate progress.1 These include: (i) establishment of a nationally coordinated blood transfusionservice, (ii) collection of blood only from voluntary non-remunerated blooddonors from low-risk populations, (iii) testing of all donated blood, includingscreening for transfusion-transmissible infections, blood grouping andcompatibility testing, and (iv) reduction in unnecessary transfusions throughthe effective clinical use of blood, including the use of simple alternatives totransfusion (crystalloids and colloids), wherever possible.An estimated 93 million blood donations are given globallyevery year. 2 About half are collected in high-incomecountries and the remaining half in low- and middle-incomecountries. While important progress was made in the pastdecade in improving the supply of quality-assured bloodand blood products worldwide, the availability and safety ofblood supplies for transfusion remain issues of concern inmultiple settings, especially in low-income countries. Bloodshortages not only lead to serious health consequencessuch as death from postpartum haemorrhage but alsocontribute to an increased risk of HIV and hepatitis becausean inadequate stock of blood forces a reliance on unsafefamily or paid donors and increases pressure to issueblood without testing. Decreasing the incidence of HIVdue to unsafe blood transfusion requires the implementationof an <strong>int</strong>egrated strategy with a nationally coordinatedblood transfusion service; collecting blood from voluntary,unpaid donors; screening all donated blood for transfusiontransmissibleinfections such as HIV; and ensuring adequatetraining and follow up of health-care providers.The generally accepted minimum level of donation requiredto meet a country’s most basic requirements for blood isestimated at 1% of the total population. These requirementsare higher in countries with more advanced health-caresystems. The availability of blood, as measured by theratio of donations per 1000 population, varies widely andthe lowest levels of availability are found in low- andmiddle-income countries. Indeed, blood donation rates aremore than 13 times higher in developed countries than indeveloping countries: the mean number of donations per1000 population is 45.4 (range 13.6–72.5) in high-incomecountries, 10.1 (range 1.6–63.2) in middle-income countriesand 3.6 (range 0.4–5.0) in low-income countries.In 2007–08, 46 countries, including 42 low- and middleincomecountries, reported a more than 10% increase involuntary donations in comparison with the previous year’sfigures, while 15 reported a more than 10% drop duringthe same period. Among the 173 countries reporting datain 2007–08, 45 collected less than 25% of their bloodsupplies from voluntary non-remunerated blood donors anda sizeable amount of the blood supplies in these countrieswas still dependent on family/replacement and paid blooddonors. Among 98 low- and middle-income countries forwhich comparable data are available from WHO surveys (62)conducted in 2000–01, 2004–05 and 2007–08, the numberof countries reporting more than 50% of voluntary nonremuneratedblood donations steadily increased.2 Based on data from the 2008 Global Database on Blood Safety (130 countries)and on 2007 data reported directly to WHO (43 countries). An annual surveyis conducted by the WHO Blood Transfusion Safety Programme on 20 keyquantitative blood safety indicators. More comprehensive data collectionis done triennially, based on a set and subset of about 150 questions. Theobjectives are: to assess the global situation on blood safety; to obtain the bestavailable information on blood transfusion services in each Member State; toidentify problems and needs in order to provide appropriate technical support;to identify countries for priority assistance; and to monitor progress and trendsin blood safety.PROGRESS REPORT 201041
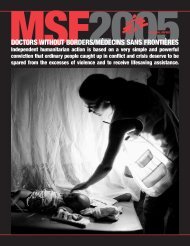
towards <strong>universal</strong>Fig. 3.3. Blood donations per 1000 population, 2007–2008Blood donation per 1000 population2007–2008
<strong>access</strong>Table 3.10. Global situation of donationsscreened in a quality-assured manner,2007–2008Income group(number ofcountries reporting) Total donations% Donationsscreened for HIVin quality-assuredmannerDonations notscreened in qualityassuredmannerHigh-income (34) 26 922 979 99.5% 124 866Middle-income (52) 12 217 378 85.4% 1 786 622Lower-income (29) 1 873 061 47.8% 977 331Total (115) 41 013 418 93.1% 2 888 819national blood policy supported by appropriate legislationto promote uniform implementation of standards andconsistency in the quality and safety of blood and bloodproducts (61). Of 94 low- and middle-income countries,72 reported having a national blood policy. A further 67had in place national strategic plans on blood safety, and 50informed that they had initiated implementation of these.Among reporting countries, 48 indicated having specializedlegislation on blood transfusion safety, and only 41 reportedhaving a national mechanism for decision-making on bloodtransfusion safety.While trends have generally been positive in the past 10years, it is important to strengthen ongoing efforts toscale up the availability of safe blood supplies worldwide,especially in the worst-affected low- and middle-incomecountries. WHO has called all Member States to implementquality-assured screening of all donated blood by 2013 (63). Inorder to catalyse and build on current efforts, in June 2009,a Global Consultation on Voluntary Non-RemuneratedBlood Donations was held in Melbourne, Australia, andparticipants agreed to work towards the goal of achieving100% voluntary non-remunerated blood donations by 2020.3.3. New HIV prevention technologies:microbicides and pre-exposure prophylaxisAntiretroviral-based prevention strategies, includingmicrobicides and pre-exposure prophylaxis, are promisingnew technologies that hold the potential to further expandthe tools available for HIV prevention. For the first time, atenofovir (TDF)-containing vaginal microbicide was foundto have a statistically significant protective effect againstHIV. Research conducted by a group from the Centre for theAIDS Programme of Research in South Africa (CAPRISA) atthe University of KwaZulu-Natal, Family <strong>Health</strong> Internationaland CONRAD presented encouraging results of the CAPRISA004 trial of tenofovir gel during the XVIII International AIDSConference in Vienna, Austria in July 2010.The Phase IIb, double-blinded, randomized, placebocontrolledtrial carried out in rural and urban South Africaassessed the effectiveness of a 1% concentration of tenofovirgel for the prevention of HIV among sexually active HIVnegativewomen aged 18–40 years. The results of the trialdemonstrated a 39% reduction in the risk of acquiring HIVamong women using tenofovir gel after 30 months of use.Subgroup analysis in women <strong>who</strong> had higher adherenceshowed that they enjoyed greater protection from HIVthan women with lower adherence; among those <strong>who</strong> hadadherence levels higher than 80%, HIV risk was reduced by54%. Women using the tenofovir-containing gel were alsohalf as likely to acquire herpes simplex virus type 2 (HSV-2),the virus that causes genital herpes, an important secondaryfinding, particularly as HSV-2 is an important risk factor foracquiring HIV (64–66). While pivotal, this recent developmenthighlights the need for further research on microbicidesas well as additional studies, including sociobehaviouralanalyses, to validate the protective effect of tenofovir gelin other countries and populations. It is important to notethat HIV incidence in the population of women receiving theeffective gel was still very high, at more than 5% per year.Pre-exposure prophylaxis is the use of an active antiretroviralagent by HIV-uninfected people to block the acquisition ofinfection. The potential efficacy of pre-exposure prophylaxisis currently being studied in numerous randomizedcontrolled trials involving more than 20 000 people aroundthe world. The agents being tested are typically tenofovirdisoproxil fumarate (TDF) or TDF plus emtricitabine (FTC),taken as a daily oral prophylactic dose. Ongoing trials ofdaily pre-exposure prophylaxis address two key end-po<strong>int</strong>s:reduction in HIV acquisition among HIV-uninfected peopleusing pre-exposure prophylaxis and the safety of the drugsin use. Two of these trials should release preliminary resultsin late 2010, with the remaining studies expected to publishconclusive data after 2012.The prospect of large-scale implementation of pre-exposureprophylaxis raises a number of questions, includingtechnical, financial and ethical issues. In order to addresssome of these issues and pave the way for rapid scale-up,should pre-exposure prophylaxis be found to be sufficientlyeffective in clinical trials, WHO, with support from the USNational Institutes of <strong>Health</strong>, convened a multi-stakeholderconsultation meeting in October 2009. Among the topicsexplored were the technical, financial and safety implicationsassociated with providing a relatively expensive antiretroviraldrug for daily use to people <strong>who</strong> are otherwise healthy, howoften to re-test people on pre-exposure prophylaxis for HIV,how to cope with the greater demand for laboratory teststo monitor drug safety and adverse effects (e.g. renal andbone density tests), how to promote adherence to a dailyprophylactic regimen, how best to leverage drug supplysystems to ensure a consistent supply, whether and how totarget certain groups for use of pre-exposure prophylaxis,how to monitor and address the eventual emergence ofPROGRESS REPORT 201043
towards <strong>universal</strong>Box 3.11. Positive <strong>Health</strong>, Dignity and PreventionPositive <strong>Health</strong>, Dignity and Prevention (PHDP) 1 focuses on improving and ma<strong>int</strong>aining the health and well-being of partners, families andcommunities. This is in direct contrast to previous approaches to “positive prevention”, which could be construed as treating people living withHIV as vectors of transmission. By focusing on the journey experienced by people living with HIV from testing to support, care and treatment,PHDP positions the health and social needs, and experiences of, people living with HIV within a human rights framework. Training of health-careworkers – both facility- and non-facility-based – in the principles and practical elements of PHDP and involvement of people living with HIV in thedesign, implementation, monitoring and evaluation of HIV prevention services are vital elements to strengthen the health-care sector responseto HIV prevention (67).For the National Empowerment Network of People Living with HIV/AIDS in Kenya (NEPHAK), 2 PHDP is an important framework, both for programmesat the grass-roots level, and for policy and advocacy at the national level.At the district level, NEPHAK along with its partners Family <strong>Health</strong> International (FHI) and USAID has initiated the formation of mother’s clubslinked with health facilities to promote prevention of mother-to-child transmission of HIV, provide counselling services, and build the capacity ofHIV-positive mothers and fathers and discordant couples to understand their role in preventing transmission. Under the same partnership, NEPHAKtrains people living with HIV to work within health-care facilities as drug adherence counsellors, referring clients to available services withinhealth-care facilities and the community. It is a member of the Technical Working Group on “Prevention with Positives” and assists the work of peereducators. It also supports Ambassadors of Hope, <strong>who</strong> reach out to communities and their support group members with anti-stigma messages onHIV and AIDS and tuberculosis, and help in the work of health-care facilities by facilitating transport to the services provided.NEPHAK assisted the Government of Kenya in January 2010 in developing the third National HIV/AIDS Strategic Plan (NASP III) by securing theparticipation of people living with HIV and including of their views. In collaboration with the National AIDS and STI Control Programme (NASCOP)and other partners, NEPHAK recently unveiled guidelines on HIV prevention for and by people living with HIV.NEPHAK, with the Global Network of People living with HIV/AIDS (GNP+), is documenting the experiences of people living with HIV and using thisevidence to engage policy-makers, the media and community leaders in advocacy for a supportive social, political and legal environment for them.As part of operationalizing PHDP, NEPHAK is advocating for people living with HIV to be supported in understanding their rights and responsibilities.At the same time, the capacity and understanding of health workers need to be broadened and attitudes changed so that they recognize and respectthe rights of people living with HIV, including their right to sexual and reproductive health.1 More information on Positive <strong>Health</strong>, Dignity and Prevention (PHDP) at www.gnpplus.net2 More information on National Empowerment Network of People Living with HIV/AIDS in Kenya (NEPHAK) at www.nephak.org.antiretroviral resistance, how to avoid behavioural riskcompensation among users of pre-exposure prophylaxis,and how to monitor the rate of acquisition of HIV infectionamong those using pre-exposure prophylaxis.Working with UNAIDS and other key partners, WHO isexploring potential strategies for service delivery, earlyidentification of programme bottlenecks and guidelinedevelopment. WHO is also working to determine additionaldata and programme needs for development of guidanceand support to the health sector to ensure that pre-exposureprophylaxis can be implemented safely and effectively ifproven effective at a reasonable level.3.4. Looking aheadConsiderable progress has been made over the pasttwo decades in reducing the rate of new HIV infectionsworldwide. From a peak of around 3.5 million in 1996, thenumber of new infections per year has already fallen by aquarter (2). Encouraging declines in HIV prevalence amongyoung people aged 15–24 years have been reported inseveral countries with generalized epidemics (7). However,with 2.7 million new infections in 2008, including 430 000in children, the HIV epidemic remains a major obstacle tothe achievement of the Millennium Development Goals,including MDG4 on child mortality and MDG5 on maternalmortality.This scenario calls for a redoubling of prevention efforts,and the health sector remains a key entry po<strong>int</strong> for providingand delivering HIV prevention services including HIV testingand counselling (see Chapter 2). Importantly, continuedinvestments in the development and strengthening ofnational HIV surveillance systems are required to monitortrends over time in HIV prevalence and incidence, mortalityand behaviours associated with HIV transmission, as well asto assess the population-level burden of HIV.Developing high-quality, evidence-based <strong>int</strong>erventionsdemands carefully triangulating different data sources bycountry. Data produced by HIV surveillance systems andanalysed in conjunction with data from programme monitoring44 TOWARDS UNIVERSAL ACCESS: Scaling up priority HIV/AIDS <strong>int</strong>erventions in the health sector
<strong>access</strong>are essential to more adequately understand whether thescale, focus and approach of programmatic responses areappropriate. Additional modelling and costing of <strong>int</strong>erventions,including their impact on overall epidemiological dynamics,are also called for. These are essential steps to enhanceprogramme design and effectiveness, and to develop longterm,sustainable financing mechanisms.The development of new strategies and technologies inrecent years has expanded the toolkit of available prevention<strong>int</strong>erventions. Accelerated efforts are now needed to expand<strong>access</strong> to and uptake of these <strong>int</strong>erventions, includingamong those groups most vulnerable to HIV infection.This entails scaling up, where appropriate, male circumcisionservices through an <strong>int</strong>egrated, comprehensive preventionstrategy, accompanied by appropriate training for healthcareworkers and the provision of accurate information onthe limits of its protective effect. A growing body of evidencealso clearly demonstrates that antiretroviral therapy hasan important secondary prevention benefit. Scaling upHIV testing and counselling, periodic re-testing (68) andtreatment to all those in need will amplify this preventivebenefit and further reduce HIV incidence on a populationlevelbasis (see Chapter 4).A promising pipeline of new prevention technologies is alsoon the horizon. The proof of concept that second-generationmicrobicides containing antiretrovirals have a preventionbenefit has raised hopes that a female-controlled preventiontool may soon be available. Additional confirmatory andexploratory research is now needed to convert preliminaryfindings <strong>int</strong>o commercially available products, and todevelop approaches to include them in existing preventionand treatment programmes.In addition to health sector <strong>int</strong>erventions, scaling up HIVprevention involves pulling together multiple disciplinesand methods, and considering behavioural and structuralapproaches.. Such a combination of prevention <strong>int</strong>erventionsrequires action on both immediate personal risks andon the underlying drivers of the epidemic. It entailsdeveloping a multi-pronged strategy providing servicesand programmes for individuals as well as investment instructural <strong>int</strong>erventions, including legal reforms to outlawdiscrimination against people living with HIV, and thepromotion of safe and supportive environments based onhuman rights and reduction of vulnerability (69,70).It is also essential to gather additional evidence on optimalHIV prevention strategies for other key populations at higherrisk for HIV infection, including youth and serodiscordantcouples, and to develop programmes that are tailoredto their needs, and reflect prevailing behavioural andepidemiological patterns.Focused attention must also be paid to populations andgroups at higher risk for HIV infection, such as migrants, sexworkers, injecting drug users, prisoners, and men <strong>who</strong> havesex with men and transgender people. Strengthened effortsare urgently called for to provide HIV prevention servicesand <strong>int</strong>erventions at the scale and <strong>int</strong>ensity needed tomatch their continued high risk for acquiring HIV infection.Moreover, increased advocacy is needed to include thesepopulations in existing national HIV surveillance and healthinformation systems.The criminalization of HIV transmission, same-sexrelations, sex work and drug use impedes the uptakeof effective <strong>int</strong>erventions to prevent HIV transmissionamong these groups, limits <strong>access</strong> to health services andmakes them significantly less likely to seek life-savingtreatment and care. The failure to recognize substancedependence as a serious health condition is anotherimportant factor that prevents injecting drug users from<strong>access</strong>ing essential HIV <strong>int</strong>erventions. Compulsory drugtreatment, although not recommended by WHO andUNODC, is still being pursued, and development partnersshould continue to work with countries to implement theglobal recommendations (18).Addressing the needs of groups at higher risk for HIVinfection requires strong actions to uphold their human rightsand protect them from violence and exclusion. WHO andpartners are updating specific guidance to comprehensivelyaddress the multiple individual and structural constra<strong>int</strong>sthat continue to hinder the uptake of effective preventionand treatment <strong>int</strong>erventions by these groups. tPROGRESS REPORT 201045
towards <strong>universal</strong>References1. De Cock KM, De Lay P. HIV/AIDS estimates and the quest for <strong>universal</strong> <strong>access</strong>. Lancet, 2008, 371:2068–2070.2. UNAIDS, WHO. AIDS epidemic update 2009. Geneva, Switzerland, UNAIDS, 2009 (http://data.unaids.org/pub/Report/2009/JC1700_Epi_Update_2009_en.pdf, <strong>access</strong>ed on 23 April 2010).3. Smith AD et al. Men <strong>who</strong> have sex with men and HIV/AIDS in sub-Saharan Africa. Lancet, 2009, 374:416–422.4. Beyrer C et al. The expanding epidemics of HIV type 1 among men <strong>who</strong> have sex with men in low- and middle-income countries:diversity and consistency. Epidemiologic Reviews, 2010, 32:137–151.5. Mathers BM et al. Global epidemiology of injecting drug use and HIV among people <strong>who</strong> inject drugs: a systematic review. Lancet,2008, 372:1733–1745.6. Colvin M, Gorgens-Albino M, Kasedde S. Analysis of HIV prevention response and modes of HIV transmission. The UNAIDS-GAMETSupported Synthesis Process (http://www.unaidsrstesa.org/files/u1/analysis_hiv_prevention_response_and_mot.pdf, <strong>access</strong>ed 7September 2010).7. Gouws E et al. Trends in HIV prevalence and sexual behaviour among young people aged 15–24 years in countries most affected byHIV. Sexually Transmitted Infections (in press).8. Priority <strong>int</strong>erventions: HIV/AIDS prevention, treatment and care in the health sector. Geneva, <strong>World</strong> <strong>Health</strong> <strong>Organization</strong>, 2010 (http://www.<strong>who</strong>.<strong>int</strong>/hiv/pub/guidelines/9789241500234/en/index.html, <strong>access</strong>ed on 7 September 2010).9. Lyerla R, Gouws E, Garcia-Calleja JM. The quality of serosurveillance in low- and middle-income countries: status and trends through2007. Sexually Transmitted Infections, 2008, 84:i85–i91.10. HIV/AIDS in the South-East Asia Region. New Delhi, India, <strong>World</strong> <strong>Health</strong> <strong>Organization</strong> Regional Office for South-East Asia, 2009. (http://www.searo.<strong>who</strong>.<strong>int</strong>/LinkFiles/Publications_HIV_AIDS_Report2009.pdf, <strong>access</strong>ed 19 March 2010).11. WHO, UNAIDS, UNICEF. <strong>Towards</strong> <strong>universal</strong> <strong>access</strong>: scaling up priority HIV/AIDS <strong>int</strong>erventions in the health sector. Geneva, <strong>World</strong> <strong>Health</strong><strong>Organization</strong>, 2009 (http://www.<strong>who</strong>.<strong>int</strong>/hiv/pub/2009progressreport/en/index.html, <strong>access</strong>ed 7 September 2010).12. WHO, UNODC, UNAIDS. WHO, UNODC AND UNAIDS technical guide for countries to set targets for <strong>universal</strong> <strong>access</strong> to HIV prevention,treatment and care for injecting drug users. Geneva, Switzerland, <strong>World</strong> <strong>Health</strong> <strong>Organization</strong>, 2009 (http://www.<strong>who</strong>.<strong>int</strong>/hiv/idu/target_setting/en/, <strong>access</strong>ed 6 August 2010).13. Blame and banishment. The underground HIV epidemic affecting children in Eastern Europe and Central Asia. The United Nations Children’sFund (UNICEF), 2010 (http://www.unicef.org/media/files/UNICEF_Blame_and_Banishment.pdf, <strong>access</strong>ed 6 August 2010).14. WHO, UNAIDS. Progress on implementing the Dublin Declaration on partnership to fight HIV/AIDS in Europe and Central Asia. Geneva,<strong>World</strong> <strong>Health</strong> <strong>Organization</strong>, 2008.15. Cook C (ed.). The global state of harm reduction 2010: key issues for broadening the response. London, International Harm ReductionAssociation, 2010.16. Mathers BM et al. HIV prevention, treatment, and care services for people <strong>who</strong> inject drugs: a systematic review of global,regional, and national coverage. Lancet, 2010 [webappendix 10] (http://www.idurefgroup.unsw.edu.au/IDURGWeb.nsf/resources/Coverage+appendices/$file/Coverage+appendices.pdf, <strong>access</strong>ed 15 July 2010).17. Mathers BM et al. HIV prevention, treatment, and care services for people <strong>who</strong> inject drugs: a systematic review of global, regional,and national coverage. Lancet, 2010, 375:1014–1028.18. WHO, UNODC. Guidelines for the psychosocially assisted pharmacological treatment of opioid dependence. Geneva, Switzerland, <strong>World</strong><strong>Health</strong> <strong>Organization</strong>, 2009. (http://www.<strong>who</strong>.<strong>int</strong>/substance_abuse/activities/treatment_opioid_dependence/en/index.html <strong>access</strong>ed19 August 2010).19. Assessment of compulsory treatment of people <strong>who</strong> use drugs in Cambodia, China, Malaysia and Viet Nam: an application of selected humanrights principles. Manila, <strong>World</strong> <strong>Health</strong> <strong>Organization</strong> Regional Office for the Western Pacific, 2009 (http://www.wpro.<strong>who</strong>.<strong>int</strong>/NR/rdonlyres/4AF54559-9A3F-4168-A61F-3617412017AB/0/FINALforWeb_Mar17_Compulsory_Treatment.pdf, <strong>access</strong>ed 10 August2010).20. HIV/AIDS in the South-East Asia Region. New Delhi, India, <strong>World</strong> <strong>Health</strong> <strong>Organization</strong> Regional Office for South-East Asia, 2009 (http://www.searo.<strong>who</strong>.<strong>int</strong>/LinkFiles/Publications_HIV_AIDS_Report2009.pdf, <strong>access</strong>ed 19 March 2010).46 TOWARDS UNIVERSAL ACCESS: Scaling up priority HIV/AIDS <strong>int</strong>erventions in the health sector
<strong>access</strong>21. Mehta S et al. The <strong>int</strong>ersection between sex and drugs: HIV prevalence among sexual partners of IDU in Chennai, India. In: 17thConference on Retroviruses and Opportunistic Infections, San Francisco, California, 16–19 February 2010 [Abstract # W 15].22. Results from the HIV/STI <strong>int</strong>egrated biological and behavioral surveillance (IBBS) in Viet Nam, 2005–2006. Viet Nam, Ministry of <strong>Health</strong>,2007 (http://www.fhi.org/nr/rdonlyres/etpiez3jktbiyvwcnx6upuefj7kqefygm4b5h5dplftlbyrgxhfnsakq24y3aymclczypl4cdn6cxj/vietnamibbs2006englishhv.pdf, <strong>access</strong>ed 19 March 2010).23. Scaling up antiretroviral therapy in resource limited settings: guidelines for a public health approach. Geneva, <strong>World</strong> <strong>Health</strong> <strong>Organization</strong>,2002.24. Laissar K-T et al. Services <strong>int</strong>egration for injection drug users on antiretroviral therapy for management of HIV epidemic in Estonia.Retrovirology, 2010, 7(Suppl 1):P142.25. Uhlmann et al. Methadone ma<strong>int</strong>enance therapy promotes initiation of antiretroviral therapy among injection drug users. Addiction,2010, 105:907–913.26. Wisaksana R et al. Response to first-line antiretroviral treatment among human immunodeficiency virus-infected patients with andwithout a history of injecting drug use in Indonesia. Addiction, 2009, 105:1055–1061.27. WHO, UNODC, UNAIDS. Evidence for Action Technical Papers. Policy guidelines for collaborative TB and HIV services for injecting and other drugusers: an <strong>int</strong>egrated approach. Geneva, <strong>World</strong> <strong>Health</strong> <strong>Organization</strong>, 2008 (http://whq<strong>libdoc</strong>.<strong>who</strong>.<strong>int</strong>/publications/2008/9789241596930_eng.pdf, <strong>access</strong>ed 10 August 2010).28. Selwyn P et al. A prospective study of the risk of tuberculosis among <strong>int</strong>ravenous drug users with human immunodeficiency virusinfection. New England Journal of Medicine, 1989, 320:545–550.29. Garfein R et al. Injection drug users at high risk for incident M. tuberculosis infection in Tijuana, Mexico. In: 17th Conference on Retrovirusesand Opportunistic Infections, San Francisco, California, 16–19 February 2010. (http://www.retroconference.org/2010/PDFs/781.pdf<strong>access</strong>ed 20 September 2010).30. Ottosson D. State-sponsored homophobia: a world survey of laws prohibiting same sex activity between consenting adults. Brussels,International Lesbian, Gay, Bisexual, Trans and Intersex Association, 2009.31. McIntyre J. The need for HIV prevention <strong>int</strong>erventions for men <strong>who</strong> have sex with men in Africa. Sexually Transmitted Infections, 2010,86:82–83, doi:10.1136/sti.2009.041640.32. Henry E et al. Factors associated with unprotected anal <strong>int</strong>ercourse among men <strong>who</strong> have sex with men in Douala, Cameroon. SexuallyTransmitted Infections, 2010, 86:136–140, doi:10.1136/sti.2009.036939.33. Van Griensven F et al. Trends in HIV prevalence, estimated HIV incidence, and risk behavior among men <strong>who</strong> have sex with men inBangkok, Thailand, 2003–2007. Journal of Acquired Immune Deficiency Syndromes, 2009, 53:234–239.34. Chemnasiri T et al. Inconsistent condom use among young men <strong>who</strong> have sex with men, male sex workers, and transgenders inThailand. AIDS Education and Prevention, 2010, 22:100–109.35. Ministry of <strong>Health</strong>. Uganda 2004–2005 HIV/AIDS serobehaviour surveys. Kampala, Uganda, MOH, and ORC Macro, 2006.36. Barker J et al. HIV infection among men having sex with men in Kampala, Uganda. In: XVIII International Aids Conference, Vienna, Austria,18–23 July 2010 [Abstract TUAC0304].37. Smith A et al. Female clients and partners of MSM sex workers in Mombasa, Kenya. In: 17th Conference on Retroviruses and OpportunisticInfections, San Francisco, California, 16–19 February 2010 [Abstract # 39].38. Smith AD et al. Men <strong>who</strong> have sex with men and HIV/AIDS in sub-Saharan Africa. Lancet, 2009, 374:416–422.39. HIV/AIDS epidemiological surveillance report for the WHO African Region: 2007 update. <strong>World</strong> <strong>Health</strong> <strong>Organization</strong> Regional Office forAfrica, 2008 (http://www.<strong>who</strong>.<strong>int</strong>/hiv/pub/me/afro_epi_sur_2007.pdf, <strong>access</strong>ed 6 September 2010).40. Abu-Raddad L et al. Characterizing the HIV/AIDS epidemic in the Middle East and North Africa: time for strategic action. Washington DC,Middle East and North Africa HIV/AIDS Epidemiology Synthesis Project, <strong>World</strong> Bank/UNAIDS/WHO, 2010.41. Morison L et al. Commercial sex and the spread of HIV in four cities in sub-Saharan Africa. AIDS, 2001, 15 (Suppl. 4):S61–S69.42. The Global HIV Prevention Working Group [web site]. Bringing HIV prevention to scale: an urgent global priority. The Global HIV PreventionWorking Group, June 2007 (http://www.globalhivprevention.org/pdfs/PWG-HIV_prevention_report_FINAL.pdf, <strong>access</strong>ed 27 August2010).PROGRESS REPORT 201047
towards <strong>universal</strong>43. Hladik W et al. Bridging the epidemic: HIV in clients and sex partners of female sex workers in Kampala, Uganda. In: 17th Conferenceon Retroviruses and Opportunistic Infections, San Francisco, California, 16–19 February 2010. [Abstract no. 969]44. WHO, UNAIDS. New data on male circumcision and HIV prevention: policy and programme implications: conclusions and recommendations.Technical Consultation on male circumcision and HIV prevention: research implications for policy and programming, Montreux, 6–8 March2007 (http://data.unaids.org/pub/Report/2007/mc_recommendations_en.pdf, <strong>access</strong>ed 3 September 2010).45. Gray RH et al. Male circumcision for HIV prevention in men in Rakai, Uganda: a randomised trial. Lancet, 2007, 369:657–666.46. Bailey RC et al. Male circumcision for HIV prevention in young men in Kisumu, Kenya: a randomised controlled trial. Lancet, 2007,369:643–656.47. Auvert B et al. Randomized, controlled <strong>int</strong>ervention trial of male circumcision for reduction of HIV infection risk: the ANRS 1265 Trial.PLoS Medicine, 2005, 2:e298. doi:10.1371/journal.pmed.0020298.48. Serwadda D et al. Circumcision of HIV-infected men: effects on high-risk human papillomavirus infections in a randomized trial inRakai, Uganda. Journal of Infectious Diseases, 2010, 201:1463–1469.49. Gray RH et al. Male circumcision decreases acquisition and increases clearance of high-risk human papillomavirus in HIV-negativemen: a randomized trial in Rakai, Uganda. Journal of Infectious Diseases, 2010, 201:1455–1462.50. Gray RH et al. Effects of genital ulcer disease and herpes simplex virus type 2 on the efficacy of male circumcision for HIV prevention:analyses from the Rakai trials. PLoS Medicine, 2009, 6:e1000187.51. USAID <strong>Health</strong> Policy Initiative. The potential cost and impact of expanding male circumcision in Eastern and Southern Africa. Washington,DC, USAID, 2009 (http://www.malecircumcision.org/programs/documents/14_country_summary11309.pdf, <strong>access</strong>ed 26 June 2010).52. Progress in male circumcision scale-up: country implementation and research update. Geneva, WHO/UNAIDS, June 2010 (http://www.malecircumcision.org/documents/MC_country_June2010.pdf, <strong>access</strong>ed 15 June 2010).53. Male circumcision quality assurance: a guide to enhancing the safety and quality of services. Geneva, <strong>World</strong> <strong>Health</strong> <strong>Organization</strong>, 2008(http://www.<strong>who</strong>.<strong>int</strong>/hiv/pub/malecircumcision/<strong>who</strong>_hiv_mc_q_assurance.pdf, <strong>access</strong>ed 24 June 2010).54. Male circumcision services: quality assessment toolkit. Geneva, <strong>World</strong> <strong>Health</strong> <strong>Organization</strong>, 2009 (http://www.<strong>who</strong>.<strong>int</strong>/hiv/pub/malecircumcision/<strong>who</strong>_hiv_q_assessment.pdf, <strong>access</strong>ed 24 June 2010).55. Government of Kenya, Ministry of Public <strong>Health</strong> and Sanitation, National AIDS and STI Control Programme. Progress report on Kenya’svoluntary medical male circumcision programme, 2008–09:summary. Nairobi, Kenya, July 2010. (http://www.malecircumcision.org/documents/VMMCP_Report.pdf, <strong>access</strong>ed 10 August 2010).56. Male circumcision for HIV prevention: progress in scale-up. In: 17th Conference on Retroviruses and Opportunistic Infections, San Francisco,California, 16–19 February 2010. [?abstract no.] (http://www.malecircumcision.org/programs/country_implementation_updates.html,<strong>access</strong>ed 30 June 2010).57. Fleming DT, Wasserheit JN. From epidemiological synergy to public health policy and practice: the contribution of other sexuallytransmitted diseases to sexual transmission of HIV infection. Sexually Transmitted Infections, 1999, 75:3–17.58. Global strategy for the prevention and control of sexually transmitted infections: 2006–2015. Geneva, <strong>World</strong> <strong>Health</strong> <strong>Organization</strong>, 2007.59. Prevalence and incidence in 2005 of selected sexually transmitted infections: chlamydia, gonorrhoea, syphilis, and trichomoniasis.Geneva, <strong>World</strong> <strong>Health</strong> <strong>Organization</strong> (in press).60. Ramesh BM et al. Changes in risk behaviours and prevalence of sexually transmitted infections following HIV preventive <strong>int</strong>erventionsamong female sex workers in five districts in Karnataka state, south India. Sexually Transmitted Infections, 2010, 86(Suppl 1):i17–i24.61. WHO Global Database on Blood Safety (GDBS) [web site]. Aide-memoire for national blood programme: blood safety. Geneva, <strong>World</strong><strong>Health</strong> <strong>Organization</strong>, 2002. (http://www.<strong>who</strong>.<strong>int</strong>/bloodsafety/transfusion_services/en/Blood_Safety_Eng.pdf, <strong>access</strong>ed 10 August2010).62. WHO Global Database on Blood Safety (GDBS) [web site]. Geneva, <strong>World</strong> <strong>Health</strong> <strong>Organization</strong>, 2009 ((http://www.<strong>who</strong>.<strong>int</strong>/bloodsafety/global_database/en/ <strong>access</strong>ed 6 September 2010).63. WHO Medium Term Strategic Plan 2008–2013 (revised version). Geneva, Switzerland, April 2009 (draft) (http://apps.<strong>who</strong>.<strong>int</strong>/gb/e/e_amtsp3.html, <strong>access</strong>ed 20 August 2010).48 TOWARDS UNIVERSAL ACCESS: Scaling up priority HIV/AIDS <strong>int</strong>erventions in the health sector
<strong>access</strong>64. Family <strong>Health</strong> International (FHI), Centre for the AIDS Programme of Research in South Africa. CAPRISA 004 trial: summary sheet offacts. Research Triangle Park, NC USA, July 2010. (http://www.caprisa.org/joomla/, <strong>access</strong>ed 3 August 2010).65. Family <strong>Health</strong> International (FHI), Centre for the AIDS Programme of Research in South Africa. Factsheet: results of the CAPRISA 004trial on the effectiveness of tenofovir gel for HIV prevention. Research Triangle Park, NC USA, July 2010.66. CAPRISA (Centre for the AIDS Programme of Research in South Africa) [web site]. Backgrounder CAPRISA 004 trial to assess theeffectiveness and safety of 1% tenofovir gel in preventing HIV infection (http://www.caprisa.org/joomla/Micro/CAPRISA%20004%20Backgrounder_20%20July%202010.pdf, <strong>access</strong>ed 3 August 2010).67. Positive <strong>Health</strong>, Dignity and Prevention. Technical consultation report. Geneva, UNAIDS, 2009 (http://data.unaids.org/pub/Report/2009/20091128_phdp_mr_lr_en.pdf, <strong>access</strong>ed 30 August 2010).68. Delivering HIV test results and messages for re-testing and counselling in adults. Geneva, <strong>World</strong> <strong>Health</strong> <strong>Organization</strong>, 2010 (http://whq<strong>libdoc</strong>.<strong>who</strong>.<strong>int</strong>/publications/2010/9789241599115_eng.pdf, <strong>access</strong>ed 22 July 2010).69. Malawi and Tanzania research shows promise in preventing HIV and sexually-transmitted infections. Washington, DC, The <strong>World</strong> Bank, July2010 (http://econ.worldbank.org/WBSITE/EXTERNAL/EXTDEC/0,contentMDK:22649337~pagePK:64165401~piPK:64165026~theSitePK:469372,00.html, <strong>access</strong>ed 30 August 2010).70. Strathdee SA et al. HIV and risk environment for injecting drug users: the past, present, and future. Lancet, 2010, published online July20 DOI:10.1016/ S0140-6736(10)60743-X.PROGRESS REPORT 201049
4. Treatment and Care for peopleliving with HIVKey findingsnnnnnnnnnnnnnAt the end of 2009, 5 254 000 people were receiving antiretroviral therapy in low- and middle-income countries, an increaseof over 1.2 million people from December 2008. This represents a 30% rise from a year earlier and a 13-fold increase insix years. Sub-Saharan Africa had the greatest increase in the absolute number of people receiving treatment in 2009,from 2 950 000 in December 2008 to about 3 910 000 a year later.As of December 2009, eight low- and middle-income countries had already achieved <strong>universal</strong> <strong>access</strong> to antiretroviral therapy,defined as providing antiretroviral therapy to at least 80% of patients in need, and 21 additional countries had coveragerates higher than 50%.WHO now recommends that adults and adolescents initiate antiretroviral therapy at an earlier stage of disease. WHO’srevised antiretroviral therapy guidelines recommend that all adults and adolescents, including pregnant women, withHIV infection and a CD4 count of or below 350 cells/mm 3 should be started on antiretroviral therapy, regardless ofwhether or not they have clinical symptoms. This change has increased the number of people estimated to be in needof antiretroviral therapy at the end of 2009, from 10.1 million to 14.6 million [13.5 million–15.8 million].As of December 2009, 45 countries had already incorporated <strong>int</strong>o their national treatment guidelines the new WHOrecommendations on eligibility criteria and regimen choice for adults and adolescents, and 33 had already startedimplementing stavudine (d4T) phase-out plans.Coverage of antiretroviral therapy in low- and middle-income countries rose further in 2009. Based on the new set of criteriafor treatment initiation, coverage increased from 28% [26–31%] in December 2008 to 36% [33–39%] at the end of2009. Under the previous criteria for treatment initiation (CD4 count at or below 200 cells/mm 3 ), global coveragewould have reached 52% [47–58%] in 2009.The number of children under 15 years of age receiving antiretroviral therapy increased by 29% between 2008 and 2009. About356 400 children less than 15 years of age were receiving antiretroviral therapy at the end of 2009, up from 275 300 atthe end of 2008. Children represented 6.8% of people receiving antiretroviral therapy and 8.7% of people in need.Among 95 reporting countries, antiretroviral therapy coverage was higher among women, estimated at 39%, comparedto 31% among men.Data on the proportion of patients retained on antiretroviral therapy over time continued to show that most patientattrition occurs within the first year of initiation of therapy and that retention rates tend to stabilize thereafter. In 2009, theaverage retention rate at 12 months across low- and middle-income countries was 82%.More evidence is now available of the positive impact of antiretroviral therapy on HIV transmission, and additional research isongoing to identify and assess policy and operational implications.Twenty-eight countries have completed surveys or are in the process of implementing them to classify the extent of transmittedHIV drug resistance. Quality assured results are available for 15 surveys. In 13 of these, transmitted HIV drug resistancewas classified as low (
towards <strong>universal</strong>In spite of the severe downturn experienced by theworld economy in 2009, countries and partners involvedin the global AIDS response continued to deliver solidachievements. An additional 1.2 million people were receivinglife-saving antiretroviral therapy in low- and middle-incomecountries in 2009, bringing the total number of people ontreatment in resource-limited settings to 5.25 million. Thisis a thirteen-fold increase from the approximately 400 000patients recorded in December 2003. Furthermore, 2009also witnessed a number of key technical developmentsthat considerably altered the way antiretroviral therapy isimplemented.Accumulated evidence on the need to initiate antiretroviraltherapy at an earlier stage of HIV infection and on theappropriateness of phasing out the use of stavudine (d4T)as a preferred option due to its well-documented longtermtoxicities prompted WHO to update, through a broadconsultative process, its antiretroviral treatment guidelinesfor adolescents and adults. Currently, all adolescents andadults, including pregnant women, with HIV infectionand a CD4 count at or below 350 cells/mm 3 should bestarted on antiretroviral therapy, regardless of whetherthey have clinical symptoms (Box 4.1). Moreover, peopleliving with HIV and TB should initiate antiretroviral therapyirrespective of CD4 count. These changes are importantsteps towards lowering excess morbidity and mortality,improving clinical outcomes and strengthening overallprogramme effectiveness. Clear evidence also emerged onthe positive impact that antiretroviral therapy has on theprevention of HIV transmission. Although more technicaland financial resources will be needed to implement therevised WHO treatment guidelines, considerable costsavings are likely to be realized over the long term in termsof reduced hospitalizations, deaths and HIV transmission.In addition to rapidly scaling up <strong>access</strong> to antiretroviraltreatment for the proportion of patients <strong>who</strong> still do nothave <strong>access</strong>, countries also face the challenge of sustainingand managing existing programmes. In this respect,in a context of global fiscal constra<strong>int</strong>s, it is critical toenhance the efficiency and effectiveness of the global AIDSresponse, while closely monitoring the quality of servicedelivery to promote and ensure optimum adherence andretention levels.Box 4.1. New WHO guidelines forantiretroviral therapy in resource-limitedsettingsIn response to the emergence of new scientific evidence, inDecember 2009 WHO updated its antiretroviral therapy guidelinesfor adults and adolescents. According to the new guidelines,which were developed in consultation with multiple technicaland implementing partners, all adolescents and adults, includingpregnant women, with HIV infection and a CD4 count at or below350 cells/mm 3 should be started on antiretroviral therapy, regardlessof whether or not they have clinical symptoms. Those with severe oradvanced clinical disease (WHO clinical stage 3 or 4) should startantiretroviral therapy irrespective of CD4 cell count. According toa recent WHO survey, several countries have already updated theirnational treatment guidelines to reflect this shift towards earlierinitation of antiretroviral therapy (see section 4.1.6).Recommendations for first- and second-line treatments have alsobeen updated. First-line therapy should consist of a non-nucleosidereverse transcriptase inhibitor (NNRTI) and two nucleoside reversetranscriptase inhibitors (NRTI), one of which should be zidovudine(AZT) or tenofovir (TDF). Countries should take steps to reducethe use of d4T in first-line regimens because of its well-recognizedlong-term toxicities. The new guidelines ma<strong>int</strong>ain the standardrecommendation for second-line therapy, which should consist ofa ritonavir (RTV)-boosted protease inhibitor plus two NRTIs, one ofwhich should be AZT or TDF, based on what was used in the first-lineregimen. Ritonavir-boosted atazanavir (ATZ) or lopinavir/ritonavir(LPV/r) are the preferred protease inhibitors. Patients coinfectedwith HIV and TB should be started on antiretroviral therapy assoon as possible after starting TB treatment, ideally within the firsteight weeks, irrespective of the CD4 cell count. The same applies topatients with HIV and chronic active hepatitis B (Box 4.12) (1–7).4.1. Antiretroviral therapy4.1.1. Global, regional and country progress in<strong>access</strong> to antiretroviral therapyAt the end of 2009, 5 254 000 people were receivingantiretroviral therapy, an increase of over 1.2 million 1 peoplefrom December 2008 (Table 4.1 and Figure 4.1).As the region most affected by the epidemic, sub-SaharanAfrica recorded the greatest increase in the absolute numberof people receiving treatment in 2009, from 2 950 000 inDecember 2008 to about 3 911 000 a year later – a 33%increase. In Eastern Europe and Central Asia, the numberof people on treatment rose by 34%. In December 2009,114 000 people were receiving antiretroviral therapy versus84 400 at the end of 2008. In all other regions, with theexception of Latin America, growth rates were reasonablyhomogeneous, at around 30% per year.In Latin America, the increase in the number of peoplereceiving antiretroviral therapy in 2009 vis-à-vis 2008 wasrelatively more modest, about 6%. This is explained by thefact that most large countries in the region have alreadyachieved relatively high levels of coverage.1 This figure is likely to underestimate the exact number of people <strong>who</strong> initiatedantiretroviral therapy in 2009 as some have died or discontinued antiretroviraltherapy since initiation. The total number of people starting antiretroviraltherapy in a year is not reported by countries; rather, only the number ofpatients alive and on antiretroviral therapy at the end of the reporting period isprovided.52 TOWARDS UNIVERSAL ACCESS: Scaling up priority HIV/AIDS <strong>int</strong>erventions in the health sector
<strong>access</strong>Table 4.1. Number of adults and children (combined) receiving and needing antiretroviraltherapy, and percentage coverage in low- and middle-income countries by region, December2008 to December 2009 aGeographical regionNumber ofpeople receivingantiretroviral therapySub-Saharan Africa 3 911 000Eastern and Southern Africa 3 203 000Western and Central Africa 709 000Latin America and the Caribbean 478 000Latin America 425 000Caribbean 52 400East, South and South-East Asia 739 000Europe and Central Asia 114 000North Africa and the Middle East 12 000Total 5 254 000As of December 2009 As of December 2008Estimated number of people Antiretroviral therapyneeding antiretroviral coverage, based ontherapy, based on WHO WHO 2010 guidelines2010 guidelines [range] a [range] b10 600 000[9 700 000–11 500 000]7 700 000[7 200 000–8 300 000]2 900 000[2 500 000–3 200 000]950 000[810 000–1 000 000]840 000[700 000–940 000]110 000[95 000–120 000]2 400 000[2 000 000–2 900 000]610 000[550 000–710 000]100 000[88 000–120 000]14 600 000[13 500 000–15 800 000]37%[34–40%]41%[38–45%]25%[22–28%]50%[46–59%]51%[45–61%]48%[42–55%]31%[26–36%]19%[16–21%]11%[10–14%]36%[33–39%]Number ofpeople receivingantiretroviral therapy2 950 0002 416 000533 000439 000400 00039 900571 00084 4009 1004 053 000Estimated number of people Antiretroviral therapyneeding antiretroviral coverage, based ontherapy, based on WHO WHO 2010 guidelines2010 guidelines [range] a [range] b10 400 000[9 500 000–11 300 000]7 600 000[7 000 000–8 100 000]2 800 000[2 500 000–3 200 000]910 000[790 000–1 000 000]810 000[680 000– 900 000]110 000[93 000–120 000]2 300 000[2 000 000–2 900 000]570 000[510 000–660 000]91 000[75 000–110 000]14 300 000[13 200 000–15 400 000]Note: some numbers do not add up due to rounding.a See Box 4.2 for further information on the methods for estimating the need for and coverage of antiretroviral therapy in 2008 and 2009.b The coverage estimate is based on the unrounded estimated numbers of people receiving and needing antiretroviral therapy.28%[26–31%]32%[30–34%]19%[17–22%]48%[44–56%]49%[45–59%]37%[33–43%]25%[20–29%]15%[13–17%]10%[9–12%]28%[26–31%]Fig. 4.1. Number of people receiving antiretroviral therapy in low- and middle-incomecountries, by region, 2002–20095.55.0North Africa and the Middle EastEurope and Central AsiaEast, South and South-East AsiaLatin America and the CaribbeanSub-Saharan Africa4.54.03.5Millions3.02.52.01.51.00.50End 2002 End 2003 End 2004 End 2005 End 2006 End 2007 End 2008 End 2009PROGRESS REPORT 201053
towards <strong>universal</strong>Twenty countries accounted for over 83% of the totalnumber of patients receiving antiretroviral therapy in lowandmiddle-income countries in 2009, most of them insub-Saharan Africa (Table 4.2). Home to the greatestabsolute number of people living with HIV, South Africanow provides antiretroviral therapy to 18% of all patientstreated worldwide. Zimbabwe recorded the highest increasein enrolment, where the number of people on treatmentincreased by almost 50% between December 2008 andDecember 2009. Despite continued progress, however,treatment in many of these countries remained well belowthe estimated needs (Table 4.2).The number of people receiving antiretroviral therapy inhigh-income countries is at least 700 000, including about385 000 in Europe and 300 000 in North America and theCaribbean, and 15 500 in Asia, Oceania and the MiddleEast. <strong>World</strong>wide, the total number of people <strong>access</strong>ingantiretroviral therapy in both low- and middle-incomecountries and high-income countries at the end of 2009 isestimated to be around 6 million.The Global Fund to Fight AIDS, Tuberculosis and Malaria andthe United States President’s Emergency Plan for AIDS Relief(PEPFAR) remained the two major <strong>int</strong>ernational sources offunding for antiretroviral therapy programmes in low- andmiddle-income countries in 2009. As of December 2009,Global Fund-supported programmes provided treatmentto 2.5 million people, and programmes financed by PEPFARsupported antiretroviral therapy for 2.4 million people (8).Box 4.2. Methods for estimating the need for and coverage of antiretroviral therapy among adultsAntiretroviral therapy coverage measures the proportion of people on antiretroviral therapy, as reported by national programmes, in relation to theestimated number of people in need of antiretroviral therapy. Therefore, figures used as denominators are estimates generated using a standardizedstatistical model (see below) based on, among other variables, the set of WHO-recommended criteria for antiretroviral therapy initiation (11).Considering the change in treatment guidelines adopted in 2010 (Box 4.1), coverage figures published in previous reports should not be comparedto those reported herein.Based on the recommendations of the UNAIDS Reference Group on Estimates, Modelling and Projections, UNAIDS and WHO have developedmodelling methods and tools to generate country estimates of the magnitude of the epidemic and key impact indicators, including mortality (12).National HIV estimates are used as a basis to calculate the number of people in need. This includes all people <strong>who</strong> meet treatment initiation criteria,whether or not these people know their HIV status and their eligibility for antiretroviral therapy.Treatment needs are influenced by a number of factors and are estimated using a software package called Spectrum (13). The tool takes <strong>int</strong>oconsideration the national epidemiological data and some key assumptions that include the adult HIV prevalence over time, the average survivalof people living with HIV with and without antiretroviral therapy, and the average time between HIV seroconversion and eligibility for antiretroviraltherapy. Country estimates of treatment need are the sum of the estimated need among adults and among children less than 15 years of age. 1Country estimates of the need for antiretroviral treatment, and the corresponding regional and global estimates, are updated every two years basedon the most recent epidemiological information and updated estimation methods.Implications for global estimates of treatment and resource needsWHO’s recommendation to change the CD4 cell count threshold for initiation of antiretroviral therapy from 200 cells/mm 3 to 350 cells/mm 3 increasedby 45% the number of people estimated to be in need of antiretroviral therapy in low- and middle-income countries in 2009, from 10.1 million to14.6 million. While such an expansion in the number of eligible patients may increase the initial investments required to provide <strong>universal</strong> <strong>access</strong>to antiretroviral therapy in resource-limited settings, this expense is likely to be compensated for in the medium term by savings related to fewerhospitalizations, and lower morbidity and mortality rates. The effect of antiretroviral therapy on reducing HIV transmission may also improve theeconomic advantages of expanding <strong>access</strong> to antiretroviral therapy. A recent study estimated that, in South Africa, while adopting the revisedcriteria for treatment initiation would imply an immediate increase in investment needs, these would be fully offset by savings by 2014 and, overfive years, overall programme costs would actually drop by about US$ 470 million. 2,While it is critical to implement the necessary expansions in programme capacity to incorporate the additional number of patients now eligiblefor treatment, it is also necessary to improve the approach to HIV treatment and care if the global response is to be sustained in the long run.The Treatment 2.0 Initiative, launched by WHO and UNAIDS, seeks to comprehensively maximize the value of antiretroviral therapy through thedevelopment of simpler, less resistance-prone combination treatment regimens, cheaper and simplified diagnostic tools, and a low-cost communityledapproach to service delivery.1 For estimation methods regarding the number of children in need of antiretroviral therapy, see Box 5.6, Chapter 5.2 Kahn JG et al. Expanding ART for treatment and prevention of HIV in South Africa: estimated cost and cost-effectiveness 2011–2050 (unpublished data).Scenarios are based on an ART coverage rate of 90%.54 TOWARDS UNIVERSAL ACCESS: Scaling up priority HIV/AIDS <strong>int</strong>erventions in the health sector
<strong>access</strong>Table 4.2. Number of people receiving antiretroviral therapy and percentagecoverage in twenty low- and middle-income countries with the highest numberof people receiving antiretroviral therapy in December 2009, progress between2008 and 2009 in these countriesCountryNumber of peoplereceiving antiretroviraltherapy inDecember 2008Number of peoplereceiving antiretroviraltherapy inDecember 2009Antiretroviral therapycoverage in 2009[range] based on 2006WHO guidelinesAntiretroviral therapycoverage in 2009[range] based on2010 WHO guidelinesPercentage increase,2008–2009South Africa 730 183 971 556 56% [48%–65%] 37% [35%–39%] 33%Kenya 250 576 336 980 65% [55%–79%] 48% [42%–55%] 34%India 234 581 320 074 41% [36%–46%] 26% [23%–28%] 36%Nigeria 238 659 302 973 31% [25%–38%] 21% [18%–25%] 27%Zambia 219 576 283 863 85% [72%–>95%] 64% [56%–75%] 29%Zimbabwe 148 144 218 589 49% [42%–57%] 34% [30%–38%] 48%Thailand 185 086 216 118 76% [62%–95%] 61% [50%–78%] 17%Uganda 153 718 200 413 53% [44%–67%] 39% [33%–46%] 30%United Republic of Tanzania 154 468 199 413 44% [36%–53%] 30% [27%–34%] 29%Malawi 147 497 198 846 63% [53%–77%] 46% [40%–53%] 35%Brazil 194 984 … a …[65%–>95%] b ... [50%–89%] b …Ethiopia 132 379 176 632 ... [58%–86%] b ... [45%–62%] b 33%Mozambique 128 330 170 198 45% [36%–55%] 30% [26%–34%] 33%Botswana 117 045 145 190 >95% [94%–>95%] 83% [77%–97%] 24%Rwanda 63 149 76 726 >95% [87%–>95%] 88% [74%–>95%] 21%Cameroon 59 960 76 228 41% [34%–51%] 28% [25%–33%] 27%Russian Federation 54 900 75 900 ... [27%–42%] b ...[16%–24%] b 38%Côte d'Ivoire 51 820 72 011 39% [33%–47%] 28% [24%–32%] 39%Namibia 59 376 70 498 >95% [82%–>95%] 76% [62%–92%] 19%China 48 254 65 481 ... [31%–67%] b ... [19%–38%] b 36%a No 2009 data are available for Brazil.b Estimates of the number of people needing antitretroviral therapy are currently being reviewed and will be adjusted, as appropriate, based onongoing data collection and analysis. Therefore, coverage can only be presented as a range.However, about 1.3 million people were receiving treatmentthrough programmes jo<strong>int</strong>ly financed by the two initiatives;hence, together they supported programmes that providedtreatment to approximately 3.7 million people at the endof 2009 (9,10).Coverage of antiretroviral therapy in low-and middle-incomecountries continued to increase in 2009 and reached 36%[33–39%] of the 14.6 million [13.7 million–15.8 million]people estimated to be in need at the end of 2009 (Table4.3). This revised estimate of total needs is based on the2010 WHO guidelines for initiating antiretroviral therapy inpatients with CD4 counts at or below 350 cells/mm 3 (Boxes4.1 and 4.2). In 2008, coverage under the same criteriawas 28% [26–31%]. Although the trend remained clearlypositive, under the 2006 guidelines, global coverage wouldhave reached 52% [47–58%] at the end of 2009.As was the case in previous years, Latin America and theCaribbean (accounting for 6% of estimated treatmentneeds in low- and middle-income countries but for 9% ofthe total number of people receiving treatment) had anaverage coverage of 50% [46–59%], the highest regionallevel in 2009 (Table 4.1). This is due to the relatively longerduration of antiretroviral therapy programmes in some ofthe region’s largest countries.In sub-Saharan Africa, antiretroviral therapy coveragereached 37% [34–40%] in 2009. The region accountedfor 72% of the estimated treatment need in low- and middle-PROGRESS REPORT 201055
towards <strong>universal</strong>Table 4.3. Estimated percentage coverage with antiretroviral therapy in low- and middleincomecountries by region, based on WHO 2010 and 2006 guidelines, December 2008 andDecember 2009 aGeographical regionAntiretroviral therapy coverage,based on WHO guidelines 2010(treatment initiation at CD4 count of
<strong>access</strong>Rica, Georgia, Lao People’s Democratic Republic, Namibia,Swaziland, Turkey and Zambia).4.1.2. Access to antiretroviral therapy amongwomen and childrenA total of 143 countries reported data disaggregated foradults and children. About 356 400 children less than 15years of age were receiving antiretroviral therapy at theend of 2009, up from 275 300 at the end of 2008, or a29% year-on-year increase (Chapter 5 provides an in-depthanalysis on paediatric treatment). Children represented6.8% of people receiving antiretroviral therapy and 8.7%of people in need.Overall antiretroviral therapy coverage among childrenwas lower than among adults in low- and middle-incomecountries. Of the 1 270 000 [830 000–1 700 000] childrenestimated to be in need of antiretroviral therapy, only 28%[21–43%] had <strong>access</strong> to treatment, versus 37% of adultsadults [35–41%]. This is due to the fact that sub-SaharanAfrica accounts for 89% of paediatric needs but has anestimated coverage rate of 26% (Table 4.5). Indeed, in LatinAmerica and the Caribbean, East, South and South-EastAsia, and in Eastern Europe and Central Asia, coverageamong children is higher than among adults.Data disaggregated by sex on the number of peoplereceiving and needing antiretroviral therapy are availablefrom 95 low- and middle-income countries, representing88% of the 5.25 million people receiving treatment in 2009. 1Women represented 58% of people on antiretroviral therapyand 53% of those in need. Overall, antiretroviral therapycoverage was higher among women, estimated at 39%,compared with 31% among men. However, this pattern wasnot observed in all regions (Table 4.6).1 Some countries provided disaggregated data only for a proportion of allpeople receiving antiretroviral therapy in the country. For those countrieswith incomplete datasets, treatment data by sex were obtained by applyingmale/female ratios from existing data to the numbers of people on treatment.Similarly, for 15 countries that were able to supply data by sex in 2008 but notin 2009, available male/female ratios from 2008 were applied to 2009 data.Table 4.5. Number of children less than 15 years receiving and estimated toneed antiretroviral therapy, and percentage coverage among children andadults in low- and middle-income countries, a by region, December 2009Geographical regionNumber of children (0–14 years)receiving antiretroviraltherapy, December 2009Antiretroviral therapyEstimated number of children2009 [range] b December 2009 [range] cneeding antiretroviral therapy,coverage among children,Antiretroviral therapycoverage among adults,December 2009 [range] bSub-Saharan Africa 296 000 1 140 000 [710 000–1 500 000] 26% [19–42%] 38% [36–42%]Eastern and Southern Africa 254 900 790 000 [530 000–1 000 000] 32% [25–48%] 42% [40–46%]Western and Central Africa 41 000 350 000 [180 000– 510 000] 12% [8–22%] 27% [25–30%]Latin America and the Caribbean 18 600 32 200 [23 000–42 000] 58% [45–80%] 50% [46–67%]Latin America 16 300 24 100 [19 000–31 000] 68% [52–87%] 50% [45–69%]Caribbean 2 400 8 100 [4 100–12 000] 29% [19–57%] 50% [45–59%]East, South and South-East Asia 36 500 83 400 [61 000–140 000] 44% [27–59%] 30% [26–36%]Europe and Central Asia 4 800 9 700 [5 700–15 000] 49% [31–58%] 18% [16–21%]North Africa and the Middle East 560 10 000 [5 200–15 000] 6% [4–11%] 12% [11–16%]Total 356 400 1 270 000 [830 000–1 700 000] 28% [21–43%] 37% [35–41%]Note: some numbers do not add up due to rounding.a For an explanation of the methods used, see the explanatory notes for Annex 1 and Box 4.2.b The coverage estimate is based on the unrounded numbers of people receiving and needing antiretroviral therapy.c Based on 2010 WHO guidelines of treatment initiation at a CD4 count of
towards <strong>universal</strong>Table 4.6. Comparison of number of men and women receiving and estimated to needantiretroviral therapy and percentage coverage, by region, December 2009 aMenWomenGeographical region Coverage b Number receiving ART Number in need Coverage b Number receiving ART Number in needSub-Saharan Africa 32% 1 353 200 4 200 000 40% 2 321 000 5 800 000Eastern and Southern Africa 37% 1 120 800 3 000 000 44% 1 882 000 4 200 000Western and Central Africa 20% 232 400 1 100 000 29% 439 000 1 500 000Latin America and the Caribbean 49% 276 200 570 000 55% 163 000 300 000Latin America 49% 261 300 540 000 57% 147 000 260 000Caribbean 55% 14 900 27 000 45% 16 000 36 000East, South and South-East Asia 22% 284 300 1 300 000 28% 191 400 690 000Europe and Central Asia 16% 20 600 130 000 16% 15 000 97 000North Africa and the Middle East 11% 5 000 47 000 9% 4 300 50 000Total 31% 1 940 000 6 200 000 39% 2 690 000 6 900 000a Based on 95 countries reporting disaggregated data by sex.b The coverage estimate is based on the unrounded numbers of people receiving and needing antiretroviral therapy.Box 4.3. Un<strong>int</strong>errupted supplies of drugs for antiretroviral therapy: a major challenge for<strong>access</strong>ibility to and retention on antiretroviral therapyDrug stock-outs remain an issue of concern in low- and middle-income countries. The proportion of countries experiencing stock-outs of drugsfor antiretroviral therapy remained stable in 2009 vis-à-vis previous years. Of the 94 countries reporting information this year, 36 (38%) reportedat least one or more stock-out of antiretroviral drugs in health facilities in 2009, compared to 31 out of 90 countries (34%) in 2008 and 25 out of66 countries (38%) in 2007.Ensuring an un<strong>int</strong>errupted supply of antiretroviral drugs is critical to minimize the emergence of HIV drug resistance, protect the health and wellbeingof patients, and ultimately reach <strong>universal</strong> <strong>access</strong> goals. As such, greater efforts must be made to identify and address bottlenecks in drugprocurement and management, particularly in the context of an expected increase both in the number of people on treatment and complexity ofdrug regimens, as more patients move from first- to second- and third-line antiretroviral regimens. Robust and up-to-date information systems area critical element in this regard, as only rigorous pharmacy monitoring at the site level allows stocks to be adequately managed. Equally relevantis the proper documentation and follow up of patient cohorts over time, thus reinforcing monitoring of the antiretroviral therapy programme.Improved partner coordination at the country level under strong governmental leadership is key to ensure the responsiveness and <strong>int</strong>egrity of supplysystems for antiretroviral drugs. Once potential stock-outs are identified, governments and other implementing partners, through close collaborationand information sharing, must assess district or province stock levels and reallocate them as needed. In Rwanda, the Coordinated Procurement andDistribution System for antiretrovirals and drugs for opportunistic infections brings together government officials, donors, national institutionsand <strong>int</strong>ernational organizations. It has succeeded in reducing stock-outs and drug expiry by ensuring that, once potential antiretroviral stock-outsare identified, a partner can step in and fill any gaps as needed. When the stock-out is a national issue and concerns all districts, an <strong>int</strong>ernationallyagreed approach is to place an emergency order from partners <strong>who</strong> have buffer stocks in their warehouses at regional (Johannesburg, Nairobi,Accra) or headquarter levels and explore which options would respond more rapidly to the urgent country need.58 TOWARDS UNIVERSAL ACCESS: Scaling up priority HIV/AIDS <strong>int</strong>erventions in the health sector
<strong>access</strong>Box 4.4. Maturity of national antiretroviral therapy programmesA total of 118 low- and middle-income countries provided data on the year of launch of national antiretroviral therapy programmes. 1 In 81% of cases,antiretroviral therapy programmes have been in place for more than five years. This figure includes a subgroup of 22 countries where antiretroviraltherapy programmes were <strong>int</strong>roduced more than 10 years ago.A regional breakdown reveals that in Latin America and the Caribbean, 96% of reporting countries have antiretroviral therapy programmes thathave been in place for at least five years. The corresponding figures are 89% in sub-Saharan Africa, 71% in East and South-East Asia, 56% in NorthAfrica and the Middle East, and 65% in Eastern Europe and Central Asia. Among those countries with the highest burden of HIV, programmeshave been in place for at least five years in Nigeria (year of initiation: 2002), Ethiopia (2003), Zambia (2003), India (2004), Kenya (2004) andSouth Africa (2004).Fig. 4.2 Starting year of implementation of antiretroviral therapy programmes in lowandmiddle-income countries, by countryReported year of implementationBefore 20002000–20012002–20032004–20052006–2009Data not availableNot applicable1 Data on the starting year of implementation of antiretroviral therapy programmes in low- and middle income countries were obtained from the reporting formof the <strong>universal</strong> <strong>access</strong> report, relevant country websites and regional offices.4.1.3. Availability of antiretroviral therapyThe number and distribution of health facilities providingantiretroviral therapy are important indicators of the scaleupof and <strong>access</strong> to treatment services. In 2009, 116 low- andmiddle-income countries reported a total of 18 600 healthfacilities providing antiretroviral therapy. Of these facilities,80% were in the public sector and 11% in the private sector(9% were unspecified).Ninety-nine countries provided data for both 2008 and2009. In these countries, the reported number of healthfacilities providing antiretroviral therapy increased from11 833 to 16 134, or a 36% increase in one year. It increasedby 26% in sub-Saharan Africa (from 5778 to 7302 in 39countries); 5% in Latin America and the Caribbean (from1847 to 1948 in 17 countries); 64% in East, South and South-East Asia (from 3660 to 6013 in 20 countries) and 69%in Eastern Europe and Central Asia (from 458 to 776 in 16countries). In North Africa and the Middle East, the numberof facilities providing antiretroviral therapy went up from 90in 2008 to 95 in 2009 across seven reporting countries, anincrease of 6%.The average number of people receiving antiretroviraltherapy per health facility increased from 260 in 2008 to274 in 2009. <strong>Health</strong> facilities in sub-Saharan Africa continueto treat more people per site than in the rest of the world,with an average of 452 people per health facility providingantiretroviral therapy versus 157 in Latin America and theCaribbean, 123 in East, South and South-East Asia, 33 inEastern Europe and Central Asia, and 63 in North Africaand the Middle East.4.1.4. Outcomes and impact of scaling upantiretroviral therapy4.1.4a. Outcomes at the programme level: retentionon antiretroviral therapyAntiretroviral therapy is a lifelong <strong>int</strong>ervention. As such,it requires a robust framework to adequately monitor andPROGRESS REPORT 201059
towards <strong>universal</strong>Table 4.7. Number of countries reporting onretention on antiretroviral therapy among149 low- and middle- income countries, 2008and 2009Number ofcountriesreporting2008 2009Number ofpatientsassessedNumber ofcountriesreportingNumber ofpatientsassessedRetention at 12 months 61 297 408 115 519 890Retention at 24 months 42 132 427 66 284 017Retention at 36 months 30 52 572 56 184 679Retention at 48 months 22 25 643 46 106 696evaluate processes, outcomes and long-term impact, bothat the individual and at the population level. Measuringpatient retention, or the percentage of adults and childrenwith HIV <strong>who</strong> continue to receive treatment after initiatingantiretroviral therapy (excluding patients <strong>who</strong> died, werelost to follow up or stopped treatment among those<strong>who</strong> had started), provides programme managers withcritical information to monitor systemic progress, identifybottlenecks and implement timely programmatic changeswhenever necessary.Countries have continued to improve the monitoring andreporting of programme retention on antiretroviral therapy.As summarized in Table 4.7, the rate of reporting for theBox 4.5. Retention of patients on antiretroviral therapy: tracking trends at the global level, 2008and 2009For each time-po<strong>int</strong> (12, 24, 36 and 48 months), countries were requested to report the number of patients initiated on antiretroviral therapy andstill on treatment (the numerator) as well as the total number of patients initiated on antiretroviral therapy during each period (the denominator).For each time-po<strong>int</strong>, numerators and denominators were then aggregated to produce global estimates. Figure 4.3 shows these estimates for 2008and 2009. While a direct comparison of retention levels between the two years may not be appropriate, as reporting periods are not always clearlyspecified and reported data may not reflect the most recent available information, trends detected in 2009 are clearly consistent with those observedin 2008 – a fact that is especially relevant given the increase in the number of reporting countries and patients assessed.Fig. 4.3. Retention on antiretroviral therapy up to 48 months, 2008 and 2009100%90%80%Percentage of patients on ART70%60%50%40%30%20%10%Global 2008Global 20090ART startat 12 months at 24 months at 36 months at 48 monthsWhile progress has been made in documenting retention on antiretroviral therapy over time across countries and regions, this is an area wherenumerous challenges remain to be addressed (15). Many programmes are still technically and operationally unable to provide retention data,especially for longer periods. Retention rates may be overestimated when calculated exclusively on survival information, without taking <strong>int</strong>oaccount patients lost to follow up or those stopping treatment, while improper record-keeping of patients transferred out to another clinic mayunderestimate true rates. Also, when reported, country data may not be representative of the full programme when derived from a non-randomselection of sites. Indeed, reporting programmes and sites are likely to be better organized and may exhibit stronger performance than those notproviding any information, further affecting the representativeness of reported figures. Finally, reported data may not exactly reflect outcomesin 2009 but cumulative outcomes or outcomes during a previous period. All these factors may contribute to the important variation in reportedresults across countries.60 TOWARDS UNIVERSAL ACCESS: Scaling up priority HIV/AIDS <strong>int</strong>erventions in the health sector
<strong>access</strong>indicators on retention on antiretroviral therapy almostdoubled both in terms of the number of countries reportingand the number of patients assessed for outcomes.Among 47 countries in sub-Saharan Africa, 37, 23, 20 and 15countries reported retention rates on antiretroviral therapyat 12, 24 ,36 and 48 months, respectively.Reported data for each time-po<strong>int</strong> were aggregated toproduce global estimates. Data on the proportion of patientsretained on antiretroviral therapy over time continue to showthat most patient attrition – or discontinuation of antiretroviraltherapy – occurs within the first year and that retentionrates tend to stabilize thereafter. In 2009, the average globalretention rate at 12 months was 82.0% (<strong>int</strong>erquartile range:77–93%). It dropped to 76.9% (<strong>int</strong>erquartile range: 70–87%)at 24 months and remained stable at 75% (<strong>int</strong>erquartilerange: 63–81%) and 74.5% (<strong>int</strong>erquartile range: 57–82%) at36 and 48 months, respectively. Interquartile ranges showedthe important variation in reported retention rates acrosscountries (Box 4.5).These figures are consistent with those from an updatedmeta-analysis of 39 cohorts from sub-Saharan Africa (14).Retention was estimated at between 70% and 77% at 24months, and 65–72% at 36 months. The authors noticedthat the rate of retention at 24 months was higher than theirprevious estimate. Such an improved performance couldreflect a change in the criteria for initiation of antiretroviraltherapy, as higher CD4 cell counts at enrolment have beenassociated with lower mortality and improved treatmentoutcomes.A total of 61 countries reported disaggregated retentiondata at 12 months by sex and 53 countries providedsimilarly disaggregated data by age (children youngerthan 15 years and adolescents/adults older than 15 years).Globally, retention at 12 months was found to be almost thesame among women and men, averaging 81% and 82%,respectively. Among children, average retention rates, at73%, were slightly lower than among adolescents/adults,which stood at 82%.Whereas it is critical to improve retention on antiretroviraltherapy and long-term programmatic performance (16), moreattention must be devoted to the attrition of patients in HIVcare before initiation of antiretroviral therapy and how it maynegatively affect the performance of antiretroviral therapyprogrammes. Patients <strong>who</strong> tested HIV-positive and enrolledin HIV care may not all start antiretroviral therapy or, moreworryingly, may start late after reaching eligibility levels.Among 44 844 patients enrolled in care between May2004 and December 2007 in South Africa, 22 083 were orbecame eligible for antiretroviral therapy. However, while68% of them were receiving antiretrovirals after two years,26% had died before starting treatment and 6% were aliveand untreated. The delay between eligibility for and startof antiretroviral therapy was reduced from a median of 122days in 2004 to 78 days in 2007. 1 A few similar studies areavailable but all showed confluent results, calling for a needto better understand and reduce pre-antiretroviral therapyattrition and mortality (17–20).As monitoring systems and cohort studies typicallyfocus on outcomes in patients <strong>who</strong> are known to havestarted treatment, this “unseen mortality” 1 often remainsunreported or underreported. It is critical to step up effortsto better manage waiting lists and closely monitor anydelays in initiation of antiretroviral therapy once a patientis deemed eligible, particularly as guidelines worldwideadopt a higher CD4 cell count criterion for initiation ofantiretroviral therapy.4.1.4b. Impact of antiretroviral therapy programmesThe magnitude of the toll the epidemic exacts on peopleand societies is such that appropriately measuring andunderstanding how HIV care and treatment impact onpopulation mortality is crucial. In addition, as programmesmature, monitoring their impact on mortality, morbidityand quality of life is equally essential to evaluate overallprogramme effectiveness and efficiency, key elements toensure the continued political commitment necessary tosustain a lifelong <strong>int</strong>ervention.Issues related to the absence of or delay in the generationof vital statistics in many low- and middle-income countriesexplain most of the current difficulties in assessing theimpact of antiretroviral therapy on mortality at thepopulation level. Vital or civil registration systems are weakin many low- and middle-income countries, especially incountries with a high HIV burden, rendering the appropriatemeasurement of AIDS-related mortality particularlychallenging. While few comprehensive studies are availableon the matter, a systematic analysis of worldwide mortalityamong adults aged 15–59 years from 1970 to 2010 showedthat mortality increased substantially in sub-Saharan Africastarting in the late 1980s (in fact, it more than doubled in thesouthern region) and began to decline since 2005, a trendthat coincides with an increase in <strong>access</strong> to antiretroviraltreatment (21,22). In South Africa, a recent study based ondemographic surveillance data in KwaZulu Natal correlatedthe decline in mortality in the region, particularly amongyoung adults, with the decline in HIV-related mortality (Box4.6). Moreover, there is a growing body of scientific evidencethat po<strong>int</strong>s to the important role antiretroviral therapy canplay in the prevention of HIV transmission (Box 4.7).1 Outcomes in patients waiting for antiretroviral treatment in the Free StateProvince, South Africa: prospective linkage study. (Ingle S et al., personalcommunication, 2010).PROGRESS REPORT 201061
towards <strong>universal</strong>Box 4.6. Reduction in AIDS-related mortality in KwaZulu Natal, South AfricaWHO and UNAIDS have launched a series of country consultations to better assess the impact of antiretroviral therapy programmes, in particular,on population mortality. In South Africa, it was conducted in partnership with StatsSA (Statistics South Africa) and the national Department of<strong>Health</strong>. The best available data are identified with a special emphasis on identifying group-level correlations between mortality and antiretroviraltherapy programme data. However, causes of death are often inaccurately recorded and trends in mortality can seldom be directly correlated withchanges in AIDS-related mortality.In KwaZulu Natal, provincial statistics showed an increase in mortality up to 2003 and a stabilization thereafter, which coincided with the <strong>int</strong>roductionand roll-out of the antiretroviral therapy programme. These trends in mortality were particularly marked in the 25–34 years’ age group. 1A demographic surveillance programme in the district of Umbkhanyakude in KwaZulu Natal correlated the decline in mortality in the age group of25–49 years with the decline in HIV-related mortality. Verbal autopsies were conducted for all 7930 deaths observed between 2000 and 2006.The reduction in HIV-related mortality was estimated at 22% in men and 29% in women between 2002–03 and 2005–06 (28).Fig. 4.4. Cause-specific standardized mortality ratios for adults aged 25–49 years,KwaZulu-Natal, South Africa, 2000–20064.0n HIV related n Injuries n Non-communicable n Communicable, maternal, nutritional n Undefined3.53.0Deaths per 10002.52.01.51.00.502000Source: Herbst et al. (28)2001 20022003 2004 20052006While research on the impact of scale-up of antiretroviral therapy on population mortality is still limited, it is expected that more data will becomeavailable as programmes mature and demographic surveillance and HIV cohort monitoring systems are better <strong>int</strong>egrated.1 Collaborative project StatSA, DoH, UNAIDS, WHO – preliminary analysis (Stoneburner R, personal communication, 2010).62 TOWARDS UNIVERSAL ACCESS: Scaling up priority HIV/AIDS <strong>int</strong>erventions in the health sector
<strong>access</strong>Box 4.7. Impact of antiretroviral therapy on HIV preventionAs the strongest predictor of HIV transmission risk in epidemiologic studies is the level of HIV in blood, a significant drop in the amount of virusis essential to <strong>int</strong>errupt or drastically reduce transmission. Indeed, research has shown that viral load predicts the risk of sexual transmissionof HIV-1, and that transmission from persons with levels of less than 1500 copies of HIV-1 RNA per millilitre is rare (29). A 2009 meta-analysisthat included 11 cohorts (5021 heterosexual couples) found only a minimal risk of sexual transmission while on antiretroviral therapy for HIV-1concentrations less than 400 copies/ml (30). A recent randomized controlled study of genital herpes simplex virus treatment among long-term,HIV-serodiscordant heterosexual couples in Africa found a 92% reduction in transmission if the HIV-positive partner was on antiretroviral therapy.Prevention of maternal-to-child transmission offers further proof of concept that antiretroviral therapy <strong>int</strong>errupts HIV transmission. There is alsogrowing evidence of the impact of antiretroviral therapy on community-level HIV transmission. In British Columbia, a decrease in communityplasma HIV RNA concentrations and HIV incidence among injecting drug users was associated with antiretroviral therapy use (32). In San Francisco,between 2004 and 2008, ecological correlations show that the number of HIV diagnoses fell by 45%, the average viral load among the HIV-positivepopulation by 40%, and actual HIV incidence by one third between 2006 and 2008 (33,34).Theoretical models have been used as well to estimate the impact of antiretroviral therapy on the incidence of and mortality from HIV. A modelpublished in 2008 focused on a generalized HIV epidemic setting largely driven by heterosexual sex. Using data from Malawi, South Africa, Ugandaand elsewhere, the model showed a 95% reduction in HIV incidence over 10 years with a strategy that combined <strong>universal</strong> voluntary HIV testingand counselling followed by immediate enrolment in antiretroviral therapy of all people <strong>who</strong> tested positive (12). It was premised on earlier analysessuggesting that rapid scale-up of conventional antiretroviral therapy approaches could meaningfully reduce mortality (35) and have a considerableimpact on HIV incidence (36,37). The potential impact of such a “test and treat” strategy has also been modelled for Washington, D.C., where itcould potentially decrease the number of new HIV infections by as much as 26% over ten years (38). The implementation of a similar approachin San Francisco could cut the number of new infections by 91% (39). Among the factors to consider in “test and treat” approaches are the risk ofHIV drug resistance (see section 4.1.6), the need to maximize adherence, how to adequately deal with the acute phase of HIV infection and theneed to develop strategies to address a potential increase in sexual risk-taking <strong>int</strong>egrating the values and principles of Positive <strong>Health</strong>, Dignity andPrevention <strong>int</strong>o the various policy and programmatic elements of the HIV/AIDS response (see Box 3.11).WHO convened two <strong>int</strong>ernational consultations in November 2009 to clarify research priorities, explore feasibility and acceptability issues, andreview the human rights and ethical considerations of expanding antiretroviral therapy for prevention purposes. The consultations involved a widearray of specialists, including researchers, clinicians, prevention experts, human rights specialists, ethicists, organizations of people living withHIV, national programme managers and community groups. 1 WHO and partners are currently engaged with stakeholders on further analysis of theimpact of antiretroviral therapy on tuberculosis (TB), the relative importance of drug resistance and other assumptions, the effect of combiningpre-exposure prophylaxis and “test and treat” approaches, the impact on prevention of mother-to-child transmission and an in-depth examinationof the costs and benefits of expanding <strong>access</strong> to antiretroviral therapy. WHO will work with key stakeholders to help set the research agenda andto periodically review the evidence as it becomes available.1 The presentations, list of participants and outcomes of the meetings are available at http://www.<strong>who</strong>.<strong>int</strong>/hiv/events/artprevention/).In addition to the impact of antiretroviral therapyprogrammes on mortality and HIV transmission,investing in the scale-up of antiretroviral therapy hasalso tangibly benefited other health services and <strong>access</strong>to care in general in multiple ways. Indeed, the impact ofantiretroviral therapy on reducing morbidity and use ofhospital services has been documented in high-incomecountries (23). Antiretroviral therapy has been associatedwith a reduction in the burden of care placed on oftenoverwhelmed health systems, particularly on inpatient careservices, and with a decrease in mortality among healthworkers in countries highly affected by the epidemic (24).There is evidence as well that capacity put in place toenable the roll-out of antiretroviral therapy programmes,such as drug supply management, has had a broaderpositive impact on other health services (25–27).4.1.5. Prevention and assessment of HIV drugresistanceAs <strong>access</strong> to antiretroviral therapy continues to expand, theemergence of HIV drug resistance is inevitable due to HIV’shigh mutation rate, viral recombination, and the need forsustained, lifelong treatment. Because HIV drug resistancehas the potential to undermine the dramatic gains thatantiretroviral therapy has had in reducing the morbidityand mortality among HIV-positive patients, it is necessaryto monitor HIV drug resistance and factors related to itsevolution. Treatment programmes should also be adjusted,if necessary, to ma<strong>int</strong>ain the effectiveness of first- andsecond-line regimens.HIV drug resistance may be acquired or transmitted. Arecent review of studies conducted in sub-Saharan AfricaPROGRESS REPORT 201063
towards <strong>universal</strong>Box 4.8. Establishing an HIV drug resistance early warning system in NamibiaBased on 2008 antenatal serosurveillance data, an estimated 17.8% of Namibians aged 15–49 years are infected with HIV-1 (42). The epidemic ispredominantly spread via heterosexual contact, and prevalence estimates vary by region, with up to 31% infected with HIV-1 in the most heavilyaffected areas in the north (43). In December 2009, 70 500 patients were reported to be on antiretroviral therapy, a coverage estimated at 76%based on WHO 2010 guidelines.In 2009, Namibia’s Ministry of <strong>Health</strong> and Social Services implemented an early warning system to monitor HIV drug resistance (44,45). Five indicatorswere selected: (i) antiretroviral therapy prescribing practices, (ii) patients lost to follow up at 12 months, (iii) patient retention on a first-line antiretroviral therapyregimen at 12 months, (iv) on-time antiretroviral drug pick-up, and (v) continuity of antiretroviral drug supply. An assessment of the available medical andpharmacy records demonstrated that existing record-keeping methods supported the monitoring of only three of the initial five selected indicators.Monitoring of the three indicators was then piloted in nine antiretroviral therapy sites. Results revealed that most sites achieved the targets andlevels deemed appropriate for each indicator: 100% of patients were initiated on appropriate first-line antiretroviral therapy regimens across allnine sites; eight sites ma<strong>int</strong>ained the proportion of patients lost to follow up at under 20% 12 months after treatment initiation, and six sites had0% of patients switched to a second-line regimen within the first 12 months of antiretroviral therapy (in the remaining three sites the proportionwas less than 1%). The pilot uncovered, however, that although the overall proportion of patients lost to follow up at 12 months met recommendedtargets, 20.8% of patients had a mean treatment <strong>int</strong>erruption of 2.3 months within the first 12 months of treatment, placing them at increasedrisk for treatment failure and development of HIV drug resistance. 1 The initial implementation of the early warning system uncovered the needto further strengthen antiretroviral therapy record systems to enable the eventual monitoring of all five selected indicators in subsequent years.The results also highlighted the need to reinforce defaulter tracking mechanisms to enhance long-term patient retention, optimize the quality ofpatient care and minimize drug resistance.1 Inadequate systems to trace patient transfers to other antiretroviral therapy sites may cause treatment <strong>int</strong>erruption rates to be overestimated.and India found, as expected, a high frequency of resistancemutations among patients failing first-line therapy andwith detectable viral loads, ranging from 47% to 93% fornon-nucleoside reverse transcriptase inhibitors (NNRTIs)and from 32% to 60% for thymidine analog nucleosidereverse transcriptase inhibitors (NRTIs) (40). On the otherhand, most reports from low- and middle-income countrieshave described low rates of transmitted resistance. Studiesconducted in Africa found NNRTI resistance rates between0% and 5.6% and NRTI resistance rates between 0%and 3.7%. Transmitted protease inhibitor mutations wererare (41). However, considerable variations in study designs,including a range of sample sizes, drug regimens, previousexposure to antiretroviral drugs and duration of follow-up,limit the comparability of these study results.To improve surveillance of HIV drug resistance withstandardized approaches, WHO, in collaboration withHIVResNet, an <strong>int</strong>ernational network of experts, countriesand institutions, have developed a global strategy for theprevention and assessment of HIV drug resistance. WHOrecommends that countries develop a national strategy forthe prevention and assessment of HIV drug resistance basedon three key assessments: (1) routine monitoring of HIVdrug resistance “early warning indicators”, (2) surveys tomonitor the emergence of HIV drug resistance and relatedprogrammatic factors in populations receiving antiretroviraltherapy, and (3) surveys to assess transmitted HIV drugresistance in recently infected populations. As of mid-2010,over 60 countries had implemented one or more elementsof the HIV drug resistance prevention and assessmentstrategy. To facilitate implementation of country plans,WHO supports the accreditation of national, regional andspecialized HIV drug resistance testing laboratories; as ofDecember 2009, 24 HIV drug resistance testing laboratorieshad been accredited.4.1.5a. HIV drug resistance – early warning indicatorsResearch shows that various programme and site factorsare closely associated with the emergence of HIV drugresistance, and their proper monitoring can serve as earlywarning indicators to support appropriate programmemanagement. WHO has developed six core and two optionalearly warning indicators, each with an associated target, andrecommends their annual monitoring in all or a large numberof representative sites.As of December 2009, 45 countries had implemented earlywarning indicators, up from 14 in 2008.4.1.5b. Surveys to monitor the emergence of HIVdrug resistance and associated programmaticfactors in populationsStandardized surveys, performed at sentinel sites providingadult or paediatric antiretroviral therapy, are also importantinstruments to assess the emergence and prevention ofHIV drug resistance in populations receiving first-lineantiretroviral therapy (6). Surveys to monitor HIV drugresistance identify factors that can be addressed by makingadjustments at the site or programme level to minimizethe emergence of preventable drug resistance. Performedregularly at representative sites, the surveys are designedto be <strong>int</strong>egrated easily <strong>int</strong>o countries’ routine HIV-relatedmonitoring and evaluation activities, and can substantially64 TOWARDS UNIVERSAL ACCESS: Scaling up priority HIV/AIDS <strong>int</strong>erventions in the health sector
<strong>access</strong>Box 4.9. Using sentinel surveys to monitorthe emergence of HIV drug resistance inBurundiBetween 2002 and 2009, the number of patients receivingantiretroviral therapy in Burundi increased from 600 to 17 661.In 2007 and 2008, Burundi conducted a survey to monitor theprevention and emergence of HIV drug resistance and associatedprogramme factors, following the WHO generic protocol (46) at twolarge urban antiretroviral therapy sites in Bujumbura. In total, 121and 129 adult patients consecutively initiating first-line antiretroviraltherapy were enrolled at each site, respectively. Following WHO’sprotocol, it is recommended that at least 70% of patients shouldachieve HIV drug resistance prevention (as defined by viral loadsuppression of less than 1000 copies/ml) 12 months after initiationof antiretroviral therapy. At site A, 83.6% achieved prevention ofHIV drug resistance, and of those with detectable virus, HIV drugresistance was detected in 3%. At site B, 81% achieved preventionof HIV drug resistance; of those with detectable virus, HIV drugresistance was detected in 5%. Importantly, at each site, 13% and14% of patients, respectively, were classified as having “possibleHIV drug resistance” because they had been lost to follow up,had stopped antiretroviral therapy before 12 months or had had adetectable viral load 12 months after the start of therapy. Surveyresults suggest the need to reinforce programmes to supportadherence to antiretroviral therapy as well as tracking systems tominimize the number of patients lost to follow up.strengthen their evidence base for optimal selection ofnational antiretroviral therapy regimens. As of December2009, 15 countries had implemented surveys to monitorthe emergence of HIV drug resistance and associatedprogrammatic factors in one or more sites, up from sixcountries in 2008.4.1.5c. Surveys to assess transmitted HIV drugresistanceThe WHO HIV drug resistance threshold surveymethodology was developed for the surveillance oftransmitted HIV drug resistance in resource-limited settings(47,48). As transmitted drug-resistant HIV is expected todevelop first in cities or health districts where antiretroviraltherapy has been widely available for several years, WHOrecommends that countries prioritize these areas whenrolling out activities for surveillance of resistance. Themethodology’s eligibility criteria for selecting sites andindividuals have been designed to minimize the inclusionof antiretroviral therapy-experienced individuals and/or chronically infected individuals, and defines threecategories for transmitted HIV drug resistance: low (levelless than 5%), moderate (between 5 and 15%) and high(more than 15%). The results of these surveys, combinedwith results from other key assessments, provide criticalinformation relevant to prevention of drug resistance andplanning for antiretroviral therapy. At the end of 2009, 29countries had implemented surveys to assess transmittedHIV drug resistance, up from 21 countries in 2008. Twentyeightcountries have completed surveys or are in theprocess of implementing them to classify the extent oftransmitted HIV drug resistance. Quality assured resultsare available for 15 surveys. In 13 of these, transmittedHIV drug resistance was classified as low level and, <strong>int</strong>wo (in Burkina Faso and Cameroon), it was classified asmoderate level.A survey conducted for the first time in Burkina Faso showedmoderate levels of transmitted HIV drug resistance amonga sample of HIV-positive women in their first pregnancy(Box 4.10). This calls for stepping up surveillance for andmonitoring of HIV drug resistance to ensure that underlyingprogrammatic bottlenecks can be addressed in a timelymanner.Box 4.10. Assessing transmitted HIV drugresistance in Ouagadougou, Burkina FasoBetween May 2008 and June 2009, Burkina Faso implemented theWHO methodology to classify transmitted HIV drug resistance inrecently infected individuals (47). Specimens for HIV drug resistancetesting were obtained from 52 consecutively diagnosed HIV-positivewomen attending antenatal care sites in Ouagadougou. All thewomen (aged 15–24 years) were pregnant for the first time, with noprevious history of a diagnostic test for syphilis. In this populationof young, HIV-positive pregnant women in Ouagadougou, theprevalence of transmitted HIV drug resistance was found to bebetween 5% and 15% for both NRTIs and NNRTIs, and thus classifiedas moderate according to the WHO methodology. FollowingWHO recommendations, Burkina Faso reviewed its treatmentprogramme and launched an investigation <strong>int</strong>o potential problemswith continuous <strong>access</strong> to services, drug supply and drug quality.In addition, it also strengthened its adherence support programmesamong populations receiving antiretroviral therapy. The surveyshould be repeated regularly to assess the level of transmitted HIVdrug resistance in this population and in different geographicalregions of the country.4.1.6. Antiretroviral drug regimenIn 2010, the WHO AIDS Medicines and DiagnosticsService (AMDS) conducted the fourth annual survey onthe distribution and composition of first- and second-lineantiretroviral therapy regimens used in low- and middleincomecountries.A standardized questionnaire was sent to the ministries ofhealth of 86 countries from all six WHO Regions (a list ofcountries is available at http://www.<strong>who</strong>.<strong>int</strong>/hiv/amds/en/)with the highest number of people receiving antiretroviraltherapy as of December 2009. Seventy-six countriesresponded, reporting a total of 4 940 000 patients onantiretroviral therapy, representing 94.3% of the estimated5 240 000 people receiving antiretroviral therapy in resourcelimitedcountries as of December 2009.PROGRESS REPORT 201065
towards <strong>universal</strong>Table 4.8. Antiretroviral use, per drug and regimen, across low- and middle-income countries,200959 low- and middle- income countriesexcluding countries from the Americas region)17 countries in the Americas regionProportion of first-line combinations Proportion of second-line Proportion of first-line combinations Proportion of second-lineAntiretroviral medicines acontaining the drug (%) combinations containing the drug (%) containing the drug (%) combinations containing the drug (%)3TC 94.2 31.6 91.1 75.0d4T 59.7 3.0 2.3 30.3AZT 32.1 47.2 71.3 27.8nRTI TDF 7.7 32.4 21.4 17.3ABC 0.4 22.3 4.0 14.0ddI 0.3 48.1 0.8 17.3FTC 5.4 15.5 7.9 2.6NVP 60.7 1.1 12.4 5.1NNRTI EFV 38.5 1.6 50.2 20.1ETV 0.0 0.0 0.0 0.0LPV 0.4 92.7 20.9 37.9NFV 0.0 0.3 0.0 0.1Protease IDV 0.1 0.9 0.0 5.9Inhibitors SQV 0.0 0.3 3.0 1.9ATV 0.0 0.0 12.3 17.7FPV 0.0 0.0 0.1 2.9a Regimens may contain more than one drug of the same class.An initial analysis revealed that the 17 reporting countriesfrom the Americas region (376 000 patients) presented apattern of use of antiretrovirals that was notably differentfrom the one observed in the remaining 59 low- and middleincomecountries which participated in the survey (4 564 000patients). In order to account for such differences, the resultsare presented separately by subgroup.In the group of 59 low- and middle-income countries, 92.4%(4 218 000) of patients receiving antiretroviral therapy wereadults. Of these, 97.5% were on first-line regimens, with99.1% receiving treatment regimens in line with the 2006WHO treatment guidelines. Of the patients, 59.7% were ona stavudine (d4T)-containing combination, 32.1% received azidovudine (AZT)-based regimen and 7.7% used a tenofovir(TDF)-based combination (Table 4.8 and Figure 4.5).In the same group of countries, only 2.4% (100 400 patients)of adults were on second-line regimens, with 87.2% of themreceiving regimens in line with the 2006 WHO treatmentguidelines. Ritonavir-boosted lopinavir (LPV/r) was thepredominant protease inhibitor, used by 92.7% of patientsreceiving a second-line regimen. Importantly, though, 5.8%of adult patients on a second-line treatment followed aregimen that was not in accordance with WHO’s normativeguidance because they did not include a protease inhibitor(Figure 4.5). Only 1400 patients, or 0.01%, were reportedto use salvage therapy.In the 17 low- and middle-income countries of theAmericas, patterns of antiretroviral use were noticeablydifferent (Figure 4.6). Adults also comprised the majority(364 000 or 96.9%) of people receiving antiretroviraltherapy. Countries reported a majority of adults on firstlineregimens (84.0%) with extensive use of a zidovudinecontainingregimen (71.3%). Interestingly, though, animportant proportion of adult patients on first-line treatmentreported the use of a protease inhibitor (36.3%), and only asmall number received either stavudine or nevirapine (2.3%and 12.4%, respectively).Countries in the Americas also reported a higher rate of useof second-line (9.7%) and salvage regimens (6.3%) amongadults, and the availability and use of a wider variety ofprotease inhibitors. Of the 6.3% (20 100) of adult patientson salvage therapy, most were on a quadritherapy. A fewpatients reported the use of more recent antiretroviral drugs,such as darunavir and raltegravir (used, respectively, by0.7% and 0.6% of all patients).Differences in the use of antiretroviral therapy were alsoobserved between the two country groupings with respectto the treatment of children (Figures 4.7 and 4.8). In thegroup of 59 low- and middle-income countries, childrenrepresented 7.8% of people receiving antiretroviral therapy,and most (96.9%) were on first-line regimens (328 000patients). Reported data showed that while 97.3% of firstlineregimens followed the 2008 revision of the WHOtreatment guidelines, this proportion, at 59.8%, was muchlower for second-line combinations. It is worth notingthat 14.6% of children received a second-line regimenwithout a protease inhibitor, contrary to the WHO treatment66 TOWARDS UNIVERSAL ACCESS: Scaling up priority HIV/AIDS <strong>int</strong>erventions in the health sector
1.4<strong>access</strong>Fig. 4.5. Composition and frequency of use of first- and second-line antiretroviral therapyregimens among adults in 59 low- and middle-income countries, excluding countries fromthe Americas Region, December 200940Main first-line regimens among adults(number of patients: 3 981 000)38.140Main second-line regimens among adults(number of patients: 95 900)29.03030Frequency (percentage)201021.518.912.6Frequency (percentage)201021.616.310.36.310.62.92.52.52.01.40.91.40d4T+3TC+NVPd4T+3TC+EFVAZT+3TC+NVPAZT+3TC+EFVTDF+FTC+EFVTDF+FTC+NVPTDF+3TC+EFVTDF+3TC+NVPOthers0AZT+ddl+LPV/rABC+ddl+LPV/rAZT+3TC+LPV/rn TDF+3TC+LPV/r 9.3% n TDF+FTC+LPV/r 12.3%n AZT+3TC+TDF+LPV/r 3.6% n AZT+FTC+TDF+LPV/r 2.7%d4T+3TC+LPV/rABC+TDF+LPV/rABC+3TC+LPV/rOthersFig. 4.6. Composition and frequency of use of first- and second-line antiretroviral regimens amongadults in 17 low- and middle-income countries of the Americas Region, December 200940Main first-line regimens among adults(number of patients: 261 400)38.150Main second-line regimens among adults(number of patients: 30 000)47.93040Frequency (percentage)2014.09.414.0Frequency (percentage)3020107.44.84.34.23.81010.38.67.96.75.54.23.03.02.90AZT+3TC+EFVAZT+3TC+LPV/rAZT+3TC+NVPAZT+3TC+ATV/rTDF+3TC+LPV/rTDF+3TC+EFVTDF+FTC+EFVTDF+3TC+ATV/rOthers0d4T+3TC+EFVd4T+3TC+LPV/rAZT+3TC+ATV/rTDF+3TC+LPV/rAZT+3TC+LPV/r3TC+AZT+IDV/r3TC+ABC+EFVddl+3TC+LPV/rAZT+ddl+LPV/rOthersPROGRESS REPORT 201067
1.23.1towards <strong>universal</strong>Fig. 4.7. Composition and frequency of use of first-line and second-line antiretroviral therapyregimens among children in 59 low- and middle-income countries, excluding countries from theAmericas Region, December 2009Main first-line regimens among children(number of patients : 230 200)Main second-line regimens among children(number of patients: 7300)5048.33027.525.540Frequency (percentage)302030.7Frequency (percentage)201013.112.68.88.1108.97.24.50.50d4T+3TC+NVPAZT+3TC+NVPAZT+3TC+EFVd4T+3TC+EFV3TC+ABC+NVPAZT+3TC+LPV/rOthers0ABC+ddl+LPV/rABC+d4T+LPV/rAZT+3TC+LPV/rd4T+3TC+LPV/rABC+3TC+LPV/rTDF+ddl+LPV/rOthersFig. 4.8. Composition and frequency of use of first-line and second-line antiretroviral therapyregimens among children in 17 countries from the Americas Region, December 200940Main first-line regimens among children(number of patients: 7400)60Main second-line regimens among children(number of patients: 1000)49.63030.650Frequency (percentage)201024.115.119.1Frequency (percentage)40302012.111.99.08.84.03.73.5104.54.10AZT+3TC+EFVAZT+3TC+LPV/rAZT+3TC+NVP3TC+d4T+LPV/rTDF+3TC+LPV/rABC+3TC+LPV/rOthers0AZT+3TC+LPV/rd4T+ddl+LPV/rABC+ddl+LPV/r3TC+ddl+LPV/rAZT+ddl+LPV/rd4T+3TC+LPV/rOthers68 TOWARDS UNIVERSAL ACCESS: Scaling up priority HIV/AIDS <strong>int</strong>erventions in the health sector
<strong>access</strong>guidelines. In the Americas Region, children represented3.1% (11 700 patients) of the reported patient population onantiretroviral therapy, with a higher proportion of childrenon second-line regimens (11.7%).A subset of 17 countries participated in all four consecutivesurveys on use of antiretroviral drugs conducted between2006 and 2009. 1 By December 2009, these 17 countriesrepresented 49.1% (2 575 000) of the total 5 240 000patients receiving antiretroviral therapy. In this subgroup,the use of stavudine in first-line combinations decreasedfrom 67% in 2006 to 51.5% in 2009. On the other hand, theuse of tenofovir increased and comprised 10.9% of first-linecombinations, up from less than 1% in 2006 (Figure 4.9).Data on second-line regimens showed a reverse trend <strong>int</strong>enofovir use, with a decrease in 2009 compared with 2008(42.6% in 2009 and 56.5% in 2008).The 2009 survey also demonstrates that an importantnumber of low- and middle-income countries have alreadyincorporated <strong>int</strong>o their national treatment guidelines the newWHO recommendations on eligibility criteria and regimenchoice for adults and adolescents (Box 4.1). In a subset of54 countries that provided detailed information on national1 The 17 countries are Burkina Faso, Burundi, Cambodia, Cameroon, Côted’Ivoire, Ethiopia, India, Kenya, Lesotho, Namibia, Nigeria, Rwanda, Swaziland,the United Republic of Tanzania, Uganda, Zambia and Zimbabwe.treatment guidelines as of December 2009, 45 2 have alreadyrecommended initiation of antiretroviral therapy for patientswith CD4 counts at or below 350 cells/mm 3 and 33 3 areactively shifting from stavudine-based to zidovudine- ortenofovir-containing regimens.It remains critical to appropriately monitor actualantiretroviral use in order to adequately identify eventualdiscrepancies between guidelines and clinical practice,which can endanger patients’ lives and undermineprogramme outcomes. This is particularly true as manycountries face increased fiscal constra<strong>int</strong>s and must copewith the double challenge of replacing stavudine with moreexpensive compounds while increasing the number ofpatients on treatment under the newly adopted set ofeligibility criteria.2 Forty-five countries adopted this recommendation for all patients: Angola,Benin, Burkina Faso, Cameroon, Central African Republic, Cape Verde, Chad,China, Congo, Côte d’Ivoire, Eritrea, Gabon, Gambia, Ghana, Guinea, Indonesia,Iran, Kenya, Lesotho, Malawi, Mali, Morocco, Moldova, Namibia, Nigeria,Pakistan, Papua New Guinea, Saudi Arabia, Sierra Leone, Rwanda, Romania,Sao Tome, Seychelles, Senegal, Sudan, Swaziland, Togo, the United Republic ofTanzania, Ukraine, Viet Nam, Zambia and Zimbabwe. Three countries adoptedthe recommendation pertaining to pregnant women: Botswana, South Africaand the Democratic Republic of Congo.3 Stavudine phase-out has already started in 33 countries: Angola, Botswana,Burkina Faso, Burundi, Cameroon, Cape Verde, Central African Republic,Chad, China, Comoros, Côte d’Ivoire, Congo, Djibouti, Eritrea, Ethiopia,Ghana, Indonesia (tenofovir), Kenya, Lesotho, Liberia, Madagascar, Morocco,Moldova, Mozambique (zidovudine), Namibia, Rwanda, Senegal, Seychelles,South Africa, Sudan, Togo, Uganda, Ukraine. Five other countries either have orare developing a stavudine phase-out plan.Fig. 4.9. Proportions of patients receiving stavudine (d4T), zidovudine (AZT) ortenofovir (TDF) in first-line regimens in 17 reporting countries, 2006–2009Percentage of treated patients80%70%60%50%40%30%20%10%d4T in first-lineAZT in first-lineTDF in first-line020062007 2008 2009PROGRESS REPORT 201069
towards <strong>universal</strong>Box 4.11. PharmacovigilanceAs HIV/AIDS treatment programmes are scaled up in low- and middle-income countries, adverse events linked with the use of antiretroviral medicinesmay compromise patients’ well-being and safety. These include problems of toxicity, <strong>int</strong>olerance, drug–drug <strong>int</strong>eractions, and adverse events linkedwith co-morbidities such as TB, hepatitis and malaria.Pharmacovigilance is critically important to optimize patient adherence to treatment and treatment outcomes, and to ensure programmeeffectiveness. In the context of antiretroviral therapy, pharmacovigilance activities are also important for programmatic decision-making toregularly update national treatment, care and prevention guidelines, and to inform the initial selection, forecasting, procurement and distributionof antiretroviral drugs.WHO recommends the development of national pharmacovigilance programmes for antiretroviral drugs. These programmes should focus ontreatment monitoring and post-marketing surveillance based on passive and active methods, cohort event monitoring, pregnancy registriesand special studies. In treatment sites, services providers should be trained and enabled to prevent, detect and assess adverse effects or otherantiretroviral drug-related problems. Pharmacovigilance programmes should also contribute to create a “culture of safety” based on goodcommunication of information about the benefits, harms and risks of drugs to practitioners, patients and the public.A WHO Pharmacovigilance project for antiretroviral medicines funded by the Bill and Melinda Gates Foundation is based on the following majorcomponents: consensus on definitions, methods and tools, capacity building, research agenda and coordination and information-sharing.In partnership with the Global Fund to fight AIDS, Tuberculosis and Malaria (Global Fund), WHO has developed a strategy based on best practicesto stimulate the inclusion of pharmacovigilance in Global Fund proposals and pharmaceutical plans, as well as to identify and field-test effectivepharmacovigilance processes and tools. These documents and tools are available online at http://www.<strong>who</strong>.<strong>int</strong>/hiv/topics/pharmacovigilance/en/BibliographyWHO. A practical handbook for the pharmacovigilance of antiretroviral medicines. Geneva, <strong>World</strong> <strong>Health</strong> <strong>Organization</strong>, 2009. (http://www.<strong>who</strong>.<strong>int</strong>/hiv/pub/pharmacovigilance/handbook/en/index.html, <strong>access</strong>ed 16 July 2010).WHO. Pharmacovigilance for antiretrovirals in resource-poor countries. Geneva, <strong>World</strong> <strong>Health</strong> <strong>Organization</strong>, 2007. (www.<strong>who</strong>.<strong>int</strong>/entity/medicines/publications/PhV_for_antiretrovirals.pdf, <strong>access</strong>ed 16 July 2010).WHO. The safety of medicines in public health programmes: pharmacovigilance an essential tool. Geneva, <strong>World</strong> <strong>Health</strong> <strong>Organization</strong>, 2006. (www.<strong>who</strong>.<strong>int</strong>/medicines/areas/quality_safety/safety_efficacy/Pharmacovigilance_B.pdf , <strong>access</strong>ed 16 July 2010).The Uppsala Monitoring Centre, WHO Collaborating Centre for International Drug Monitoring. Safety monitoring of medicinal products: guidelines forsetting up and running a pharmacovigilance centre. The Uppsala Monitoring Centre, 2000. (www.<strong>who</strong>.<strong>int</strong>/medicinedocs/en/d/Jh2934e/ , <strong>access</strong>ed 16July 2010)WHO. Clinical management of adverse events linked to antiretroviral medicines. Geneva, WHO, 2010 (in press).4.1.7. Antiretroviral drug priceThe Global Price Reporting Mechanism (GPRM) forantiretroviral drugs, established in 2004, provides informationon the transaction prices of antiretroviral drugs purchased in123 countries, including 43 low-income, 48 lower–middleincomeand 32 upper–middle-income countries.Reported data show that prices of the six most used first-lineregimens recommended by WHO in low- and middle-incomecountries have decreased between 1% and 36% between2008 and 2009, contributing to wider treatment availability(Figure 4.10). 1 Regionally, prices tend to be lower in sub-Saharan African than in other regions. Average prices paidfor second-line regimens remain relatively high in all regions(with some exceptions in certain low-income countries),where few or no prequalified generic alternatives are available.1 Additional figures with data on lower–middle- and upper–middle-incomecountries are available online at http://www.<strong>who</strong>.<strong>int</strong>/hiv/data/en/.4.1.7a. Prices of first-line regimens in low-incomecountries 2The median price paid for first-line treatments in low-incomecountries in 2009 ranged from US$ 81 per person per yearfor the fixed-dose combination of d4T+3TC + NVP (the mostwidely used combination) to US$ 613 for the most expensivefixed-dose combination of TDF+FTC+EFV (Figure 4.10).The weighted median 3 price of the six most widely usedfirst-line regimens (representing 96% of prescribed firstlinetreatments in low-income countries) was US$ 137 perperson per year in 2009, 3% lower than the average medianprice in 2008. Although modest, this drop occurred in spiteof the wider adoption of more expensive tenofovir-basedregimens. The decline in drug prices between 2006 and2009 (54%) can be attributed to the sustained scaling upof treatment programmes, the growing transaction volumes2 Countries with a gross national income per capita of US$ 975 or less3 The weighted median price is the sum of individual regimen median priceweighted/multiplied by the percentage of patients in the general populationusing that specific regimen.70 TOWARDS UNIVERSAL ACCESS: Scaling up priority HIV/AIDS <strong>int</strong>erventions in the health sector
<strong>access</strong>Fig. 4.10. Median annual cost (in US dollars) of first-line antiretroviral drug regimens foradults in low-income countries (LIC), 2006–2009700n 2006 n 2007 n 2008 n 2009Median transaction price (US$/ppy)60050040030020010003TC+NVP+d4T[150+200+30]mgEFV+[3TC+d4T]600mg+[150+30]mgEFV+[3TC+ZDV]600mg+[150+300]mg3TC+NVP+ZDV[150+200+300]mg[FTC+TDF]+NVP[200+300]mg+200mgEFV+FTC+TDF[600mg+200+300]mgFig. 4.11. Median annual cost (in US dollars) of first-line antiretroviral drug regimens forchildren (weighing 10 kg or more) in low-income countries (LIC), 2006–2009250n 2006 n 2007 n 2008 n 2009Median transaction price (US$/ppy)200150100500[3TC+NVP+d4T][60+100+12]mg[3TC+NVP+ZDV][30+50+60mg]3TC(10mg/ml)NVP(200mg)ZDV(100mg)EFV(200mg)3TC(10mg/ml)ZDV(100mg)and predictability of demand, the competition between agrowing number of products prequalified by WHO and thefavourable pricing policies by pharmaceutical companies.In 2009, the combination of d4T+3TC+NVP replacedAZT+3TC+NVP as the most commonly prescribedformulation for children (weighing 10 kg or more). Its averageprice declined from US$ 57 per person per year in 2006to US$ 52 in 2009. Average prices of other combinationscontinued to fall as well (Figure 4.11). Such price decreases canbe attributed to economies of scale associated with a largermarket for paediatric formulations, successful negotiationswith major generic manufacturers and development of fixeddosecombination formulations for children.4.1.7b. Prices of first-line regimens in lower–middleincomecountries 1Median prices in 2009 ranged from US$ 76 per person peryear for the least expensive regimen of d4T+3TC+NVP, toUS$ 667 per person per year for the most expensive regimenof TDF+FTC+EFV. In the same year, the weighted medianprice of the six most widely used combinations in first-lineregimens was US$ 141 per person per year, a decrease of13% from the previous year’s price.The most commonly used combination among children(weighing 10 kg or more) was d4T+3TC+NVP and its price fellfrom US$ 70 per person per year in 2006 to US$ 55 in 2009.1 Countries with a gross national income per capita of between US$976 andUS$ 3855PROGRESS REPORT 201071
towards <strong>universal</strong>4.1.7c. Prices of first-line regimens in upper–middleincomecountries 1In 2009, in upper–middle-income countries, median pricesranged from US$ 88 per person per year for the leastexpensive regimen of d4T+3TC + NVP to US$ 635 perperson per year for TDF+FTC+NVP. 2 In the same year, theweighted average median price of the six most widely usedcombinations in first-line regimens was US$ 202 per personper year. This represents a 21% increase from the medianprice observed in 2008, a fact partially explained by theinclusion of more expensive TDF-containing regimens infirst-line therapy.In 2009, only AZT-based regimens were reported forchildren’s formulations (weighing 10 kg or more). The priceof the most frequently used combination, AZT+3TC+NVP,reached US$ 177, a decline of 16% since 2006.4.1.7d. Prices of second-line regimens in low- andmiddle-income countriesPrices paid for second-line regimens also declined in 2009,but remained more expensive than first-line regimensacross low-income (Figure 4.12), lower–middle-incomeand upper–middle-income countries. In 2009, the mediancost of the most commonly used second-line regimenof ZDV+ddI+LPV/r was US$ 853 per person per year inlow-income countries, US$ 1378 in lower–middle-incomecountries and US$ 3638 in upper–middle-income countries.The median cost of [FTC +TDF] + LPV/r, the second mostcommonly used second-line regimen, was US$ 819 perperson per year in low-income countries, US$ 1392 inlower–middle-income countries and US$ 3551 in upper–middle-income countries. Actual prices paid for second-lineregimens vary greatly between countries. The decline in theprices of second-line drugs between 2006 and 2009 canbe attributed to the prequalification of generic alternativesfor abacavir (ABC), LPV/r and TDF, the patent expiry ofddI, scaling up of treatment programmes and new pricingpolicies by pharmaceutical companies, which increasedcompetition between WHO-prequalified products. However,as the number of people <strong>who</strong> need <strong>access</strong> to second-lineregimens continues to grow, addressing the high cost ofsecond-line regimens will become increasingly importantto ensure the most cost-effective use of available resources.1 Countries with a gross national income per capita of between US$ 3856 andUS$ 11 9052 Most expensive combination for which sufficient transaction data are availableFig. 4.12. Median annual cost (in US dollars) of second-line antiretroviral drug regimens foradults in low-income countries (LIC), 2006–20091600n 2006 n 2007 n 2008 n 20091400Median transaction price (US$/ppy)120010008006004002000ZDV+ddl+[LPV+RTV]300mg+400mg+[200+50]mg[FTC+TDF]+[LPV+RTV][200+300]mg+[200+50]mg[3TC+TDF]+[LPV+RTV][300+300]mg+[200+50]mg[FTC+TDF]+[LPV+RTV]+ZDV[200+300]mg+[200+50]mg+300mg[3TC+ZDV]+[LPV+RTV]+TDF[150+300]mg+[200+50]mg+300mgABC+ddl+[LVP+REV]300+400mg+[200+50]mg[3TC+ZDV]+[LPV+RTV][150+300]mg+[200+50]mg72 TOWARDS UNIVERSAL ACCESS: Scaling up priority HIV/AIDS <strong>int</strong>erventions in the health sector
<strong>access</strong>Box 4.12. Scaling up the response to viral hepatitisGreater attention must be devoted to addressing coinfection of HIV with viral hepatitides, especially hepatitis B and hepatitis C. With the expansionof antiretroviral therapy since 2003, many coinfected patients have been able to <strong>access</strong> antiretroviral therapy to treat HIV. However, treatment forviral hepatitides has not been scaled up concomitantly, leaving many people living with HIV and viral hepatitis exposed to the complications ofhepatitis B and C infections, including fatal liver disease.The revised WHO antiretroviral therapy guidelines for adults and adolescents recommend that antiretroviral therapy be initiated, irrespective ofWHO disease stage or CD4 cell count, in all patients with HIV/hepatitis B coinfection and chronic active hepatitis B 1 when treatment is indicatedfor hepatitis B. The revised guidelines recommend tenofovir (TDF)- and lamivudine (3TC)- (or emtricitabine)-containing antiretroviral regimensin all HIV/hepatitis B coinfected individuals needing treatment. In case of failure of antiretroviral therapy, TDF and 3TC (or emtricitabine) shouldbe continued for activity against hepatitis B virus and the second-line regimen should include other drugs with anti-HIV activity. Hepatitis C canbe effectively treated with a combination therapy of pegylated <strong>int</strong>erferon and ribavirin. Treatment for hepatitis C infection can lead to clearanceof the virus, thus avoiding longer-term liver damage. Treatment, however, requires enhanced laboratory capacity for diagnosis and monitoring oftreatment effectiveness.Resolution WHA63.18, adopted at the 63rd <strong>World</strong> <strong>Health</strong> Assembly in May 2010, recognized viral hepatitides as a public health issue and calledfor the implementation of comprehensive responses. It also called upon all Member States to improve epidemiological surveillance systems andto strengthen laboratory capacity, where necessary, in order to generate reliable information for guiding prevention and control measures (49).1 The current diagnosis of chronic active hepatitis in well-resourced settings is based on histological parameters obtained by liver biopsy and/or the availabilityof hepatitis B virus DNA testing, neither of which is usually available in resource-limited settings. A global definition of chronic active hepatitis in the contextof resource-limited settings based on clinical signs and simpler laboratory parameters is under discussion.4.2. Collaborative TB/HIV activitiesHIV-related TB remains a serious challenge for the healthsector’s response to HIV. Recent data show that, of the9.4 million incident TB cases worldwide in 2008, anestimated 1.4 million were among people living with HIV.Around 520 000 deaths from TB occurred among peopleliving with HIV, equivalent to 26% of the estimated 2 milliondeaths from HIV and 29% of the 1.8 million deaths fromTB in that year (50). The risk for TB is 20–37 times higherin people living with HIV than in the general population,depending on the prevalence of HIV in the population (51).Sub-Saharan Africa continues to account for the majority ofpeople living with HIV and TB in the world. In 2008, around78% of estimated HIV-positive TB cases were in this region,of which around one quarter was living in South Africa. TheSouth-East Asia Region, mainly India, accounts for 13% ofthe remaining cases.Data on drug-resistant forms of TB show that of, the9.4 million incident TB cases in 2008, an estimated 440 000were cases of multidrug-resistant TB. The region of EasternEurope and Central Asia is especially severely affected.In addition, 58 countries and territories reported at leastone case of extensively drug-resistant TB in 2008. Peopleliving with HIV may be at higher risk for drug-resistantforms of TB due to difficulties and delays in diagnosis, lackof <strong>access</strong> to antiretroviral therapy and complications ofconcomitant treatment with TB and antiretroviral therapy,poor implementation of isoniazid preventive therapy, andinadequate TB infection control measures, with increasedmortality and greatly reduced survival time (52–56).Collaborative activities between national TB and HIVprogrammes are essential to prevent, diagnose and treatTB among people with HIV and HIV among those with TB.These include establishing mechanisms for collaboration(such as coordinating bodies, jo<strong>int</strong> planning, surveillance,and monitoring and evaluation); decreasing the burden ofHIV among people with TB (with HIV testing and counselling,co-trimoxazole preventive therapy, antiretroviral therapy,and HIV prevention, care and support); and decreasingthe burden of TB among people with HIV (with the three I’sfor HIV/TB <strong>int</strong>ensified case-finding, TB prevention withisoniazid preventive therapy and/or antiretroviral therapy,and infection control for TB).Different models for the delivery of <strong>int</strong>egrated HIV and TBservices have been implemented in several countries withpromising results. In India, for example, TB and HIV servicesare provided separately with strengthened cross-referral.Provision of HIV testing in TB clinics and TB screening forinpatients in medical wards and HIV-positive outpatientshas been used in Rwanda, while <strong>int</strong>egrated models with “onestopservice” for TB patients with HIV have been reportedin South Africa. Each model, however, has advantagesand disadvantages and is highly dependent on contextualissues and policy choices. Nevertheless, irrespective of themodel chosen, earlier <strong>access</strong> to HIV testing and counselling,antiretroviral therapy and TB preventive or curative treatmentis key to prevent excess morbidity and mortality from TB.PROGRESS REPORT 201073
towards <strong>universal</strong>Fig. 4.13. Estimated HIV prevalence among new TB cases, 2008Estimated HIV prevalence in newTB cases, all ages, 2008 (%)
<strong>access</strong>Fig. 4.14. Rates of HIV testing among TB patients WHO African Region, 2004–20082004
towards <strong>universal</strong>in 2006, to 125 000 people in 77 reporting countries in2008 and 173 000 in 101 countries in 2009. Of these,141 000 people were in sub-Saharan Africa, 14 000 in East,South and South-East Asia, 8500 in Latin America and theCaribbean, 8100 in Eastern Europe and Central Asia, and1000 in North Africa and the Middle East. They represented17% of the estimated TB/HIV cases in these reportingcountries, a figure considerably lower than the estimatedcoverage of antiretroviral therapy for all HIV patients inlow- and middle-income countries. Given the increasingevidence of <strong>access</strong> to testing for TB patients, and betterlinkages between TB and HIV services, this gap may reflectthe weaknesses of reporting <strong>access</strong> to care among TB/HIVpatients. However, this might also reflect poorer <strong>access</strong> toantiretroviral therapy for TB patients. Indeed, data from eightcountries that accounted for 18% of the estimated globalburden of HIV-positive TB cases in 2007 showed that thereare more than five decentralized TB treatment centres forevery facility providing antiretroviral therapy (51).4.2.2. Decreasing the burden of TB amongpeople with HIVDecreasing the burden of TB among people with HIV relieson the Three I’s for HIV/TB strategy: isoniazid preventivetreatment, prevention of TB with <strong>int</strong>ensified casefinding, and infection control for TB (Box 4.15). The poorimplementation of the Three I’s for HIV/TB strategy remainsa major concern for the control of these dual epidemics. In2009, 43% of reporting countries (48 out of 112) indicatedthat isoniazid preventive treatment was a part of theirpackage of <strong>int</strong>erventions for people living with HIV; 60%reported having implemented <strong>int</strong>ensified case finding forTB prevention and 51% had a TB infection control policy.It remains critical for managers of HIV and TB programmesto work closely together and with affected communities toscale up and ensure that people living with HIV have <strong>access</strong>to the Three I’s for HIV/TB as part of <strong>universal</strong> <strong>access</strong> to highqualitycomprehensive prevention, care and treatment ofHIV infection and TB (64).4.3. Looking aheadAs of December 2009, 1.2 million additional people were onantiretroviral therapy, the largest year-on-year increase onrecord. Yet, revised treatment guidelines for antiretroviraltherapy in adults and adolescents, which now recommendtherapy to be initiated at an earlier stage of disease,increased the number of eligible patients in low- and middleincomecountries by 45%, from 10.1 million to 14.6 million.This means that, in spite of continued progress, with lessthan 3 months to December 2010, only 36% of patients inneed of antiretroviral therapy in low- and middle-incomecountries currently have <strong>access</strong> to it.While achieving <strong>universal</strong> <strong>access</strong> may now requirehigher upfront investments, these are likely to be morethan compensated in the medium term by savings asmorbidity and mortality rates fall and costs associatedwith hospitalizations and palliative care drop. Such positivedynamics underscore the need to accelerate efforts to scaleup <strong>access</strong> to treatment and care <strong>int</strong>erventions.In addition to accelerated efforts, new models are necessaryto enhance the efficiency and effectiveness of servicedelivery, including antiretroviral treatment provision,and expand coverage and increase the impact of HIV<strong>int</strong>erventions in general.More must be done to strategically <strong>int</strong>egrate HIV/AIDS<strong>int</strong>erventions <strong>int</strong>o national health services, strategies andplans, including those for sexual, reproductive, maternaland child health, tuberculosis, sexual transmitted infectionsBox 4.15. The Three I’s for HIV/TB guidelinesThe revised draft of the “WHO guidelines for <strong>int</strong>ensified case finding and isoniazid preventive therapy for tuberculosis for people living with HIVin resource-constrained settings” recommends the use of a simplified screening algorithm that includes four clinical symptoms ¬ current cough,fever, weight loss, night sweats ¬ to identify those eligible for either isoniazid preventive treatment or further diagnostic work-up for TB andother conditions. While chest radiography is no longer mandatory before starting isoniazid preventive treatment, the guidelines do support itsuse when feasible to increase the sensitivity of the screening. Building on the 1998 UNAIDS/WHO isoniazid preventive treatment policy, the newguidelines strongly recommend at least six months of isoniazid preventive treatment for children and adults, including pregnant women, peoplereceiving antiretroviral therapy and for those <strong>who</strong> have successfully completed TB treatment. In addition, a 36-month course of isoniazid preventivetreatment is now conditionally recommended in high HIV- and TB-prevalent settings. The revised guidelines emphasize that a tuberculin skin testis not a requirement for initiating isoniazid preventive treatment for people living with HIV. However, where feasible, tuberculin skin testing canassist in identifying those <strong>who</strong> would benefit most from isoniazid preventive treatment. The revised guidelines also emphasize isoniazid preventivetreatment as a core component of HIV prevention and care services, and recommend that TB prevention be considered as a central responsibilityof AIDS programmes and HIV service providers. The re-conceptualized guidelines no longer discuss isoniazid preventive treatment as an isolated<strong>int</strong>ervention for people living with HIV, but recommend it as part of a broader TB prevention package along with infection control for TB, <strong>int</strong>ensifiedTB case finding and the provision of antiretroviral therapy.76 TOWARDS UNIVERSAL ACCESS: Scaling up priority HIV/AIDS <strong>int</strong>erventions in the health sector
<strong>access</strong>and harm reduction. At the same time, special approachesremain necessary to address the particular circumstancesand needs of those groups usually not reached throughstandard service delivery channels, including populationsat greater risk of HIV infection.Multiple programmatic bottlenecks along the continuumof care, from treatment initiation to long-term therapyma<strong>int</strong>enance, still hinder effective responses in manylow- and middle-income countries and threaten theirsustainability. The Treatment 2.0 Initiative, launched byWHO and UNAIDS, seeks to address them through a holisticperspective aimed at raising the quality of services deliveredand dramatically reducing the cost of <strong>int</strong>erventions.Timely initiation of antiretroviral therapy – often an issuebecause people do not know their HIV status and becauseof underlying stigma and discrimination – is necessary toavoid the high mortality rates observed in the first year afteradults and children initiate treatment. Expanding <strong>access</strong>to HIV testing and counselling services, including throughprovider-initiated approaches, must continue to be a priorityto ensure timely diagnosis of HIV infection.Greater attention must also be paid to the quality ofservices and <strong>int</strong>erventions, as only high-quality treatmentprogrammes can sustain appropriate levels of retention andadherence to antiretroviral therapy. Indeed, low adherenceand retention are two critical reasons for poor treatmentoutcomes among people receiving antiretroviral therapy.In addition to directly affecting personal well-being, pooradherence and retention rates may accelerate the shift fromfirst- to more expensive, and often unavailable, second-lineregimens at an unnecessarily early stage.Despite reductions in drug prices over the past ten years,overall costs of antiretroviral therapy programmes havecontinued to rise, as more patients initiate antiretroviraltherapy and more need to move from first- to second-linecombinations, <strong>who</strong>se prices are still higher than entry-levelregimens. Therefore, additional efforts are necessary toreduce their prices and increase their availability in low- andmiddle-income countries. Nevertheless, although increasingdrug affordability is important, potential gains are nowhighest in the area of reducing non-drug-related costs ofproviding treatment, such as inpatient care and staff-relatedexpenses.While current regimens can successfully lower morbidityand mortality among people receiving treatment, theirlong-term toxicities can still negatively affect criticaltreatment outcomes. In addition, treatment monitoringoften requires highly specialized equipment andlaboratory technicians. Dramatic acceleration of <strong>access</strong> totreatment thus requires the development of simpler, lesstoxic and less resistance-prone treatment regimens, aswell as cheaper and simplified diagnostic and monitoringtools. Ensuring that all people in need have <strong>access</strong> totreatment will also maximize the preventive effect ofantiretroviral therapy. Indeed, it is estimated that thiscould result in an annual reduction in new HIV infectionsof up to one third. Moreover, optimizing HIV treatmentcoverage can yield other important health preventionbenefits, including much lower rates of tuberculosisamong people living with HIV.These novel approaches will only be successfully designedand implemented with substantially strengthenedcommunity mobilization and involvement in programmemanagement and service delivery. In addition, greatercommunity participation is key to improving treatment<strong>access</strong> and adherence. Indeed, community-basedapproaches that build trust, protect human rights andprovide opportunities for socialization directly improve theability of people to use HIV services and <strong>access</strong> antiretroviraltherapy. This is particularly essential for those groups <strong>who</strong>are most marginalized and discriminated against, includingmigrants, injecting drug users, sex workers and men <strong>who</strong>have sex with men. tPROGRESS REPORT 201077
towards <strong>universal</strong>Box 4.16. Reducing stigma and discrimination in health-care facilities in Ghana (72)HIV-related stigma has been identified as one of the principal obstacles to HIV prevention and scaling up testing and treatment worldwide. Fearof stigma, also known as “anticipated stigma”, falls more heavily in vulnerable populations, such as women, key affected groups and the poor, <strong>who</strong>are often at greater risk for HIV acquisition (73,74). Unfortunately, populations most in need of <strong>access</strong> to HIV services are often those with thehighest levels of fear about the stigma they might experience in health facilities (73).Recent research has identified three main drivers of HIV stigma, which are consistent across contexts (75): (i) lack of awareness and knowledge ofHIV-related stigma and discrimination, (ii) fear of acquiring HIV through everyday contact with infected people, and (iii) linking people living withHIV with behaviours considered improper or immoral.Studies show that <strong>int</strong>erventions aimed at decreasing stigma in health facilities can change health workers’ attitudes and behaviours towardspeople living with HIV. The underlying drivers of HIV-related stigma may be addressed by creating awareness of what stigma is and the benefitsof reducing it, fostering motivation for change, addressing fears and misconceptions about HIV transmission, discussing “taboo” topics such asgender, violence, sexuality and injecting drug use, and providing skills to challenge stigma and change behaviour (76,77).In mid-2006, Quality <strong>Health</strong> Partners (QHP), in partnership with the Strengthening HIV/AIDS Response Partnerships (SHARP) project, the GhanaSustainable Change Project and the National AIDS Control Programme (NACP), launched the high-impact package of HIV and AIDS <strong>int</strong>erventions(HIP) initiative to complement the national scale-up of comprehensive HIV services. At the same time, it aimed to address the issue of stigma andimprove facility–community linkages.In relation to stigma, HIP includes: 1) training in stigma reduction and infection prevention for clinical and non-clinical health workers (tailored toeach group); 2) training in infection prevention for family or friends <strong>who</strong> are caregivers of clients; and 3) action plans for client-oriented, providerefficientservices to address facility-specific stigma-related issues (e.g. to improve privacy, confidentiality and client–provider <strong>int</strong>eraction).In 2008–09, a rapid appraisal of six of 25 QHP-supported hospitals implementing HIP and their clients was undertaken to measure the prevalenceof stigma and discriminatory attitudes and practices among staff, and the effectiveness of the HIP training in mitigating them. Although the studywas not a complete impact evaluation, a number of notable results emerged.• The majority of clients and health workers reported declines in the major drivers of stigma, especially a reduction in the fear of casual transmissionand of moralizing attitudes, though clients’ fears of indirect disclosure remained.• Clients reported that though HIV-related stigma had declined in other units of the hospital, it still negatively impacted upon the quality of care.• “Anticipated” HIV stigma by health workers did not appear to be an obstacle for the majority of most-at-risk populations using testing, treatmentand care services.• The HIP <strong>int</strong>erventions reportedly increased health workers’ willingness to care for HIV-positive people.• Both health workers and clients reported a decline in discriminatory practices towards people living with HIV.A number of recommendations resulted from the appraisal. First, it is necessary to ma<strong>int</strong>ain and strengthen, with the necessary budget allocations,the training content and activities aimed at reducing stigma and discrimination, while incorporating more follow-up activities and refresher trainingsto enhance retention of the material and its implementation. The appraisal also suggested the need to prioritize issues that groups at higher risk forHIV infection (including men <strong>who</strong> have sex with men, sex workers and injecting drug users) identify as primary obstacles to the uptake of healthprevention and care services, such as lack of adequate protection of client confidentiality. The appraisal also drew attention to the importanceof strengthening linkages between stigma reduction activities targeting health facilities and those targeting communities, as health workers’behaviour in the workplace may be negatively influenced by discriminatory attitudes and perceptions carried over from the communities they live in.78 TOWARDS UNIVERSAL ACCESS: Scaling up priority HIV/AIDS <strong>int</strong>erventions in the health sector
<strong>access</strong>References1. Rapid advice: antiretroviral therapy for HIV infection in adults and adolescents. Geneva, <strong>World</strong> <strong>Health</strong> <strong>Organization</strong>, 2009. (http://www.<strong>who</strong>.<strong>int</strong>/hiv/pub/arv/advice/en/index.html, <strong>access</strong>ed 15 July 2010).2. Panel on Antiretroviral Guidelines for Adults and Adolescents. Guidelines for the use of antiretroviral agents in HIV-1-Infected adultsand adolescents. Department of <strong>Health</strong> and Human Services. December 1, 2009:1–161. (http://www.aidsinfo.nih.gov/ContentFiles/AdultsandAdolescentGL.pdf, <strong>access</strong>ed on 25 January 2009).3. Anonymous. Southern African Clinicians Society Guidelines: antiretroviral therapy in adults. Southern African Journal of HIV Medicine,2008, 29:18–31.4. Recomendações para Terapia Anti-retroviral em Adultos Infectados pelo HIV: 2008/ Ministério da Saúde, Secretaria de Vigilânciaem Saude. Programa Nacional de DST e Aids. 7a Ed. – Brasília: Ministério da Saúde, 2008.5. Kitahata M et al. Effect of early versus deferred antiretroviral therapy for HIV survival. New England Journal of Medicine, 2009,360:1815–1826.6. Sterne JA et al.; When to Start Consortium. Timing of initiation of antiretroviral therapy in AIDS-free HIV-1-infected patients: acollaborative analysis of 18 HIV cohort studies. Lancet, 2009, 373:1352–1363.7. Sax P, Baden L. When to start antiretroviral therapy – ready when you are? New England Journal of Medicine, 2009, 360:1897–1899.8. The Global Fund 2010: innovation and impact. Geneva, Global Fund to Fight AIDS, Tuberculosis and Malaria, 2010.9. Latest results [web site]. Technical note on PEPFAR’s reporting methodology. Washington, DC, United States President’s Emergency Planfor AIDS Relief, 2010 (http://www.pepfar.gov/2009results/, <strong>access</strong>ed 8 August 2010).10. Press room [website]. Making a difference: funding. Washington, DC, United States President’s Emergency Plan for AIDS Relief, 2010(http://www.pepfar.gov/press/index.htm <strong>access</strong>ed 8 August 2010).11. UNAIDS. Publications: Reference Group reports [web site]. Geneva, UNAIDS Reference Group on Estimates, Modelling and Projections,2009 (http://www.epidem.org/publications.htm <strong>access</strong>ed 9 July 2010).12. Granich R et al. Universal voluntary HIV testing with immediate antiretroviral therapy as a strategy for elimination of HIV transmission:a mathematical model. Lancet, 2009, 373: 48–57.13. Stover J et al. The Spectrum projection package: improvements in estimating mortality, ART needs, PMTCT impact and uncerta<strong>int</strong>ybounds. Sexually Transmitted Infections, 2008, 84 Suppl I: i24–i30. And (for 2009 version): www.unaids.org/en/KnowledgeCentre/HIVData/Epidemiology/EPI_software2009.asp14. Fox MP, Rosen S. Patient retention in antiretroviral therapy programs up to three years on treatment in sub-Saharan Africa,2007–2009: systematic review. Tropical Medicine & International <strong>Health</strong>, 2010, 15(s1):1–15.15. Tassie JM et al. Trends in retention on antiretroviral therapy in national programs in low-income and middle-income countries. Journalof Acquired Immune Deficiency Syndromes, 2010, 54:437–41.16. Harries AD et al. Strategies to improve patient retention on antiretroviral therapy in sub-Saharan Africa. Tropical Medicine & International<strong>Health</strong> 2010, 15(s1):70–75.17. Fairall LR et al. Effectiveness of antiretroviral treatment in a South African program: a cohort study. Archives of Internal Medicine, 2008,168:86–93.18. Bassett IV et al. Who starts antiretroviral therapy in Durban, South Africa?... not everyone <strong>who</strong> should. AIDS, 2010, 24 (Suppl 1):S37–S44.19. McGuire M et al. Vital status of pre-ART and ART patients defaulting from care in rural Malawi. Tropical Medicine & International <strong>Health</strong>,2010, 15(s1):55–62.20. Amuron B et al. Mortality and loss-to-follow-up during the pre-treatment period in an antiretroviral therapy programme under normalhealth service conditions in Uganda. BMC Public <strong>Health</strong>, 2009, 9:290.21. Rajaratnam JK et al. <strong>World</strong>wide mortality in men and women aged 15–59 years from 1970 to 2010: a systematic analysis. Lancet, 2010,375:1704–1720.PROGRESS REPORT 201079
towards <strong>universal</strong>22. Egger M, Boulle A. Population effect of scaling up ART in resource-poor settings. Lancet, 2008, 371:1558–1559.23. Beck EJ et al. for the National Prospective Monitoring System Steering Group. Decreased morbidity and use of hospital services inEnglish HIV-infected individuals with increased uptake of anti-retroviral therapy 1996–1997. AIDS, 1999, 13:2157–2164.24. Makombe SD et al. Assessing the quality of data aggregated by antiretroviral treatment clinics in Malawi. Bulletin of the <strong>World</strong> <strong>Health</strong><strong>Organization</strong>, 2008,86:310–314.25. The Global Fund to Fight AIDS, Tuberculosis and Malaria. 5-Year evaluation: study area 3. (http://www.theglobalfund.org/en/terg/evaluations/5year/ <strong>access</strong>ed 22 June 2010).26. Walton DA et al. Integrated HIV prevention and care strengthens primary health care: lessons from rural Haiti. Journal of Public <strong>Health</strong>Policy, 2005, 25:137–158.27. Sanne I et al. Nurse versus doctor management of HIV-infected patients receiving antiretroviral therapy (CIPRA-SA): a randomisednon-inferiority trial. Lancet, 2010, 376:33–40.28. Herbst AJ et al. Adult mortality and antiretroviral treatment roll-out in rural KwaZulu-Natal, South Africa. Bulletin of the <strong>World</strong> <strong>Health</strong><strong>Organization</strong>, 2009, 87:754–762.29. Quinn TC et al. Viral load and hetrosexual transmission of HIV 1. Rakai Study Group. New England Journal of Medicine, 2000, 342:921–929.30. Attia S et al. Sexual transmission of HIV according to viral load and antiretroviral therapy: systematic review and meta-analysis. AIDS,2009, 23:1397–1404.31. Donnell D et al. Heterosexual HIV-1 transmission after initiation of antiretroviral therapy: a prospective cohort analysis. Lancet, 2010,375:2092–2098.32. Wood E et al. Longitudinal community plasma HIV-1 RNA concentrations and incidence of HIV-1 among injecting drug users prospectivecohort study. British Medical Journal, 2009, 338:b1649.33. Das-Douglas M et al. Decreases in community viral load are associated with a reduction in new HIV diagnoses in San Francisco. In:17th Conference on Retroviruses and Opportunistic Infections (CROI), San Francisco, USA, 16–19 February 2010 (abstract 33; http://www.retroconference.org/2010/Abstracts/38232.htm, <strong>access</strong>ed 3 August 2010).34. Castel A et al. Monitoring the impact of expanded HIV testing in the District of Columbia using population-based HIV/AIDS surveillancedata. In: 17th Conference on Retroviruses and Opportunistic Infections (CROI), San Francisco, USA, 16–19 February 2010,(abstract 34;http://www.retroconference.org/2010/Abstracts/38192.htm <strong>access</strong>ed 3 August 2010).35. Walensky RP et al. Scaling up antiretroviral therapy in South Africa: the impact of speed on survival. Journal of Infectious Diseases, 2008,197:1324–1332.36. Velasco-Hernandez JX, Gershengorn HB, Blower SM. Could widespread use of combination antiretroviral therapy eradicate HIVepidemics? Lancet Infectious Diseases, 2002, 2:487–493.37. Montaner JS et al. The case for expanding <strong>access</strong> to highly active antiretroviral therapy to curb the growth of the HIV epidemic. Lancet,2006, 368:531–536.38. Walensky RP et al. Test and treat DC: modeling the impact of a comprehensive HIV strategy in the US Capitol. 5th IAS Conference onHIV Pathogenesis, Treatment and Prevention, 19–22 July 2009, Cape Town, South Africa (abstract no. LBPEC04; http://www.ias2009.org/pag/Abstracts.aspx?AID=3748, <strong>access</strong>ed 16 July 2010).39. Charlebois E et al. Effect of expanded ART strategies on the MSM HIV epidemic in San Francisco. In: 17th Conference on Retrovirusesand Opportunistic Infections (CROI), San Francisco, USA, 16–19 February 2010 (abstract 996; http://www.retroconference.org/2010/Abstracts/39042.htm, <strong>access</strong>ed 13 March 2010).40. De Luca A, Prosperi M, Bracciale L. Resistance considerations in sequencing of antiretroviral therapy in low-middle income countrieswith currently available options. Current Opinion in HIV and AIDS, 2010, 5:27–37.41. Hamers RL et al. The status of HIV-1 resistance to antiretroviral drugs in sub-Saharan Africa. Antiviral Therapy, 2008, 13:625–639.[Review]. Erratum in: Antiviral Therapy, 2008, 13:1129.42. Report on the 2008 national HIV sentinel survey. Windhoek, The Republic of Namibia Ministry of <strong>Health</strong> and Social Services, 2008(http://www.healthnet.org.na/documents/reports/2008%20National%20HIV%20Sentinel%20Survey%20Report.pdf, <strong>access</strong>edon 15 August 2010).80 TOWARDS UNIVERSAL ACCESS: Scaling up priority HIV/AIDS <strong>int</strong>erventions in the health sector
<strong>access</strong>43. <strong>World</strong> <strong>Health</strong> <strong>Organization</strong> [website]. Country health profile: Namibia. Geneva, <strong>World</strong> <strong>Health</strong> <strong>Organization</strong>, 2010 (http://www.<strong>who</strong>.<strong>int</strong>/countries/nam/en/ <strong>access</strong>ed August 2010).44. Bennett DE et al. The <strong>World</strong> <strong>Health</strong> <strong>Organization</strong>’s global strategy for prevention and assessment of HIV drug resistance. AntiviralTherapy, 2008,13 (Suppl 2):1–13.45. <strong>World</strong> <strong>Health</strong> <strong>Organization</strong>. HIV drug resistance: early warning indicators. April 2010 update. (http://www.<strong>who</strong>.<strong>int</strong>/hiv/topics/drugresistance/hiv_dr_early_warning_indicators.pdf, <strong>access</strong>ed on 18 August 2010).46. Jordan MR et al. <strong>World</strong> <strong>Health</strong> <strong>Organization</strong> surveys to monitor HIV drug resistance prevention and associated factors in sentinelantiretroviral treatment sites. Antiviral Therapy, 2008, 13 (Suppl. 2):15–23.47. Bennett DE et al. Recommendations for surveillance of transmitted HIV drug resistance in countries scaling up antiretroviral treatment.Antiviral Therapy, 2008 13 (Suppl. 2):25–36.48. Myatt M, Bennett DE. A novel sequential sampling technique for the surveillance of transmitted HIV drug resistance by cross-sectionalsurvey for use in low resource settings. Antiviral Therapy, 2008, 13 (Suppl. 2):37–48.49. Resolution WHA63.18. Viral hepatitis. In: Sixty-third <strong>World</strong> <strong>Health</strong> Assembly, Geneva, 21 May 2010. Geneva, <strong>World</strong> <strong>Health</strong> <strong>Organization</strong>,2010 (WHA63/A63_R18), (http://apps.<strong>who</strong>.<strong>int</strong>/gb/ebwha/pdf_files/WHA63/A63_R18-en.pdf, <strong>access</strong>ed 14 July 2010).50. WHO. Global Tuberculosis Control: a short update to the 2009 report. Geneva, Switzerland, <strong>World</strong> <strong>Health</strong> <strong>Organization</strong>, 2010.51. Getahun H et al. HIV Infection-associated tuberculosis: the epidemiology and the response. Clinical Infectious Disease, 2010, 50 (Suppl.3):S201–S207.52. Wells CD et al. HIV infection and multidrug-resistant tuberculosis: the perfect storm. Journal of Infectious Diseases, 2007, 196 (Suppl.1):S86–S107.53. Dubrovina I et al. Drug-resistant tuberculosis and HIV in Ukraine: a threatening convergence of two epidemics? International Journalof Tuberculosis and Lung Disease, 2008, 12:756–762.54. Multidrug and extensively drug-resistant TB (M/XDR-TB): 2010 global report on surveillance and response. Geneva, Switzerland, <strong>World</strong><strong>Health</strong> <strong>Organization</strong>, 2010.55. Havlir DV et al. Opportunities and challenges for HIV care in overlapping HIV and TB epidemics. Journal of the American MedicalAssociation, 2008, 300:423–430.56. Kawai V et al. Tuberculosis mortality, drug resistance, and infectiousness in patients with and without HIV infection in Peru. TheAmerican Society of Tropical Medicine and Hygiene, 2006, 75:1027–1033.57. Meaza Demissie. “Situation analysis for the provision of HIV prevention, care and treatment services, including antiretroviral therapyfor HIV positive TB patients using TB service po<strong>int</strong>s in Ethiopia,” Report, November 26, 2009 (mimeo).58. WHO global TB control report. Geneva, WHO, 2011 (in press).59. Miranda A et al. Impact of antiretroviral therapy on the incidence of tuberculosis: the Brazilian experience, 1995–2001. PLoS One, 2007,2:e826.60. Middelkoop K et al. Can antiretroviral therapy contain a previously escalating TB epidemic in a HIV prevalence community? 5th IASconference on HIV Pathogenesis, Prevention and Treatment; 2009 Cape Town, South Africa, 2009.61. Severe P et al. Early versus standard antiretroviral therapy for HIV-infected adults in Haiti. New England Journal o f Medicine, 2010,363:257–265.62. Golub JE et al. Recurrent tuberculosis in HIV-infected patients in Rio de Janeiro, Brazil. AIDS. 2008, 22:2527–2533.63. Nahid P et al. Treatment outcomes of patients with HIV and tuberculosis. American Journal of Respiratory and Critical Care Medicine,2007,175:1199–1206.64. Granich R et al. Prevention of tuberculosis in persons infected with HIV. Clinical Infectious Diseases, 2010, 50 (Suppl. 3):67–S70.65. Lawn SD, Kranzer K, Wood R. Antiretroviral therapy for control of the HIV-associated tuberculosis epidemic in resource-limited settings.Clinics in Chest Medicine, 2009, 30:685–699.PROGRESS REPORT 201081
towards <strong>universal</strong>66. Blanc FX et al. Treatment strategies for HIV-infected patients with tuberculosis: ongoing and planned clinical trials. Journal of InfectiousDiseases, 2007, 196 (Suppl. 1):S46–S51.67. Abdool Karim SS et al. Timing of initiation of antiretroviral drugs during tuberculosis therapy. New England Journal of Medicine, 2010,362:697–706.68. Velasco M et al. Effect of simultaneous use of highly active antiretroviral therapy on survival of HIV patients with tuberculosis. Journalof Acquired Immune Deficiency Syndromes, 2009, 50:148–152.69. Varma JK et al. HIV care and treatment factors associated with improved survival during TB treatment in Thailand: an observationalstudy. BMC Infectious Diseases, 2009, 9:42.70. Tabarsi P et al. Early initiation of antiretroviral therapy results in decreased morbidity and mortality among patients with TB and HIV.Journal of the International AIDS Society, 2009, 12:14.71. Blanc FX et al. Significant enhancement in survival with early (2 weeks) vs. late (8 weeks) initiation of highly active antiretroviraltreatment (HAART) in severely immunosuppressed HIV-infected adults with newly diagnosed tuberculosis. XVIII International AIDSConference 2010, Vienna, Austria, 18–23 July 2010 (abstract THLBB106).72. Quality <strong>Health</strong> Partners, Engender <strong>Health</strong>. A rapid appraisal of HIV-related stigma and discrimination reduction <strong>int</strong>erventions in selectedhealth facilities in Ghana (final draft). January 2009 (http://www.ghanaqhp.org/fileadmin/user_upload/QHP/HIV_Stigma_Rapid_Appraisal_Report_09.pdf, <strong>access</strong>ed 29 August 2010).73. Wolfe WR et al. The impact of <strong>universal</strong> <strong>access</strong> to antiretroviral therapy on HIV stigma in Botswana. American Journal of Public <strong>Health</strong>,2008, 98:1865–1871.74. Parker R, Aggleton P. HIV and AIDS-related stigma and discrimination: a conceptual framework and implications for action. SocialScience and Medicine, 2003, 57:15–24.75. UNAIDS . Reducing HIV stigma and discrimination: a critical part of national AIDS programmes, a resource for national stakeholders in theHIV response. Geneva, UNAIDS, 2008.76. Nyblade L et al. Disentangling HIV and AIDS stigma in Ethiopia, Tanzania and Zambia. Washington, DC, International Center for Researchon Women, 2003.77. Ogden J, Nyblade L. Common at its core: HIV-related stigma across contexts. Washington, DC, International Center for Research onWomen, 2005.82 TOWARDS UNIVERSAL ACCESS: Scaling up priority HIV/AIDS <strong>int</strong>erventions in the health sector
<strong>access</strong>5. Scaling up HIV services forwomen and childrenKey findingsn The proportion of pregnant women <strong>who</strong> received an HIV test increased slightly. An estimated 26% of theestimated 125 million pregnant women 1 in low- and middle-income countries received an HIV test in 2009,up from 21% in 2008 and 7% in 2005. In the Eastern and Southern Africa region, the proportion of pregnantwomen <strong>who</strong> received an HIV test increased from 43% in 2008 up to 50% in 2009.n Approximately 51% of pregnant women testing positive were reported to have been assessed for eligibilityto receive antiretroviral therapy for their own health.n Over half of the 1.4 million pregnant women living with HIV are estimated to have received antiretroviral drugs toprevent transmission of HIV to their infants. An estimated 53% [40–79%] of pregnant women living with HIVreceived antiretrovirals to reduce the risk of transmitting HIV to their infants, up from 45% [37–57%] in2008 and 15% [12–18%] in 2005. A large proportion continued to receive the less efficacious single-dosenevirapine regimen.n Slightly more infants received antiretroviral prophylaxis to prevent acquisition of HIV from their mothers. Thirty-fiveper cent [26–53%] of infants in need received antiretroviral prophylaxis for prevention of mother-to-childtransmission in 2009, up from 32% [26–40%] in 2008.n Among infants and children exposed to HIV, <strong>access</strong> to early testing, care and treatment is insufficient. In 2009, in54 reporting countries, only 15% [10–28%] of children born to HIV-positive mothers received an HIV test with<strong>int</strong>he two first two months of life.n The proportion of children in need <strong>who</strong> received antiretroviral therapy rose further in 2009. The number of childrenbelow the age of 15 years on antiretroviral therapy rose from 275 300 in 2008 to 356 400 in 2009. Thisrepresents an estimated coverage of 28% [21–43%] of children in need of antiretroviral therapy, up from22% [16–34%] in 2008, based on updated treatment needs.1 Pregnant women were proxied by the estimated number of births.Source: United Nations, Department of Economic and Social Affairs, Population Division (2009). <strong>World</strong> Population Prospects: The 2008 Revision, CD-ROM Edition.83
towards <strong>universal</strong>IntroductionIn July 2010, WHO released updated guidelines onantiretrovirals for treating pregnant women living with HIVand preventing HIV infection in infants, infant-feeding <strong>int</strong>he context of maternal HIV, and antiretroviral therapy forHIV in infants and children (1). These new guidelines callfor an earlier start and longer duration of antiretrovirals inwomen and children, which would require strategies andincreased capacity to assess eligibility for antiretroviraltherapy and undertake long-term monitoring, includingof adherence to antiretrovirals. Scaling up <strong>int</strong>erventionsto reach more women and children in need also demands<strong>int</strong>egrating, where appropriate, HIV <strong>int</strong>erventions withinroutine maternal, child and other health services.Successful implementation of the revised 2010 WHOguidelines will contribute to improving the health andsurvival of mothers living with HIV and children exposedto HIV and, ultimately, to the realization of MillenniumDevelopment Goals (MDGs) 4 and 5, as well as the goalof eliminating mother-to-child transmission of HIV by2015 (Box 5.1). This is a unique opportunity to harness thenecessary political and financial resources to achieve anHIV-free generation.In 2008, 1 an estimated 15.7 million women aged 15 yearsand above were living with HIV globally, of <strong>who</strong>m 12 millionwere in sub-Saharan Africa (6). The number of children lessthan 15 years of age living with HIV was 2.1 million, withan estimated 430 000 children below 15 years becomingnewly infected. In sub-Saharan Africa, women accounted forapproximately 60% of estimated HIV infections. In 2008,of all new infections among children, 91% occurred in thisregion (6).More than 90% of children living with HIV are infectedthrough mother-to-child transmission during pregnancy,around the time of birth or through breastfeeding (7).Children may also be infected with HIV through transfusion1 2009 estimates are not yet available, and will be published in the forthcomingAIDS Today: UNAIDS Global Report.Box 5.1. International targets for mother-to-child transmission of HIVIn June 2001, Heads of State and Representatives of Governments adopted the Declaration of Commitment on HIV/AIDS at the United NationsGeneral Assembly Special Session (UNGASS) on HIV/AIDS. Countries committed that by 2005, they would reduce by 20% and, by 2010, by 50%,the number of infants infected with HIV by ensuring that “80% of pregnant women in antenatal care receive HIV information, counselling andother HIV prevention services; increasing the availability of and providing <strong>access</strong> for HIV-infected women and babies to effective treatment toreduce mother-to-child transmission of HIV, as well as through effective <strong>int</strong>erventions for HIV-infected women, including voluntary and confidentialtesting and counselling, <strong>access</strong> to treatment, especially antiretroviral therapy and, where appropriate, breast-milk substitutes and the provisionof a continuum of care” (2).In June 2006, a Political Declaration on HIV/AIDS was adopted at the United Nations General Assembly High-Level Meeting on AIDS, reaffirmingthe commitment of all Member States to fully implement the 2001 UNGASS Declaration as well as the MDGs, and to work towards <strong>universal</strong> <strong>access</strong>to HIV prevention, treatment, care and support (3).In 2007, the Inter-Agency Task Team (IATT) on Prevention of HIV Infection in Pregnant Women, Mothers and their Children issued a Guidance onglobal scale-up of prevention of mother-to-child transmission of HIV, with recommended target coverage levels of at least 80% for key <strong>int</strong>erventions atthe national level (4).Since then, several multilateral and bilateral agencies have prioritized the reduction of mother-to-child transmission of HIV, and have called forits effective elimination by 2015. In 2009, WHO released its PMTCT strategic vision 2010–2015 to prevent mother-to-child transmission and improvematernal, newborn, and child health and survival in the context of HIV, to reach the UNGASS targets and MDGs (5). The Global Fund to Fight HIV/AIDS, Tuberculosis and Malaria is reviewing and reprogramming existing grants to support increased coverage and quality of programmes toprevent mother-to-child transmission.The UNAIDS Secretariat and its cosponsors have recently developed a Business Case towards the virtual elimination of mother-to-child-transmissionof HIV (defined as less than 5% transmission of HIV from mother to child at a population level or 90% reduction of infections among young childrenby 2015, from a baseline of 2009). In order to spearhead action and facilitate progress in monitoring, three results, to be achieved by 2011, havebeen proposed; in 10 of the 22 countries with the greatest number of HIV-positive pregnant women:1. to achieve at least 80% coverage with effective antiretrovirals for preventing mother-to-child transmission,2. to provide antiretroviral coverage to at least 50% of HIV-positive pregnant women eligible for treatment for their own health .3. Reduce by 50% the current unmet need for family planning among all women.WHO, UNAIDS and UNICEF will organize a meeting in late 2010 with country representatives and <strong>int</strong>ernational partners to further define “elimination”targets and discuss how they can be measured and supported.84 TOWARDS UNIVERSAL ACCESS: Scaling up priority HIV/AIDS <strong>int</strong>erventions in the health sector
<strong>access</strong>with HIV-contaminated blood, injections with contaminatedneedles, and through early sexual debut and abuse.Effectively addressing mother-to-child transmission ofHIV requires a comprehensive approach that includes thefollowing four strategic components (8):• primary prevention of HIV infection among women ofchildbearing age;• preventing un<strong>int</strong>ended pregnancies among women livingwith HIV;• preventing HIV transmission from women living withHIV to their infants, and• providing appropriate treatment, care and support tomothers living with HIV and their children and families.This approach provides a continuum of <strong>int</strong>erventions andcare for women, children and their families which beginsbefore pregnancy, continues through pregnancy, labour,delivery and postpartum, and subsequently as part ofroutine or specialized chronic care services for the mother,child and family after the child is born. In scaling up theirnational programmes, countries must ensure that all fourcomponents of the comprehensive approach are deliveredto women and children in need.This chapter focuses on components 3 (preventing HIVtransmission from women living with HIV to their infants)and 4 (providing appropriate treatment, care and supportto mothers living with HIV and their children and families),where new data have been reported by countries whichallow for a comprehensive update of programmaticprogress between 2008 and 2009. Other programmaticcomponents are essential as well but routine reportingis complex: cross-country comparisons on component 1require data collected from household surveys, which areupdated only every few years; data on component 2 arecurrently still very limited. In this context, there is a needto place more emphasis on efforts to strengthen datacollection in these areas.Overall, 25 countries in sub-Saharan Africa and East, Southand South-East Asia accounted for 91% of the 1.4 millionpregnant women needing antiretrovirals to prevent verticaltransmission (Table 5.1). The same countries are alsohome to 91% of the children less than 15 years in need ofantiretroviral therapy.Box 5.2. Monitoring progress in preventing mother-to-child transmission and improving dataqualityProgrammes for preventing mother-to-child transmission are difficult to monitor at the national level for several reasons: (i) they comprise acascade of multiple <strong>int</strong>erventions; (ii) the <strong>int</strong>erventions often occur across various service delivery po<strong>int</strong>s (for instance, they can be delivered infacilities providing antenatal care, labour and delivery services, child health services or HIV care and treatment services); and (iii) mother and childfollow up is often poor, and records of <strong>int</strong>erventions and outcomes are not linked, resulting in a lack of information on longitudinal follow up afterpregnancy, including on final transmission and survival outcomes.In some countries, a considerable number of women deliver at home and many services are provided by the private sector. Mechanisms to collectand report data from these sources are not always available. Furthermore, the key <strong>int</strong>ervention – provision of antiretrovirals to a pregnant womanliving with HIV and to the exposed infant to reduce the risk of transmission to the baby – is recorded at health facilities based on whether thedrug was dispensed, and whether the drug was actually taken is often unknown. This may bias estimates of how the <strong>int</strong>ervention affects HIVtransmission from mother to child.Double counting across multiple service delivery po<strong>int</strong>s is also a common issue when countries compile national statistics related to preventingmother-to-child transmission of HIV. For example, in settings in which the same pregnant woman living with HIV may receive antiretrovirals inantenatal care, in a maternity ward during labour and delivery, or in HIV care sites, double counting may happen if data are aggregated across allservice delivery po<strong>int</strong>s. In addition, patient registers may be incomplete, and the lack of robust data systems may lead to inaccurate aggregation,recording and reporting from the facilities to the subnational and national levels. Some countries have been unable to report data on <strong>int</strong>erventionssuch as the number of pregnant women living with HIV receiving antiretroviral therapy for their own health, since they have not yet establisheddata collection mechanisms to capture this information. In other countries, HIV in pregnant women and children are rare events, and they are notcaptured properly in national surveillance systems. Countries are aware of these issues and are making efforts to improve their monitoring systems,and make necessary adjustments to the data reported for this report. This chapter attempts to summarize the available data.WHO, UNICEF and the monitoring and evaluation working group of the IATT on prevention of HIV infection among pregnant women, mothers andtheir children, have developed a comprehensive guide for monitoring and evaluating <strong>int</strong>erventions for prevention of mother-to-child transmission.Entitled Monitoring and evaluating the prevention of mother-to-child transmission of HIV: a guide for national programmes (9), this guide addresses theimplementation of national monitoring and evaluation systems, including the issue of double-counting, and recommends core national indicatorswhich are in line with WHO’s latest guidelines on antiretrovirals for the prevention of mother-to-child transmission in women and infants, andpaediatric antiretroviral therapy, described in Boxes 5.3 and 5.6 , respectively.PROGRESS REPORT 201085
towards <strong>universal</strong>Table 5.1. Twenty-five low- and middle-income countries with the highest estimated numbersof pregnant women living with HIV in need of antiretrovirals to prevent mother-to-childtransmission of HIV and the corresponding number of children in need of antiretroviraltherapy, 2009RankCountry1 South Africa2 Nigeria3 Mozambique4 Uganda5 United Republic of Tanzania6 Kenya7 Zambia8 Malawi9 Zimbabwe10 India11 Democratic Republic of the Congo12 Cameroon13 Ethiopia14 Côte d'Ivoire15 Chad16 Angola17 Burundi18 Sudan19 Lesotho20 Ghana21 Botswana22 Rwanda23 Swaziland24 Namibia25 Burkina FasoEstimated number of pregnantwomen in need of antiretroviralsin 2009 [range]210 000% of the total in low–and middleincomecountries a[120 000–290 000] 15.6210 000[110 000–300 000] 15.097 000[53 000–130 000] 7.188 000[48 000–130 000] 6.484 000[45 000–120 000] 6.181 000[41 000–120 000] 5.968 000[37 000–94 000] 5.057 000[31 000–83 000] 4.250 000[28 000–69 000] 3.643 000[23 000–65 000] 3.1… b[20 000–54 000] 2.634 000[18 000–50 000] 2.5… b[17 000–51 000] 2.420 000[10 000–31 000] 1.516 000[8 300–29 000] 1.216 000[8 400–25 000] 1.215 000[8 400–21 000] 1.114 000[7 300–22 000] 1.014 000[8 400–18 000] 1.013 000[6 900–20 000] 1.013 000[6 900–17 000] 0.911 000[5 400–16 000] 0.89 300[5 700–12 000] 0.77 700[4 100–11 000] 0.66 500[3 500–11 000] 0.5Estimated number of children inneed of antiretroviral therapy in2009 [range]160 000% of the total in low–and middleincomecountries a[92 000–210 000] 12.5180 000[94 000–270 000] 14.566 000[36 000–93 000] 5.276 000[41 000–110 000] 6.075 000[38 000–110 000] 5.989 000[48 000–130 000] 7.059 000[32 000–82 000] 4.761 000[34 000–84 000] 4.871 000[43 000–95 000] 5.6… b[30 000–76 000] 4.1… b[17 000–46 000] 2.428 000[15 000–41 000] 2.2... b[27 000–74 000] 3.929 000[14 000–42 000] 2.312 000[6 600–19 000] 1.012 000[6 300–18 000] 0.914 000[8 500–20 000] 1.18 700[4 400–13 000] 0.713 000[7 800–18 000] 1.113 000[6 700–20 000] 1.09 400[8 200–11 000] 0.711 000[7 000–17 000] 0.96 800[4 400–9 000] 0.59 200[7 300–13 000] 0.78 000[3 900–12 000] 0.6a Calculations are based on unrounded estimated numbers of pregnant women and children needing antiretroviral therapy.b No po<strong>int</strong> estimate is provided as the estimated number of pregnant women living with HIV in need of antiretrovirals and/or the estimated number of children livingwith HIV in need of antiretroviral therapy are currently being reviewed and will be adjusted, as appropriate, based on ongoing data collection and analysis.5.1. Preventing vertical transmission of HIVfrom mother to child5.1.1. HIV testing and counselling amongpregnant womenExpanding HIV testing and counselling among pregnantwomen is critical for identifying those in need of follow-upcare and increasing coverage of subsequent <strong>int</strong>erventionsto reduce the risk of mother-to-child transmission of HIV.In 2009, an estimated 26% of the estimated 125 millionpregnant women in low- and middle-income countriesreceived an HIV test, up from 21% in 2008, and 7% in2005.As in previous years, important regional differences wereobserved in 2009 with respect to the proportion of womenreceiving HIV testing and counselling. Coverage of HIVtesting and counselling among pregnant women remainedhighest in Europe and Central Asia, at 75%, followed byLatin America and the Caribbean at 57%, and sub-SaharanAfrica, at 35%.In East, South and South-East Asia, representing 55% ofthe estimated 125 million pregnant women in 2009, thecoverage of HIV testing and counselling among pregnantwomen was much lower (17%). It was close to zero in theMiddle East and North Africa.86 TOWARDS UNIVERSAL ACCESS: Scaling up priority HIV/AIDS <strong>int</strong>erventions in the health sector
<strong>access</strong>Fig. 5.1. Percentage of pregnant women <strong>who</strong> received an HIV test in low- and middle-incomecountries by region, 2005, 2008, 20091002005 2008 200990% of pregnant women receiving an HIV test807060504030201009%29%35%Sub-SaharanAfrica15%43%50%Eastern andSouthernAfrica3%21%16%Western andCentralAfrica29%57%54%Latin Americaand theCaribbean40%66%75%Europe andCentral Asia0% 0% 1%Middle Eastand NorthAfrica2%17%12%East, Southand South-East Asia7%26%21%Total lowandmiddleincomecountriesSteady progress was made within sub-Saharan Africa in2009. In Eastern and Southern Africa, the region with thehighest HIV prevalence, HIV testing and counselling amongpregnant women reached over 50%, an increase from 43%in 2008. In Western and Central Africa, coverage increasedfrom 16% to 21% between 2008 and 2009.In the 25 countries with the highest burden of HIV amongpregnant women, testing and counselling coverage variedsubstantially as well (Table 5.2). Seven countries providedHIV tests to less than one third of pregnant women:Nigeria (13%), the Democratic Republic of the Congo(9%), India (21%), Ethiopia (16%), Chad (6%), Angola(26%) and Sudan (3%). In these countries, considerablygreater investments are needed to increase HIV testingand counselling among pregnant women in order toeffectively prevent mother-to-child transmission of HIVand to enrol eligible women living with HIV in appropriatecare and treatment. Four countries reported providing HIVtesting and counselling to over 80% of pregnant womenin their countries: South Africa (>95%), Zambia (>95%),Botswana (93%) and Namibia (88%).Although the number of pregnant women receiving atleast one HIV test during pregnancy has increased insome settings, more attention must be given to re-testingpregnant women in late pregnancy to identify HIVnegativewomen <strong>who</strong> might have seroconverted, as wellas conducting HIV testing of their partners in generalizedepidemic settings.Table 5.2. Coverage of HIV testing andcounselling among pregnant women in thetop 25 high-burden countries ranked by theestimated number of pregnant women livingwith HIV, 2009 aRank Country 20091 South Africa >95%2 Nigeria 13%3 Mozambique 77%4 Uganda 64%5 United Republic of Tanzania 66%6 Kenya 63%7 Zambia >95%8 Malawi 52%9 Zimbabwe 46%10 India 21%11 Democratic Republic of the Congo 9%12 Cameroon 41%13 Ethiopia 16%14 Côte d'Ivoire 47%15 Chad 6%16 Angola 26%17 Burundi 40%18 Sudan 3%19 Lesotho 50%20 Ghana 51%21 Botswana 93%22 Rwanda 71%23 Swaziland 73%24 Namibia 88%25 Burkina Faso 42%aCountries with the highest estimated numbers of pregnant women living withHIV in need of antiretrovirals to prevent mother-to-child transmission of HIV.PROGRESS REPORT 201087
towards <strong>universal</strong>In settings with generalized epidemics, all pregnant womenshould be tested as early as possible in each pregnancy,with the health provider recommending testing as apart of routine antenatal care (provider-initiated testingand counselling). Because of the high incidence of HIVreported during the antenatal period (seroconversion duringpregnancy) in generalized epidemics, women <strong>who</strong> test HIVnegative in their first or second trimesters of pregnancyshould be re-tested in their third trimester of pregnancy. If awoman does not return for testing during her third trimester,she should be recommended to test at labour or, if that isnot possible, immediately after delivery (10).A number of countries with concentrated or low-levelepidemics, which are scaling up national preventionof mother-to-child transmission programmes, haveimplemented provider-initiated testing and counselling aswell as re-testing during pregnancy for all pregnant women.Decisions on whether to make provider-initiated testingand counselling a part of antenatal and delivery care (eithernationally or regionally) in low-level and concentratedepidemics must be based on an assessment of localresources, and the epidemiological and social contexts.Even if testing coverage is over 50% in about half of the25 countries with the largest number of pregnant womenliving with HIV, global testing coverage remains below 30%,partly because some large countries, including some withconcentrated or low-level epidemics, do not test all pregnantwomen for HIV. For example, the majority of countries <strong>int</strong>he East, South and South-East Asia region have low andconcentrated epidemics, with HIV infections occurringamong men <strong>who</strong> have sex with men, injecting drug users,sex workers and their clients. In these cases, HIV testingmay not necessarily be targeted at pregnant women. Manycountries in Asia have also opted to prioritize selected cities,regions and districts.The benefits of testing heterosexual couples have alsobeen highlighted by research, which showed rates ofserodiscordance of over 50% among women and theirpartners attending antenatal clinics (11). While this is onlyone example, testing couples together facilitates mutualdisclosure, can increase uptake of and adherence toantiretroviral <strong>int</strong>erventions for prevention of mother-tochildtransmission (12) and links to care, and can increasethe preventive benefits of testing.5.1.2. Antiretrovirals to prevent mother-tochildtransmission of HIVIn 2009, 53% [40–79%] of pregnant women living withHIV in low and middle-income countries (727 600 of1.4 million) received antiretrovirals to reduce the risk ofHIV transmission to their infants, including antiretroviraltherapy for their own health. This represents an increase incoverage of antiretrovirals for the prevention of mother-tochildtransmission from 45% [37–57%] in 2008 and 15%[12–18%] in 2005 (Figure 5.2).Fig. 5.2. Percentage of pregnant women living with HIV receiving antiretrovirals for preventingmother-to-child transmission of HIV in low- and middle-income countries by region, 2005,2008 and 2009% of pregnant women living with HIV receiving antiretroviral drugs forpreventing mother-to-child transmission100908070605040302010015%45%54%Sub-SaharanAfrica19%58%68%Eastern andSouthernAfrica4%16%23%Western andCentralAfrica43%54% 54%Latin Americaand theCaribbean52% 54% 53%Latin America59%52%22%Caribbean9%25%32%East, Southand South-East Asia2005 2008 200994% 93%58%53%45%15%0% 1% 3%Europe and North Africa Total low-Central Asia and the and middleincomeMiddle EastcountriesThe bar indicates the uncerta<strong>int</strong>y range around the estimate.88 TOWARDS UNIVERSAL ACCESS: Scaling up priority HIV/AIDS <strong>int</strong>erventions in the health sector
<strong>access</strong>Coverage was highest in Eastern Europe and CentralAsia, where nearly all pregnant women in need receivedantiretrovirals to prevent mother-to-child transmission(Table 5.3). Coverage remained lower in East, South andSouth-East Asia, and in North Africa and the Middle East,although progress was made in both regions, with coveragerates increasing, respectively, from 25% [17–40%] to 32%[22–52%], and from 1% [1–2%] to 3% [2–6%] between2008 and 2009 (Figure 5.2).In sub-Saharan Africa, coverage of antiretrovirals forpreventing mother-to-child transmission reached 54%[40–84%], from 45% [37–58%] in 2008. However, therewere considerable differences between subregions: whereas68% [53–>95%] of pregnant women in need receivedantiretrovirals for preventing mother-to-child transmissionin Eastern and Southern Africa, in West and Central Africathe comparable figure was 23% [16–44%].In Latin America and the Caribbean, coverage ofantiretrovirals for preventing mother-to-child transmissionstood at 54% [39–83%] in 2009, similar to the 54%[42–71%] estimated for 2008. Within the region, coveragealso varied considerably, with some countries reaching ratesclose to or above 80%, with little incremental increasesexpected, and others with lower and stagnant coverage ofantiretrovirals for preventing mother-to-child transmission.With growing political support for prevention of mother-tochildtransmission, an important push is now being madeto virtually eliminate mother-to-child transmission in theregion by 2015. Specific, time-bound plans are currentlybeing developed and reviewed by countries to support thisgoal, as well as the goal of elimination of congenital syphilis.Figure 5.3 shows the 25 countries estimated to have thelargest numbers of women needing antiretrovirals toreduce mother-to-child transmission and the estimatedBox 5.3. 2010 WHO guidelines on antiretrovirals to treat HIV in pregnant women and preventHIV infection in infants (1)The revised 2010 WHO guidelines for prevention of mother-to-child transmission of HIV are based on two key approaches: (i) lifelong antiretroviraltherapy for those pregnant women in need of treatment for their own health, which is also safe and highly effective in reducing mother-tochildtransmission; and (ii) new options for antiretroviral prophylaxis to prevent mother-to-child transmission during pregnancy, delivery andbreastfeeding for those <strong>who</strong> do not require treatment. A major change is that prophylaxis is now recommended during breastfeeding, in settingswhere breastfeeding is judged to be the safest infant-feeding option (see Box 5.4).HIV-positive pregnant women should undergo immunological (CD4 testing) and clinical assessment to determine eligibility for antiretroviral therapy.As with all HIV-infected adults, initiation of antiretroviral therapy is now recommended for all HIV-infected pregnant women with CD4 counts ator below 350 cells/mm 3 , irrespective of WHO clinical staging, and in all pregnant women in WHO clinical stage 3 or 4, irrespective of CD4 cellcount. Early treatment, beginning during pregnancy, will help improve the mother’s health and provide optimal prevention of transmission duringthe perinatal period and while breastfeeding.For pregnant women living with HIV <strong>who</strong> do not need antiretroviral therapy for their own health, WHO recommends two equally efficacious optionsto reduce transmission during the perinatal period and while breastfeeding. The two options have different advantages and disadvantages; thepreferred option should be decided at country level after considering local capacity as well as feasibility and implementation issues. Each of the twoprophylaxis options includes a maternal regimen beginning as early as 14 weeks of pregnancy, and continued during the antenatal and <strong>int</strong>rapartumperiods. After delivery, the mother or infant will continue taking drugs for a variable amount of time depending on whether the country choosesoption A or B, and whether the mother is breastfeeding or not.For option A, zidovudine, starting from as early as 14 weeks of pregnancy, is given to the mother during the antenatal period. A single dose ofnevirapine and lamivudine is added during labour, and zidovudine and lamivudine are continued for 7 days after delivery as a “tail” to decreasethe risk of nevirapine resistance. If the infant is breastfed, the baby will receive nevirapine syrup from birth until one week after all exposure tobreast milk has ended. If the baby is on replacement feeding, it will only get either nevirapine or zidovudine from birth until 4–6 weeks of age.For option B, a prophylaxis regimen consisting of three antiretrovirals is provided to the mother during pregnancy, labour and after delivery untilone week after all exposure to breast milk has ended. Infants born to mothers on option B will receive either nevirapine or zidovudine from birthuntil 4–6 weeks of age, regardless of their feeding method. WHO recommends four possible triple prophylaxis regimens for option B, with thechoice of regimen to be made at country level.These revised recommendations emphasize the need to have a unified approach to preventing mother-to-child transmission throughout pregnancy,labour and delivery, postpartum and during the breastfeeding period, if breastfeeding is chosen as the safest infant-feeding option in resource-limitedsettings. Successful implementation will require <strong>int</strong>egration and coordination with HIV care and antiretroviral therapy programmes, <strong>int</strong>egrationof <strong>int</strong>erventions for prevention of mother-to-child transmission as a basic part of maternal and child health care, and strengthened postpartumfollow up of both mothers and infants. Currently, one of the main barriers to implementing this strategy is the proper identification of women inneed of lifelong antiretroviral therapy (<strong>access</strong> to CD4 testing).PROGRESS REPORT 201089
towards <strong>universal</strong>Table 5.3. Estimated number of women living with HIV needing and receiving antiretroviralsfor PMTCT in low- and middle-income countries, 2009 aGeographical regionNumber of pregnant women living with HIVreceiving antiretrovirals for PMTCTEstimated number of pregnant women living withHIV in need of antiretrovirals for PMTCTEstimated coverage bSub-Saharan Africa 672 800 1 240 000 [800 000-1 700 000] 54% [40%-84%]Eastern and Southern Africa 584 700 860 000 [ 600 000-1 100 000] 68% [53%->95%]Western and Central Africa 88 100 380 000 [ 200 000- 560 000] 23% [16%-44%]Latin America and the Caribbean 16 200 29 900 [ 19 000-41 000] 54% [39%-83%]Latin America 11 800 22 400 [ 15 000-32 000] 53% [37%-81%]Caribbean 4 400 7 400 [ 3 900-11 000] 59% [39%->95%]East, South and South-East Asia 23 800 73 800 [ 46 000-110 000] 32% [22%-52%]Europe and Central Asia 14 300 15 300 [ 7 900-23 000] 93% [63%->95%]North Africa and the Middle East 500 15 700 [ 8 300-24 000] 3% [2%-6%]All low and middle income 727 600 1 380 000 [920 000-1 800 000] 53% [40%-79%]Note: some numbers do not add up to rounding.a Annex 5 provides country-specific data.b The coverage estimate is based on the unrounded estimates of pregnant women receiving and needing antiretrovirals for preventing mother-to-child transmission.Fig. 5.3. Percentage of pregnant women living with HIV receiving antiretrovirals to preventmother-to-child transmission of HIV in 25 countries with the highest HIV disease burdenamong pregnant women, in descending order, 2009United Nations General Assembly Special Session on HIV/AIDS target for 2010250 00010090200 00080Number150 000100 00050 0000South AfricaNigeriaMozambiqueUgandaUnited Republic of TanzaniaKenyaZambiaMalawiZimbabweIndiaDemocratic Republic of the CongoThe bar indicates the uncerta<strong>int</strong>y range around the estimate.No po<strong>int</strong> estimate is available for the number of pregnant womenliving with HIV needing antiretrovirals for the Democratic Republicof the Congo and Ethiopia. These estimates are currently beingreviewed and will be adjusted, as appropriate, based on ongoingdata collection and analysis.CameroonEthiopiaCôte d’IvoireChadAngolaBurundiSudanLesothoGhanaBotswanaRwandaSwazilandNamibiaBurkina FasoEstimated number of pregnant women living with HIV% of pregnant women living with HIV receivingantiretrovirals to reduce the risk of mother-to-childtransmission of HIV706050403020100Percentage90 TOWARDS UNIVERSAL ACCESS: Scaling up priority HIV/AIDS <strong>int</strong>erventions in the health sector
<strong>access</strong>coverage with antiretrovirals for preventing mother-to-childtransmission in 2009.In 11 of the 25 countries, less than 50% of pregnant women inneed received any antiretroviral <strong>int</strong>ervention to prevent HIVtransmission from mother to child. However, four countries– Botswana, Namibia, Swaziland and South Africa (thecountry with the largest number of pregnant women livingwith HIV) – have already reached the target set at the UnitedNations General Assembly Special Session (UNGASS) onHIV/AIDS of providing 80% of pregnant women in needwith antiretrovirals for reducing the risk of mother-to-childtransmission of HIV. In addition, 11 other low- and middleincomecountries (Argentina, Belarus, Brazil, Ecuador,Guyana, Jamaica, Malaysia, Romania, Russian Federation,Thailand and Ukraine) 1 have also reached the 80% coveragetarget of antiretrovirals for prevention of mother-to-childtransmission (see Annex 5 for more country details).These 25 countries with higher needs also collectivelycontributed to about 94% of the global gap in reaching theUNGASS target of 80% coverage with antiretrovirals toreduce mother-to-child transmission. The global gap is thedifference between the current number of pregnant womenin need <strong>who</strong> have <strong>access</strong> to antiretrovirals for preventingmother-to-child transmission and the estimated number<strong>who</strong> must be reached to achieve the UNGASS goal. Figure5.4 shows the percentage distribution of the contributionof each country to closing this global gap. Four countries –Nigeria, Democratic Republic of Congo, Ethiopia and India– account for half of the gap (50%), with Nigeria aloneaccounting for almost one third (32%).1 Countries with at least 100 pregnant women in need of antiretroviral drugs forpreventing mother-to-child-transmission.Fig. 5.4. Contribution of the 25 countries with the largest number of women needingantiretrovirals for preventing mother-to-child transmission of HIV to the global gap inreaching 80% of those in need, 2009Countries (among the 25)estimated to contributeeach less than 2% to theglobal gap a (10%)Other low- and middle- incomecountries (6%)United Republic ofTanzania (2%)Nigeria (32%)Mozambique (3%)Angola (3%)Burundi (3%)Sudan (3%)Zimbabwe (3%)Chad (3%)Democratic Republicof the Congo (7%)Malawi (3%)Uganda (6%)a These countries include Botswana,Burkina Faso, Côte d’Ivoire, Ghana,Kenya, Lesotho, Namibia, Rwanda,South Africa, Swaziland and Zambia.Cameroon (5%)Ethiopia (5%)India (6%)PROGRESS REPORT 201091
towards <strong>universal</strong>Assessing the eligibility of pregnant women livingwith HIV to receive antiretroviral therapy for theirown healthWhen a pregnant woman is identified as living with HIV,the clinical stage of her disease and, where available, herCD4 cell count should be assessed to determine whethershe is eligible to receive antiretroviral therapy for her ownhealth or should only receive antiretroviral prophylaxis toprevent mother-to-child transmission (Box 5.3). In 2009, anestimated 51% of pregnant women <strong>who</strong> tested positive forHIV were assessed for their eligibility to receive antiretroviraltherapy either though clinical staging or CD4 cell count, upfrom 34% in 2008. About 37% were assessed through CD4count, up from 24% reported in 2008. In the 49 countriesreporting data in both 2008 and 2009, the proportion ofpregnant women identified with HIV assessed for ARTeligibility by CD4 cell count increased from 14% to 31%.Antiretroviral regimensThe efficacy of antiretrovirals in preventing mother-tochildtransmission of HIV varies with the type of drugcombination used and the duration of the regimen. It isrecommended that pregnant women living with HIV andtheir exposed infants receive more efficacious regimensas opposed to single-dose nevirapine, and that all womenneeding antiretroviral therapy for their own health shouldreceive it.Fig. 5.5. Percentage distribution of variousantiretroviral regimens provided to pregnantwomen in low- and middle-income countriesin 2007 (59 countries) and 2009 (86 countries)20092007030% 54% 15%Single dose nevirapineAntiretroviral therapy49% 33% 9% 9%20 40 60 80Combination regimenUncategorizedWith the new 2010 guidelines, antiretroviral prophylaxisis now recommended during breastfeeding (Box 5.4) insettings where breastfeeding is judged to be the safestinfant-feeding option. In these countries, special effortsare needed to monitor antiretroviral coverage during thebreastfeeding period.Analysing the global distribution of various antiretroviralregimens used for preventing mother-to-child transmission1001%Box 5.4. Infant-feeding in the context of HIV (15)The 2010 WHO revised guidelines on HIV and infant-feeding build on the updated recommendations on antiretroviral therapy for HIV infectionin adults, adolescents and children, and the use of antiretrovirals for treating pregnant women and preventing HIV infection in infants. While theguidelines reinforce the principles and recommendations established in earlier versions such as feeding of infants already known to be HIV-infectedand protecting and promoting optimal infant-feeding practices in the general population, two major revisions were adopted.National health authorities should decide whether health services will principally counsel and support mothers known to be HIV-infected to either(i) breastfeed and receive antiretroviral <strong>int</strong>erventions or (ii) avoid all breastfeeding. The choice between these strategies should be governed bywhich is most likely to result in HIV-free survival of HIV-exposed infants attending public health facilities. National authorities should make theirdecision based on national epidemiological trends, the state of coverage of prevention of mother-to-child transmission and antiretroviral therapyservices, and the main causes of maternal and child undernutrition and mortality. This is a marked change from other approaches whereby healthworkers are expected to counsel HIV-infected pregnant women and mothers, and to individually determine which infant-feeding practice wouldbe most appropriate for their particular circumstance. The strength of the evidence that antiretroviral <strong>int</strong>erventions significantly reduce the riskof HIV transmission through breast milk and thereby improve the chance of HIV-exposed infants surviving while remaining HIV-uninfected haschanged the way in which public health policy and approaches can be considered.In addition, in settings where national authorities decide to promote breastfeeding while providing antiretroviral <strong>int</strong>erventions, WHO stronglyrecommends that mothers known to be HIV-infected should exclusively breastfeed their infants for the first six months and continue to breastfeedup to 12 months while <strong>int</strong>roducing complementary foods when the infant is six months old. Breastfeeding should then stop only when a nutritionallyadequate and safe diet without breast milk can be provided. This approach enables infants of mothers living with HIV to benefit from the protectionthat breastfeeding offers against the serious morbidity and mortality normally associated with the use of commercial formula milk in unsafe settings,in spite of their low risk for HIV transmission. It also enables public health systems to better plan and provide services, since recommendationswill be similar at the national level.Many countries, especially those in Eastern and Southern Africa, have already decided to recommend breastfeeding of infants to HIV-infectedmothers and to provide an antiretroviral <strong>int</strong>ervention to prevent HIV transmission. International partners have been working with national teamsto consider how these decisions should be implemented at the district health facility level and to project costs for future budgets.92 TOWARDS UNIVERSAL ACCESS: Scaling up priority HIV/AIDS <strong>int</strong>erventions in the health sector
<strong>access</strong>remains difficult as many countries still do not possess fullyfunctional national monitoring mechanisms to accuratelyreport drug regimens used by HIV-positive pregnant women.In 2009, 86 out of 120 (72%) countries reporting on thenumber of pregnant women living with HIV <strong>who</strong> receivedantiretrovirals to prevent mother-to-child transmission wereable to provide disaggregated data on the distribution ofantiretroviral regimens given to pregnant women. Thesecountries covered around 70% of the total number of womenreceiving antiretrovirals to reduce the risk of mother-to-childtransmission in 2009.In 2007, 59 countries reported disaggregated data onantiretroviral regimens provided to HIV-positive pregnantwomen. In 2008, the number of countries reportingdisaggregated regimen categories was 96, but one third ofantiretroviral regimens provided to women living with HIVwere reported as uncategorized. In 2009, the proportionof uncategorized regimens decreased substantially. Thus,comparisons focus on 2007 and 2009 data, years in whichthe proportion of uncategorized regimens was lowest.The proportion of women receiving more efficaciousregimens and antiretroviral therapy for their own healthincreased between 2007 and 2009 (Figure 5.5). In thisperiod, the percentage of women receiving single-dosenevirapine decreased from 49% to 30%, whereas thepercentage of women receiving more efficacious regimensincreased from 33% to 54%, and the proportion of womenreceiving antiretroviral therapy for their own health increasedfrom 9% to 15%.Currently there is no global estimate of the proportionof HIV-positive pregnant women needing antiretroviraltherapy for their own health; however a recent analysis ofaround 6000 women attending clinics in 9 countries(13)found 48% of women eligible for ART based on new WHOguidelines, and other studies have reported around 40%(14) and even 68% (16) of women as eligible, suggestingthat the majority of women in need are not <strong>access</strong>ingantiretroviral therapy.5.1.3. Antiretroviral prophylaxis for infants bornto mothers living with HIVThe 2010 WHO guidelines recommend that all infants born toHIV-positive mothers should receive antiretroviral prophylaxis(1). Coverage slightly increased between 2008 and 2009,from 32% [26–40%] to 35% [26–53%] of the estimated1.4 million infants born to mothers living with HIV. However, thegap between the uptake of infant and maternal antiretroviralregimens seems to have widened further (Figure 5.6).Coverage rates varied widely between regions but remainedrelatively steady in 2009 (Figure 5.7). About a third of infantsin sub-Saharan Africa were reached with antiretroviralprophylaxis (31% [26–40%] in 2008 and 35% [26–54%]in 2009). In Eastern and Southern Africa, 45% [35–64%]of infants received antiretroviral prophylaxis in 2009, whilein West and Central Africa, only 12% [8–23%] did. In LatinAmerica, almost half of children (48% [35–74%]) weregiven antiretroviral prophylaxis. In East, South, and South-East Asia, the region with the highest increase in coverage,it increased from 25% [17–40%] in 2008 to 32% [22–51%]in 2009.Fig. 5.6. Percentage of pregnant women living with HIV and infants born to them <strong>who</strong>received antiretrovirals for preventing mother-to-child transmission, 2004–2009% receiving antiretrovirals for preventingmother-to-child transmission605040302010010%6%Pregnant women living with HIV receiving antiretrovirals forpreventing mother-to-child transmission15%12%24%18%2004 2005 2006Infants born to pregnant women living with HIV receivingantiretrovirals for preventing mother-to-child transmission35%20%200745%32%200853%35%2009PROGRESS REPORT 201093
towards <strong>universal</strong>Fig. 5.7. Percentage of infants born to pregnant women living with HIV <strong>who</strong> receivedantiretroviral prophylaxis for preventing mother-to-child transmission, 2005, 2008 and 20092005 2008 2009% of infants receiving antiretrovirals born to pregnant womenliving with HIV100908070605040302010011%35%31%Sub-SaharanAfrica15%45%40%Eastern andSouthernAfrica3%10% 12%Western andCentralAfrica39%48%49%Latin Americaand theCaribbean61%95%91%Europe andCentral Asia7%25%32%East, Southand South-East Asia12%35%32%Total lowandmiddleincomecountriesThe bar indicates the uncerta<strong>int</strong>y range around the estimate.5.2. Treatment, care and support for womenliving with HIV and their childrenIf a mother and her infant receive appropriate <strong>int</strong>erventionsfor preventing mother-to-child transmission of HIV,including more efficacious antiretroviral regimens, children,even when carrying the virus, can live <strong>int</strong>o adulthood ifthey can <strong>access</strong> treatment early (17). Although HIV careand treatment services for HIV-exposed and -infectedchildren are rapidly expanding in resource-limited settings,they are still inadequate and relatively fewer treatmentservices are available than those for adults. Of the 1 270 000[830 000–1 700 000] children estimated to be in need ofantiretroviral therapy, only 28% [21–43%] had <strong>access</strong> totreatment, versus 37% of adults [35–41%] (see Chapter 4for more details).5.2.1. Infant diagnosisEarly diagnosis of HIV infection is critical to ensure optimaltreatment outcomes among children. If properly diagnosedand then provided with treatment early, HIV-infected infantsand children can survive to adolescence and adulthood.While progress has been made in identifying infants <strong>who</strong>become HIV-infected through mother-to-child transmission,many children living with HIV still go undiagnosed. Withoutdiagnosis and effective treatment, one third of HIV-positiveinfants will die before the age of one year and almost half bytheir second year of life.WHO’s revised treatment guidelines recommend thatinfants, if HIV-exposed, should be tested by four to six weeksof age using virological assays and those found positiveshould be started on antiretroviral therapy immediatelyupon diagnosis (22).Access to early infant diagnosis is very limited. In 2009, 6%[5–10%] of infants were reported to have been tested forHIV within the first two months of birth in low- and middleincomecountries. However, the data may underestimatethis coverage as only 54 countries reported data on thisindicator in 2009, up from 41 in 2008. In those 54 countries,representing 43% of the total number of pregnant womenliving with HIV, around 85 800 infants, or 15% [10–28%] ofthe estimated number of infants born to pregnant womenliving with HIV were reported to have received early infantHIV testing.Greater efforts are needed to scale up early testing of HIVexposedinfants. Priority actions should include buildingtechnical competencies, developing laboratory capacity, andstrengthening systems for transporting blood specimensand results, as well as scaling up routine offers of testing94 TOWARDS UNIVERSAL ACCESS: Scaling up priority HIV/AIDS <strong>int</strong>erventions in the health sector
<strong>access</strong>Box 5.5. Integrating HIV prevention, care and treatment <strong>int</strong>erventions within maternal and childhealth servicesMaternal and child health services, in addition to sexual and reproductive health programmes, provide critical platforms and infrastructure foreffective and sustainable delivery of HIV <strong>int</strong>erventions. The WHO IMAI/IMPAC (Integrated Management of Adult and Adolescent Illness/Integratedmanagement of Pregnancy and Childbirth) clinical course for <strong>int</strong>egrated prevention of mother-to-child transmission services guides health workersto <strong>int</strong>egrate HIV prevention, care and treatment <strong>int</strong>o maternal and child health services. In 2009, <strong>int</strong>ernational trainings were organized for healthworkers from more than 30 countries.A number of countries have decentralized HIV prevention, care and treatment to primary health centres (18,19). South Africa, for example, iscurrently decentralizing HIV prevention, care and antiretroviral therapy services to primary health centres, with nurses initiating and managingantiretroviral therapy, with a mentoring and referral back-up from the district hospital team.Zambia is also moving towards decentralized and <strong>int</strong>egrated service delivery. In order to improve service uptake, the prevention of mother-to-childtransmission partnership of Zambia employed multiple strategies, including <strong>int</strong>egration of services for prevention of mother-to-child transmission<strong>int</strong>o outreach sites and maternal and child health public facilities. Other strategies include task-shifting to involve lay providers and people livingwith HIV in service delivery, training health workers to provide comprehensive prevention of mother-to-child transmission services, improvingreferral for CD4 counts, and promoting partner involvement (20). The <strong>int</strong>egration of antiretroviral therapy <strong>int</strong>o existing public sector maternal andchild health clinics in Lusaka district doubled the proportion of eligible women initiating antiretroviral therapy (21).in generalized epidemics to more sites where mothers andchildren <strong>access</strong> care, and improving cross-service referrals.In addition, it is critical to reduce the rate of loss to followup among HIV-exposed infants in the postnatal period, asmany infants, even when tested, still do not receive theirresults or are ever enrolled on antiretroviral therapy whenthey test positive. Substantial investments must be made inhealth clinics and communities to improve data collectionand service delivery along the continuum of care so thatchildren <strong>who</strong> test positive are enrolled on treatment in atimely fashion. There is also a need to better understand andaddress the challenges faced by mothers to continue seekinghealth services for their infants, as well as for themselves.5.2.2. Co-trimoxazole prophylaxis in HIVexposedchildrenAn essential component of the care and treatment packagefor children living with HIV is the provision of co-trimoxazoleprophylaxis, a highly efficacious, affordable, cost-effectiveand widely available antibiotic that has been shown tosignificantly reduce morbidity and mortality among infantsand children <strong>who</strong> are living with or exposed to HIV. Theuse of co-trimoxazole prophylaxis increases the chances ofsurvival of HIV-infected infants until antiretroviral therapycan be initiated. This is especially important in resourceconstrainedsettings where there is limited <strong>access</strong> to effectiveservices for prevention of mother-to-child transmission andantiretroviral therapy. WHO guidelines released in 2006recommend that all HIV-exposed children born to HIVpositivemothers start co-trimoxazole prophylaxis betweenfour and six weeks of age and continue until HIV infectionhas been excluded and the infant is no longer at risk ofacquiring HIV through breastfeeding (23).In 2009, 72 countries provided information on the numberof infants born to pregnant women with HIV initiated onco-trimoxazole prophylaxis by two months of age, up from67 countries in 2008. Even though several countries havedeveloped and put in place policies to support <strong>access</strong> toco-trimoxazole prophylaxis for infants and children, only14% [10–20%] of infants in need received co-trimoxazolein 2009, compared with 8% [6–10%] in 2008. Coveragein sub-Saharan Africa continued to expand, particularly inEastern and Southern Africa, the subregion most affectedby HIV, where coverage doubled from 9% [7-11%] in 2008to 18% [14-26%] in 2009.Forty-three countries reported data on co-trimoxazolecoverage in both 2008 and 2009. In these countries, whichaccounted for about 50% of all HIV-positive pregnantwomen needing antiretrovirals in low- and middle-incomecountries, the reported proportion of infants receiving cotrimoxazolewithin two months of birth increased slightly to18% in 2009 from 15% in 2008.Expanding <strong>access</strong> to co-trimoxazole prophylaxis requires aset of <strong>int</strong>errelated <strong>int</strong>erventions, including the developmentof stronger linkages between HIV testing and treatment, andthe establishment of mechanisms to identify and follow upHIV-exposed infants at and after birth. In addition, healthworkers must be trained to consider HIV infection in infantsat birth and at all clinic or health encounters, and deliverymust be decentralized to the lowest appropriate, feasibleand effective level of the health-care system. A consistentsupply of co-trimoxazole must be available for infants, andmonitoring and evaluation systems need to be strengthenedto support the provision of co-trimoxazole prophylaxis toHIV-exposed or HIV-infected children (23) .PROGRESS REPORT 201095
towards <strong>universal</strong>5.2.3. Antiretroviral therapy for childrenWhile the best strategy for preventing paediatric HIV-relatedmortality is the expansion of effective programmes forprevention of mother-to-child transmission to prevent newinfant infections, many HIV-related deaths among infectedchildren could be avoided through early HIV diagnosisand timely provision of effective care and treatment. Inorder to maximize the survival and well-being of childrenliving with HIV, in 2010 WHO released updated treatmentguidelines (24), markedly altering the recommended set ofcriteria for initiation of antiretroviral therapy in children(Box 5.6).As of December 2009, data reported by countries showthat almost 356 400 children were receiving antiretroviraltherapy in low- and middle-income countries, up from275 300 in 2008 and 75 000 in 2005, an increase ofalmost 30% in the past year. These children represent anestimated 28% [21–43%] of all children less than 15 yearsestimated to be in need of antiretroviral therapy in low- andmiddle-income countries, up from 22% [16–34%] in 2008and 7% [5–11%] in 2005, using the new treatment criteriaretrospectively.Between 2008 and 2009, all regions experienced increasesin the number of children in need of antiretroviral therapyand receiving it. Regional coverage varied, ranging from6% [4–11%] in the Middle East and North Africa to 68%[52-87%] in Latin America (Figure 5.8).In sub-Saharan Africa, the region with the highest burdenof children in need, 296 000 (26% [19–42%]) of childrenwere receiving antiretroviral therapy as of December 2009,up from 224 100 (20% [15–32%]) in 2008. Eastern andSouthern Africa had the highest number of children receivingantiretroviral therapy at 254 900 (32% [25–48%]), up from194 600 (25% [19–37%]) in 2008. In Swaziland, Namibiaand Botswana, coverage among children was 70% orhigher. In West and Central Africa, 41 000 (12% [8–22%])children were on antiretroviral therapy, up from 29 500(8% [6–16%]) in 2008. Only Benin and Gambia reachedover 40% of children in need with antiretroviral therapy.Latin America and the Caribbean reported 18 600(58% [45–80%]) children on antiretroviral therapy in 2009,up from 17 300 (54% [42–76%]) in 2008. Differences wereobserved between the Latin America and the Caribbeansubregions. In Latin America, the reported number of children<strong>access</strong>ing antiretroviral therapy was 16 300 (68% [52–87%]),up from 15 400 (65% [50–84%]) in 2008. In the Caribbean,coverage increased, from 2000 (24% [16–48%]) in 2008 to2400 (29% [19–57%]) in 2009.East, South and South-East Asia reported 36 500(44% [27–59%]) children on antiretroviral therapy in2009, up from 29 300 (37% [21–50%]) in 2008. Thailand,Cambodia and Malaysia reached coverage rates of 80%or more.Between 2008 and 2009, modest improvements wereachieved in 25 high-burden countries accounting for 91% ofchildren in need of antiretroviral therapy (Figure 5.9). Thelowest coverage was found in Sudan at 2.2%, up from 1.8%in 2008, while the highest coverage was seen in Botswana at90%, up from 78% a year earlier. The largest increases wereobserved in Cote d’Ivoire, Ghana, Zimbabwe and Angola,where the number of children receiving antiretroviral therapyrose by over 60% between 2008 and 2009.Box 5.6. 2010 WHO revised paediatric antiretroviral therapy guidelinesIn July 2010, WHO released new paediatric antiretroviral therapy guidelines, which are now harmonized with the treatment guidelines adopted foradults, pregnant women, and prevention of mother-to-child transmission. The major changes <strong>int</strong>roduced in this version relate to the recommendedcriteria for treatment initiation. Now, it is recommended that all HIV-positive children less than 24 months of age be started on antiretroviral therapy.Overall recommendations on when to start antiretroviral therapy in infants and children are as follows:1. for all HIV-infected infants diagnosed in the first year of life, irrespective of CD4 count or WHO clinical stage;2. for all HIV-infected children less than two years of age irrespective of CD4 count or WHO clinical stage;3. for all HIV-infected children between 24 and 59 months of age with a CD4 count of ≤750 cells/mm 3 or %CD4+ ≤25%, whichever is lower,irrespective of WHO clinical stage;4. for all HIV-infected children more than 5 years of age with a CD4 count of ≤350 cells/mm 3 (as in adults), irrespective of WHO clinical stage;5. for all HIV-infected children in WHO HIV clinical stages 3 and 4, irrespective of CD4 count;6. for any child less than 18 months of age <strong>who</strong> has been given a presumptive clinical diagnosis of HIV infection.In addition to new criteria for treatment initiation, the updated treatment guidelines include recommendations and guidance on (i) earlier, moreaccurate diagnosis of HIV, (ii) simplified antiretroviral drug regimens for use in first-line and second-line therapy, (iii) expected signs and symptomsin the first six months of therapy, (iv) promoting attention to nutrition for children on antiretroviral therapy, (v) more strategic monitoring for theefficacy and toxicity of antiretrovirals, and (vi) strengthening adherence. The new guidelines are part of WHO’s commitment to achieve <strong>universal</strong><strong>access</strong> to the prevention, care and treatment of HIV infection in infants and children.96 TOWARDS UNIVERSAL ACCESS: Scaling up priority HIV/AIDS <strong>int</strong>erventions in the health sector
<strong>access</strong>Table 5.4. Estimated number of children living with HIV younger than 15 years receivingantiretroviral therapy, children needing antiretroviral therapy and percentage coverage inlow- and middle-income countries according to region, December 2009 aGeographical regionReported number of children (0–14 years)living with HIV receiving antiretroviral therapy,December 2009Estimated number of children living with HIVneeding antiretroviral therapy, 2009 [range] aAntiretroviral therapy coverage among childrenliving with HIV, December 2009 [range] bSub-Saharan Africa 296 000 1 140 000 [710 000–1 500 000] 26% [19–42%]Eastern and Southern Africa 254 900 790 000 [530 000–1 000 000] 32% [25–48%]Western and Central Africa 41 000 350 000 [180 000– 510 000] 12% [8–22%]Latin America and the Caribbean 18 600 32 200 [23 000–42 000] 58% [45–80%]Latin America 16 300 24 100 [19 000–31 000] 68% [52–87%]Caribbean 2 400 8 100 [4 100–12 000] 29% [19–57%]East, South and South-East Asia 36 500 83 400 [61 000–140 000] 44% [27–59%]Europe and Central Asia 4 800 9 700 [5 700–15 000] 49% [31–58%]North Africa and the Middle East 560 10 000 [5 200–15 000] 6% [4–11%]All low and middle income 356 400 1 270 000 [830 000–1 700 000] 28% [21–43%]Note: some numbers do not add up to rounding.a For an explanation of the methods used, see the explanatory notes to Annex 4.b The coverage estimate is based on the estimated unrounded number of children receiving and needing antiretroviral therapy.Fig. 5.8. Percentage of children living with HIV receiving antiretroviral therapy in low- andmiddle-income countries, 2005, 2008 and 20091002005 2008 2009% of children younger than 15 years living with HIV receivingantiretroviral therapy90807060504030201006%20%26%Sub-SaharanAfrica8%25%32%Eastern andSouthernAfrica1%12%8%Western andCentralAfrica40%58%54%Latin Americaand theCaribbean53%68%65%Latin America29%24%5%Caribbean13%37%44%East, Southand South-East Asia16%49%46%Europe andCentral Asia0%North Africaand theMiddle East28%22%7%Total lowandmiddleincomecountries5% 6% 97The bar indicates the uncerta<strong>int</strong>y range around the estimate.Note: Data have been retroactively revised according to the revised methodology (see Box 5.7).PROGRESS REPORT 2010
towards <strong>universal</strong>Fig. 5.9. Percentage of children living with HIV receiving antiretroviral therapy in 25 highburdencountries, 2008–2009 a 20092008BotswanaNamibiaThailand78%85%86%90%89%90%Rwanda54%60%South Africa38%54%Zambia31%36%Kenya23%32%ZimbabweMalawiLesothoUgandaUnited Republic of Tanzania18%18%18%17%17%20%23%23%30%29%Burkina Faso12%17%Côte d’IvoireMozambique9%15%14%15%AngolaGhana6%8%13%12%BurundiCameroonNigeriaChadSudan2%2%6%4%11%9%11%9%10%7%0 20 40 60 80100Note: Data have been retroactively revised according to the revised methodology (see Box 5.6).a The Democratic Republic of the Congo, Ethiopia and India, belong to the list of 25 countries with the highest needfor antiretroviral therapy among children living with HIV, but no coverage can be provided at this stage as their needestimates are currently being reviewed.98 TOWARDS UNIVERSAL ACCESS: Scaling up priority HIV/AIDS <strong>int</strong>erventions in the health sector
<strong>access</strong>Box 5.7. Improving need and coverage estimates of antiretroviral therapy among childrenThe estimated proportion of children (ages 0–14 years) <strong>who</strong> received antiretroviral therapy in 2009 is 28%, lower than the estimated 2008 coverage(38%) published previously. This change in estimated coverage is not related to a decrease in the number of children in need of antiretroviraltherapy receiving treatment, which actually increased, but is due to changes both in the estimation methodology and in the criteria for treatmenteligibility that resulted in a substantial increase in the estimated number of children in need of antiretroviral therapy.The definition of paediatric antiretroviral therapy coverage is the number of children on antiretroviral therapy collected from patient monitoringsystems divided by the number of children estimated to be in need of treatment calculated using Spectrum. Spectrum is a computer package whichestimates the impact of the HIV epidemic. Based on national HIV prevalence and incidence data, as well as the demographic characteristics of acountry, Spectrum can estimate the number of children in need of antiretroviral therapy, among other variables. In December 2009, the UNAIDSReference Group on HIV Estimates, Modelling and Projections convened a meeting to update and review the assumptions used in Spectrum toestimate the number of children living with HIV and the number of children in need of antiretroviral therapy (25).Upon a review of the literature and available evidence, three key changes were made to the assumptions used in Spectrum to estimate paediatricneeds:1. More accurate survival curves: recent research revised the survival parameters using data from 12 sub-Saharan Africa sites, which included informationon the timing of infection (26). Timing of infection is important because children infected during pregnancy and birth have considerably shortersurvival times than children infected during breastfeeding (27). Based on these observations, two new survival curves were estimated, replicatingthe expected survival of children infected perinatally and those infected through breastfeeding. These revised survival curves po<strong>int</strong> to a longer lifeexpectancy than those previously in use, thereby increasing the number of children living with HIV in need of treatment.2. Improvements in determining progression from infection to treatment need: parameters used in Spectrum related to disease progression patterns amonginfants were originally derived from the HIV Paediatric Prognostic Markers Collaborative Study (HPPMCS), which took place predominantly inhigh-income countries before antiretroviral therapy was available. New, improved information on disease progression marginally increased theestimated number of children in need of antiretroviral therapy (28).3. Revised WHO treatment guidelines for infants and children (Box 5.6). The default settings in Spectrum have been updated to reflect the anticipatedchanges in treatment eligibility criteria included in the revised guidelines.In sum, the use of regimen-specific HIV transmission rates, identification and updating of different survival curves according to the mode ofinfection, and the change in the eligibility criteria for antiretroviral therapy initiation in children have substantially increased the estimated numberof children in need of antiretroviral therapy, consequently affecting antiretroviral therapy coverage rates. In light of these changes, 2009 coveragerates should not be compared with coverage figures published in previous versions of this annual progress report. Nevertheless, all estimates ofpaediatric antiretroviral therapy need for previous years have been back-calculated for this year’s report.At the end of 2009, 14 countries had reached more than 80%coverage of antiretroviral therapy for children: Argentina,Botswana, Brazil, Cambodia, Guyana, Jamaica, Kazakhstan,Malaysia, Namibia, Panama, Paraguay, Thailand, Ukraine,Uruguay 1 (see Annex 5).Although progress is being made in expanding children’s<strong>access</strong> to antiretroviral therapy, less than one third ofchildren in need received it in 2009. With the new treatmentguidelines, it is estimated that more children will be placed ontherapy, and additional financial resources will be needed tocover the associated costs, and the requisite drug regimenswill be more complex to implement. It is also essential thatcountries devise and reinforce advocacy plans and policiesto ensure that stock-outs do not occur. Moreover, scalingup services will require large-scale planning, coordination,training of health-care workers and provision of information/1 Countries with at least an estimated 100 children in need of antiretroviraltherapy.education materials. Adequate planning and managementat all levels are also critical to ensure that these changes areappropriately incorporated <strong>int</strong>o national policy and practice.5.3. Outcomes and impact of <strong>int</strong>erventions forprevention of mother-to-child transmissionof HIVMost countries are currently scaling up services and<strong>int</strong>erventions to prevent mother-to-child transmission ofHIV. Assessing the outcome and impact of programmes forthe prevention of mother-to-child transmission on paediatricHIV infections averted, maternal health and survival,and child health and survival is essential for programmemanagement and for monitoring progress towardsMDGs 4, 5 and 6. However, systematically evaluatingprevention of mother-to-child transmission programmesat the national level remains difficult. While the efficacy ofvarious <strong>int</strong>erventions to reduce the risk of mother-to-childPROGRESS REPORT 201099
towards <strong>universal</strong>transmission has been demonstrated in research settings,their national impact when operationalized within varioushealth system constra<strong>int</strong>s and implemented in differentcontexts under a range of service delivery scenarios remainslargely undocumented. HIV-positive pregnant women canbe provided with antiretrovirals to reduce the risk of motherto-childtransmission but the duration of and adherence tothe antiretrovirals provided is often unknown nationally. Lossto follow up also negatively affects the accurate tracking ofmaternal and child outcomes at the national level. Improvedmethods to measure child mortality associated with HIVare needed. WHO, UNICEF and partners are working onguidance to measure the impact of prevention of motherto-childtransmission programmes which will hopefullyfacilitate better assessments of achieved impact in futurereports.Global assessments on the impact of prevention of motherto-childtransmission programmes are based on limited dataand models assuming transmission efficacy parametersfrom clinical trials and limited programme settings, whichmay overestimate the actual impact and achievementof these programmes and <strong>int</strong>ernational goals. Using the2009 distribution of antiretroviral regimens, and a set ofassumptions used to project the impact of prevention ofmother-to-child transmission (29), in low- and middle-incomecountries, mother-to-child transmission has declined fromapproximately 34%, assuming that no <strong>int</strong>erventions wereprovided to prevent mother-to-child transmission, to 21%(assuming a median breastfeeding period of 12 months).If the new WHO guidelines are implemented for 90% ofwomen, and assuming the same breastfeeding practices,it would be possible to achieve around a 10% transmissionrate in sub-Saharan Africa.WHO, UNICEF, UNAIDS and partners are also planninga multistakeholder consultation on key issues to movetowards eliminating mother-to-child transmission by 2015.This meeting will discuss, among other topics, indicators,coverage targets and technical definitions to measure andmonitor progress toward elimination. Achieving this goalwill ultimately require <strong>int</strong>erventions to be scaled up to veryhigh coverage levels and full implementation of the newguidelines on antiretrovirals to reduce mother-to-childtransmission. Jo<strong>int</strong> efforts to work closely and strategicallywith maternal and child health programmes will also becritical to optimize synergies to impact on MDGs 4, 5, 6.5.4. Looking aheadSubstantial progress has been made in the past decade inpreventing transmission of HIV from mother to child, andproviding paediatric treatment and care. However, a numberof programmatic and policy challenges must be addressedif elimination of mother-to-child transmission and <strong>universal</strong><strong>access</strong> to care and treatment for mothers and their childrenare to be achieved in low- and middle-income countries.Further <strong>int</strong>egration and improvement of linkages andreferrals between HIV and maternal, newborn and childhealth services are essential to increase coverage levelsand enhance the quality of <strong>int</strong>erventions for preventionof mother-to-child transmission. This entails developingappropriate policies, equipping laboratories, providing bothclinical and immunological assessment for HIV, and initiatingantiretroviral therapy at services currently not providingthese HIV <strong>int</strong>erventions. In addition, it is also necessary toimplement infant-feeding counselling, postpartum followup and antiretrovirals to prevent transmission duringbreastfeeding, as well as follow up on HIV-exposed infantsand their mothers with an <strong>int</strong>egrated package of care andtreatment. A linked approach based on a strong referralsystems among health facilities, service delivery po<strong>int</strong>s andcommunities will be necessary to achieve <strong>universal</strong> coverageof prevention of mother-to-child transmission.Over 80% of HIV transmissions occur in women withCD4 counts below 350 cells/mm 3 . Programmes mustincorporate without delay CD4 screening as an <strong>int</strong>egralpart of prevention of mother-to-child transmission services.Additional efforts are needed (i) to allow CD4 screeningto be performed at antenatal care services to ensure rapididentification of need and immediate initiation of treatmentor follow up, and (ii) to replace single-dose nevirapine withmore efficacious antiretroviral regimens for preventionof mother-to-child transmission, which must be readilyavailable at all times. In order to ensure appropriate results,however, it is critical to monitor adherence to antiretroviralsduring the breastfeeding period.Eliminating mother-to-child transmission also requiresthe development of strategies to reach out to everywoman and child, and address the specific needs ofwomen, countering stigma and discrimination and therisk of violence in particular. Attention must be paid toensuring that services are geographically located close tocommunities and clients in order to facilitate <strong>access</strong> andmaximize coverage. Accelerating scale-up also requiresa decentralized approach, in which national programmestransfer the planning and implementation of services tosubnational levels and establish clear mechanisms forcoordination, financing and accountability. By bringingmanagement and decision-making closer to the end-users,decentralization considerably strengthens programmaticresponsiveness and ensures that gaps in service delivery canmore easily be identified and addressed in time.Where coverage of <strong>int</strong>erventions is limited, it is essential todevelop effective mechanisms to engage communities as100 TOWARDS UNIVERSAL ACCESS: Scaling up priority HIV/AIDS <strong>int</strong>erventions in the health sector
<strong>access</strong>partners in service delivery and establish better links betweenhealth facilities and local communities. It is also necessary toaddress socioeconomic factors that keep service utilizationlow, including financial barriers and user fees.Early infant diagnosis must be scaled up and treatmentinitiated immediately during the postnatal period if <strong>universal</strong><strong>access</strong> to paediatric treatment and care is to be achieved.Providing HIV services in maternal and child health clinics –the most common places where women and young childrenare seen – increases the likelihood that HIV-exposed and-infected children will receive both the HIV-related care andthe routine child-survival <strong>int</strong>erventions that are essential totheir health.Stronger follow-up systems are needed to monitor andensure that identified needs are actually being metthroughout the continuum of care. Even in places whereearly infant diagnosis is more widely available, many infantstesting HIV-positive are not being started on antiretroviraltherapy. Similarly, a considerable proportion of pregnantwomen identified as being HIV-positive are also lost tofollow up during the “cascade” of <strong>int</strong>erventions required foreffective prevention of HIV transmission to their infants.A further challenge is to adequately implement WHO’s 2010guidelines for treating pregnant women and preventing HIVinfection in infants, especially in countries with weak healthsystems (1). Partners must step up efforts to assist countriesin identifying the most appropriate option for antiretrovirals,taking <strong>int</strong>o account local circumstances and preferences.Finally, countries need to be supported to improve thequality, scope, completeness and reliability of datacollected. This is essential for prevention of mother-tochildtransmission, which incorporates a complex setof <strong>int</strong>erlinked services that can be delivered at differententry po<strong>int</strong>s and facilities. Monitoring progress towardselimination of mother-to-child transmission and <strong>universal</strong><strong>access</strong> needs the implementation of a robust informationsystem that is able to identify gaps in service delivery andrespond adequately. tPROGRESS REPORT 2010101
towards <strong>universal</strong>References1. Antiretroviral drugs for treating pregnant women and preventing HIV infection in infants: recommendations for a public health approach, 2010version. Geneva, <strong>World</strong> <strong>Health</strong> <strong>Organization</strong>, 2010 (http://whq<strong>libdoc</strong>.<strong>who</strong>.<strong>int</strong>/publications/2010/9789241599818_eng.pdf, <strong>access</strong>edon 10 September 2010).2. United Nations General Assembly Special Session on HIV/AIDS. Declaration of Commitment on HIV/AIDS. (http://data.unaids.org/publications/irc-pub03/aidsdeclaration_en.pdf, <strong>access</strong>ed 18 Aug 2010).3. United Nations General Assembly Resolution 60/262. New York, United Nations, 2006. (http://data.unaids.org/pub/Report/2006/20060615_HLM_PoliticalDeclaration_ARES60262_en.pdf, <strong>access</strong>ed 31 August 2010).4. Guidance on global scale-up of prevention of mother-to-child transmission of HIV. Geneva and New York, WHO, UNICEF, 2006. (http://www.unicef.org/aids/files/PMTCT_enWEBNov26.pdf, <strong>access</strong>ed 31 August 2010).5. PMTCT strategic vision 2010–2015. Geneva, WHO, 2010. (http://www.<strong>who</strong>.<strong>int</strong>/hiv/pub/mtct/strategic_vision.pdf, <strong>access</strong>ed 9 September2010).6. Jo<strong>int</strong> United Nations Programme on HIV/AIDS (UNAIDS) and <strong>World</strong> <strong>Health</strong> <strong>Organization</strong> (WHO). AIDS epidemic update: November2009. Geneva, UNAIDS, WHO, 2009 (http://data.unaids.org/pub/Report/2009/JC1700_Epi_Update_2009_en.pdf, <strong>access</strong>ed 22July 2010).7. 2008 report on the global AIDS epidemic. Geneva, UNAIDS, 2008 (http://whq<strong>libdoc</strong>.<strong>who</strong>.<strong>int</strong>/unaids/2008/9789291737178_eng.pdf ,<strong>access</strong>ed 22 July 2010).8. Strategic approaches to the prevention of HIV infection in infants: report of a WHO meeting, Morges, Switzerland, 20–22 March 2002. Geneva,<strong>World</strong> <strong>Health</strong> <strong>Organization</strong>, 2003 (http://www.<strong>who</strong>.<strong>int</strong>/hiv/pub/mtct/en/StrategicApproachesE.pdf, <strong>access</strong>ed 22 July 2010).9. WHO, UNICEF and the Inter-Agency Task Team (IATT) on Prevention of HIV Infection in Pregnant Women, Mothers and their Children.Monitoring and evaluating the prevention of mother-to-child transmission of HIV: a guide for national programme. Geneva, <strong>World</strong> <strong>Health</strong><strong>Organization</strong> (in press).10. Delivering HIV test results and messages for re-testing and counselling in adults. Geneva, <strong>World</strong> <strong>Health</strong> <strong>Organization</strong>, 2010 (http://whq<strong>libdoc</strong>.<strong>who</strong>.<strong>int</strong>/publications/2010/9789241599115_eng.pdf, <strong>access</strong>ed 22 July 2010).11. Msuya SE et al. Low male partner participation in antenatal HIV counselling and testing in northern Tanzania: implications for preventiveprograms. AIDS Care, 2008, 20:700–709.12. Farquhar C et al. Antenatal couple counselling increases uptake of <strong>int</strong>erventions to prevent HIV-1 transmission. Journal of AcquiredImmune Deficiency Syndromes, 2004, 37:1620–1626.13. Carter, RJ et al. CD4+ Cell Count Testing More Effective Than HIV Disease Clinical Staging in Identifying Pregnant and PostpartumWomen Eligible for Antiretroviral Therapy in Resource-Limited Settings. Journal of Acquired Immune Deficiency Syndromes (2010). doi:10.1097/QAI.0b013e3181e73f4b14. Kuhn, L et al. Potential impact of new WHO criteria for antiretroviral therapy for prevention of mother-to-child transmission, AIDS,2010, 24: 1374-137715. WHO, UNICEF, UNAIDS, UNFPA. Guidelines on HIV and infant feeding, 2010. Geneva, WHO, 2010. (http://whq<strong>libdoc</strong>.<strong>who</strong>.<strong>int</strong>/publications/2010/9789241599535_eng.pdf, <strong>access</strong>ed 22 August 2010.16. Cl<strong>int</strong>on <strong>Health</strong> Access Initiative. Description of a 2008 Meta-Analysis of Mother to Child Transmission (MTCT) of HIV Rates in Resource-Limited Settings – discussion paper. 2010 (unpublished).17. Taking stock: HIV in children. Geneva, WHO, 2006 (WHO/HIV/2006.04).18. Pfeiffer et al. Integration of HIV/AIDS services <strong>int</strong>o African primary health care: lessons learned for health system strengthening inMozambique – a case study. Journal of the International AIDS Society, 2010, 13:3.19. Callaghan et al. A systematic review of task- shifting for HIV treatment and care in Africa. Human Resources for <strong>Health</strong>, 2010, 8:8.20. Torpey K et al. Increasing the uptake of prevention of mother-to-child transmission of HIV services in a resource-limited setting . BMC<strong>Health</strong> Services Research, 2010, 10:29 (http://www.biomedcentral.com/1472-6963/10/29, <strong>access</strong>ed 30 July 2010).102 TOWARDS UNIVERSAL ACCESS: Scaling up priority HIV/AIDS <strong>int</strong>erventions in the health sector
<strong>access</strong>21. Killam W et al. Antiretroviral therapy in antenatal care to increase treatment initiation in HIV-infected pregnant women: a steppedwedgeevaluation. AIDS, 2010, 24:856–891.22. Antiretroviral therapy for HIV infection in infants and children: towards <strong>universal</strong> <strong>access</strong>. Executive summary of recommendations: preliminaryversion for program planning 2010. Geneva, <strong>World</strong> <strong>Health</strong> <strong>Organization</strong>, 2010 (http://www.<strong>who</strong>.<strong>int</strong>/hiv/pub/paediatric/paed-prelimsummary.pdf,<strong>access</strong>ed 22 July 2010).23. Co-trimoxazole prophylaxis for HIV-exposed and HIV-infected infants and children: practical approaches to implementation and scale up.<strong>World</strong> <strong>Health</strong> <strong>Organization</strong> and United Nations Children’s Fund, 2009 (http://www.<strong>who</strong>.<strong>int</strong>/hiv/pub/paediatric/cotrimoxazole.pdf,<strong>access</strong>ed 22 July 2010).24. Antiretroviral therapy for HIV infection in infants and children: towards <strong>universal</strong> <strong>access</strong>. Recommendations for a public health approach, 2010revision. Geneva, <strong>World</strong> <strong>Health</strong> <strong>Organization</strong>, 2010 (http://whq<strong>libdoc</strong>.<strong>who</strong>.<strong>int</strong>/publications/2010/9789241599801_eng.pdf, <strong>access</strong>edon 10 September 2010).25. Paediatric estimation issues with a focus on ART need estimates – technical report and recommendations. Report of a meeting of the UNAIDSReference Group on Estimates, Modelling and Projections held in Geneva, Switzerland, 4 December 2009. Geneva, Jo<strong>int</strong> United NationsProgramme on HIV/AIDS (UNAIDS) Reference Group on Estimates, Modelling and Projections, 2009 (http://www.epidem.org/Publications/Paediatric%20Estimates_Geneva%202009.pdf, <strong>access</strong>ed July 19 2010).26. Consultative meeting on data collection & estimation methods related to HIV infection in infants and children. Report of a consultative meetingwith UNICEF, WHO and the UNAIDS Reference Group for Estimates, Modelling and Projections held in New York, USA, 8–10 July 2008.Geneva, Jo<strong>int</strong> United Nations Programme on HIV/AIDS (UNAIDS) Reference Group on Estimates,Modelling and Projections, 2009(http://www.epidem.org/Publications/UNAIDS_UNICEF_Paediatric%20HIV%20Report_9%20Dec%202008_Final.pdf, <strong>access</strong>ed10 September 2010).27. Newell M-L et al. Mortality of infected and uninfected infants born to HIV-infected mothers in Africa: a pooled analysis. Lancet, 2004,364:1236–1243.28. Mahy M et al. Derivation of parameters used in Spectrum for eligibility for ART and survival on ART. Sexually transmitted Infections,Supplement (in press).29. Stover J et al. The Spectrum projection package: improvements in estimating mortality, ART needs, PMTCT impact and uncerta<strong>int</strong>ybounds. Sexually Transmitted Infections, 2008, 84(Suppl I):i24–i30.PROGRESS REPORT 2010103
6. BEYOND 2010In 2009, low- and middle-income countries continuedto make considerable progress in scaling up <strong>access</strong> tokey health sector <strong>int</strong>erventions, including HIV testing andcounselling, antiretroviral therapy and prevention of motherto-childtransmission of HIV. An additional 1.2 million peoplestarted receiving life-saving antiretroviral therapy in 2009,bringing the total number of people on antiretroviral therapyin low- and middle-income countries to 5.25 million. In2009, 53% of HIV-infected pregnant women receivedantiretroviral drugs to reduce the risk of HIV transmissionto their children. Important new evidence has also emergedon the secondary benefits that antiretroviral therapy hasin preventing HIV transmission. The combination ofprevention, treatment and care <strong>int</strong>erventions is alreadybenefiting adults and children worldwide, as millions of liveshave been saved and new infections averted.Yet, a large proportion of people in need still do not have<strong>access</strong> to the required <strong>int</strong>erventions. Although importantprogress has been made in preventing new HIV infections,2.7 million people were newly infected in 2008. Despite arapid increase in the uptake of HIV testing, a majority ofpeople living with HIV do not know their status. As a result,most of them initiate therapy at a late stage of the disease.Coverage of prevention <strong>int</strong>erventions among groups athigher risk for HIV infection remains less than 50% in manycountries. Less than three months away from December2010, <strong>universal</strong> <strong>access</strong> is a commitment not yet fulfilled inmost low- and middle-income countries.Paradoxically, while the global economic crisis of 2008–2009has put the sustainability of many HIV programmes at risk,there has never been so much evidence of the positive andgrowing impact of HIV-related investments in cutting newinfections, reducing deaths and ensuring that people living withHIV enjoy healthy lives. Without sustained and strengthenedfinancial and programmatic commitments, there is a significantdanger that these achievements may be undone.Addressing these challenges requires action along fourmain strategic directions: (i) expanding and optimizingthe global HIV response, (ii) catalysing the impact of HIVprogrammes on other health outcomes, (iii) strengtheninghealth systems for a sustainable and comprehensiveresponse, and (iv) tackling the structural determinants ofthe response, including human rights violations.Doing more, more strategicallyFirst and foremost, the hard-won gains of the past decademust be protected and enhanced. As we contemplate theroad towards 2015, optimizing HIV prevention, treatmentand care outcomes must be a key priority. Enhancing thevalue for money of the global HIV response entails improvingthe quality of service delivery in order to increase retentionin care and in antiretroviral therapy programmes, reduceearly death and loss to follow up, improve adherence andoptimally prolong the use of effective, lower-cost first-lineregimens. It calls for better understanding of the epidemic,including the behaviours that drive it and the impact ofvarious prevention <strong>int</strong>erventions. It implies strengtheninglinkages and referrals between programmes. It demands theimplementation of flexible systems that identify and correctimplementation bottlenecks . Donors and developmentpartners also have a vital role to play in this drive towardsgreater efficiency and effectiveness by securing lowertransaction costs, greater harmonization of efforts andalignment with country priorities.At the same time, it is clear that additional investmentsare called for in order to expand coverage of essential<strong>int</strong>erventions. Low- and middle-income countries mustsubstantially ramp up their domestic budget allocations tofund HIV services. In 2001, at a conference convened bythe <strong>Organization</strong> of African Unity in Abuja, Nigeria, AfricanStates committed to allocate at least 15% of their annualbudgets to the health sector (1). While progress has beenmade, national allocations must still grow on average byover 50% in order meet the Abuja targets (2). Concurrently,high-income countries must reaffirm their collectivecommitment to <strong>universal</strong> <strong>access</strong>, as agreed to by leaders ofthe G8 in Gleneagles in 2005 and reaffirmed at the UnitedNations General Assembly in 2006 (3). It is important thatbilateral and multilateral funders, development agenciesand technical support providers be adequately resourced tosupport country HIV scale-up plans. In particular, ensuringthe successful completion of the third replenishment of theGlobal Fund to Fight AIDS, Tuberculosis and Malaria will becritical to protect and enhance current achievements.Leveraging the global HIV response for broaderhealth and development gainsThe sustainability and effectiveness of the global HIVresponse depend as well on whether and how it supportsimprovements in other health and development outcomes.As Ban Ki-moon, United Nations’ Secretary-General, recentlystated, <strong>universal</strong> <strong>access</strong> to HIV prevention, treatment, careand support represents, above all, an essential bridge towardsachieving the full range of Millennium Development Goals(MDGs) (4). Indeed, slowing the rate of new HIV infectionsand decreasing HIV-related morbidity and mortality is vitalPROGRESS REPORT 2010105
towards <strong>universal</strong>to advancing almost every global development goal. In sub-Saharan Africa, for example, HIV and tuberculosis accountfor over 25% of deaths among women of reproductiveage. (5) Providing adequate care and treatment is thusvital to the achievement of MDG 5, on improving maternalhealth. Ensuring that the next generation of children is bornHIV-free through effective prevention of mother-to-childtransmission supports MDG 4, on the reduction of childmortality. As the scale-up of antiretroviral therapy continues,its impact on reducing HIV transmission among adults andchildren will increase accordingly. Antiretroviral therapy hasalready contributed to lowering both the incidence of andmortality from tuberculosis (see Box 4.14).Successful HIV responses also enable broader developmentgains. HIV prevention and treatment allow people to livehealthy, productive lives, enhancing labour output anddecreasing household vulnerability to poverty and hunger.They also prevent children from becoming orphans, thusprotecting their livelihoods and the generational transmissionof human capital. They help ma<strong>int</strong>ain an adequate pool ofschoolteachers, the backbone of quality primary education.They empower women by highlighting gender inequalitiesand promoting sexual and reproductive health and rights.Without accelerated efforts, <strong>universal</strong> <strong>access</strong> to treatment,prevention and care will not be achieved in most countriesand this, in turn, will decrease the impact of developmentinvestments in general.<strong>Towards</strong> <strong>int</strong>egrated and strengthened healthsystemsHIV programmes have helped strengthen national healthsystems by attracting vital new financial resources forhealth, building systemic capacity and <strong>int</strong>roducing chronicdisease management approaches for the first time in manyresource-limited settings. For example, the <strong>int</strong>egration ofantiretroviral therapy <strong>int</strong>o existing public sector maternaland child health clinics in Lusaka, Zambia, has alreadydoubled the proportion of eligible women initiatingtreatment (see Box 5.4). However, more must be done toensure that investments in the HIV response translate <strong>int</strong>obroad-based health systems strengthening.Integrating services, strategies and plans can improve notonly equity, <strong>access</strong> and coverage, but may also enhancethe quality and efficiency of care. In order to realize thesesynergies, HIV programmes must be implemented withina primary health-care framework capable of providing<strong>int</strong>egrated services that address multiple patient needsthrough a continuum of care. These include servicesfor maternal and child health, harm reduction, and themanagement of tuberculosis, sexually transmitted infectionsand viral hepatitis. It is necessary to deepen the involvementof communities in programme management and serviceprovision in order to ensure the adequacy of <strong>int</strong>erventionsdelivered and maximize outreach and uptake.Addressing structural barriers through a rightsbasedapproachA comprehensive approach, which pursues both equityand efficacy, demands that all people in need be capableof <strong>access</strong>ing prevention, treatment and care, includingpopulations and groups at higher risk for HIV infection,such as sex workers, injecting drug users, men <strong>who</strong> havesex with men, transgender persons, prisoners and migrants.Yet, even in 2010, discrimination and harassment continueto often push these groups to live on the margins of societybeyond the reach of health services. Greater attentionmust be paid to how the <strong>int</strong>erplay between law and socialvalues may impede <strong>access</strong> to essential health services andcompromise the effectiveness of HIV programmes. Thecriminalization of HIV transmission, same-sex relations,sex work and drug use impedes effective <strong>int</strong>erventions toprevent HIV transmission among these groups and makesthem significantly less likely to seek life-saving treatmentand care. Many of these issues are compounded further bypoverty and social marginalization (6).Addressing the needs of groups at higher risk for HIVinfection requires strong actions to uphold their humanrights and protect them from violence and exclusion.Focused efforts are needed to remove punitive laws andcreate enabling legal environments that address humanrights violations currently blocking effective AIDS responses.The engagement of affected communities and civil society inpolicy design, programme management and service deliveryremains an essential component of successful responses.The agenda of the global HIV response remains clearlyunfinished. Every day, thousands are still being infected anddying due to lack of <strong>access</strong> to prevention, treatment andcare. Although <strong>universal</strong> <strong>access</strong> may not be a global realityby the end of 2010, investments in the global HIV responseare already paying off. The sooner high-quality services arescaled up, the larger will be the social and economic gainsfrom fewer infections, lower mortality and having millionsof people live longer and healthier lives. t106 TOWARDS UNIVERSAL ACCESS: Scaling up priority HIV/AIDS <strong>int</strong>erventions in the health sector
<strong>access</strong>References1. <strong>Organization</strong> of African Unity. Abuja Declaration on HIV/AIDS, tuberculosis and other related infectious diseases. African Summit on HIV/AIDS, Tuberculosis and Other Related Infectious Diseases, Abuja, Nigeria, 26–27 April 2001. African Union, 2001 (OAU/SPS/Abuja/3).2. Trends in development assistance and domestic financing for health in implementing countries. The Global Fund to fight AIDS, Tuberculosisand Malaria, 2010. (http://www.theglobalfund.org/documents/replenishment/2010/Trends_in_Development_Assistance_and_Domestic_Financing_for_<strong>Health</strong>_in_Implementing_Countries.pdf, <strong>access</strong>ed 30 June 2010).3. Political Declaration on HIV/AIDS – United Nations General Assembly Resolution 60/262. United Nations, New York. 2006. (http://data.unaids.org/pub/Report/2006/20060615_hlm_politicaldeclaration_ares60262_en.pdf. <strong>access</strong>ed August 30 2010).4. Progress made in the implementation of the Declaration of Commitment on HIV/AIDS and the Political Declaration on HIV/AIDS – Report bythe Secretary-General. New York, United Nations, April 2010.5. <strong>World</strong> <strong>Health</strong> <strong>Organization</strong>. Women and health : today’s evidence tomorrow’s agenda. Geneva, <strong>World</strong> <strong>Health</strong> <strong>Organization</strong>, 2009. (http://www.<strong>who</strong>.<strong>int</strong>/gender/documents/9789241563857/en/index.html, <strong>access</strong>ed 20 April 2010).6. Blame and banishment. The underground HIV epidemic affecting children in Eastern Europe and Central Asia. The United Nations Children’sFund (UNICEF), 2010 (http://www.unicef.org/media/files/UNICEF_Blame_and_Banishment.pdf, <strong>access</strong>ed 6 August 2010).PROGRESS REPORT 2010107
towards <strong>universal</strong>Annex 1. Reported number of facilities with HIV testing and counselling and number of people olderthan 15 years <strong>who</strong> received HIV testing and counselling, low- and middle-income countries, 2009Facilities with HIV testing and counselling, 2009Number of people aged 15 years and over <strong>who</strong> received HIVtesting and counselling, 2009 bLow- and middle-income countries a Reported number c 100 000 adult population Reported number c adult populationEstimated number perEstimated number per 1000Reporting periodAfghanistan 25 0.2 8 001 0.6 Jan 09–Dec 09Albania … … … …Algeria … … … …Angola 285 3.3 … …Argentina 7 856 38.7 … …Armenia 150 9.2 70 955 43.7 Jan 09–Dec 09Azerbaijan … … … …Bangladesh 105 0.1 26 369 0.3 Jan 09–Dec 09Belarus 1 070 20.9 … …Belize 43 26.3 23 802 145.5 Jan 09–Dec 09Benin 126 3.0 280 982 67.0 Jan 09–Dec 09Bhutan 34 8.8 … …Bolivia (Plurinational State of) 250 5.1 210 021 42.5 Jan 09–Dec 09Bosnia and Herzegovina 40 2.1 20 369 10.5 Jan 09–Dec 09Botswana 666 62.7 330 159 d 311.0 Jan 09–Dec 09Brazil 3 579 3.4 … …Bulgaria … … … …Burkina Faso 1 267 17.4 602 961 82.6 Jan 09–Dec 09Burundi 319 7.4 281 959 65.6 Jan 09–Dec 09Cambodia 233 2.9 622 127 77.2 Jan 09–Dec 09Cameroon 2 025 21.4 450 022 47.6 Jan 09–Dec 09Cape Verde 205 76.5 25 075 93.5 Jan 09–Dec 09Central African Republic 105 4.9 136 202 64.2 Jan 09–Dec 09Chad 72 1.4 66 191 13.1 Jan 09–Dec 09Chile 844 9.3 560 147 61.5 Jan 09–Dec 09China 7 335 1.0 … …Colombia … … … …Comoros 14 4.0 3 281 9.4 Jan 09–Dec 09Congo 103 5.7 82 332 45.8 Jan 09–Dec 09Cook Islands … … … …Costa Rica 1 106 43.3 … …Côte d'Ivoire 550 5.5 727 290 72.5 Jan 09–Dec 09Croatia 10 0.5 1 643 0.8 Jan 09–Dec 09Cuba 378 6.2 1 888 065 310.7 Jan 09–Dec 09Democratic People's Republic ofKorea… … … …Democratic Republic of the Congo 538 1.8 392 491 17.7 Jan 09–Oct 09Djibouti 28 6.1 14 154 31.1 Jan 09–Dec 09Dominica 60 172.1 4 402 126.3 Jan 09–Dec 09Dominican Republic 150 2.8 259 110 49.1 Jan 09–Dec 09Ecuador 1 263 18.0 403 263 57.3 Jan 09–Dec 09Egypt … … … …El Salvador 489 15.7 362 628 116.6 Jan 09–Dec 09108 TOWARDS UNIVERSAL ACCESS: Scaling up priority HIV/AIDS <strong>int</strong>erventions in the health sector
<strong>access</strong>Facilities with HIV testing and counselling, 2009Number of people aged 15 years and over <strong>who</strong> received HIVtesting and counselling, 2009 bLow- and middle-income countries a Reported number c 100 000 adult population Reported number c adult populationEstimated number perEstimated number per 1000Reporting periodEquatorial Guinea 80 24.6 24 256 74.6 Jan 09–Dec 09Eritrea … … 132 829 52.2 Jan 09–Dec 09Ethiopia 1 823 4.7 6 630 647 172.3 Jan 09–Dec 09Fiji 31 7.0 27 865 63.3 Jan 09–Dec 09Gabon 119 15.8 33 550 44.5 Jan 09–Dec 09Gambia 34 4.2 47 549 66.0 Jan 09–Oct 09Georgia … … … …Ghana 808 6.7 1 253 312 104.4 Jan 09–Dec 09Grenada 38 65.9 … …Guatemala 230 3.5 243 644 37.3 Jan 09–Dec 09Guinea 83 1.8 74 090 15.8 Jan 09–Dec 09Guinea-Bissau 62 8.4 24 871 33.8 Jan 09–Dec 09Guyana 168 42.7 99 837 e 253.8 Jan 09–Dec 09Haiti 167 3.3 681 002 132.8 Jan 09–Dec 09Honduras 700 18.5 199 006 52.5 Jan 09–Dec 09Hungary 144 3.0 99 538 20.6 Jan 09–Dec 09India 5 089 0.8 13 494 372 21.2 Jan 09–Dec 09Indonesia 565 0.4 170 791 f 1.3 Jan 09–Dec 09Iran (Islamic Republic of) … … … …Iraq … … … …Jamaica 343 24.3 … …Jordan 12 0.3 271 0.1 Jan 09–Dec 09Kazakhstan 3 801 43.9 1 498 858 173.1 Jan 09–Dec 09Kenya 4 115 21.3 4 433 557 230.0 Jan 09–Dec 09Kiribati 9 17.0 5 957 112.7 Jan 09–Dec 09Kyrgyzstan 25 0.8 172 106 56.9 Jan 09–Dec 09Lao People's Democratic Republic 110 3.4 40 962 12.7 Jan 09–Dec 09Latvia 4 743 416.2 … …Lebanon 19 0.8 … …Lesotho 239 23.8 251 242 250.6 Jan 09–Dec 09Liberia 114 6.1 80 295 43.0 Jan 09–Dec 09Libyan Arab Jamahiriya … … … …Lithuania 758 45.2 … …Madagascar 816 8.8 324 809 35.0 Jan 09–Dec 09Malawi 728 10.7 1 449 645 213.7 Jan 09–Dec 09Malaysia 7 627 51.3 662 062 44.6 Jan 09–Dec 09Maldives 8 4.3 4 285 22.9 Jan 09–Dec 09Mali 1 091 17.6 255 835 41.3 Jan 09–Dec 09Marshall Islands 2 6.0 … …Mauritania … … 9 498 5.7 Jan 09–Dec 09Mauritius 193 27.1 33 744 47.4 Jan 09–Dec 09Mexico 2 784 4.7 … …Micronesia (Federated States of) … … … …Mongolia 57 3.5 9 015 5.5 Jan 09–Dec 09Montenegro 8 2.6 738 2.4 Jan 09–Dec 09Morocco … … … …PROGRESS REPORT 2010109
towards <strong>universal</strong>Facilities with HIV testing and counselling, 2009Number of people aged 15 years and over <strong>who</strong> received HIVtesting and counselling, 2009 bLow- and middle-income countries a Reported number c 100 000 adult population Reported number c adult populationEstimated number perEstimated number per 1000Reporting periodMozambique 356 3.4 1 201 942 114.4 Jan 09–Dec 09Myanmar 350 1.2 270 301 9.6 Jan 09–Dec 09Namibia 264 23.4 249 011 221.0 Jan 09–Dec 09Nauru … … … …Nepal 179 1.2 125 400 8.3 Jan 09–Dec 09Nicaragua 862 28.6 205 233 68.1 Jan 09–Dec 09Niger 321 5.0 358 071 55.6 Jan 09–Dec 09Nigeria 1 074 1.5 2 570 386 35.1 Jan 09–Dec 09Niue … … … …Oman 61 3.7 605 755 368.0 Jan 09–Dec 09Pakistan 13 0.0 11 439 0.1 Jan 09–Dec 09Palau … … … …Panama 123 6.7 60 798 33.3 Jan 09–Dec 09Papua New Guinea 177 5.2 159 005 46.9 Jan 09–Dec 09Paraguay 143 4.4 159 607 49.0 Jan 09–Dec 09Peru 5 096 32.6 … …Philippines 82 0.2 10 110 0.2 Jan 09–Dec 09Poland 2 645 13.7 25 452 1.3 Jan 09–Dec 09Republic of Moldova 56 2.9 86 558 45.1 Jan 09–Dec 09Romania 120 1.1 280 510 25.8 Jan 09–Dec 09Russian Federation … … … …Rwanda 395 8.0 1 932 420 393.8 Jan 09–Dec 09Sa<strong>int</strong> Kitts and Nevis … … … …Sa<strong>int</strong> Lucia 39 40.3 1 629 16.8 Jan 09–Dec 09Sa<strong>int</strong> Vincent and the Grenadines 40 66.6 6 416 106.9 Jan 09–Dec 09Samoa … … … …Sao Tome and Principe 41 51.1 13 212 164.8 Jan 09–Dec 09Senegal 532 8.8 352 197 58.3 Jan 09–Dec 09Serbia 52 1.1 53 399 11.0 Jan 09–Dec 09Seychelles 27 58.3 10 808 233.4 Jan 09–Dec 09Sierra Leone 416 15.2 281 218 102.7 Jan 09–Dec 09Slovakia … … … …Solomon Islands … … … …Somalia 19 0.5 10 057 g 2.4 Jan 09–Dec 09South Africa 4 326 15.8 6 989 312 256.1 Jan 09–Dec 09Sri Lanka 47 0.4 … …Sudan 210 g 1.0 103 373 h 4.9 Jan 09–Dec 09Suriname 59 21.2 19 276 69.3 Jan 09–Dec 09Swaziland 170 28.5 149 755 251.3 Jan 09–Dec 09Syrian Arab Republic … … … …Tajikistan 231 6.3 285 831 78.5 Jan 09–Dec 09Thailand 1 014 2.7 1 099 657 29.3 Jan 09–Dec 09The former Yugoslav Republic ofMacedonia14 1.3 … …Timor-Leste … … … …Togo 225 6.9 166 887 51.1 Jan 09–Dec 09Tonga … … … …110 TOWARDS UNIVERSAL ACCESS: Scaling up priority HIV/AIDS <strong>int</strong>erventions in the health sector
<strong>access</strong>Facilities with HIV testing and counselling, 2009Number of people aged 15 years and over <strong>who</strong> received HIVtesting and counselling, 2009 bLow- and middle-income countries a Reported number c 100 000 adult population Reported number c adult populationEstimated number perEstimated number per 1000Reporting periodTunisia 2 430 40.9 13 915 2.3 Jan 09–Dec 09Turkey 1 362 3.3 … …Turkmenistan … … … …Tuvalu … … … …Uganda 1 215 8.5 2 363 468 i 165.1 Oct 08–Sep 09Ukraine 2 002 8.5 … …United Republic of Tanzania 2 134 10.6 1 970 324 98.3 Jan 09–Dec 09Uruguay … … … …Uzbekistan 5 153 32.9 1 250 185 79.8 Jan 09–Dec 09Vanuatu … … … …Venezuela (Bolivarian Republic of) 103 0.7 … …Viet Nam 479 1.0 777 256 15.5 Jan 09–Dec 09Yemen 20 0.2 7 525 0.7 Jan 09–Dec 09Zambia 1 563 27.0 1 582 621 273.9 Jan 09–Dec 09Zimbabwe 1 560 25.0 1 142 052 182.9 Jan 09–Dec 09... Data not available or not applicable.a See the country classification by income, level of the epidemic and geographical, UNAIDS, UNICEF and WHO regions (Annex 7).b This number should include all people aged 15 years and above <strong>who</strong> received HIV testing and counselling through any method or setting, including voluntary counselling and testing (VCT) andantenatal care (ANC) settings. Not all countries are able to report data from all settings.c Some countries reported voluntary counselling and testing (VCT) and antenatal care (ANC) settings testing data separately; these data are combined here.d Does not include data from all voluntary counselling and testing (VCT) networks, and routine health sector testing may include significant repeat testing.e Includes all people under the age of under 15 years <strong>who</strong> were tested.f Only partial reporting available.g Only 80% reporting available.h Separate reports were received from Sudan for 2008 and 2009: testing and counselling facilities; northern Sudan, 132 (2009), 149 (2008); southern Sudan, 78 (2009), 62 (2008); number of people<strong>who</strong> received testing and counselling: northern Sudan, 52 770 (2009), 30 924 (2008); southern Sudan, 50 502 (2009), 11 276 (2008).i Includes all people over the age of four years <strong>who</strong> were tested.PROGRESS REPORT 2010111
towards <strong>universal</strong>Annex 2. Reported number of targeted service delivery po<strong>int</strong>s for sex workers where sexuallytransmitted infection services are provided (per 1000 sex workers) and prevalence of syphilisamong antenatal care clinic attendees, by country, 2009 aCountriesNumber of targetedservice delivery po<strong>int</strong>sfor sex workers wheresexually transmittedinfection services areprovided(per 1000 sex workers)Prevalence of syphilisamong antenatal careclinic attendeesNumber of countries reporting 51 77Afghanistan 1.67 …Antigua and Barbuda … 0.72%Argentina … 1.40%Bangladesh 1.71 0.62%Belarus 0.41 0.06%Benin 2.79 0.28%Bolivia (Plurinational State of) 0.60 …Botswana … 1.31%Brazil … 1.60%Burkina Faso 0.83 2.13%Burundi … 1.37%Cambodia 1.70 0.13%Cameroon … 0.56%Central African Republic … 5.88%Chad … 7.30%Chile 2.83 0.15%China … 0.54%Colombia … 1.14%Comoros 4.00 …Costa Rica 0.14 …Côte d'Ivoire 3.30 0.18%Cuba … 0.77%Czech Republic 0.50 0.09%Democratic Republic of the Congo … 1.98%Djibouti 2.00 0.45%Dominica … 0.42%Dominican Republic 0.20 0.36%Ecuador 2.50 …El Salvador 6.19 0.29%Estonia 0.50 …Fiji … 5.15%Gabon … 0.94%Germany 0.88 0.34%Ghana … 6.15%Grenada … 5.25%Guatemala 2.84 0.55%Guinea 0.52 1.52%CountriesNumber of targetedservice delivery po<strong>int</strong>sfor sex workers wheresexually transmittedinfection services areprovided(per 1000 sex workers)Prevalence of syphilisamong antenatal careclinic attendeesGuyana … 0.17%Honduras 1.84 0.07%Hungary 6.25 …India 5.57 0.35%Indonesia 1.31 1.17%Jordan 5.00 0.00%Kazakhstan 1.76 …Kiribati 6.67 5.61%Kyrgyzstan 1.60 0.08%Lao People's Democratic Republic 16.23 0.76%Lithuania 0.40 …Madagascar … 7.70%Malawi … 1.12%Malaysia 0.12 0.07%Maldives … 0.00%Mali 1.19 4.00%Mauritius 0.00 0.15%Mexico … 0.27%Mongolia 0.43 1.97%Mozambique … 6.93%Myanmar 1.88 0.74%Namibia … 2.32%Nepal 0.96 …Nicaragua 0.25 0.45%Niger 1.54 2.56%Nigeria … 1.50%Oman … 0.04%Panama 1.00 …Papua New Guinea … 5.78%Paraguay … 3.43%Peru 1.15 0.33%Philippines 0.33 0.24%Republic of Moldova … 0.26%Romania … 1.62%Rwanda … 1.57%Sao Tome and Principe 14.39 0.36%Saudi Arabia … 0.06%Sierra Leone … 0.36%112 TOWARDS UNIVERSAL ACCESS: Scaling up priority HIV/AIDS <strong>int</strong>erventions in the health sector
<strong>access</strong>CountriesNumber of targetedservice delivery po<strong>int</strong>sfor sex workers wheresexually transmittedinfection services areprovided(per 1000 sex workers)Prevalence of syphilisamong antenatal careclinic attendeesSouth Africa … 3.91%Sri Lanka 1.15 0.02%Sudan … 3.49%Swaziland … 4.75%United Republic of Tanzania … 4.40%Thailand 1.03 0.13%The former Yugoslav Republic ofMacedonia0.33 …Togo 2.00 1.10%Trinidad and Tobago 0.10 1.67%Tunisia 10.80 …United Kingdom … 0.17%Uruguay 9.33 …Uzbekistan 1.15 0.02%Viet Nam 14.60 0.21%Zambia … 5.10%Zimbabwe … 0.59%... Data not available or not applicable.a Data are reported for 2009, but actual data collection period may vary. Data should be<strong>int</strong>erpreted with caution as data may not be nationally representative, and methodologyamong countries varied (Annex 7).PROGRESS REPORT 2010113
towards <strong>universal</strong>Annex 3. People (all age groups) receiving and needing antiretroviral therapy and coverage percentages, 2008–2009Reportednumberof peoplereceiving Monthantiretroviral and yearLow- and middle-income countries a therapy, 2008 b,c of reportReportednumberof peoplereceivingantiretroviraland yearof reporttherapy, 2009 b,c MonthEstimated number of people needingEstimated number of people needingantiretroviral therapy based on WHO Estimated antiretroviral therapy coverage antiretroviral therapy based on WHO Estimated antiretroviral therapy coverage2010 guidelines, 2009 b,d based on WHO 2010 guidelines, 2009 b 2006 guidelines, 2009 b,eEstimateLowestimateHighestimateEstimateLowestimateHighestimateEstimateLowestimateHighestimateEstimated numberof people needingbased on WHO 2006 guidelines, 2009 b,d antiretroviraltherapy based onEstimateLowestimateHighestimatecountry report,2009 dAfghanistan 0 Dec 08 12 Dec 09 … … … … …Albania 110 Dec 08 114 Dec 09 … … … … …Algeria 1 111 Dec 08 1 526 Dec 09 6 000 4 500 8 000 25% 19% 34% 3 700 2 700 4 900 42% 31% 56% …Angola 14 139 f Dec 08 20 640 Dec 09 86 000 65 000 110 000 24% 19% 32% 59 000 43 000 79 000 35% 26% 48% 84 250Argentina 40 240 f Dec 08 42 815 Dec 09 61 000 42 000 74 000 70% 58% >95% 50 000 37 000 58 000 86% 74% >95% …Armenia 100 Dec 08 179 Dec 09
<strong>access</strong>Reportednumberof peoplereceivingantiretroviralLow- and middle-income countries aand yearof reporttherapy, 2008 b,c MonthReportednumberof peoplereceivingantiretroviraland yearof reporttherapy, 2009 b,c MonthEstimated number of people needingEstimated number of people needingantiretroviral therapy based on WHO Estimated antiretroviral therapy coverage antiretroviral therapy based on WHO Estimated antiretroviral therapy coverage2010 guidelines, 2009 b,d based on WHO 2010 guidelines, 2009 b 2006 guidelines, 2009 b,eEstimateLowestimateHighestimateEstimateLowestimateHighestimateEstimateLowestimateHighestimateEstimated numberof people needingbased on WHO 2006 guidelines, 2009 b,d antiretroviraltherapy based onEstimateLowestimateHighestimatecountry report,2009 dCongo 9 400 Dec 08 7 998 Dec 09 35 000 30 000 41 000 23% 19% 27% 25 000 20 000 30 000 33% 26% 41% …Cook Islands 1 Dec 08 … … … … … …Costa Rica 2 886 f Dec 08 3 064 Dec 09 4 500 3 100 6 100 68% 50% >95% 3 500 2 500 4 800 86% 64% >95% …Côte d'Ivoire 51 820 f Dec 08 72 011 Dec 09 260 000 220 000 300 000 28% 24% 32% 180 000 150 000 220 000 39% 33% 47% 164 000Croatia 398 Dec 08 441 Dec 09 95% 2 900 2 400 3 400 >95% >95% >95% 5 034Democratic People's Republic ofKorea0 Dec 08 …
towards <strong>universal</strong>Reportednumberof peoplereceivingantiretroviralLow- and middle-income countries aand yearof reporttherapy, 2008 b,c MonthReportednumberof peoplereceivingantiretroviraland yearof reporttherapy, 2009 b,c MonthEstimated number of people needingEstimated number of people needingantiretroviral therapy based on WHO Estimated antiretroviral therapy coverage antiretroviral therapy based on WHO Estimated antiretroviral therapy coverage2010 guidelines, 2009 b,d based on WHO 2010 guidelines, 2009 b 2006 guidelines, 2009 b,eEstimateLowestimateHighestimateEstimateLowestimateHighestimateEstimateLowestimateHighestimateEstimated numberof people needingbased on WHO 2006 guidelines, 2009 b,d antiretroviraltherapy based onEstimateLowestimateHighestimatecountry report,2009 dIndia 234 581 h Dec 08 320 074 h Dec 09 … g 1 100 000 1 400 000 … 23% 28% … g 580 000 890 000 … 36% 55% 580 000Indonesia 10 606 f Dec 08 15 442 Nov 09 73 000 50 000 110 000 21% 14% 31% 45 000 26 000 64 000 34% 24% 58% 40 200Iran (Islamic Republic of) 878 Sep 08 1 486 Jan 10 40 000 33 000 48 000 4% 3% 4% 23 000 18 000 29 000 6% 5% 8% 16 540Iraq 4 Dec 08 … … … … … …Jamaica 4 444 f Dec 08 7 244 Dec 09 16 000 12 000 20 000 46% 36% 62% 11 000 8 500 13 000 67% 55% 85% 14 000Jordan 58 Dec 08 63 Dec 09 … … … … …Kazakhstan 707 Dec 08 1 035 Jan 10 3 800 2 600 5 400 27% 19% 40% 2 300 1 600 3 300 45% 31% 66% 1 900Kenya 250 576 f Dec 08 336 980 Dec 09 710 000 610 000 800 000 48% 42% 55% 520 000 430 000 610 000 65% 55% 79% 555 000Kiribati 6 Dec 08 … … … … … …Kyrgyzstan 89 Dec 08 231 Jan 10 1 900
<strong>access</strong>Reportednumberof peoplereceivingantiretroviralLow- and middle-income countries aand yearof reporttherapy, 2008 b,c MonthReportednumberof peoplereceivingantiretroviraland yearof reporttherapy, 2009 b,c MonthEstimated number of people needingEstimated number of people needingantiretroviral therapy based on WHO Estimated antiretroviral therapy coverage antiretroviral therapy based on WHO Estimated antiretroviral therapy coverage2010 guidelines, 2009 b,d based on WHO 2010 guidelines, 2009 b 2006 guidelines, 2009 b,eEstimateLowestimateHighestimateEstimateLowestimateHighestimateEstimateLowestimateHighestimateEstimated numberof people needingbased on WHO 2006 guidelines, 2009 b,d antiretroviraltherapy based onEstimateLowestimateHighestimatecountry report,2009 dMozambique 128 330 Dec 08 170 198 Dec 09 570 000 500 000 650 000 30% 26% 34% 380 000 310 000 470 000 45% 36% 55% 445 672Myanmar 15 191 Dec 08 21 138 Dec 09 120 000 98 000 140 000 18% 15% 22% 75 000 60 000 89 000 28% 24% 35% 74 058Namibia 59 376 Dec 08 70 498 Sep 09 93 000 77 000 110 000 76% 62% 92% 70 000 56 000 86 000 >95% 82% >95% 76 727Nauru 0 Dec 08 … … … … … …Nepal 1 992 f Jul 08 3 226 Jul 09 31 000 26 000 36 000 11% 9% 13% 19 000 16 000 23 000 17% 14% 21% 16 950Nicaragua 744 f Dec 08 1 063 Dec 09 2 600 2 100 3 300 40% 32% 51% 1 700 1 400 2 200 62% 49% 79% 1 580Niger 2 846 Dec 08 6 445 Dec 09 29 000 26 000 31 000 22% 21% 25% 19 000 15 000 23 000 33% 28% 42% 16 738Nigeria 238 659 Dec 08 302 973 Dec 09 1 400 000 1 200 000 1 700 000 21% 18% 25% 990 000 790 000 1 200 000 31% 25% 38% 882 139Niue 0 Dec 08 … … … … … …Oman 412 Dec 08 486 Dec 09 95% 9 061Paraguay 1 613 Dec 08 2 073 Dec 09 5 600 4 200 7 400 37% 28% 49% 3 600 2 900 4 500 57% 46% 70% 3 066Peru 10 232 f Dec 08 14 780 Dec 09 40 000 33 000 48 000 37% 31% 44% 26 000 22 000 31 000 57% 47% 67% 20 201Philippines 532 Dec 08 750 Dec 09 2 000 1 000 2 800 37% 27% 75% 1 300 95% 919Poland 3 822 Dec 08 4 329 Dec 09 20 000 14 000 27 000 22% 16% 31% 17 000 12 000 22 000 26% 19% 35% 5 000Republic of Moldova 682 Dec 08 984 Dec 09 5 800 4 800 7 200 17% 14% 20% 3 500 2 900 4 400 28% 22% 34% 2 780Romania 7 434 Dec 08 7 244 Dec 09 9 000 5 300 13 000 81% 55% >95% 7 700 4 700 10 000 95% 71% >95% 7 244Russian Federation 54 900 Dec 08 75 900 Dec 09 … g 320 000 460 000 … 16% 24% … g 180 000 280 000 … 27% 42% 79 116Rwanda 63 149 Dec 08 76 726 Dec 09 88 000 71 000 100 000 88% 74% >95% 72 000 55 000 88 000 >95% 87% >95% 104 900Sa<strong>int</strong> Kitts and Nevis … … … … … … …Sa<strong>int</strong> Lucia 85 f Dec 08 124 Dec 09 … … … … 134Sa<strong>int</strong> Vincent and the Grenadines 120 f Dec 08 162 Dec 09 … … … … 182Samoa 8 Dec 08 … … … … … …Sao Tome and Principe 109 Dec 08 169 Dec 09 … … … … 1 096Senegal 9 252 f Dec 08 12 249 Dec 09 24 000 20 000 28 000 51% 43% 62% 17 000 13 000 21 000 72% 58% 92% 16 198Serbia 842 Dec 08 790 Dec 09 2 100 1 600 2 700 38% 30% 51% 1 400 1 100 1 800 55% 44% 75% 950Seychelles 113 Dec 08 139 Dec 09 … … … … 146PROGRESS REPORT 2010117
towards <strong>universal</strong>Reportednumberof peoplereceivingantiretroviralLow- and middle-income countries aand yearof reporttherapy, 2008 b,c MonthReportednumberof peoplereceivingantiretroviraland yearof reporttherapy, 2009 b,c MonthEstimated number of people needingEstimated number of people needingantiretroviral therapy based on WHO Estimated antiretroviral therapy coverage antiretroviral therapy based on WHO Estimated antiretroviral therapy coverage2010 guidelines, 2009 b,d based on WHO 2010 guidelines, 2009 b 2006 guidelines, 2009 b,eEstimateLowestimateHighestimateEstimateLowestimateHighestimateEstimateLowestimateHighestimateEstimated numberof people needingbased on WHO 2006 guidelines, 2009 b,d antiretroviraltherapy based onEstimateLowestimateHighestimatecountry report,2009 dSierra Leone 1 950 f Feb 09 3 660 Dec 09 20 000 16 000 24 000 18% 15% 23% 13 000 9 400 16 000 29% 22% 39% 7 277Slovakia 97 Dec 08 …
towards <strong>universal</strong>Annex 4. Reported number of people receiving antiretroviral therapy in low- and middle-income countries by sex and by age, and estimatednumber of children receiving and needing antiretroviral therapy and coverage percentages, 2009Estimated number of children Estimated antiretroviral therapyon UNAIDS/WHO methods, 2009 b 2009 cneeding antiretroviral therapy based coverage among children, DecemberReported number of males and females receiving antiretroviral therapy Reported number of adults and children receiving antiretroviral therapyMonth andMonth andAdultsChildrenyear of Males % of total Females % of total year of% of total% of total Estimate(+15)(
<strong>access</strong>Estimated number of children Estimated antiretroviral therapyon UNAIDS/WHO methods, 2009 b 2009 cneeding antiretroviral therapy based coverage among children, DecemberReported number of males and females receiving antiretroviral therapy Reported number of adults and children receiving antiretroviral therapyMonth andMonth andAdultsChildrenyear of Males % of total Females % of total year of% of total% of total Estimate(+15)(
towards <strong>universal</strong>Estimated number of children Estimated antiretroviral therapyon UNAIDS/WHO methods, 2009 b 2009 cneeding antiretroviral therapy based coverage among children, DecemberReported number of males and females receiving antiretroviral therapy Reported number of adults and children receiving antiretroviral therapyMonth andMonth andAdultsChildrenyear of Males % of total Females % of total year of% of total% of total Estimate(+15)(
<strong>access</strong>Estimated number of children Estimated antiretroviral therapyon UNAIDS/WHO methods, 2009 b 2009 cneeding antiretroviral therapy based coverage among children, DecemberReported number of males and females receiving antiretroviral therapy Reported number of adults and children receiving antiretroviral therapyMonth andMonth andAdultsChildrenyear of Males % of total Females % of total year of% of total% of total Estimate(+15)(
towards <strong>universal</strong>Estimated number of children Estimated antiretroviral therapyon UNAIDS/WHO methods, 2009 b 2009 cneeding antiretroviral therapy based coverage among children, DecemberReported number of males and females receiving antiretroviral therapy Reported number of adults and children receiving antiretroviral therapyMonth andMonth andAdultsChildrenyear of Males % of total Females % of total year of% of total% of total Estimate(+15)(95%Sa<strong>int</strong> Kitts and Nevis … … … … … …Sa<strong>int</strong> Lucia Dec 09 59 48% 65 52% Dec 09 121 98% 3 2% … …Sa<strong>int</strong> Vincent and the Grenadines Dec 09 87 54% 75 46% Dec 09 159 98% 3 2% … …Samoa … … … … … …Sao Tome and Principe Dec 09 62 37% 107 63% Dec 08 e 104 95% 5 5% … …Senegal Dec 09 4 427 36% 7 822 64% Dec 09 11 455 94% 794 6% … 1 600 4 300 … 18% 51%Serbia Dec 09 598 76% 192 24% Dec 09 779 99% 11 1% …
<strong>access</strong>Estimated number of children Estimated antiretroviral therapyon UNAIDS/WHO methods, 2009 b 2009 cneeding antiretroviral therapy based coverage among children, DecemberReported number of males and females receiving antiretroviral therapy Reported number of adults and children receiving antiretroviral therapyMonth andMonth andAdultsChildrenyear of Males % of total Females % of total year of% of total% of total Estimate(+15)(95%United Republic of Tanzania Sep 09 d 70 558 36% 126 854 64% Dec 08 186 591 94% 12 822 6% 75 000 38 000 110 000 17% 11% 34%Uruguay … … Dec 06 2 350 94% 160 6% … 95%Yemen Dec 08 e 123 65% 66 35% Dec 08 e 265 97% 9 3% … …Zambia Dec 09 124 189 44% 159 674 56% Dec 09 262 743 93% 21 120 7% 59 000 32 000 82 000 36% 26% 65%Zimbabwe Dec 08 d 49 701 37% 85 625 63% Feb 10 197 068 90% 21 521 10% 71 000 43 000 95 000 30% 23% 50%... Data not available or not applicable.a See the country classification by income, level of the epidemic and geographical, UNAIDS, UNICEF and WHO regions (Annex 7).b The needs estimates are based on the methods described in the explanatory notes to the annexes. The estimates for individual countries may differ according to the local methods used.c The coverage estimates are based on the estimated unrounded numbers of children receiving antiretroviral therapy and the estimated unrounded need for antiretroviral therapy (based on UNAIDS/WHO methodology).The ranges in coverage estimates are based on plausibility bounds in the denominator: that is, low and high estimates of need.Po<strong>int</strong> estimates and ranges are given for countries with a generalized epidemic, whereas only ranges are given for countries with a low or concentrated epidemic.d The latest available breakdowns refer to partial or cumulative data sets and do not reflect national-level data. See Annex 3 for national-level data.e The latest available breakdowns are not as recent as the latest reported national-level data. See Annex 3 for the latest reported national-level data.f Estimates of the number of children needing antitretroviral therapy are currently being reviewed and will be adjusted, as appropriate, based on ongoing data collection and analysis.g Breakdowns by sex and age groups were only received for northern Sudan, therefore data should be <strong>int</strong>erpreted cautiously.PROGRESS REPORT 2010125
towards <strong>universal</strong>Annex 5. Preventing mother-to-child transmission of HIV in low- and middle-income countries, 2009Infants born to womenNumber of pregnantEstimated number of pregnant women Estimated percentage of pregnant womenliving with HIV receiving Infants born to womenwomen living withliving with HIV needing antiretrovirals for living with HIV <strong>who</strong> received antiretroviralsantiretrovirals forliving with HIV receivingHIV <strong>who</strong> receivedpreventing mother-to-child transmission for preventing mother-to-childPregnant women tested preventing mother-to-child co-trimoxazole prophylaxisantiretrovirals forbased on UNAIDS/WHO methods b transmission c for HIVtransmissionwithin two months of birthpreventing mother-tochildtransmission PeriodEstimateLow- and middle-income countries a Low Highestimate estimateEstimateLow High Reported Estimated Reported Estimated Reported Estimated Reportedestimate estimate number coverage number coverage number coverage numberAfghanistan … … … … ... ... …Infants born to womenliving with HIV receivinga virological test by twomonths of ageEstimatedcoverageAlbania … … … … … … …Algeria 65 Jan 09–Dec 09 … 95% …Armenia 13 Jan 09–Dec 09 … 95% … 2 306 d 32%Bulgaria 9 Jan 09–Dec 09 …
<strong>access</strong>Infants born to womenNumber of pregnantEstimated number of pregnant women Estimated percentage of pregnant womenliving with HIV receiving Infants born to women Infants born to womenwomen living withliving with HIV needing antiretrovirals for living with HIV <strong>who</strong> received antiretroviralsantiretrovirals forliving with HIV receiving living with HIV receivingHIV <strong>who</strong> receivedpreventing mother-to-child transmission for preventing mother-to-childPregnant women tested preventing mother-to-child co-trimoxazole prophylaxis a virological test by twoantiretrovirals forbased on UNAIDS/WHO methods b transmission c for HIVtransmissionwithin two months of birth months of agepreventing mother-tochildtransmission PeriodEstimateLow- and middle-income countries a Low Highestimate estimateEstimateLow High Reported Estimated Reported Estimated Reported Estimated Reported Estimatedestimate estimate number coverage number coverage number coverage number coverageColombia 519 Jan 09–Dec 09 …
towards <strong>universal</strong>Infants born to womenNumber of pregnantEstimated number of pregnant women Estimated percentage of pregnant womenliving with HIV receiving Infants born to womenwomen living withliving with HIV needing antiretrovirals for living with HIV <strong>who</strong> received antiretroviralsantiretrovirals forliving with HIV receivingHIV <strong>who</strong> receivedpreventing mother-to-child transmission for preventing mother-to-childPregnant women tested preventing mother-to-child co-trimoxazole prophylaxisantiretrovirals forbased on UNAIDS/WHO methods b transmission c for HIVtransmissionwithin two months of birthpreventing mother-tochildtransmission PeriodEstimateLow- and middle-income countries a Low Highestimate estimateEstimateLow High Reported Estimated Reported Estimated Reported Estimated Reportedestimate estimate number coverage number coverage number coverage numberGuyana 183 Jan 09–Dec 09 … 95% 206 >95% 97 p 98% …Infants born to womenliving with HIV receivinga virological test by twomonths of ageEstimatedcoverageHaiti 2 960 Jan 09–Dec 09 5 000 2 600 7 500 60% 39% >95% 154 835 57% … 448 d 9% …Honduras 255 Jan 09–Dec 09 …
<strong>access</strong>Infants born to womenNumber of pregnantEstimated number of pregnant women Estimated percentage of pregnant womenliving with HIV receiving Infants born to womenwomen living withliving with HIV needing antiretrovirals for living with HIV <strong>who</strong> received antiretroviralsantiretrovirals forliving with HIV receivingHIV <strong>who</strong> receivedpreventing mother-to-child transmission for preventing mother-to-childPregnant women tested preventing mother-to-child co-trimoxazole prophylaxisantiretrovirals forbased on UNAIDS/WHO methods b transmission c for HIVtransmissionwithin two months of birthpreventing mother-tochildtransmission PeriodEstimateLow- and middle-income countries a Low Highestimate estimateEstimateLow High Reported Estimated Reported Estimated Reported Estimated Reportedestimate estimate number coverage number coverage number coverage numberMauritius 41 Jan 09–Dec 09 …
towards <strong>universal</strong>Infants born to womenNumber of pregnantEstimated number of pregnant women Estimated percentage of pregnant womenliving with HIV receiving Infants born to womenwomen living withliving with HIV needing antiretrovirals for living with HIV <strong>who</strong> received antiretroviralsantiretrovirals forliving with HIV receivingHIV <strong>who</strong> receivedpreventing mother-to-child transmission for preventing mother-to-childPregnant women tested preventing mother-to-child co-trimoxazole prophylaxisantiretrovirals forbased on UNAIDS/WHO methods b transmission c for HIVtransmissionwithin two months of birthpreventing mother-tochildtransmission PeriodEstimateLow- and middle-income countries a Low Highestimate estimateEstimateLow High Reported Estimated Reported Estimated Reported Estimated Reportedestimate estimate number coverage number coverage number coverage numberSa<strong>int</strong> Kitts and Nevis 1 Jan 09–Dec 09 … … … ... … …Infants born to womenliving with HIV receivinga virological test by twomonths of ageEstimatedcoverageSa<strong>int</strong> Lucia 6 Jan 09–Dec 09 … … … ... … …Sa<strong>int</strong> Vincent and the Grenadines 14 Jan 09–Dec 09 … … 2 635 e >95% 15 … 14 … 14 …Samoa … … … … ... … …Sao Tome and Principe 11 Jan 09–Dec 09 … … 6 475 e >95% 17 … 17 … …Senegal 917 Jan 09–Dec 09 … 2 000 5 900 … 16% 45% 166 830 35% 433 11% … 339 9%Serbia 2 Jan 08–Dec 08 …
<strong>access</strong>Infants born to womenNumber of pregnantEstimated number of pregnant women Estimated percentage of pregnant womenliving with HIV receiving Infants born to women Infants born to womenwomen living withliving with HIV needing antiretrovirals for living with HIV <strong>who</strong> received antiretroviralsantiretrovirals forliving with HIV receiving living with HIV receivingHIV <strong>who</strong> receivedpreventing mother-to-child transmission for preventing mother-to-childPregnant women tested preventing mother-to-child co-trimoxazole prophylaxis a virological test by twoantiretrovirals forbased on UNAIDS/WHO methods b transmission c for HIVtransmissionwithin two months of birth months of agepreventing mother-tochildtransmission PeriodEstimateLow- and middle-income countries a Low Highestimate estimateEstimateLow High Reported Estimated Reported Estimated Reported Estimated Reported Estimatedestimate estimate number coverage number coverage number coverage number coverageUganda 46 948 Jan 09–Dec 09 88 000 48 000 130 000 53% 37% >95% 968 157 * 64% 24 554 28% … 5 607 6%Ukraine 3 645 Jan 09–Dec 09 … 1 200 4 800 … 76% >95% 555 535 e >95% 3 840 >95% 3 021 >95% 2 033 69%United Republic of Tanzania 58 833 Jan 09–Dec 09 84 000 45 000 120 000 70% 48% >95% 1 194 172 66% 43 119 51% 8 348 ** 10% 11 345 13%Uruguay 70 Jan 08–Dec 08 … 95% 26 743 39% 25 139 37% 35 824 53%Zimbabwe 28 208 Jan 09–Dec 09 50 000 28 000 69 000 56% 41% >95% 175 223 46% 17 331 35% 13 852 28% …a See the country classification by income, level of the epidemic and geographical, UNAIDS, UNICEF and WHO regions.b The needs estimates are based on the methods described in the explanatory notes to the annexes and in Box 5.7. The estimates for individual countries may differ according to the local methods used.c The coverage estimates are based on the numbers of pregnant women living with HIV receiving antiretrovirals and the estimated unrounded need for antiretrovirals (based on UNAIDS/WHO methods). The ranges in coverage estimates are based on plausibility bounds in the denominator: that is, low and highestimates of need. Po<strong>int</strong> estimates and ranges are given for countries with a generalized epidemic, whereas only ranges are given for countries with a low-level or concentrated epidemic.d The latest reported data are to December 2008.e The reported number of pregnant women tested for HIV was higher than the estimated number of pregnant women, implying a coverage of >100%. Last year, coverage was already >95% in these countries, thus in the regional and global analysis, data are adjusted to represent the same coverage as last year.f Data are from 323 out of 364 maternity hospitals with PMTCT services.g The latest reported data are to December 2007.h Number of tests were reported, as tests for women <strong>who</strong> tested more than once at ANC, labour/delivery and postpartum cannot be deduplicated.i The data may include double-counting.j The data cannot specify whether data reported were for infants within two months of birth, but the policy is for all infants to start co-trimoxazole at 6 weeks of age. Data suggest that around two-thirds of infants <strong>who</strong> started cotrimoxazole, started within two months of birth.k Data are collected from 453 priority counties out of a total of 2860.l Estimates of the number of pregnant women living with HIV needing antiretrovirals for preventing mother-to-child transmission are currently being reviewed and will be adjusted, as appropriate, based on ongoing data collection and analysis. Therefore, some countries have requested that only a range bepublished or no needs estimates at all.m Data reported in 2009 is lower than reported value of 2 450 in 2008. This is due to transition from the old regimen of single-dose nevirapine to the new regimen of single-dose Nevirapine at birth and Zidovudine and Lamivudine for 1 or 6 weeks as relevant, which were both still used in 2008. Now only thenew regimen is used and is still being scaled up.n Only partial data were collected.o Data are based on the number of pregnant women having <strong>access</strong> to antenatal clinics/maternity hospitals <strong>who</strong> know their HIV status.p Data are collected on a monthly data reporting form at 6 weeks, not at 2 months. Therefore, some infants may be lost to follow up.q The latest data reported are to August 2007.r Data may be under-reported.s Only public data were reported, which represent about 70% of total ANC cases.t Four out of ten implementing partners reported for this indicator.u The data are from three of four paediatric care clinics.PROGRESS REPORT 2010131
towards <strong>universal</strong>v A data value of 26 was reported. The data value was from one site only and for the period September-November 2009.w Russian Federation reported 4 827 215 pregnant women being tested for HIV. As the number of pregnant women tested likely reflects double or triple counting, 95% of the estimated number of births in Russia (1 545 359) was used as a proxy and most likely represents the total number of tests conductedamong pregnant women.x Two separate reports were received from Sudan: Northern Sudan reported 19 986 for the period between January-December 2009; southern Sudan reported 13 141 to November 2009, giving a total of 33 127.y Two separate reports were received from Sudan: Northern Sudan reported 34 for the period between January-December 2009; southern Sudan reported 22 to November 2009, giving a total of 56.z Two separate reports were received from Sudan: Northern Sudan reported 34 for the period between January-December 2009; southern Sudan reported “no data” stating that services have just been initiated and co-trimoxazole was initially not part of the supplies for PMTCT. Data for southern Sudan areexpected to be ready in next reporting period.* The data are reported for the period July 2008-July 2009.** Data are under-reported.*** In 2009, there was a substantial increase in the number of pregnant women tested for HIV, up from the last reported value of 58 063 in 2007. Previously, only those pregnant women with risky behaviour or those <strong>who</strong> had sexual partners with risky behaviour were recommended for VCT. Now all pregnantwomen are now recommended for VCT; however, only 77% of pregnant women were reached through VCT by the end of 2009.† Data were collected from Northern District Hospital, Vila Central Hospital, Leneakel Hospital, Lolowai Hospital and Norsup Hospital.‡ Data are based on total number tested and received results.132 TOWARDS UNIVERSAL ACCESS: Scaling up priority HIV/AIDS <strong>int</strong>erventions in the health sector
<strong>access</strong>Annex 6. Estimated numbers of people (all ages combined) and children younger than 15 years receiving and needing antiretroviral therapy and antiretroviralsfor preventing mother-to-child transmission and coverage percentages in low- and middle-income countries by WHO and UNICEF regions, 2009Estimated percentageEstimated number of of pregnant womenpregnant women with HIV living with HIV receivingneeding antiretrovirals for antiretrovirals forpreventing mother-tochildtransmission, 2009 child transmission, 2009preventing mother-to-[range] a [range] ba 2009Number of pregnantEstimated number of children needing antiretroviral therapy, 2009 [range] a Antiretroviral therapy coverage among children, December2009 [range] b women living withHIV receivingantitretrovirals forpreventing motherto-childtransmission,Number of childrenEstimated number of peopleyounger than 15 yearsneeding antiretroviral Antiretroviral therapy receiving antiretroviraltherapy based on 2010 coverage, December therapy, Decemberguidelines, 2009 [range] a 2009 [range] b 2009Number of people (allages combined) receivingantiretroviral therapy,December 2009WHO Regions54%[41–84%]1 240 000[800 000–1 700 000]672 90026%[19–42%]1 140 000[710 000–1 500 000]296 10037%[34–40%]10 600 000[9 700 000–11 500 000]African Region 3 912 00054%[39–83%]29 900[19 000–41 000]16 20058%[45–80%]32 200[23 000–42 000]18 60050%[46–59%]950 000[810 000–1 000 000]Region of the Americas 4780002%[2–4%]20 500[13 000–29 000]4904%[3–7%]13 300[8 400–18 000]5707%[6–8%]180 000[160 000–210 000]Eastern Mediterranean Region 12 80093%[63%–>95%]15 300[8 000–23 000]14 30049%[31–84%]9 800[5 700–15 000]4 80019%[16–21%]610 000[550 000–700 000]European Region 115 00034%[21–62%]57 400[31 000–94 000]19 50042%[23–61%]67 500[46 000–120 000]28 10032%[25–39%]1 800 000[1 500 000–2 300 000]South–East Asia Region 577 00032%[22–51%]13 500[8 400–19 000]4 30061%[46–84%]13 600[9 900–18 000]8 30033%[28–40%]490 000[400 000–570 000]Western Pacific Region 160 00053%[40–79%]1 380 000[920 000–1 800 000]727 60028%[21–43%]1 270 000[830 000–1 700 000]356 40036%[33–39%]14 600 000[13 500 000–15 800 000]All low- and middle-income countries 5 254 000UNICEF Regions53%[40–83%]1 260 000[810 000–1 700 000]673 30026%[19–41%]1 150 000[720 000–1 500 000]296 50037%[34–40%]10 700 000[9 800 000–11 600 000]Africa c 3 921 00053%[40–83%]1 260 000[810 000–1 700 000]673 10026%[19–41%]1 150 000[720 000–1 500 000]296 20037%[34–40%]10 700 000[9 700 000–11 600 000]Sub-Saharan Africa d 3 916 00068%[53–>95%]860 000[600 000–1 100 000]584 70032%[25–48%]790 000[530 000–1 000 000]254 90041%[38–45%]7 700 000[7 200 000–8 300 000]Eastern and Southern Africa 3 203 00023%[16–44%]380 000[200 000–560 000]88 10012%[8–22%]350 000[180 000–510 000]41 00025%[22–28%]2 900 000[2 500 000–3 200 000]Western and Central Africa 709 0003%[2–5%]16 400[9 600–23 000]5306%[4–9%]10 800[6 700–15 000]6009%[8–10%]140 000[120 000–160 000]North Africa and the Middle East 12 40054%[39–83%]29 900[19 000–41 000]16 20058%[45–80%]32 200[23 000–42 000]18 60050%[46–59%]950 000[810 000–1 100 000]Latin America and the Caribbean 478 00033%[22–52%]73 200[45 000–110 000]23 80044%[27–60%]82 700[61 000–140 000]36 40031%[26–37%]2 400 000[2 000 000–2 900 000]Asia 738 00047%[31–68%]26 200[18 000–40 000]12 40066%[55–85%]27 500[21 000–33 000]18 20040%[36–47%]1 000 000[660 000–1 300 000]East Asia and Pacific 412 00024%[15–50%]46 800[23 000–78 000]11 40033%[17–51%]55 100[36 000–110 000]18 20025%[17–33%]1 300 000[990 000–1 900 000]South Asia 325 00094%[63%–>95%]15 100[7 600–22 000]14 10048%[30–82%]9 700[5 700–15 000]4 60019%[16–21%]590 000[530 000–680 000]Central and Eastern Europe and theCommonwealth of Independent States e 109 00053%[40–79%]1 380 000[920 000–1 800 000]727 40028%[21–43%]1 270 000[830 000–1 700 000]356 20036%[33–39%]14 600 000[13 500 000–15 700 000]All low- and middle-income countries 5 248 000Note: Some groups do not add up to the total due to rounding.a For an explanation of the methods used, see the explanatory notes for annexes.b The coverage estimate is based on the unrounded estimated numbers of people receiving and needing antiretroviral therapy. Ranges of the levels of coverage are based on the uncerta<strong>int</strong>y ranges around the estimates of need.c Africa includes all countries in the Eastern and Southern Africa region, all countries in the West and Central Africa region and the following countries in the Middle East and North Africa region: Algeria, Djibouti, Egypt, Libyan Arab Jamahiriya, Morocco, Sudan and Tunisia.d UNICEF includes values from Djibouti and Sudan in the total for sub-Saharan Africa, while the values for these countries are excluded for the subregions in Africa.e UNICEF classifies five low- and middle-income countries (Hungary, Latvia, Lithuania, Poland and Slovakia) as industrialized countries, and their values are not included in these totals.PROGRESS REPORT 2010133
towards <strong>universal</strong>Annex 7. Classification of low- and middle-income countries by income level, epidemic level, and geographical UNAIDS, UNICEF and WHO regionsCountry Classification of economy Level of epidemic Geographical region UNAIDS region UNICEF region WHO regionAfghanistan Low income Low East, South and South-East Asia South and South-East Asia South Asia Eastern Mediterranean RegionAlbania Lower–middle income Low Europe and Central Asia Western and Central Europe Central and Eastern Europe and the Commonwealth of Independent States European RegionAlgeria Lower–middle income Low Middle East and North Africa Middle East and North Africa Middle East and North Africa African RegionAngola Lower–middle income Generalized Sub-Saharan Africa Sub-Saharan Africa Eastern and Southern Africa African RegionArgentina Upper–middle income Concentrated Latin America and the Caribbean Central and South America Latin America and Caribbean Region of the AmericasArmenia Lower–middle income Concentrated Europe and Central Asia Eastern Europe and Central Asia Central and Eastern Europe and the Commonwealth of Independent States European RegionAzerbaijan Lower–middle income Low Europe and Central Asia Eastern Europe and Central Asia Central and Eastern Europe and the Commonwealth of Independent States European RegionBangladesh Low income Low East, South and South-East Asia South and South-East Asia South Asia South-East Asia RegionBelarus Lower–middle income Concentrated Europe and Central Asia Eastern Europe and Central Asia Central and Eastern Europe and the Commonwealth of Independent States European RegionBelize Upper–middle income Concentrated Latin America and the Caribbean Central and South America Latin America and Caribbean Region of the AmericasBenin Low income Generalized Sub-Saharan Africa Sub-Saharan Africa West and Central Africa African RegionBhutan Lower–middle income Low East, South and South-East Asia South and South-East Asia South Asia South-East Asia RegionBolivia (Plurinational State of) Lower–middle income Concentrated Latin America and the Caribbean Central and South America Latin America and Caribbean Region of the AmericasBosnia and Herzegovina Lower–middle income Low Europe and Central Asia Western and Central Europe Central and Eastern Europe and the Commonwealth of Independent States European RegionBotswana Uppermiddle income Generalized Sub-Saharan Africa Sub-Saharan Africa Eastern and Southern Africa African RegionBrazil Upper–middle income Concentrated Latin America and the Caribbean Central and South America Latin America and Caribbean Region of the AmericasBulgaria Upper–middle income Low Europe and Central Asia Western and Central Europe Central and Eastern Europe and the Commonwealth of Independent States European RegionBurkina Faso Low income Generalized Sub-Saharan Africa Sub-Saharan Africa West and Central Africa African RegionBurundi Low income Generalized Sub-Saharan Africa Sub-Saharan Africa Eastern and Southern Africa African RegionCambodia Low income Concentrated East, South and South-East Asia South and South-East Asia East Asia and the Pacific Western Pacific RegionCameroon Lower–middle income Generalized Sub-Saharan Africa Sub-Saharan Africa West and Central Africa African RegionCape Verde Lower–middle income Generalized Sub-Saharan Africa Sub-Saharan Africa West and Central Africa African RegionCentral African Republic Low income Generalized Sub-Saharan Africa Sub-Saharan Africa West and Central Africa African RegionChad Low income Generalized Sub-Saharan Africa Sub-Saharan Africa West and Central Africa African RegionChile Upper–middle income Concentrated Latin America and the Caribbean Central and South America Latin America and Caribbean Region of the AmericasChina Lower–middle income Concentrated East, South and South-East Asia East Asia East Asia and the Pacific Western Pacific RegionColombia Lower–middle income Concentrated Latin America and the Caribbean Central and South America Latin America and Caribbean Region of the AmericasComoros Low income Concentrated Sub-Saharan Africa Sub-Saharan Africa Eastern and Southern Africa African RegionCongo Low income Generalized Sub-Saharan Africa Sub-Saharan Africa West and Central Africa African RegionCook Islands Lower–middle income Oceania Oceania East Asia and the Pacific Western Pacific Region134 TOWARDS UNIVERSAL ACCESS: Scaling up priority HIV/AIDS <strong>int</strong>erventions in the health sector
<strong>access</strong>Country Classification of economy Level of epidemic Geographical region UNAIDS region UNICEF region WHO regionCosta Rica Upper–middle income Concentrated Latin America and the Caribbean Central and South America Latin America and Caribbean Region of the AmericasCôte d'Ivoire Low income Generalized Sub-Saharan Africa Sub-Saharan Africa West and Central Africa African RegionCroatia Upper–middle income Low Europe and Central Asia Western and Central Europe Central and Eastern Europe and the Commonwealth of Independent States European RegionCuba Lower middle income Low Latin America and the Caribbean Caribbean Latin America and Caribbean Region of the AmericasDemocratic People's Republic of Korea Not a <strong>World</strong> Bank member Low East, South and South-East Asia East Asia East Asia and the Pacific South-East Asia RegionDemocratic Republic of the Congo Low income Generalized Sub-Saharan Africa Sub-Saharan Africa West and Central Africa African RegionDjibouti a Lower–middle income Generalized Middle East and North Africa Middle East and North Africa Middle East and North Africa Eastern Mediterranean RegionDominica Upper–middle income Latin America and the Caribbean Caribbean Latin America and Caribbean Region of the AmericasDominican Republic Lower–middle income Concentrated Latin America and the Caribbean Caribbean Latin America and Caribbean Region of the AmericasEcuador Lower–middle income Concentrated Latin America and the Caribbean Central and South America Latin America and Caribbean Region of the AmericasEgypt Lower–middle income Low Middle East and North Africa Middle East and North Africa Middle East and North Africa Eastern Mediterranean RegionEl Salvador Lower–middle income Concentrated Latin America and the Caribbean Central and South America Latin America and Caribbean Region of the AmericasEquatorial Guinea Upper–middle income Generalized Sub-Saharan Africa Sub-Saharan Africa West and Central Africa African RegionEritrea Low income Generalized Sub-Saharan Africa Sub-Saharan Africa Eastern and Southern Africa African RegionEthiopia Low income Generalized Sub-Saharan Africa Sub-Saharan Africa Eastern and Southern Africa African RegionFiji Lower–middle income Low Oceania Oceania East Asia and the Pacific Western Pacific RegionGabon Upper–middle income Generalized Sub-Saharan Africa Sub-Saharan Africa West and Central Africa African RegionGambia Low income Concentrated Sub-Saharan Africa Sub-Saharan Africa West and Central Africa African RegionGeorgia Lower–middle income Low Europe and Central Asia Eastern Europe and Central Asia Central and Eastern Europe and the Commonwealth of Independent States European RegionGhana Low income Generalized Sub-Saharan Africa Sub-Saharan Africa West and Central Africa African RegionGrenada Upper–middle income Latin America and the Caribbean Caribbean Latin America and Caribbean Region of the AmericasGuatemala Lower–middle income Concentrated Latin America and the Caribbean Central and South America Latin America and Caribbean Region of the AmericasGuinea Low income Generalized Sub-Saharan Africa Sub-Saharan Africa West and Central Africa African RegionGuinea-Bissau Low income Generalized Sub-Saharan Africa Sub-Saharan Africa West and Central Africa African RegionGuyana Lower–middle income Concentrated Latin America and the Caribbean Central and South America Latin America and Caribbean Region of the AmericasHaiti Low income Generalized Latin America and the Caribbean Caribbean Latin America and Caribbean Region of the AmericasHonduras Lower–middle income Concentrated Latin America and the Caribbean Central and South America Latin America and Caribbean Region of the AmericasHungary Upper–middle income Low Europe and Central Asia Western and Central Europe Industrialized countries European RegionIndia Low income Concentrated East, South and South-East Asia South and South-East Asia South Asia South-East Asia RegionIndonesia Lower–middle income Concentrated East, South and South-East Asia South and South-East Asia East Asia and the Pacific South-East Asia RegionIran (Islamic Republic of) Lower–middle income Low East, South and South-East Asia Middle East and North Africa Middle East and North Africa Eastern Mediterranean RegionIraq Lower–middle income Low Middle East and North Africa Middle East and North Africa Middle East and North Africa Eastern Mediterranean RegionPROGRESS REPORT 2010135
towards <strong>universal</strong>Country Classification of economy Level of epidemic Geographical region UNAIDS region UNICEF region WHO regionJamaica Lower–middle income Concentrated Latin America and the Caribbean Caribbean Latin America and Caribbean Region of the AmericasJordan Lower–middle income Low Middle East and North Africa Middle East and North Africa Middle East and North Africa Eastern Mediterranean RegionKazakhstan Upper–middle income Concentrated Europe and Central Asia Eastern Europe and Central Asia Central and Eastern Europe and the Commonwealth of Independent States European RegionKenya Low income Generalized Sub-Saharan Africa Sub-Saharan Africa Eastern and Southern Africa African RegionKiribati Lower–middle income Oceania Oceania East Asia and the Pacific Western Pacific RegionKyrgyzstan Low income Concentrated Europe and Central Asia Eastern Europe and Central Asia Central and Eastern Europe and the Commonwealth of Independent States European RegionLao People's Democratic Republic Low income Low East, South and South-East Asia South and South-East Asia East Asia and the Pacific Western Pacific RegionLatvia Upper–middle income Concentrated Europe and Central Asia Western and Central Europe Industrialized countries European RegionLebanon Upper–middle income Low Middle East and North Africa Middle East and North Africa Middle East and North Africa Eastern Mediterranean RegionLesotho Lower–middle income Generalized Sub-Saharan Africa Sub-Saharan Africa Eastern and Southern Africa African RegionLiberia Low income Generalized Sub-Saharan Africa Sub-Saharan Africa West and Central Africa African RegionLibyan Arab Jamahiriya Upper–middle income Low Middle East and North Africa Middle East and North Africa Middle East and North Africa Eastern Mediterranean RegionLithuania Upper–middle income Low Europe and Central Asia Western and Central Europe Industrialized countries European RegionMadagascar Low income Concentrated Sub-Saharan Africa Sub-Saharan Africa Eastern and Southern Africa African RegionMalawi Low income Generalized Sub-Saharan Africa Sub-Saharan Africa Eastern and Southern Africa African RegionMalaysia Upper–middle income Concentrated East, South and South-East Asia South and South-East Asia East Asia and the Pacific Western Pacific RegionMaldives Lower–middle income Low East, South and South-East Asia South and South-East Asia South Asia South-East Asia RegionMali Low income Concentrated Sub-Saharan Africa Sub-Saharan Africa West and Central Africa African RegionMarshall Islands Lower–middle income Oceania Oceania East Asia and the Pacific Western Pacific RegionMauritania Low income Concentrated Sub-Saharan Africa Sub-Saharan Africa West and Central Africa African RegionMauritius Upper–middle income Concentrated Sub-Saharan Africa Sub-Saharan Africa Eastern and Southern Africa African RegionMexico Upper–middle income Concentrated Latin America and the Caribbean North America Latin America and Caribbean Region of the AmericasMicronesia (Federated States of) Lower–middle income Oceania Oceania East Asia and the Pacific Western Pacific RegionMongolia Low income Low East, South and South-East Asia East Asia East Asia and the Pacific Western Pacific RegionMontenegro Upper–middle income Low Europe and Central Asia Western and Central Europe Central and Eastern Europe and the Commonwealth of Independent States European RegionMorocco Lower–middle income Low Middle East and North Africa Middle East and North Africa Middle East and North Africa Eastern Mediterranean RegionMozambique Low income Generalized Sub-Saharan Africa Sub-Saharan Africa Eastern and Southern Africa African RegionMyanmar Low income Concentrated East, South and South-East Asia South and South-East Asia East Asia and the Pacific South-East Asia RegionNamibia Lower–middle income Generalized Sub-Saharan Africa Sub-Saharan Africa Eastern and Southern Africa African RegionNauru Not a <strong>World</strong> Bank member Oceania Oceania East Asia and the Pacific Western Pacific RegionNepal Low income Concentrated East, South and South-East Asia South and South-East Asia South Asia South-East Asia RegionNicaragua Lower–middle income Concentrated Latin America and the Caribbean Central and South America Latin America and Caribbean Region of the Americas136 TOWARDS UNIVERSAL ACCESS: Scaling up priority HIV/AIDS <strong>int</strong>erventions in the health sector
<strong>access</strong>Country Classification of economy Level of epidemic Geographical region UNAIDS region UNICEF region WHO regionNiger Low income Concentrated Sub-Saharan Africa Sub-Saharan Africa West and Central Africa African RegionNigeria Low income Generalized Sub-Saharan Africa Sub-Saharan Africa West and Central Africa African RegionNiue Not a <strong>World</strong> Bank member Oceania Oceania East Asia and the Pacific Western Pacific RegionOman Upper–middle income Low Middle East and North Africa Middle East and North Africa Middle East and North Africa Eastern Mediterranean RegionPakistan Low income Low East, South and South-East Asia South and South-East Asia South Asia Eastern Mediterranean RegionPalau Upper–middle income Oceania Oceania East Asia and the Pacific Western Pacific RegionPanama Upper–middle income Concentrated Latin America and the Caribbean Central and South America Latin America and Caribbean Region of the AmericasPapua New Guinea Low income Generalized Oceania Oceania East Asia and the Pacific Western Pacific RegionParaguay Lower–middle income Concentrated Latin America and the Caribbean Central and South America Latin America and Caribbean Region of the AmericasPeru Lower–middle income Concentrated Latin America and the Caribbean Central and South America Latin America and Caribbean Region of the AmericasPhilippines Lower–middle income Low East, South and South-East Asia South and South-East Asia East Asia and the Pacific Western Pacific RegionPoland Upper–middle income Concentrated Europe and Central Asia Western and Central Europe Industrialized countries European RegionRepublic of Moldova Lower–middle income Concentrated Europe and Central Asia Eastern Europe and Central Asia Central and Eastern Europe and the Commonwealth of Independent States European RegionRomania Upper–middle income Low Europe and Central Asia Western and Central Europe Central and Eastern Europe and the Commonwealth of Independent States European RegionRussian Federation Upper–middle income Concentrated Europe and Central Asia Eastern Europe and Central Asia Central and Eastern Europe and the Commonwealth of Independent States European RegionRwanda Low income Generalized Sub-Saharan Africa Sub-Saharan Africa Eastern and Southern Africa African RegionSa<strong>int</strong> Kitts and Nevis Upper–middle income Latin America and the Caribbean Caribbean Latin America and Caribbean Region of the AmericasSa<strong>int</strong> Lucia Upper–middle income Latin America and the Caribbean Caribbean Latin America and Caribbean Region of the AmericasSa<strong>int</strong> Vincent and the Grenadines Upper–middle income Latin America and the Caribbean Caribbean Latin America and Caribbean Region of the AmericasSamoa Lower–middle income Oceania Oceania East Asia and the Pacific Western Pacific RegionSao Tome and Principe Low income Low Sub-Saharan Africa Sub-Saharan Africa West and Central Africa African RegionSenegal Low income Concentrated Sub-Saharan Africa Sub-Saharan Africa West and Central Africa African RegionSerbia Upper–middle income Low Europe and Central Asia Eastern Europe and Central Asia Central and Eastern Europe and the Commonwealth of Independent States European RegionSeychelles Upper–middle income Low Sub-Saharan Africa Sub-Saharan Africa Eastern and Southern Africa African RegionSierra Leone Low income Generalized Sub-Saharan Africa Sub-Saharan Africa West and Central Africa African RegionSlovakia Upper–middle income Low Europe and Central Asia Western and Central Europe Industrialized countries European RegionSolomon Islands Low income Oceania Oceania East Asia and the Pacific Western Pacific RegionSomalia Low income Concentrated Sub-Saharan Africa Middle East and North Africa Eastern and Southern Africa Eastern Mediterranean RegionSouth Africa Upper–middle income Generalized Sub-Saharan Africa Sub-Saharan Africa Eastern and Southern Africa African RegionSri Lanka Lower–middle income Low East, South and South-East Asia South and South-East Asia South Asia South-East Asia RegionSudanb Low income Generalized Middle East and North Africa Middle East and North Africa Middle East and North Africa Eastern Mediterranean RegionSuriname Lower–middle income Concentrated Latin America and the Caribbean Central and South America Latin America and Caribbean Region of the AmericasPROGRESS REPORT 2010137
towards <strong>universal</strong>Country Classification of economy Level of epidemic Geographical region UNAIDS region UNICEF region WHO regionSwaziland Lower–middle income Generalized Sub-Saharan Africa Sub-Saharan Africa Eastern and Southern Africa African RegionSyrian Arab Republic Lower–middle income Low Middle East and North Africa Middle East and North Africa Middle East and North Africa Eastern Mediterranean RegionTajikistan Low income Low Europe and Central Asia Eastern Europe and Central Asia Central and Eastern Europe and the Commonwealth of Independent States European RegionThailand Lower–middle income Concentrated East, South and South-East Asia South and South-East Asia East Asia and the Pacific South-East Asia RegionThe former Yugoslav Republic of Macedonia Lower–middle income Low Europe and Central Asia Western and Central Europe Central and Eastern Europe and the Commonwealth of Independent States European RegionTimor-Leste Low income Low East, South and South-East Asia South and South-East Asia East Asia and the Pacific South-East Asia RegionTogo Low income Generalized Sub-Saharan Africa Sub-Saharan Africa West and Central Africa African RegionTonga Lower–middle income Oceania Oceania East Asia and the Pacific Western Pacific RegionTunisia Lower–middle income Low Middle East and North Africa Middle East and North Africa Middle East and North Africa Eastern Mediterranean RegionTurkey Upper–middle income Low Middle East and North Africa Western and Central Europe Central and Eastern Europe and the Commonwealth of Independent States European RegionTurkmenistan Lower–middle income Low Europe and Central Asia Eastern Europe and Central Asia Central and Eastern Europe and the Commonwealth of Independent States European RegionTuvalu Not a <strong>World</strong> Bank member Oceania Oceania East Asia and the Pacific Western Pacific RegionUganda Low income Generalized Sub-Saharan Africa Sub-Saharan Africa Eastern and Southern Africa African RegionUkraine Lower–middle income Concentrated Europe and Central Asia Eastern Europe and Central Asia Central and Eastern Europe and the Commonwealth of Independent States European RegionUnited Republic of Tanzania Low income Generalized Sub-Saharan Africa Sub-Saharan Africa Eastern and Southern Africa African RegionUruguay Upper–middle income Concentrated Latin America and the Caribbean Central and South America Latin America and Caribbean Region of the AmericasUzbekistan Low income Concentrated Europe and Central Asia Eastern Europe and Central Asia Central and Eastern Europe and the Commonwealth of Independent States European RegionVanuatu Lower–middle income Oceania Oceania East Asia and the Pacific Western Pacific RegionVenezuela (Bolivarian Republic of) Upper–middle income Concentrated Latin America and the Caribbean Central and South America Latin America and Caribbean Region of the AmericasViet Nam Low income Concentrated East, South and South-East Asia South and South-East Asia East Asia and the Pacific Western Pacific RegionYemen Low income Low Middle East and North Africa Middle East and North Africa Middle East and North Africa Eastern Mediterranean RegionZambia Low income Generalized Sub-Saharan Africa Sub-Saharan Africa Eastern and Southern Africa African RegionZimbabwe Low income Generalized Sub-Saharan Africa Sub-Saharan Africa Eastern and Southern Africa African Regiona UNICEF classifies Djibouti both under Middle East and North Africa and sub-Saharan Africa. Unlike last year, for the analysis throughout the report, Djibouti is no longer classified as sub-SaharanAfrica, but as Middle East and North Africa.b For the analysis throughout the report, values for Sudan have been included in Middle East and North Africa based on UNAIDS classification, while UNICEF classifies Sudan both under Middle Eastand North Africa, and sub-Saharan Africa.138 TOWARDS UNIVERSAL ACCESS: Scaling up priority HIV/AIDS <strong>int</strong>erventions in the health sector
<strong>access</strong>Annex 8. List of indicators in the WHO, UNICEF and the health sector response to HIV/AIDS, 2010A Testing and counsellingA1 Percentage of health facilities that provide HIV testing and counselling servicesA2 Number of individuals aged 15 and over <strong>who</strong> received HIV testing and counselling and know their results#A3 Percentage of women and men aged 15–49 <strong>who</strong> received an HIV test in the last 12 months and <strong>who</strong> know theirresults#A5 Percentage of most-at-risk populations <strong>who</strong> received an HIV test in the last 12 months and <strong>who</strong> know their resultsC Prevention of sexual transmission of HIV and prevention of transmission through injectingdrug useC1 Number of needle and syringe programme sites per 1000 injecting drug usersC2 Number of opioid substitution therapy sites per 1000 injecting drug usersC3 Number of syringes/needles distributed per injecting drug user per year by needle and syringe programmes#C4a Percentage of injecting drug users reached with HIV prevention programmes in the last 12 months#C4b Percentage of sex workers reached with HIV prevention programmes in the last 12 months#C4c Percentage of men <strong>who</strong> have sex with men reached with HIV prevention programmes in the last 12 months#C5a Percentage of injecting drug users reporting the use of sterile injecting equipment the last time they injected#C5b Percentage of injecting drug users reporting the use of a condom the last time they had sexual <strong>int</strong>ercourse#C5c Percentage of female and male sex workers reporting the use of a condom with their most recent client#C5d Percentage of men reporting the use of a condom the last time they had anal sex with a male partner#C6a Percentage of injecting drug users <strong>who</strong> are HIV-infected#C6b Percentage of sex workers <strong>who</strong> are HIV-infected#C6c Percentage of men <strong>who</strong> have sex with men <strong>who</strong> are HIV-infectedE HIV/TB#E1 Percentage of estimated HIV-positive incident TB cases that received treatment for TB and HIVFF1F5Sexually transmitted infectionsNumber of targeted service delivery po<strong>int</strong>s for sex workers where sexually transmitted infection services are providedper 1000 sex workersPrevalence of syphilis among antenatal care attendeesG Antiretroviral therapyG1 Percentage of health facilities that offer antiretroviral therapy#G2 Percentage of adults and children with advanced HIV infection receiving antiretroviral therapy#G3a Percentage of adults and children with HIV known to be on treatment 12 months after initiation of antiretroviraltherapyG3b Percentage of adults and children with HIV known to be on treatment 24 months after initiation of antiretroviraltherapyG3c Percentage of adults and children with HIV known to be on treatment 36 months after initiation of antiretroviraltherapyG3d Percentage of adults and children with HIV known to be on treatment 48 months after initiation of antiretroviraltherapyG3e Percentage of adults and children with HIV known to be on treatment 60 months after initiation of antiretroviraltherapyHH1<strong>Health</strong> systemsPercentage of health facilities dispensing antiretrovirals that have experienced a stock-out of at least one requiredantiretroviral in the last 12 monthsPROGRESS REPORT 2010139
towards <strong>universal</strong>I Women and childrenI8 Percentage of pregnant women <strong>who</strong> were tested for HIV and received their results – during pregnancy, during labourand delivery and during the postpartum period (
<strong>access</strong>explanatory notesData collection and validationAnnex 1 presents country data on HIV testing and counselling.Annex 2 presents country data on sexually transmitted infections.Annexes 3 and 4 present country data related to antiretroviral therapy.Annex 5 presents country data on <strong>int</strong>erventions related to the prevention of mother-to-child transmission and <strong>int</strong>erventionstargeting children.Annex 6 presents breakdowns, according to WHO and UNICEF regions, of key indicators on antiretroviral therapy coverageand coverage of antiretrovirals for prevention of mother-to-child transmission.Annex 7 lists countries with epidemic and economic classifications.Annex 8 lists the indicators collected for this report.WHO, UNICEF and UNAIDS collected the data presented in these annexes through the annual reporting tool for monitoringthe health sector response to HIV/AIDS (1) (see section 1.1 in Chapter 1).The reporting tool was sent to countries in January 2010. To facilitate collaboration at the country level, the country officesof WHO, UNICEF and UNAIDS worked jo<strong>int</strong>ly with national counterparts and partner agencies to collate and validate datain a single collaborative consultation process. Data were sent by the countries to the regional offices, and to WHO andUNICEF headquarters between March and April 2010.In addition, an <strong>int</strong>ernational data reconciliation meeting was organized in April 2010 to review and cross-validate datareported to WHO, UNICEF, the UNAIDS Secretariat, the Global Fund to Fight AIDS, Tuberculosis and Malaria, and theUnited States President’s Emergency Plan for AIDS Relief. When discrepancies were identified between data reported tothe different organizations, follow-up letters were sent to UNAIDS, UNICEF and WHO country offices to liaise with nationalauthorities to seek clarification and resolve the discrepancies.Explanatory notes for Annex 1Annex 1 presents country data on the scaling up of HIV testing and counselling services for 2008–2009 and providescountry-specific data on the availability of HIV testing and counselling services in health facilities at the national level foradults in 111 (2008) and 118 (2009) low- and middle-income countries.It also provides country-specific data on the uptake of HIV testing and counselling for adults in 100 low- and middle-incomecountries.Number of health facilities with HIV testing and counselling servicesThe number of health facilities with HIV testing and counselling services is based on data summarized at the national orsubnational level as reported by countries. Aggregated data should include facilities providing services in the private andnongovernmental organization (NGO) sectors and voluntary testing and counselling sites but this is not always possiblein some countries. A total of 118 countries reported data in 2009 .Number of people ≥ 15 years of age <strong>who</strong> received HIV testing and counselling and know the resultsThe number of adults <strong>who</strong> received HIV testing and counselling and know the results is collected from routine reports fromall service po<strong>int</strong>s, which includes voluntary counselling and testing sites, clinics, hospitals and NGO outreach po<strong>int</strong>s. Dataare compiled at the district or local level and finally at the national level. A total of 100 countries reported data in 2009.PROGRESS REPORT 2010141
towards <strong>universal</strong>Explanatory Notes for Annex 2Annex 2 provides country-specific data on:• <strong>access</strong> to services for the control of sexually transmitted infections for sex workers <strong>who</strong> are at increased risk foracquiring and transmitting HIV, and• syphilis infection among antenatal care attendees.Number of targeted service delivery po<strong>int</strong>s for sex workers where services for sexually transmitted infectionare provided per 1000 sex workersThe number of targeted service delivery po<strong>int</strong>s for sex workers is derived from programme data on sexually transmittedinfection service sites as reported by countries. Size estimations of sex workers are based on UNAIDS recommendedmethods (2). A total of 51 countries provided data in 2009.Prevalence of syphilis among antenatal care attendeesData on the prevalence of syphilis among antenatal care attendees is taken from national programme records, seroprevalencesurveys, Demographic and <strong>Health</strong> Surveys (DHS), or other.Explanatory notes for Annexes 3 and 4Annexes 3 and 4 present country data on <strong>access</strong> to antiretroviral therapy.Annex 3 provides country-specific data on <strong>access</strong> to antiretroviral therapy at the national level for all age groups in 149low- and middle-income countries, of which 135 countries were able to report data for 2009. In addition, the report presentsthe most recent available data from high income countries. Data from the private sector have been provided as footnotes.Annex 4 provides data on <strong>access</strong> to antiretroviral therapy disaggregated by sex and by age (adults – 15 years and older, andchildren – less than 15 years) for low- and middle-income countries. Data on the number of adults receiving antiretroviraltherapy are available for 136 countries, and data on the number of children receiving antiretroviral therapy are availablefor 143 countries. Overall, 105 countries provided breakdowns by age group for 2009. Data disaggregated by sex wereavailable for 119 countries.Number of people receiving antiretroviral therapyThe reported data on people currently receiving antiretroviral therapy, both in low- and middle-income countries and inhigh-income countries, were compiled from the most recent reports from health ministries or from other reliable sources <strong>int</strong>he countries, such as bilateral partners, foundations and nongovernmental agencies that are major providers of treatmentservices. WHO, UNAIDS and UNICEF work with countries to obtain as many facility-specific data as possible on the numbersof people receiving treatment.Of the 149 low- and middle-income countries, 126 countries provided data on <strong>access</strong> to antiretroviral therapy in December2009 or later. These accounted for almost 70% of the people on treatment by the end of 2009. For 7countries, includingSouth Africa, data are available for September, October or November 2009. Together, these 133 countries represent 96% ofthe total estimated number of people receiving antiretroviral therapy at the end of 2009 in low- and middle-income countries.Estimating the number of people receiving antiretroviral therapy involves some uncerta<strong>int</strong>y for countries that have not yetestablished regular reporting systems which can capture accurate data on people <strong>who</strong> initiate treatment for the first time,those <strong>who</strong> discontinue treatment, are lost to follow up and those <strong>who</strong> die.Uncerta<strong>int</strong>y may also arise because of the difficulty in measuring the extent of treatment provision in the for-profit andnot-for-profit private sector. Some people receive treatment through NGOs and/or private clinics that do not report throughofficial channels in some countries. Private companies may have programmes to support the provision of antiretroviraltherapy to workers with advanced HIV disease but do not report the data related to these programmes to the public healthauthorities in some cases.Estimating treatment need and coverageStandard methods were used for estimating the size and course of the HIV epidemic, number of people living with HIV, newinfections, mortality attributable to AIDS and treatment need (4,5). Treatment need is estimated using statistical modelling142 TOWARDS UNIVERSAL ACCESS: Scaling up priority HIV/AIDS <strong>int</strong>erventions in the health sector
<strong>access</strong>methods that include all people <strong>who</strong> meet the criteria for initiating treatment, whether or not these people know theirHIV status and their eligibility for antiretroviral therapy (Box 4.2). WHO treatment guidelines have been revised in 2009including thresholds for initiating treatment (Box 4.1), thus changing considerably the number of people estimated to bein need of antiretroviral therapy in low- and middle-income countries in 2010.The estimates of antiretroviral therapy coverage presented in Annex 3 were calculated by dividing the number of peoplereceiving antiretroviral therapy at the end of 2009 by the number of people estimated to need treatment in 2009 (based onUNAIDS/WHO methods). Ranges around the levels of coverage are based on the uncerta<strong>int</strong>y ranges around the estimatesof need (6). Some countries have developed their own methods for estimating treatment need, which could differ from theestimates derived using UNAIDS/WHO methods. To analyse and compare antiretroviral therapy coverage across countries,the report uses standardized estimates of treatment need using UNAIDS/WHO methods. Annex 3 presents also countrygenerated estimates of need based on individual country methods, but these data are not aggregated and are not used forcalculating and analysing regional and global coverage.Annex 4 reports on estimated treatment need and coverage of antiretroviral therapy for children less than 15 years bycountry in 2009.The treatment needs of children are estimated using standard UNAIDS/WHO methods (4,5), including uncerta<strong>int</strong>y ranges.The 2010 WHO treatment guidelines recommend that all HIV-infected children below 24 months be provided withantiretroviral therapy regardless of CD4 counts (5). Additional recommendations are found in Box 5.6.The estimates of antiretroviral therapy coverage for children presented in Annex 4 were calculated by dividing the numberof children receiving antiretroviral therapy at the end of 2009 by the number of children estimated to need treatment in2009 (based on UNAIDS/WHO methods). Ranges around the levels of coverage are based on the uncerta<strong>int</strong>y rangesaround the estimates of need (6).The need estimates of some countries are currently under review and therefore these countries expressed a preference thattheir estimates not to be published (or only a range), but their estimates are nevertheless used to estimate the regionalestimates and coverage.Explanatory notes for Annex 5Prevention of mother-to-child transmissionAnnex 5 provides data on the indicators collected through the WHO, UNICEF and UNAIDS annual reporting form formonitoring the health sector response to HIV/AIDS (1).Number of pregnant women living with HIV receiving antiretrovirals for preventing mother-to-childtransmissionThe number of pregnant women living with HIV receiving antiretrovirals for preventing mother-to-child transmission isbased on national programme data aggregated from facilities or other service delivery sites and as reported by countries.A total of 120 countries reported data for 2009. These 120 countries accounted for nearly all (99.9%) of the estimated1.4 million pregnant women living with HIV in low- and middle- income countries. All these women need effective<strong>int</strong>erventions to prevent mother-to-child transmission of HIV, including antiretroviral therapy or prophylaxis for preventingtransmission of the virus to their children.Estimating the number of pregnant women living with HIV <strong>who</strong> need antiretrovirals for preventing mother-tochildtransmissionThe number of pregnant women living with HIV <strong>who</strong> need antiretrovirals for preventing mother-to-child transmission isestimated using standardized statistical modelling based on UNAIDS/WHO methods that consider various epidemic anddemographic parameters and national programme coverage of antiretroviral therapy in the country, such as HIV prevalenceamong women of reproductive age, and effect of HIV on fertility and antiretroviral therapy coverage (4). These statisticalmodelling procedures are used to derive a comprehensive population-based estimate of the total number of pregnantwomen living with HIV <strong>who</strong> need antiretrovirals for preventing mother-to-child transmission in the country. Regular scientificupdates have been provided on these tools (7).PROGRESS REPORT 2010143
towards <strong>universal</strong>Similar to the estimates on antiretroviral therapy need presented in Annex 3, Annex 5 presents uncerta<strong>int</strong>y ranges around theestimated population needing antiretrovirals to prevent mother-to-child transmission of HIV and, accordingly, the coverageof pregnant women living with HIV receiving antiretrovirals for preventing mother-to-child transmission. The need estimatesof some countries are currently under review and therefore these countries expressed a preference that their estimates notto be published (or only a range), but their estimates are nevertheless used to estimate the regional needs and coverage.Coverage of pregnant women living with HIV receiving antiretrovirals for preventing mother-to-childtransmissionThe coverage of antiretrovirals for preventing mother-to-child transmission of HIV is calculated by dividing the number ofpregnant women living with HIV <strong>who</strong> received antiretrovirals for preventing mother-to-child transmission of HIV in 2009by the estimated number of pregnant women living with HIV <strong>who</strong> need antiretrovirals for preventing mother-to-childtransmission in the country.The ranges around the levels of coverage are based on the uncerta<strong>int</strong>y ranges around the estimates of need. Po<strong>int</strong>estimates and ranges are given for countries with a generalized epidemic, whereas only ranges are given for countries witha concentrated epidemic.In addition, Annex 5 also presents data on the following indicators:• the number and percentage of pregnant women tested for HIV;• the number and percentage of infants born to women living with HIV receiving antiretrovirals for preventing motherto-childtransmission;• the number and percentage of infants born to women living with HIV receiving co-trimoxazole prophylaxis within twomonths of birth; and• the number and percentage of infants born to women living with HIV receiving a virological test by two months ofbirth.Explanatory notes for Annex 7Classification by incomeUnless stated otherwise, all data analysis in this report is based on data from 149 countries classified as low- and middleincome by the <strong>World</strong> Bank as of July 2007 (8).Economies are classified as low-, middle- or high income according to the gross national income per capita, calculated usingthe <strong>World</strong> Bank Atlas method (to reduce the effect of exchange-rate fluctuation). The groups are: low income, US$ 905 orless; lower–middle income, US$ 906 to US$ 3595; upper–middle income, US$ 3896–US$ 11 115; and high income, US$ 11116 or more.Classification by HIV epidemic levelHIV epidemics are categorized as low level, concentrated and generalized based on the following principles and numericalproxies.Low levelPrinciple. Although HIV infection may have existed for many years, it has never spread to significant levels in anysubpopulation. Recorded infection is largely confined to individuals with high-risk behaviour, such as sex workers, people <strong>who</strong>inject drugs and men <strong>who</strong> have sex with men. This epidemic state suggests that networks of risk are rather diffuse (with lowlevels of partner exchange or sharing of drug-injecting equipment) or that the virus has been <strong>int</strong>roduced only very recently.ConcentratedPrinciple. HIV has spread rapidly in a defined subpopulation but is not well established in the general population. Thisepidemic state suggests active networks of risk within the subpopulation. The future course of the epidemic is determinedby the frequency and nature of links between highly infected subpopulations and the general population.144 TOWARDS UNIVERSAL ACCESS: Scaling up priority HIV/AIDS <strong>int</strong>erventions in the health sector
<strong>access</strong>GeneralizedPrinciple. In generalized epidemics, HIV is firmly established in the general population. Although subpopulations at highrisk may continue to contribute disproportionately to the transmission of HIV, sexual networking in the general populationis sufficient to sustain an epidemic independent of subpopulations at higher risk of infection.Classification by geographical regionThis report presents data on 149 low- and middle-income countries by geographical region. The geographical regions arebased on UNAIDS regions. 1 East, South and South-East Asia combines two UNAIDS regions, as does Latin America andthe Caribbean. The 149 countries are therefore categorized as follows: sub-Saharan Africa (n = 46); Latin America andthe Caribbean (n = 29); East, South and South-East Asia (n = 21); Europe and Central Asia (n = 25); and North Africa andthe Middle East (n = 14). In Oceania (n = 14), only Fiji and Papua New Guinea reported data. For this report, the values forOceania are included in East, South and South-East Asia.WHO has 193 Member States grouped in six regions, and 149 WHO Member States are low- and middle-income countries:WHO African Region (n = 46); WHO Region of the Americas (n = 29); WHO Eastern Mediterranean Region (n = 16); WHOEuropean Region (n = 26); WHO South-East Asia Region (n = 11); and WHO Western Pacific Region (n = 21). Annex 3 liststhe remaining 44 high-income countries in the second section.UNICEF groups the 149 low- and middle-income countries <strong>int</strong>o seven regions: Eastern and Southern Africa (n = 22); Westand Central Africa (n = 24); East Asia and the Pacific (n = 26); Latin America and the Caribbean (n = 29); South Asia (n = 8);North Africa and the Middle East (n = 14); and Central and Eastern Europe and the Commonwealth of Independent States(n =21). Five middle-income countries are classified as being industrialized.References1. WHO, UNICEF and UNAIDS. Monitoring and reporting on the health sector’s response towards <strong>universal</strong>, jo<strong>int</strong> reporting tool. Geneva, <strong>World</strong><strong>Health</strong> <strong>Organization</strong>, 2008 http://www.<strong>who</strong>.<strong>int</strong>/hiv/data/tool2010/en/, <strong>access</strong>ed 15 September 2010).2 <strong>World</strong> <strong>Health</strong> <strong>Organization</strong> and UNAIDS. Guidelines on Estimating the Size of Populations Most at Risk to HIV. Geneva, <strong>World</strong> <strong>Health</strong><strong>Organization</strong>, 2010 (http://data.unaids.org/pub/Manual/2010/guidelines_popnestimationsize_en.pdf , <strong>access</strong>ed 17 September 2010).3. WHO, UNAIDS and UNICEF. <strong>Towards</strong> <strong>universal</strong> <strong>access</strong>: scaling up priority HIV/AIDS <strong>int</strong>erventions in the health sector. Progress report, September2009. Geneva, <strong>World</strong> <strong>Health</strong> <strong>Organization</strong>, 2009 (http://www.<strong>who</strong>.<strong>int</strong>/hiv/pub/tuapr_2009_en.pdf, <strong>access</strong>ed 20 July 2010).4. Methods and assumptions for estimates [web site]. Geneva, UNAIDS, 2009 (http://www.unaids.org/en/KnowledgeCentre/HIVData/Methodology/default.asp, <strong>access</strong>ed 20 July 2010).5. Antiretroviral therapy for HIV infection in infants and children. Geneva, WHO, 2010 (http://whq<strong>libdoc</strong>.<strong>who</strong>.<strong>int</strong>/publications/2010/9789241599801_eng.pdf, <strong>access</strong>ed 20 July 2010).6. Morgan M et al. Improved plausibility bounds about the 2005 HIV and AIDS estimates. Sexually Transmitted Infections, 2006, 82(Suppl.III):iii71–iii77.7. Stover J et al. The Spectrum projection package: improvements in estimating mortality, ART needs, PMTCT impact and uncerta<strong>int</strong>ybounds. Sexually Transmitted Infections, 2008, 84 (Suppl I):i24–i30.8. Data & statistics: country classification [web site]. Washington, DC, <strong>World</strong> Bank, 2008 (http://go.worldbank.org/K2CKM78CC0 ,<strong>access</strong>ed 5 May 2008).1 UNAIDS brings together the efforts and resources of 10 United Nations System organizations in the response to HIV. The 10 UNAIDS cosponsors are:• Office of the United Nations High Commissioner for Refugees (UNHCR);• United Nations Children’s Fund (UNICEF);• <strong>World</strong> Food Programme (WFP);• United Nations Development Programme (UNDP);• United Nations Population Fund (UNFPA);• United Nations Office on Drugs and Crime (UNODC);• International Labour <strong>Organization</strong> (ILO);• United Nations Educational, Scientific and Cultural <strong>Organization</strong> (UNESCO);• <strong>World</strong> <strong>Health</strong> <strong>Organization</strong> (WHO); and• <strong>World</strong> Bank.PROGRESS REPORT 2010145
For more information, contact:<strong>World</strong> <strong>Health</strong> <strong>Organization</strong>Department of HIV/AIDSAvenue Appia 201211 Geneva 27SwitzerlandE-mail: hiv-aids@<strong>who</strong>.<strong>int</strong>www.<strong>who</strong>.<strong>int</strong>/hivISBN 978 92 4 150039 5