Information Diffusion in Social Networks - School of Technology and ...
Information Diffusion in Social Networks - School of Technology and ...
Information Diffusion in Social Networks - School of Technology and ...
You also want an ePaper? Increase the reach of your titles
YUMPU automatically turns print PDFs into web optimized ePapers that Google loves.
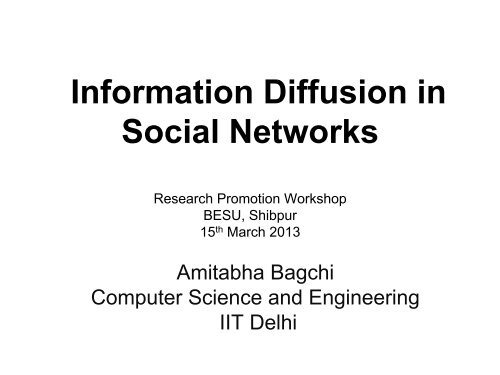
<strong>Information</strong> <strong>Diffusion</strong> <strong>in</strong><strong>Social</strong> <strong>Networks</strong>Research Promotion WorkshopBESU, Shibpur15 th March 2013Amitabha BagchiComputer Science <strong>and</strong> Eng<strong>in</strong>eer<strong>in</strong>gIIT Delhi
Onl<strong>in</strong>e <strong>Social</strong> <strong>Networks</strong>• OSNs like Facebook <strong>and</strong> Twitter areubiquitous.• In fact some <strong>of</strong> you are probably updat<strong>in</strong>gyour Facebook status even as I speak.• "Stuck <strong>in</strong> bor<strong>in</strong>g talk about research, th<strong>in</strong>k I'lltake a nap....LOL"Researchers from various discipl<strong>in</strong>es arewak<strong>in</strong>g up to the possibilities.
Research aspects <strong>of</strong> OSNs• Sociologists have studied human socialnetworks from the dawn <strong>of</strong> their discipl<strong>in</strong>e.• Physicists are <strong>in</strong>terested <strong>in</strong> social networksas a complex system <strong>of</strong> <strong>in</strong>teract<strong>in</strong>g agents• Mathematicians see stochastic processes.• Economists apply game theoryComputer Scientists built these systems. Andwe are build<strong>in</strong>g the systems that can analyzethe data these systems generate.
<strong>Information</strong> diffusion on OSNsQuestion: How do particular topics or pieces <strong>of</strong>content become popular on OSNs?The answer to this question is tremendouslyimportant to a variety <strong>of</strong> stakeholders:commerce, political scientists, sociologistsetc
Two aspects: Macro <strong>and</strong> MicroMicro: What are <strong>in</strong>dividual users do<strong>in</strong>g?Macro: What are the large-scale phenomenathat are observed <strong>in</strong> this system?Synthesis: Can we deduce the nature <strong>of</strong> thelarge-scale phenomena from a knowledge <strong>of</strong>what <strong>in</strong>dividual users are do<strong>in</strong>g?
Example: The SIR modelGiven a graph G <strong>and</strong> a special vertex v thathas a certa<strong>in</strong> message (rumor).• Each node is <strong>in</strong> one <strong>of</strong> three states:Susceptible, Infected, Removed. Initial v isInfected <strong>and</strong> everyone else is Susceptible.• At each time step an edge (u,v) is chosen atr<strong>and</strong>om <strong>and</strong> if u is <strong>in</strong>fected it sends themessage to v.• If v is S, it becomes I. If it is I it becomes R.• If v is R then u becomes R.
SIR: The Macro questionClearly, as long as there are <strong>in</strong>fected nodes theprocess cont<strong>in</strong>ues.Question: Will all the nodes have been<strong>in</strong>fected for at least some time before theprocess ends?Ans: (Probably) depends on the topology. Fora complete graph the answer is no (Sudbury,J. Appl. Prob., 1985).
The way <strong>of</strong> PhysicsObserve the macro <strong>and</strong> theorize about themicro to better underst<strong>and</strong> the universe.
The way <strong>of</strong> Eng<strong>in</strong>eer<strong>in</strong>gUse the observation <strong>of</strong> the micro <strong>and</strong> the theory<strong>of</strong> the micro to build better systems <strong>and</strong> makemore money......thereby help<strong>in</strong>g pay for Physics research
Outl<strong>in</strong>e• Ref<strong>in</strong>e the micro question.• Def<strong>in</strong>e a stochastic model <strong>of</strong> the micro.• Simulate <strong>and</strong> observe the behaviour <strong>of</strong> themacro.• Compare with data.
Ref<strong>in</strong><strong>in</strong>g the questionThe Attribution problem: Why do users dowhat they do?• Did you share that photo because you likewhat's <strong>in</strong> it or because you are a big fan <strong>of</strong>the person who posted it?• You just heard on TV that Sehwag has beencut from the Indian team. Do you want toshare your op<strong>in</strong>ion on Twitter?• Everyone is talk<strong>in</strong>g about Kolaveri. Do youwant to check it out?
Build<strong>in</strong>g the modelThe model comes from (possible) answers tothe questions.• People are <strong>in</strong>fluenced by what their friendsare talk<strong>in</strong>g about. (Endogenous).• People monitor broadcast media also <strong>and</strong><strong>of</strong>ten respond to it on OSNs. (Exogenous).• People respond to themes that are gett<strong>in</strong>gpopular on OSNs. (Somewhere <strong>in</strong> between).
The Model I• Users form a network that is an undirectedsmall-world.• Each user “tweets” from time to time. A“tweet” is an event <strong>in</strong> time that has a “topic”associated with it.• The users options <strong>of</strong> topics at time t are froma set <strong>of</strong> topics that have been seen until timet.• The user differentiates between “global”topics <strong>and</strong> “local” topics.
The Model II• There is a “global list” <strong>in</strong> which “global tweets”arrive with frequency λ 1 (distributed as aPoisson po<strong>in</strong>t process). Each <strong>of</strong> these br<strong>in</strong>gsa new topic.• Each user has a “local list” <strong>in</strong>to which tweetsare written with frequency λ 2 (distributed as aPoisson po<strong>in</strong>t process).The topic <strong>of</strong> a user’s tweet is chosen r<strong>and</strong>omlyout <strong>of</strong> the topics <strong>in</strong> the global list <strong>and</strong> the locallists <strong>of</strong> its neighbours <strong>in</strong> the network.
The Model III• Each global tweet has a weight A on arrival <strong>in</strong>the global list.• This weight decreases exponentially withtime with parameter α i.e. Ae -αt at time t if thetopic arrived at time 0.• When a user tweets then that tweet is placed<strong>in</strong> its local list with weight B.• This weight decreases exponentially withtime with parameter β i.e. Be -βt at time t if thetweet arrived at time 0.
The Model IVA new tweet has two k<strong>in</strong>ds <strong>of</strong> c<strong>and</strong>idates it cancopy its topic from:• Global tweets.• Local tweets from one <strong>of</strong> its neighbours’ lists.A new tweet has the same topic as a c<strong>and</strong>idatetweet with probability proportional to thec<strong>and</strong>idate’s weight.
A reality check• The total weight seen by any node is f<strong>in</strong>itewith probability 1.• Additionally s<strong>in</strong>ce this is an ergodic Markovprocess there is a stationary distribution,hence the total weight converges to aconstant C(v) for node v.E[C] = λ 1 A/α + kλ 2 B/β,Where k is the number <strong>of</strong> neighbors <strong>of</strong> v.
Three parameter regimesVary<strong>in</strong>g the parameters gives us three k<strong>in</strong>ds <strong>of</strong>behaviours.• Sub-viral regime: No topic dom<strong>in</strong>ates. Welldescribedby mean-field approximation.• Super-viral regime: Each new topic goes viral<strong>and</strong> dies quickly• Viral regime
Evolution <strong>in</strong> the viral regime800070006000Number <strong>of</strong> Nodes5000400030002000100000 100 200 300 400 500 600 700 800 900 1000timeThe simulation resembles real-world topicevolution.
Viral regime characteristics1000010000Maximum Spread1000Maximum Peak height10001001 10 100 1000Rank1001 10 100RankPower law-like distributions are seen for macroproperties like peak volume, spread <strong>and</strong>lifetime.
Live longer, go further800070006000Maximum Spread5000400030002000100000 100 200 300 400 500 600 700 800LifetimeLonger lived topics spread further. (Or is it theother way around?)
Study<strong>in</strong>g topology empiricallyWe def<strong>in</strong>e topic based graphs for each topic• Lifetime graph: The subgraph <strong>in</strong>duced by allusers who have ever tweeted on the topic.• Evolv<strong>in</strong>g graphs: The sequence <strong>of</strong> graphs<strong>in</strong>duced by the users who tweet on the topicon a given day.• Cumulative evolv<strong>in</strong>g graph: There is anedge from u to v if u follows v <strong>and</strong> u tweetson the topic a day after tweets on day t <strong>and</strong>
Topological study: Viral topicsMax Cluster Sizes/ Evolution80007000600050004000300020001000Max Cluster Size2ndmax Cluster Size3rdmax Cluster SizeEvolutionNo. <strong>of</strong> Clusters500400 450 500 550 600 650 700 750 800 850 900 950 0TimeFor a viral topic clusters merge <strong>in</strong>to one as itrises <strong>in</strong> popularity. (Evolv<strong>in</strong>g graph)350300250200150100Number <strong>of</strong> Clusters
Topological study: Non-viral topicsMax Cluster Size / Evolution50045040035030025020015010050Max Cluster Size2ndmax Cluster Size3rdmax Cluster SizeEvolutionNo. <strong>of</strong> Clusters30025020015010050Number <strong>of</strong> Clusters0080 85 90 95 100 105 110 115 120 125TimeNon-viral topics see many small clusters.(Evolv<strong>in</strong>g graph)
Empirical cross-verification: Setup• We used a data set conta<strong>in</strong><strong>in</strong>g approx 200million tweets from 9 million users crawledfrom Twitter <strong>in</strong> 2009.• We augmented the data set by crawl<strong>in</strong>gfollower-follow<strong>in</strong>g relationships <strong>and</strong>geolocat<strong>in</strong>g the users where possible.• Further we used NLP tools to tag tweets withtopics (s<strong>in</strong>ce hashtags were very sparse).
Large cluster formation: Empirical10 210 110 3 0 10 20 30 40 50 60 70 80 0 0.050.30.4Users countPopularityGiant component0.250.20.150.1Fraction <strong>of</strong> node <strong>in</strong> Giant componentUsers count10 210 110 3 0 10 20 30 40 50 60 70 80 0 0.05PopularityGiant component0.350.30.250.20.150.1Fraction <strong>of</strong> node <strong>in</strong> Giant componentDayDayFor non-viral topics, the largest component <strong>of</strong>the cumulative evolv<strong>in</strong>g graph conta<strong>in</strong>s a smallfraction <strong>of</strong> all nodes
Large clusters <strong>in</strong> viral topics10 410 310 210 110 010 5 0 10 20 30 40 50 60 70 80 0 0.10.70.6Users countPopularityGiant component0.60.50.40.30.2Fraction <strong>of</strong> node <strong>in</strong> Giant componentUsers count10 410 310 210 110 5 0 10 20 30 40 50 60 70 80 0 0.1PopularityGiant component0.50.40.30.2Fraction <strong>of</strong> node <strong>in</strong> Giant componentDayDayIn viral topics the largest component takes up asignificant fraction <strong>of</strong> the graph, grow<strong>in</strong>g <strong>in</strong> sizeas the topic rises <strong>in</strong> popularity.
Cluster merg<strong>in</strong>g <strong>in</strong> the modelMax/2ndMax Cluster Size32.521.550180 85 90 95 100 105 110 115 120 125 0TimeMax/2ndMaxEvolution500450400350300250200150100EvolutionMax/2ndMax Cluster Size7000600050004000300020001000800070006000500040003000200010000400 450 500 550 600 650 700 750 800 850 900 950 0TimeMax/2ndMaxEvolutionEvolutionThe ratio <strong>of</strong> the largest to the second largestcomponent <strong>in</strong> the evolv<strong>in</strong>g graph tells a story.
The real data also has geography10 310 210 110 4 0 10 20 30 40 50 60 70 80 0.740.810.07Topic users countTemporalGeographical0.80.790.780.770.760.75Fraction <strong>of</strong> edges across countriesTopic users count10 110 010 2 0 10 20 30 40 50 60 70 80TemporalGeographical0.060.050.040.030.020.010Fraction <strong>of</strong> edges across countriesDayDayViral topics cross regional/national boundaries<strong>in</strong> the cumulative evolv<strong>in</strong>g graph.
That was the trailer…• Ruhela et. al. Towards the use <strong>of</strong> Onl<strong>in</strong>e <strong>Social</strong><strong>Networks</strong> for Efficient Internet ContentDistribution, <strong>in</strong> Proc ANTS 2011.• Ardon et. al. Spatio-Temporal Analysis <strong>of</strong> TopicPopularity <strong>in</strong> Twitter, arXiv:1111.2904v1 [cs.SI].• Rajyalakshmi et. al. Topic <strong>Diffusion</strong> <strong>and</strong>Emergence <strong>of</strong> Virality <strong>in</strong> <strong>Social</strong> <strong>Networks</strong>, arxiv:1202.2215v1 [cs.SI].www.cse.iitd.ernet.<strong>in</strong>/~bagchi
The emerg<strong>in</strong>g science <strong>of</strong> big data• Huge amounts <strong>of</strong> data be<strong>in</strong>g generated fromall k<strong>in</strong>ds <strong>of</strong> sources.• “Smart cities”, Genome sequenc<strong>in</strong>g,telescopes, networked systme.• A grow<strong>in</strong>g awareness that the science <strong>of</strong> datais the new frontier <strong>of</strong> technologyTh<strong>in</strong>k <strong>of</strong> it as IT’s steam eng<strong>in</strong>e moment. It’sturn to sh<strong>in</strong>e as a force <strong>in</strong> human affairs.
Challenges• Modell<strong>in</strong>go Doma<strong>in</strong> knowledge requiredo But underst<strong>and</strong><strong>in</strong>g <strong>of</strong> what data can reveal alsorequired.• Data analyticso Algorithmso Data structureso Databaseso System Architecture
The research horizon..• …is unlimited.• Only CS fundamentals will matter.• Everyth<strong>in</strong>g else will become obsolete beforethe exam papers are returned.
Thanks for listen<strong>in</strong>g


