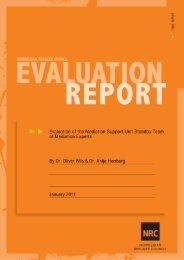
15in regular schools in 2004, which grades they were in, gender and age and how many whowere repeating classes, as well as information on the teachers and some on infrastructure.Available statistics allow us to make a comparison between 2001 and 2004.Statistics regarding primary education in BenguelaDistribution of students in primary school inBenguela 2001 and 20046thgrade5thgrade4thgrade3rdgrade2ndgrade1stgradeFemaleMaleTotalFemaleMaleTotalFemaleMaleTotalFemaleMaleTotalFemaleMaleTotalFemaleMaleTotal0 10000 20000 30000 40000 50000 60000 70000 80000Benguela 2001 Benguela 2004The numbers from 2001 in the above table comes from the 2004 EFA strategy (same as thenational numbers in the graph showed earlier in this report). The 2004 numbers are from theprovincial government and were given to the team when we visited them. From the graph wecan see that there are more students in grade 3 than in the national average, but then comes arather dramatic drop. The amount of students in grade 4 is less than half of the students ingrade 1. The gender balance is slightly better than on national level, jumping up and downbetween 51% and 58% boys. 28In another setting, it could make sense to take the number of students in grade 1 2001 and thenumber in grade 4 2004 and compare. Due to the general increase in access to education inAngola the last years, combined with the large number of students repeating classes, this willprobably give us quite wrong answers, so we have left that idea. In Benguela we also receivedstatistics on drop-outs, students who failed and students who passed.28 There is a deviating result in grade 4 in 2001 with near 60% girls which is either not correct or has some specialbackground we don’t know of.Educare Eva M. Johannessen
16Diagram 3 Achievement per level and subsystem in primary education, Benguela 2003% ofEnrolled Approved Failures Drop-outs enrolledLevel (Matriculados)(Aprovados)(Reprovados)(Abandono)that pass% of those whowrote examswho passPreschoolclass 49 622 36 262 13 360 73,00 100,00I Level 186 824 92 610 60 123 34 091 49,57 60,63II Level 31 478 18 251 9 494 3 533 58,61 66,02III Level 11 373 6 887 3 390 1 096 60,55 67,01Total 279 297 154 210 73 007 52 080 55,21 67,86Source: Gabinete do Director, Benguela (2004): Estatistíca 155% of those enrolled passed (67% of those who wrote the exam), 18, 6% dropped out and26% failed.The following year, 2004, the situation was that 39 689 students repeated Level I, 7121students repeated Level II and 1662 students repeated Level III. If we say that these are thestudents who did not pass in 2003 (which is likely to be the fact for many of them), there arestill 63 255 students who dropped out or did not pass (pre-school excluded) who are notrepeating classes. What happened to them is not registeredThe gender balance in schools in Benguela is slightly better even than country average. Itcould indicate that better access to education results in better gender equality, but thedifference is too small to generalize. In grade 6 the distribution is 52, 8%m/47, 2%f in 2001and 53, 6%m/46, 4%f in 2004, whereas national average is 55, 3%, /44, 7%f.According to the TEP provincial supervisor, there are not so high drop-out rates in first levelof primary in Benguela, but it is high when they come to grade 5, especially among girls.There were 385 562 students enrolled in school at all levels in 2004, which was an 11.03%increase from 2003. Of these, 50, 8% are regular students in level I (grades 1-4), 8% are inlevel II (5 th and 6 th grade) and 3, 4% are in level III (7 th and 8 th grade). 17, 4% are adults (18years +) in levels I-III, 16, 5% are in pre-school and only 3, 8% are in different kinds of highschoollevel schools.According to the Provincial Director for Education, there is an estimated 40 000 children outof school, located mainly in the rural areas.3.6.1 How many TEP students qualified for regular school in Benguela?In the school years 2000 to 2004 (the Angolan school year follow the calendar year), 95 232students enrolled in TEP classes in all the provinces and 66 488 of them finished the schoolyear. This is a drop out rate of 30%. 29 We shall first take a look at the TEP statistics forBenguela province and particularly Lobito and Baia Farta which were visited.29 TEP statistics: Sintese de Aproveitamento de 2000 até 2004Educare Eva M. Johannessen