Chapter 7 Sampling Distributions of Estimates - UCLA Statistics
Chapter 7 Sampling Distributions of Estimates - UCLA Statistics
Chapter 7 Sampling Distributions of Estimates - UCLA Statistics

You also want an ePaper? Increase the reach of your titles
YUMPU automatically turns print PDFs into web optimized ePapers that Google loves.
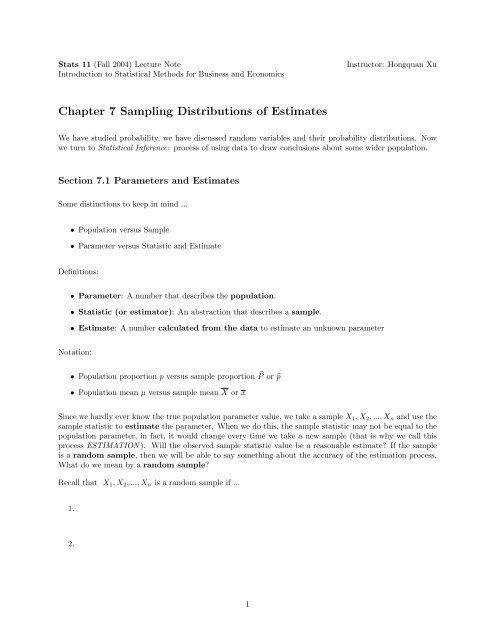
Stats 11 (Fall 2004) Lecture NoteIntroduction to Statistical Methods for Business and EconomicsInstructor: Hongquan Xu<strong>Chapter</strong> 7 <strong>Sampling</strong> <strong>Distributions</strong> <strong>of</strong> <strong>Estimates</strong>We have studied probability, we have discussed random variables and their probability distributions. Nowwe turn to Statistical Inference: process <strong>of</strong> using data to draw conclusions about some wider population.Section 7.1 Parameters and <strong>Estimates</strong>Some distinctions to keep in mind ...• Population versus Sample• Parameter versus Statistic and EstimateDefinitions:• Parameter: A number that describes the population.• Statistic (or estimator): An abstraction that describes a sample.• Estimate: A number calculated from the data to estimate an unknown parameterNotation:• Population proportion p versus sample proportion ̂P or ̂p• Population mean µ versus sample mean X or xSince we hardly ever know the true population parameter value, we take a sample X 1 , X 2 , ..., X n and use thesample statistic to estimate the parameter. When we do this, the sample statistic may not be equal to thepopulation parameter, in fact, it would change every time we take a new sample (that is why we call thisprocess ESTIMATION ). Will the observed sample statistic value be a reasonable estimate? If the sampleis a random sample, then we will be able to say something about the accuracy <strong>of</strong> the estimation process.What do we mean by a random sample?Recall that X 1 , X 2 , ..., X n is a random sample if ...1.2.1
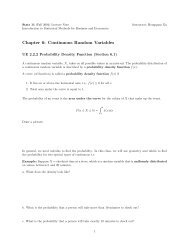
Example:A poll was conducted by The Heldrich Center for Workforce Development (at Rutgers University).A random sample <strong>of</strong> 1000 workers resulted in 460 (for 46%) stating they work more than 40 hours per week.Identify:Population =Parameter =Sample =Estimate =Can anyone say how close this observed sample proportion ̂p is to the true population proportion p? If wewere to take another random sample <strong>of</strong> the same size n = 1000, would we get the same value for the sampleproportion ̂p ?The value <strong>of</strong> a statistic from a random sample, like ̂p , will vary from sample to sample. So a statistic(also called estimator) is a random variable and it will have a probability distribution. This probabilitydistribution is called the sampling distribution <strong>of</strong> the statistic. We will study in this chapter the samplingdistribution <strong>of</strong> the following statistics:Sample Mean:X = the mean <strong>of</strong> a sample <strong>of</strong> size nSample Proportion:̂P =Xn= the proportion <strong>of</strong> successes in a sample <strong>of</strong> size nSection 7.2 <strong>Sampling</strong> Distribution <strong>of</strong> the Sample MeanScenario:A poll was conducted by The Heldrich Center for Workforce Development (at Rutgers University).A sample <strong>of</strong> 1000 workers resulted in a mean number <strong>of</strong> hours worked per week <strong>of</strong> 43.Population =Parameter =Sample =Estimate =Can anyone say how close this observed sample mean x is to the true population mean µ?If we were to take another random sample <strong>of</strong> the same size n = 1000, would we get the same value for thesample mean x?Picture Model:2
The value <strong>of</strong> the sample mean from a random sample will vary from sample to sample. So the sample mean(a statistic) is a random variable and it will have a probability distribution. This probability distribution iscalled the sampling distribution <strong>of</strong> the statistic. In Section 7.2 we learn about the sampling distributionfor a sample mean, X = the mean <strong>of</strong> a sample <strong>of</strong> size n. What can we say about the X basket (population)?Notation:• population mean µ• population standard deviation σ• random sample <strong>of</strong> size n: X 1 , X 2 , . . . , X n• sample mean X = X1+X2+...+XnnMain Results:1. The average <strong>of</strong> all <strong>of</strong> the possible sample mean values(from all possible samples <strong>of</strong> the same size n) is equal toThat is, the mean <strong>of</strong> the sample means is equal to the population mean.Thus the sample mean is anestimator <strong>of</strong> the population mean.2. The standard deviation <strong>of</strong> all <strong>of</strong> the possible sample mean values is equal to the original populationstandard deviation divided by √ n.This is approximately the average distance <strong>of</strong> the possible sample mean values from the populationmean. It is a measure <strong>of</strong> the accuracy <strong>of</strong> the process <strong>of</strong> using a sample mean to estimate the populationmean.Would this quantityσ √ ntell me how far away a particular x value is from µ?Note: If the sample size increases, the standard deviation decreases, which says the possible sample meanvalues will be closer to the true population mean (on average).3. If the population has a normal distribution,then the distribution <strong>of</strong> the sample mean is3
Note: Sums and differences <strong>of</strong> independent normal r.v. also have a normal distribution (Section 6.4.3).4. If the population is not necessarily normally distributed,but the sample size n is large,then the distribution <strong>of</strong> the sample mean isThis result is called theSee Figures 7.2.3- 7.2.5 on pages 285-287.Rule <strong>of</strong> Thumb: In general, the approximation is good if4
ExampleACT scores: Normally distributed with mean <strong>of</strong> 18.6 and standard deviation <strong>of</strong> 5.9.a. What is the probability that a single student randomly selected will score 21 or higher?b. A random sample <strong>of</strong> 50 students is obtained. What is the probability that the mean score for these 50students will be 21 or higher?c. What if the normal distribution assumption were not given? How would your answer to part b change?Explain.Example: Uniform DistributionSuppose the random variable X = actual flight time (in minutes) for Delta Airlines flights from Cincinnatito Tampa follows a uniform distribution over the range <strong>of</strong> 110 minutes to 130 minutes.a. Sketch the distribution for X (include labels for the axes and some values on the axes).b. Suppose we were to repeatedly take a random sample <strong>of</strong> size 100 from this distribution and compute thesample mean for each sample. What would the histogram <strong>of</strong> the sample mean values look like? Provide asketch and any details about the distribution <strong>of</strong> the sample mean that you can.5
Example:Grinding Machine prepares axles: target diameter = 40.125 mm. The standard deviation <strong>of</strong> diameters is0.002 mm. A (random) sample <strong>of</strong> 4 axles taken each hour and the sample mean diameter is recorded andplotted. What will be the mean and standard deviation <strong>of</strong> the numbers recorded?Note:When n = 1 we have:When n = 4 we have:So to reduce the standard deviation in half, we mustQuestion: What sample size would be needed for the standard deviation <strong>of</strong> the sample mean to be 0.0005mm?Standard Error <strong>of</strong> Sample MeanRecall that the s.d. <strong>of</strong> sample mean X isIn practice, we don’t know s.d. σ, so we have to estimate σ and sd(X).We can estimate σ byand estimate sd(X) byThe Standard Error <strong>of</strong> the Sample Mean isThe Standard Error is a measure <strong>of</strong> the<strong>of</strong> an estimate. You should always report anestimate and its standard error. One way to do this is to report a confidence intervals.A two-standard-error interval for µ is6