TGS 203 - Carbon Monoxide Sensor Specifications - Meditronik
TGS 203 - Carbon Monoxide Sensor Specifications - Meditronik
TGS 203 - Carbon Monoxide Sensor Specifications - Meditronik

Create successful ePaper yourself
Turn your PDF publications into a flip-book with our unique Google optimized e-Paper software.
TECHNICAL INFORMATION FOR <strong>TGS</strong><strong>203</strong>2. Operation PrincipleFigure 5 shows the temperature of the sensor elementsurface (typical values) when the heater voltage (VH)varies. The temperature was measured through athermocouple (CA, ø0.025mm) which was placed onthe center of the sensor element’s surface. The testwas carried out in clean air at room temperature.Note: Measurements were taken after application ofheater voltage in order to stabilize sensor elementsurface temperature.<strong>Sensor</strong> surface temperature (˚C)5004003002001000-0.2 0 0.2 0.4 0.6 0.8 1 1.2Heater voltage (V)Figure 5 - Element surface temperaturedependency on heater voltageFigure 6 shows the manner in which sensitivitycharacteristics vary with changes to the sensorelement temperature. <strong>Sensor</strong> resistance (Rs) in2,000ppm of various gases was obtained by changingheater voltage (VH) as shown in Figure 5.Figure 6 illustrates that the sensitivity to CO increasesas the sensor element temperature is decreased andthat the best selectivity to CO can be obtained ifsensor element temperature is maintained under100˚C. However, good reproducibility cannot beexpected when the sensor is continuously used under100˚C since the sensor becomes susceptible to theinfluence of water vapor or interference gases whenthis temperature is maintained for a prolongedperiod. To eliminate this influence, a cyclic high/low voltage as specified in Section 1-5 is applied tothe heater. High heater voltage heat-cleans the sensorby removing water vapor influence, while low heatervoltage conditions the sensor for measuring CO gas.Rs (k )10001001010.10 100 200 300 400 500Sensing element temperature (˚C)Figure 6 - Sensitivity dependency on elementsurface temperatureAirCH4i-C4H10COC2H5OHH2Revised 9/99 4/14
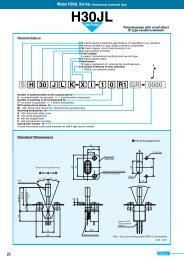
TECHNICAL INFORMATION FOR <strong>TGS</strong><strong>203</strong>3. Basic Sensitivity Characteristics3-1 Sensitivity to various gasesFigure 7 shows the sensor’s relative sensitivity tovarious gases. The Y-axis shows the ratio of sensorresistance in various gases (Rs) to the sensorresistance in 100ppm of CO (Ro).<strong>Sensor</strong> resistance in fresh air is several MΩ or more.The sensitivity to methane (CH4) and propane(C4H10) is negligible. The sensitivity to hydrogen,hydrogen sulfide (H2S), sulfur dioxide (SO2), andethanol (C2H5OH) is very low when compared to thatof CO. While Rs decreases in CO␣ gas, nitrogendioxide (NO2) causes sensor resistance to increase.However, the effect of as much as 50ppm of NO2 isnegligible—the dotted line in Figure 7 shows thesensitivity to CO when 50ppm of nitrogen dioxidecoexists.1000H2S100Rs/RoH2C2H5OH10CO1CO + NO2 50ppm0.10.011 10 100 1000 10000Gas concentration (ppm)Figure 7 - Sensitivity to various gasesThe slope of the sensitivity curve for CO flattens outwhen CO␣ concentration reaches around 5,000ppm.This concentration would be the practical uppersensing limit of the sensor.100The amount of CO␣ generated by cigarette smoke isroughly equivalent to 20ppm of CO when 10cigarettes are smoked in a room of roughly 24 cubicmeters in size. As a result, the influence of cigarettesmoke itself would not be sufficient to cause thesensor to generate an alarm for residential detectorsnormally calibrated to alarm at 100ppm of CO.Rs/Ro10Gas: CO 100ppm0% RH3-2 Temperature and humidity dependencyFigure 8 shows the temperature and humiditydependency of <strong>TGS</strong><strong>203</strong>. The Y-axis shows the ratioof sensor resistance in 100ppm of CO under variousatmospheric conditions (Rs) to the sensor resistancein 100ppm of CO at 20˚C and 65%RH (Ro).An inexpensive way to compensate for temperatureand humidity dependency to a certain extent wouldbe to incorporate a thermistor in the detection circuit(please refer to Section 5-3).10.1-60 -40 -20 0 20 40 60 80Temperature (˚C)90% RHFigure 8 - Temperature and humiditydependency40% RH65% RHRevised 9/99 5/14
TECHNICAL INFORMATION FOR <strong>TGS</strong><strong>203</strong>3-3 Gas response patternFigure 9-1 shows the change pattern of the sensor’soutput (VRL) in 100ppm and 300ppm of COrespectively. Figure 9-2 shows the response of thesensor to 1000ppm of ethanol vapor.These charts demonstrate the inverse relationship ofVRL between CO␣ and alcohol. In CO␣ gas, the RL Vstarts increasing with the change in heater voltage toVHL. After 90 seconds, when the heater voltagechanges to VHH, the VRL␣ drastically increases for ashort period of time and then decreases rapidly.Conversely, in ethanol vapor the VRL starts increasingwith the change in heater voltage to VHH in a shorttime, and then the VRL starts decreasing. After 60seconds, when the heater voltage changes to VHL,the VRL rapidly decreases again in a short time andthe VRL␣ then reaches a stabilized value.Figure 10 below shows the change in sensor elementtemperature which occurs during the sensor heatingschedule. This chart explains the behavior of VRL inFigures 9-1 and 9-2. Sensitivity to CO␣ is much greaterat low temperatures and significantly reduced at hightemperatures, while the inverse is true for ethanolsensitivity.Figure 9-1 - CO response pattern300Element surface temperature25020015010050-50 0 50 100 150 200 250Time (sec.)Figure 10 - <strong>Sensor</strong> element temperature changeFigure 9-2 - Ethanol vapor response patternRevised 9/99 6/14
TECHNICAL INFORMATION FOR <strong>TGS</strong><strong>203</strong>3-4 Heater voltage dependencyFigure 11-1 shows the change in the sensor resistanceratio according to variation in VHL. The Y-axis is theratio of sensor resistance in various gases (Rs) versusRs in 100ppm of CO when VHL=0.25V (Ro). Allmeasurements for purposes of this test were takenduring the 0.5 second sensing period at theconclusion of the heating cycle (i.e. after VHL).When VHL is higher than the rated value of 0.25V,the relative sensitivity of the sensor to hydrogen ascompared to CO␣ becomes higher. In contrast, whenthe VHL is lower than the rated value of 0.25V, therelative sensitivity to H2 compared to CO becomessmaller.Rs/Ro101CO 100ppmH2 1000ppm0.10.15 0.2 0.25 0.3 0.35VHLFigure 11-1 - Heater voltage dependency(VHH = 0.8V)Figure 11-2 shows the variation in sensor resistanceratio according to variation in VHH. The Y-axis isthe ratio of sensor resistance in various gases (Rs)versus Rs in 100ppm of CO when VHH=0.8V (Ro).Again all measurements for purposes of this test weretaken during the 0.5 second sensing period at theconclusion of the heating cycle (i.e. after VHL).1000100C2H5OH 1000ppmWhen VHH is higher than the rated value of 0.8V, therelative sensitivity of the sensor to hydrogen ascompared to CO␣ becomes higher. In contrast, whenthe VHL is lower than the rated value of 0.25V, therelative sensitivity to H2 compared to CO becomessmaller. The sensitivity to ethanol is smallest at therated value of VHH.It should be noted that when VHL or VHH␣ is lowerthan the rated value, short-term reproducibilitybecomes inferior, and CO sensitivity generally tendsto decrease in the long term. When VHL or VHH␣ ishigher than the rated value, CO sensitivity generallytends to increase in the long term.Rs/Ro101CO 100ppm0.10.5 0.6 0.7 0.8 0.9 1VHHFigure 11-2 - Heater voltage dependency(VHL = 0.25V)H2 1000ppmRevised 9/99 7/14
TECHNICAL INFORMATION FOR <strong>TGS</strong><strong>203</strong>3-5 Initial action4Start to power on in ambient airFigure 12 shows the initial action of the sensor’svoltage output (VRL). For purposes of this test, thesensor was stored unenergized in normal air for 40days after which it was energized in clean air.After energizing, the VRL at VHH started off very highbut gradually decreased to a stable level while theVRL at VHL was so low that an alarm delay circuitwould not be required.VRL(v)VH32100.0HighLow2 min.Vc = 5.0v, Vh = 0.25 / 0.8v, RL = 3.5kΩNumber of samples tested = 5Time1.5Figure 12 - Initial actionPowered after storageof 2 weeks3-6 Influence of unenergized storageFigure 13 shows the influence of unenergized storageon sensor resistance. <strong>Sensor</strong>s were storedunenergized in normal air for 2 weeks, 4 weeks, and3 months respectively after which they wereenergized. The Y-axis represents the ratio of sensorresistance in 100ppm of CO␣ after variousunenergized periods (Rs) to the resistance in 100ppmof CO after energizing at the rated voltage for 10 days(Ro).These charts demonstrate that after energizing,sensor resistance first increases slightly and thenreturns to a stable level.Rs/RoRs/Ro1.00.90.80.7+2σave.−2σ0.6-2 0 2 4 6 8 10 12Elapsed Time (days)1.51.00.90.80.7+2σave.−2σPowered after storageof 4 weeks0.6-2 0 2 4 6 8 10 12Elapsed Time (days)1.5Powered after storageof 3 monthsRs/Ro1.00.90.80.7+2σave.−2σ0.6-2 0 2 4 6 8 10 12Elapsed Time (days)Figure 13 - Time dependency (Ro = 1.0)(20 samples tested)Revised 9/99 8/14
TECHNICAL INFORMATION FOR <strong>TGS</strong><strong>203</strong>3-7 Effect of the activated charcoal filterCO␣ is commonly generated by the incompletecombustion of fossil fuels. For accurate detection ofCO, it is necessary to eliminate the influence not onlyof alcohol in the atmosphere but also of NOxgenerated by such heating devices. To do so, <strong>TGS</strong><strong>203</strong>utilizes a filter of activated charcoal.Figures 14-1 and 14-2 show sensitivity characteristicsof <strong>TGS</strong><strong>203</strong> with and without the charcoal filterrespectively.As shown in Figure 14-1, sensitivity to alcohol isreduced by the filter and the influence of 50ppm ofNO2 is virtually eliminated. The sensitivity tohydrogen is unaffected by the presence of the filter.Note: <strong>Sensor</strong> resistance (Ro) in 100ppm of CO, whichis used as a reference value in Figures 14-1 and 14-2,increases by approximately 50%~100% whenmeasured with the filter.Temperature and humidity dependency remainslargely unaffected by the presence of the filter.Rs/Ro (100ppm of CO)1001010.110 100 1000 10000100COH2Gas Concentration (ppm)Figure 14-1 - Gas sensitivity of <strong>TGS</strong><strong>203</strong>(with activated charcoal filter)C2H5OHCO + 50ppm of NO2Rs/Ro (100ppm of CO)101CO + 50ppmof NO2H2C2H5OHCO0.110 100 1000 10000Gas Concentration (ppm)Figure 14-2 - Gas sensitivity of <strong>TGS</strong><strong>203</strong>(without activated charcoal filter)Revised 9/99 9/14
TECHNICAL INFORMATION FOR <strong>TGS</strong><strong>203</strong>4. Reliability4-1 Gas exposure testFigure 15 shows test conditions for short-termexposure of <strong>TGS</strong><strong>203</strong> to various gases. In this test, thesensor was kept energized under standard circuitconditions. <strong>Sensor</strong> resistance in 100ppm of CO␣ wasmeasured prior to the test gas exposure. After theexposure in gases according to the times shown inFigure 15, the sensor was removed from the test gasand energized in normal air. After one hour elapsed,sensor resistance in 100ppm of CO was againmeasured.Exposure to 1000ppm and 3000ppm of test gas (laststep in Figure 15) was not conducted for the followinghighly corrosive gases: hydrogen sulfide (H2S),sulfur dioxide (SO2), and nitrogen dioxide (NO2).Figure 16 shows the test results. The change ratio ofsensor resistance in 100ppm of CO before and afterexposure to the test gas is plotted. Most test gasescaused some decrease in sensor resistance. Especiallythe influence of hydrogen sulfide and sulfur dioxidewere remarkable. The sensor’s ability to recover tooriginal value from gas exposure is coded on Figure16 as follows:1 - quick recovery2 - recovery within one day3 - more than 7 daysTable 1 shows test results on long term gas exposure.<strong>Sensor</strong> resistance in 100ppm of CO was measuredbefore long term gas exposure (Ro) after which thesensors were placed in an enclosed capacity vesselwith a test gas for a designated period. The sensorswere then removed and kept under normalenvironmental conditions for one hour prior tomeasuring their resistance in 100ppm of CO afterexposure to test gas (Rs).As these tests demonstrate, care should be taken tominimize exposure to gases which lower the sensor’ssensitivity.Test gasesGas concentration (ppm)R-22 (freon)NO2SO2H2SH2TolueneEthyl acetateBenzeneIsopropyl alcoholEthanolEthyleneIsobutanePropaneMethane1000010001001055100 10CO20 30 40Gas50 60CO70 80Time (min.)Time ●Figure 15 - Conditions of gas exposure testRs(after)/Rs(before)5 min.0.0 0.2 0.4 0.6 0.8 1.0Figure 16 - Effects of exposure to various gases555332223221111n/an/aRevised 9/99 10/14
TECHNICAL INFORMATION FOR <strong>TGS</strong><strong>203</strong>Table 1 - Long term exposure to various gasesAmbient<strong>Sensor</strong>Type of exposure (gas/conc./time) condition condition Rs/Ro # samplesSO2 0.4ppm 10 days 50˚C/40%RH energized 0.85 3CH4 2.5% for 7 hrs. room temp. energized 0.70 5+ 20% H2 for 1 hr.H2S 1000ppm 10 days room temp. energized 0.50 5SO2 5000ppm + 1% CO2 room temp. unenergized 0.15 5for 10 days4 cigarettes/13 liters room temp. energized 0.85 30.3cc salad oil/13 liters room temp. energized 0.85 3CO 300ppm for 30 sec., room temp. energized 0.98 3pause 1 min., repeat 1000 timesStyrene 2000ppm 40 days 50˚C unenergized 1.00 10Toluene 2000ppm 40 days 50˚C unenergized 1.00 10Hexane 2000ppm 40 days 50˚C unenergized 0.78 10Acetone 2000ppm 40 days 50˚C unenergized 0.98 10Ethanol 1 2000ppm 40 days 50˚C unenergized 0.51 10MEK 2 2000ppm 40 days 50˚C unenergized 0.81 71-1-1TCE 3 2000ppm 40 days 50˚C unenergized 0.87 101<strong>Sensor</strong> recovered Ro after energizing for 20 days in normal air2Methyl ethyl ketone3Trichloroethane4-2 Long-term stabilityFigure 17 shows long-term stability data for <strong>TGS</strong><strong>203</strong>for more than 8 years. Test samples were energizedin normal air and under standard circuit conditions.Measurement for confirming sensor characteristicswas conducted under standard test condition (20˚C,65%RH). The initial value was measured after twodays of energizing in normal air at the rated voltage.The Y-axis shows the alarm concentration calculatedby the sensor’s resistance when the alarmconcentration is set at 100ppm of CO. At the verybeginning of energizing, alarm concentrationincreases, and then gradually decreases. After 8years, the alarm concentration decreased to roughlyone half of its initial value.10000HydrogenAlarm concentration (ppm)1000100<strong>Carbon</strong> monoxideMax.Ave.Min.Max.Ave.Min.Number of samples tested: 20100 2 4 6 8 10Time (yr.)Figure 17 - Long term stabilityRevised 9/99 11/14
TECHNICAL INFORMATION FOR <strong>TGS</strong><strong>203</strong>4-3 Durability of the activated charcoal filter(1) Effect of storage in normal airIn Figure 18, the effect of NO2 on a sensor stored for3.5 years in normal air and a new sensor with a newfilter are plotted. Virtually no difference in the abilityof the sensor to eliminate the effects of NO2 can beseen between the two samples.Rs (CO 100ppm + NO2 50ppm)Rs (CO 100ppm)1.151.101.051.000.95Max.Ave.Min.NewAfter storagefor 3.5 yearsFigure 18 - Effect of being stored in normal air(2) Effect of high temperature and high humidity1.15In Figure 19, the effect of NO2 is plotted for a sensorstored for two months under conditions of 50˚C and90%RH and for a new sensor with a new filter. Thisfigure demonstrates that high temperature andhumidity have almost no effect on the activatedcharcoal filter’s ability to eliminate the effects of NO2.Rs (CO 100ppm + NO2 50ppm)Rs (CO 100ppm)1.101.051.000.95Max.Ave.Min.NewAfter storagefor 2 monthsin 50˚C/90%RHFigure 19 - Effect of high temperature/humidity(3) Effect of long-term energizingIn Figure 20, the filter’s performance in eliminatingthe effects of NO2 and alcohol vapor is compared forthree different types of samples:* new filter* filter used on sensor energized for one year* filter used on a sensor energized for 7 yearsThese sample filters were placed on new sensorelements for conducting this test. The results showthat as the energizing period becomes longer,performance in removing NO2 and alcohol vaportends to decrease. However, the level of degradationin this performance is minimal and does not reach alevel which would be a problem in practical usage.Rs/Rs(CO 100 ppm)Rs/Ro (CO 100ppm)1000100101C2H5OH 1000 ppmCO 100 ppm + NO2 50 ppmNew 1 year old 7 years old oldFigure 20 - Effect of long-term energizingRevised 9/99 12/14
TECHNICAL INFORMATION FOR <strong>TGS</strong><strong>203</strong>5 Circuit Examples5-1 <strong>Sensor</strong> signal measuring methodFigures 21-1 and 21-2 show the sensor signalmeasuring method in circuits where a regulatedcurrent is applied to the heater in order to heat thesensor element. When heating the sensor element,Q1 and Q2 are closed as shown in Figure 21-1. Whenreading the sensor signal, Q1 and Q2 are opened asshown in Figure 21-2. The voltage applied to RL isused as a sensor signal. The operation of Q1 and Q2is controlled according to the conditions specified inSection 1-5 by way of a time control IC such as amicrocomputer.VCVH<strong>TGS</strong><strong>203</strong>Q2Q1Figure 21-1 - Element heated periodRL5-2 <strong>Sensor</strong> heater breakage detection circuit<strong>Sensor</strong> heater breakage can be detected by a resistorconnected to Q2 in series. The voltage applied to theresistor is used as a monitor.Vc VC5-3 Temperature compensation circuitThe temperature and humidity dependency of<strong>TGS</strong><strong>203</strong> can be compensated to a certain degree in acircuit using a thermistor, as shown in Figure 22.Q1Q2RLTh = ThermistorRTH = 8kΩ, B constant = 4200R1 = 6.2kΩR2 = 2.24kΩFigure 21-2 - Gas detection point5-4 FIC-5401FIC-5401 is a custom hybrid IC containing thenecessary functions for driving the <strong>TGS</strong><strong>203</strong> andhandling output signals for alarm systems. This ICis a useful and convenient item for evaluating theperformance of <strong>TGS</strong><strong>203</strong>. For more information aboutthis item and its usage, please refer to the brochureProduct Information - FIC-5401.VC Vc<strong>TGS</strong><strong>203</strong>ThR1ComparaterComparator+-RLR20Figure 22 - Temperature compensation circuitRevised 9/99 13/14