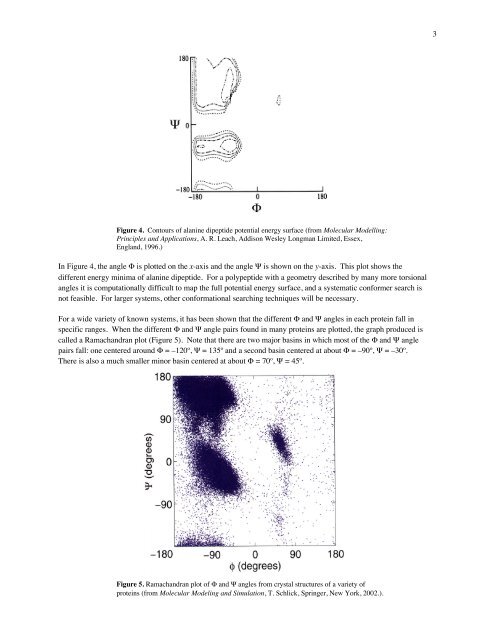
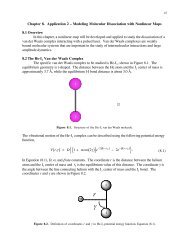
2(a)(b)Figure 2. Potential energy surface of n-pentane as a function of its two flexible <strong>to</strong>rsionalangles in (a) a con<strong>to</strong>ur format and (b) a surface format (from Molecular Modelling: Principlesand Applications, A. R. Leach, Addison Wesley Longman Limited, Essex, England, 1996.)A systematic conformation search involves varying the flexible geometrical parameters of a molecule (in this case,the two <strong>to</strong>rsional angles C1-C2-C3-C4 and C2-C3-C4-C5) in a regular way and calculating the single point energyfor each configuration. To generate the potential energy surfaces for n-butane or n-pentane, for example, themolecular mechanics energy was evaluated from 0 <strong>to</strong> 360 degrees in increments of 20 degrees. For n-butane, thiscorresponds <strong>to</strong> 18 points, while for n-pentane, 18 2 = 324 points are required. Then, energy minimizations are carriedout for each set of initial <strong>to</strong>rsional angles <strong>to</strong> determine the unique stable conformations of the molecule.For larger molecules with many flexible <strong>to</strong>rsional angles (such as proteins), systematic determination of the potentialenergy surface quickly becomes computationally prohibitive. For a molecule with just 6 <strong>to</strong>rsional angles, 18 6 (or3.4×10 7 ) points are required <strong>to</strong> generate the <strong>to</strong>rsional potential energy surface using 20-degree increments! Even ifthe angular increment is increased from 20 degrees <strong>to</strong> 60 degrees, 6 6 or 46,656 points must still be determined.<strong>Conformation</strong> <strong>Searching</strong> of PolypeptidesConsider a fragment of a polypeptide backbone that might be found in a protein shown in Figure 3.OHCφCψNCNCCHOFigure 3. A backbone of a polypeptide.The O-C-N-H <strong>to</strong>rsional angles of the peptide bond are rigid due <strong>to</strong> resonance. The <strong>to</strong>rsional angles of thepolypeptide backbone, denoted Φ and Ψ, are flexible, however. These <strong>to</strong>rsional angles can be treated much like thetwo <strong>to</strong>rsional angles of n-pentane, and a potential energy surface can be mapped. For example, for alaninedipeptide, a plot of the potential energy surface con<strong>to</strong>urs is shown in Figure 4.
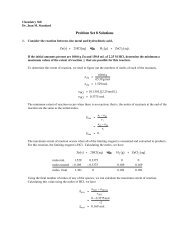
3Figure 4. Con<strong>to</strong>urs of alanine dipeptide potential energy surface (from Molecular Modelling:Principles and Applications, A. R. Leach, Addison Wesley Longman Limited, Essex,England, 1996.)In Figure 4, the angle Φ is plotted on the x-axis and the angle Ψ is shown on the y-axis. This plot shows thedifferent energy minima of alanine dipeptide. For a polypeptide with a geometry described by many more <strong>to</strong>rsionalangles it is computationally difficult <strong>to</strong> map the full potential energy surface, and a systematic conformer search isnot feasible. For larger systems, other conformational searching techniques will be necessary.For a wide variety of known systems, it has been shown that the different Φ and Ψ angles in each protein fall inspecific ranges. When the different Φ and Ψ angle pairs found in many proteins are plotted, the graph produced iscalled a Ramachandran plot (Figure 5). Note that there are two major basins in which most of the Φ and Ψ anglepairs fall: one centered around Φ = –120º, Ψ = 135º and a second basin centered at about Φ = –90º, Ψ = –30º.There is also a much smaller minor basin centered at about Φ = 70º, Ψ = 45º.Figure 5. Ramachandran plot of Φ and Ψ angles from crystal structures of a variety ofproteins (from Molecular Modeling and Simulation, T. Schlick, Springer, New York, 2002.).