Chapter 8. Application 2 â Modeling Molecular Dissociation with ...
Chapter 8. Application 2 â Modeling Molecular Dissociation with ...
Chapter 8. Application 2 â Modeling Molecular Dissociation with ...

You also want an ePaper? Increase the reach of your titles
YUMPU automatically turns print PDFs into web optimized ePapers that Google loves.
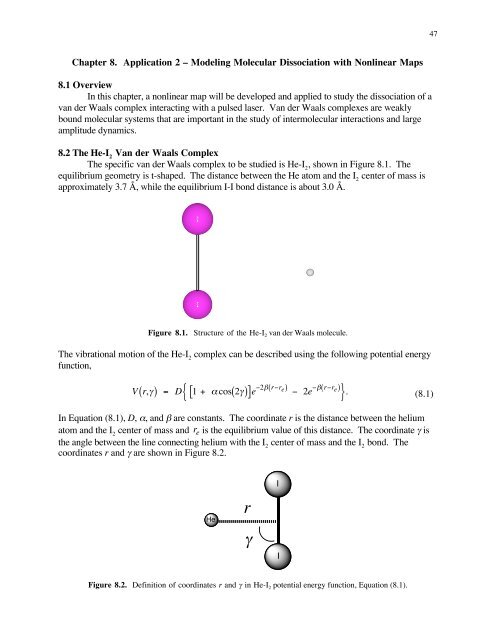
48The potential energy function given in Equation (<strong>8.</strong>1) assumes that the I-I bond distance is fixed atits equilibrium value. This is a reasonable approximation since the vibrational frequency of the I-Ibond is much higher than that of the He-I 2bending or stretching modes.A contour diagram of the potential energy function, Equation (<strong>8.</strong>1), is shown in Figure <strong>8.</strong>3.Note that most van der Waals molecules are very weakly bound in general and He-I 2is noexception. The dissociation energy of He-I 2is about 36 cm –1 or 0.1 kcal/mol.Figure <strong>8.</strong>3. Contour diagram of potential energy surface of He-I 2 . The y-axis units of bohr areequivalent to atomic units of distance, 1 a.u. = 0.529 Å. The x-axis is in units of π.<strong>8.</strong>3 Nonlinear Map for <strong>Molecular</strong> FragmentationA slice along the potential energy surface shown in Figure <strong>8.</strong>3 at γ=π/2 yields a functionthat looks much like a Morse oscillator. In the development of the nonlinear map to study thedissociation of He-I 2, the angle γ will be fixed at its equilibrium value of π/2 and the dissociation ofthe molecule by breaking the He-I 2bond will be studied. Thus, the map to be developed willdepend only on the stretching coordinate r.Consider the He-I 2system interacting <strong>with</strong> a periodic laser pulse. The energy of the systemis then given byE = P 22µ + TV X( ) δ( t − nT).In this equation, P is the momentum for stretching of the He-I 2bond, T is the time between laserpulses, t is time, and V X€system,∞∑ (<strong>8.</strong>2)n=0( ) is the He-I 2potential. Also, the mass µ is the reduced mass of the He-I 2€µ =m He m I 2m He + m I 2, (<strong>8.</strong>3)€
49and X is the bond displacement coordinate,The term€€δ t − nTX = r − r e . (<strong>8.</strong>4)δ( t − nT) in Equation (<strong>8.</strong>2) is known as a delta function and has the following behavior:( ) =⎧ ∞, if t = nT⎫⎨⎬⎩ 0, otherwise ⎭ . (<strong>8.</strong>5)This function represents the laser pulse. It is assumed that the duration of the laser pulse is veryshort compared to the time T between laser pulses, so that each pulse appears as a big (infinite)spike. The system€evolves in the potential V ( X) between laser pulses. The laser pulse effectivelygives a big kick to the bond and can lead to dissociation.Discretizing Newton’s equations of motion for this system leads to a nonlinear map of theform€P n+1 = P n − T dV ( X)dXX n+1 = X n + T (<strong>8.</strong>6)µ P n+1 .In the case of the He-I 2van der Waals complex, the potential is assumed to be a Morse oscillator,€V ( X) = D( 1 − e −aX) 2 . (<strong>8.</strong>7)The map may be simplified somewhat by redefining the variables,€p = aT P and q = aX . (<strong>8.</strong>8)µThis leads to a nonlinear van der Waals map given by€p n+1 = p n + d e −2q n − e −q n( )q n+1 = q n + p n+1 .(<strong>8.</strong>9)In Equation (<strong>8.</strong>9), the parameter d is defined as€d = 2a2 T 2 D. (<strong>8.</strong>10)µ€
50<strong>8.</strong>4 Programming the Nonlinear van der Waals MapTo program the nonlinear van der Waals map, the input and output must be considered. Inaddition, since the map requires iteration to advance the solution from one time step to the next, aDO loop will be required.Program InputFirst, let us consider the input to the program. The van der Waals map is characterized bythe parameter d, so that will have to be input or defined in the program. The total number ofiterations desired also must be specified in some way. Finally, to begin iterations of the van derWaals map, the initial position and momentum will have to be input.Main BodyThe main calculations that are required of the program are iterations of the two equations ofthe van der Waals map, Equation (<strong>8.</strong>9). This requires repeated calculations of the equations inorder to advance the position and momentum in time. A DO loop will be used to achieve theiterative advancement of the solutions in time. At each time step, the following calculations must becarried out in order to advance the solution from step n to step n+1:- calculation of momentum p n+1 from position and momentum at step n- calculation of position q n+1 from position at step n and momentum at step n+1Program OutputThe output should be written€to a file. The position and momentum at each step can bewritten out along <strong>with</strong> any other€desired quantities.<strong>8.</strong>5 Visualization of Data Sets of Nonlinear MapsThe Linux software package xmgrace may be utilized to graph the phase space portraits ofthe van der Waals map. It is important to set the plotting style to display symbols for each datapoint rather than connecting the points <strong>with</strong> lines (the default). Instructions for specifying theplotting style are given below.Specifying the Plotting StyleOnce you have read your data set into xmgrace, to set the plotting style, select Plot → Setappearance from the main menu. Select the "Main" tab. Under "Symbol properties", set the"Type" to Circle and the "Size" to <strong>8.</strong> Under "Line properties", set the "Type" to None.