Chapter 8. Application 2 â Modeling Molecular Dissociation with ...
Chapter 8. Application 2 â Modeling Molecular Dissociation with ...
Chapter 8. Application 2 â Modeling Molecular Dissociation with ...
You also want an ePaper? Increase the reach of your titles
YUMPU automatically turns print PDFs into web optimized ePapers that Google loves.
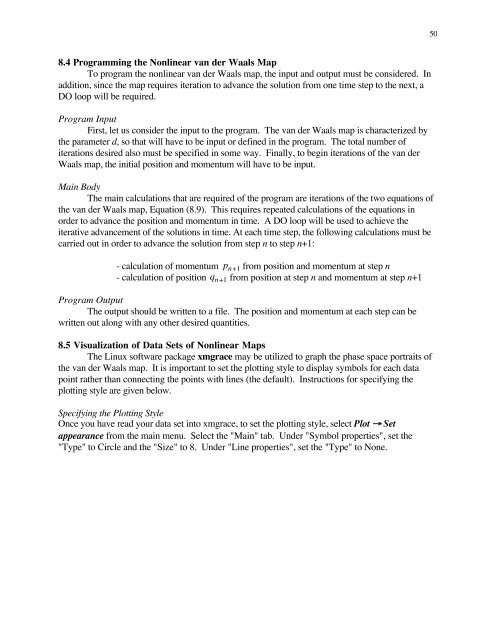
50<strong>8.</strong>4 Programming the Nonlinear van der Waals MapTo program the nonlinear van der Waals map, the input and output must be considered. Inaddition, since the map requires iteration to advance the solution from one time step to the next, aDO loop will be required.Program InputFirst, let us consider the input to the program. The van der Waals map is characterized bythe parameter d, so that will have to be input or defined in the program. The total number ofiterations desired also must be specified in some way. Finally, to begin iterations of the van derWaals map, the initial position and momentum will have to be input.Main BodyThe main calculations that are required of the program are iterations of the two equations ofthe van der Waals map, Equation (<strong>8.</strong>9). This requires repeated calculations of the equations inorder to advance the position and momentum in time. A DO loop will be used to achieve theiterative advancement of the solutions in time. At each time step, the following calculations must becarried out in order to advance the solution from step n to step n+1:- calculation of momentum p n+1 from position and momentum at step n- calculation of position q n+1 from position at step n and momentum at step n+1Program OutputThe output should be written€to a file. The position and momentum at each step can bewritten out along <strong>with</strong> any other€desired quantities.<strong>8.</strong>5 Visualization of Data Sets of Nonlinear MapsThe Linux software package xmgrace may be utilized to graph the phase space portraits ofthe van der Waals map. It is important to set the plotting style to display symbols for each datapoint rather than connecting the points <strong>with</strong> lines (the default). Instructions for specifying theplotting style are given below.Specifying the Plotting StyleOnce you have read your data set into xmgrace, to set the plotting style, select Plot → Setappearance from the main menu. Select the "Main" tab. Under "Symbol properties", set the"Type" to Circle and the "Size" to <strong>8.</strong> Under "Line properties", set the "Type" to None.


