City of Riverside - Western Area Power Administration
City of Riverside - Western Area Power Administration
City of Riverside - Western Area Power Administration
- No tags were found...

Create successful ePaper yourself
Turn your PDF publications into a flip-book with our unique Google optimized e-Paper software.
<strong>City</strong> <strong>of</strong> <strong>Riverside</strong>Public Utilities DepartmentOur Mission<strong>Riverside</strong> Public Utilities is committed to the highest qualitywater and electric services at the lowest possible rates to benefit the community.Our Vision<strong>Riverside</strong> Public Utilities will be recognizedas a community treasure with a national reputation for excellence.Our Core ValuesThe <strong>City</strong> <strong>of</strong> <strong>Riverside</strong> Public Utilities Department values...SafetyHonesty and IntegrityTeamworkPr<strong>of</strong>essionalismQuality ServiceCreativity and InnovationInclusiveness and Mutual RespectCommunity InvolvementEnvironmental StewardshipThree-Year Goals 1Improve system reliability, increase capacity, and obtain optimal power and water resourcesAttract, develop, and retain quality employeesEnhance organizational effectiveness, efficiency and financial healthIncrease public awareness and support for <strong>Riverside</strong> Public UtilitiesProvide environmental leadership in renewable energy, conservation and sustainability1 Not in priority order
<strong>Power</strong> Planning/Marketing Group2008 <strong>Power</strong> Supply Integrated Resource Plan Team:Gary L. NolffAssistant General Manager – ResourcesMark Klein<strong>Power</strong> Planning/Marketing ManagerRonald Barry<strong>Power</strong> MarketerBill ArmentaSenior Resources AnalystAtoya MendezSenior Resources Analyst
<strong>City</strong> <strong>of</strong> <strong>Riverside</strong>Public Utilities Department - Resources Division2008 <strong>Power</strong> SupplyIntegrated Resource PlanTable <strong>of</strong> ContentsSECTIONPAGEExecutive Summary ............................................................................................................. 1CHAPTER 1 – INTEGRATED RESOURCE PLAN OVERVIEW ................................ 3Introduction .......................................................................................................................... 3Integrating Supply And Demand Side Resources ............................................................. 3Market Redesign And Technology Upgrade ..................................................................... 4<strong>Riverside</strong>’s Future Resource Requirements ...................................................................... 6Risk Management ................................................................................................................. 7Capacity Requirements ........................................................................................................ 8Environmental Constraints ................................................................................................. 9Natural Gas Purchases ....................................................................................................... 10Regulatory Requirements .................................................................................................. 10Renewable Energy Alternatives ........................................................................................ 14Conservation And Demand Side Management ............................................................... 16Results And Recommendations ......................................................................................... 16CHAPTER 2 – DEMAND AND ENERGY FORECAST ............................................... 18Introduction ........................................................................................................................ 18Methodology........................................................................................................................ 18Customer Classes ................................................................................................................ 18Independent Variables ....................................................................................................... 18Statistical Analysis .............................................................................................................. 18System Energy Requirements ........................................................................................... 20Monthly Peak Demands ..................................................................................................... 20Scenario Analysis ................................................................................................................ 20Forecast Results .................................................................................................................. 21Summary ............................................................................................................................. 22CHAPTER 3 – EXISTING GENERATION RESOURCES .......................................... 23Introduction ........................................................................................................................ 23Resource Capacity .............................................................................................................. 25Summer Resources ............................................................................................................. 25Spring/Fall Reserves........................................................................................................... 26Winter Reserves .................................................................................................................. 26Summary Of Resources ..................................................................................................... 26CHAPTER 4 – CONSERVATION AND DEMAND SIDE MANAGEMENT ............ 28i
Introduction ........................................................................................................................ 28Evaluating Conservation And DSM Programs ............................................................... 28RPU Avoided Costs ............................................................................................................ 29Existing RPU Programs ..................................................................................................... 30Future Conservation/DSM Programs .............................................................................. 30CHAPTER 5 – FUTURE RESOURCE REQUIREMENTS .......................................... 33Introduction ........................................................................................................................ 33Resource Acquisition Goals ............................................................................................... 33Resource Requirements 2008-2010 ................................................................................... 34Summary Of 2008-2010 Resource Requirements............................................................ 36Resource Requirements 2010-2015 ................................................................................... 36Other Issues......................................................................................................................... 362015-2020 Resource Requirements ................................................................................... 37Summary Of Resource Requirements .............................................................................. 37CHAPTER 6 – RESOURCE EVALUATION ................................................................. 39Introduction ........................................................................................................................ 39Impacts <strong>of</strong> Existing Resources On Future Costs ............................................................. 39Natural Gas Price Forecast ............................................................................................... 40Effect Of Rising Natural Gas Prices On RPU’s Resource Mix ...................................... 41Natural Gas Management.................................................................................................. 42Historic Relationship Between Gas And Electricity Prices ............................................ 43Resource Planning Scenarios ............................................................................................ 43Risks Associated With Resource Acquisitions ................................................................. 43Scenario 1: Do Nothing ...................................................................................................... 45Scenario 2: Cogeneration And Renewable Resource Alternative.................................. 48Scenario 3: Meet All Future Needs With Natural Gas ................................................... 52Scenario 4: Renewable Alternative ................................................................................... 53Summary And Conclusion ................................................................................................. 59Appendix A – Market Redesign And Technology UpgradeAppendix B – Summary Of Transmission Rights And CostsAppendix C – Long-Term Demand ForecastAppendix D – Summary Of Simulation ResultsAppendix E – Existing And Planned Conservation And DSM ProgramsAppendix F – Acronyms And Industry Termsii
<strong>City</strong> <strong>of</strong> <strong>Riverside</strong> Public Utilities Department2008 <strong>Power</strong> Supply Integrated Resource Plan<strong>City</strong> <strong>of</strong> <strong>Riverside</strong>Public Utilities DepartmentResources Division2008 <strong>Power</strong> SupplyIntegrated Resource PlanEXECUTIVE SUMMARYIncreasing fossil fuel prices, worldwide concerns about global warming and the beginning <strong>of</strong> anew California wholesale electricity marketplace combine to present a significant challenge t<strong>of</strong>uture resource planning efforts by the <strong>Riverside</strong> Public Utilities Department (“RPU”).This 2008 <strong>Power</strong> Supply Integrated Resource Plan (“IRP”) provides an analysis <strong>of</strong>, as well asthe types and timing related to, <strong>Riverside</strong>’s acquisition <strong>of</strong> new power resources, includingDemand Side Management (“DSM”) and conservation-based “resources.” The goal <strong>of</strong><strong>Riverside</strong>’s resource additions and DSM measures is to reliably meet the electricity needs <strong>of</strong><strong>Riverside</strong>’s ratepayers at the lowest possible cost consistent with sound business practices.This IRP proposes more emphasis on renewable resources and DSM than in the past, recognizingthat California and the Federal government are working on various means to reduce greenhousegases and will likely implement some form <strong>of</strong> emission tax and, in the next few years, a cap andtrade policy for greenhouse gas emissions.RPU has less natural gas generation than most other California utilities but more coal-firedgeneration. As a result, RPU will be more adversely affected financially by greenhouse gaslegislation than other California utilities.To attempt to minimize the financial impacts <strong>of</strong> greenhouse gas reduction legislation, RPUproposes to devote almost all <strong>of</strong> its future resource acquisition efforts to renewable resources,especially geothermal generation, and DSM technologies.Renewable resources may be more expensive in the short-run than traditional fossil fuel firedgeneration, but their price is not affected by geo-political events and, given the expected increasein prices for fossil fuel resources, can be melded into RPU’s existing resource mix with littlelong-term impact on customer rates in comparison to those resources.DSM technologies attempt to shift energy use to the less expensive periods <strong>of</strong> the day withoutadversely impacting how people and businesses use energy. Implementing thermal energystorage programs and encouraging more efficient use <strong>of</strong> residential appliances, especiallyrefrigerators, freezers and air conditioning, form the basis <strong>of</strong> new or expanded DSM programs.1
<strong>City</strong> <strong>of</strong> <strong>Riverside</strong> Public Utilities Department2008 <strong>Power</strong> Supply Integrated Resource PlanAs RPU continues its transition to a greener, more efficient utility, it must also deal with a newwholesale marketplace in California. The California Independent System Operator (“CAISO”)will implement their Market Redesign and Technology Upgrade (“MRTU”), scheduled to occuron April 1, 2009. The MRTU is primarily intended to increase the reliability <strong>of</strong> California’selectric system while potentially reducing the cost <strong>of</strong> supplying energy to all <strong>of</strong> California’sratepayers.However, the MRTU wholesale market is incredibly complex and assumes that each participantthoroughly understands how the market operates. This is especially true in how the MRTUmarket allocates the use and cost <strong>of</strong> California’s transmission system.An entity that participates in the market but does not understand how to <strong>of</strong>fer its resources or useits existing transmission could suffer significant additional costs. RPU has spent millions <strong>of</strong>dollars over the past few years preparing for the new market, including personnel training,extensive participation in the CAISO stakeholder process used to develop the MRTU marketrules, and implementing new s<strong>of</strong>tware programs necessary to participate efficiently in thismarket.Participating successfully in the MRTU market will require that RPU adopt new schedulingprocedures and bidding strategies to make best use <strong>of</strong> its generation resources. RPU is currentlyparticipating extensively in the market simulations conducted by the CAISO in anticipation <strong>of</strong>the new market and has found that this participation has significantly helped to develop the newmarket in a manner that protects RPU’s interests.RPU will meet the new challenges <strong>of</strong> providing reliable and affordable electricity to <strong>Riverside</strong>’sratepayers. This IRP will change as the industry and the world economies evolve. RPU’splanning efforts now attempt to take into account its lack <strong>of</strong> insulation from world geo-politicalevents.Although this and future Integrated Resource Plans are intended to form the basis for formulatingand executing supply-side and demand-side strategies, it should be recognized that wholesalepower markets in the <strong>Western</strong> United States, and particularly in California, are continuing to seeunprecedented change. Therefore, staffs’ in the Resources Division’s <strong>Power</strong> Planning/Marketing,<strong>Power</strong> Projects/Contracts, and <strong>Power</strong> Scheduling/Operations areas must retain the flexibility toquickly alter the assumptions underlying this IRP and adjust their resource procurement andmanagement activities as circumstances develop. In all cases, however, resource procurementand management by RPU personnel will comply with the requirements <strong>of</strong> the Energy RiskManagement Policy, unless expressly exempted from those requirements by RPU’s governingbodies on a case-by-case basis.2
<strong>City</strong> <strong>of</strong> <strong>Riverside</strong> Public Utilities Department2008 <strong>Power</strong> Supply Integrated Resource Plan<strong>City</strong> <strong>of</strong> <strong>Riverside</strong>Public Utilities DepartmentResources Division2008 <strong>Power</strong> SupplyIntegrated Resource PlanCHAPTER 1 – INTEGRATED RESOURCE PLAN OVERVIEWIntroductionSince the electricity crisis <strong>of</strong> 2000-2001, RPU has focused on increasing the reliability <strong>of</strong> serviceto its retail customers while keeping costs as low as reasonably possible.RPU faces new challenges over the next few years as it attempts to adjust to a new wholesaleelectric marketplace while replacing several lower cost expiring supply contracts. At the sametime, RPU will significantly reduce greenhouse gas 2 emissions to meet its goal <strong>of</strong> at least 33%renewable resources by 2020 and to meet new state and federal regulations. This effort willrestrict the types <strong>of</strong> resources that are available to meet future energy demands.Integrating Supply and Demand-Side ResourcesThis 2008 Integrated Resource Plan (“IRP”) emphasizes the integration <strong>of</strong> supply-side and DSMprograms, including aggressive conservation measures. While the rising cost and complexity <strong>of</strong>acquiring and operating new resources is one <strong>of</strong> the primary reasons, it is important to recognizethe benefits that conservation and DSM technologies can represent to RPU’s ratepayers.Appropriately designed conservation and DSM programs can lower customer costs whileincreasing economic development activity within <strong>Riverside</strong>.DSM programs that reduce RPU’s summer peak demand reduce the need for costly peakingenergy and capacity, allowing RPU’s customers to benefit from the reduced cost <strong>of</strong> powersupply. Customers that adopt DSM programs benefit from lower costs while non-participatingcustomers benefit from RPU’s lower revenue requirements, hence lower rates.Additionally, conservation and DSM programs reduce greenhouse gas emission levels and helpRPU meet its own aggressive environmental goals 3 , as well as California’s emissions limitations.2 Defined in the Kyoto Protocol “basket” <strong>of</strong> emissions as carbon dioxide (CO 2 ), methane (CH 4 ), nitrous oxide (N 2 O),hydr<strong>of</strong>luorocarbons (HFCs), perfluorocarbons (PFCs), and sulfur hexafluoride (SF 6 ).3 RPU’s renewable energy portfolio goals are 20 percent <strong>of</strong> retail energy requirements in 2010, 25 percent by 2015and 33 percent by 2020.3
<strong>City</strong> <strong>of</strong> <strong>Riverside</strong> Public Utilities Department2008 <strong>Power</strong> Supply Integrated Resource PlanPrograms that are most beneficial to RPU, in terms <strong>of</strong> cost reduction, include thermal energystorage, air conditioner replacement, refrigeration/freezer replacement and pool pumpmanagement programs. Each <strong>of</strong> these different programs reduces summer on-peak demandrequirements and reduces the amount <strong>of</strong> future peaking capacity required by RPU to meetcustomer demand.Another effective DSM program is Time-<strong>of</strong>-Use Rates. During on-peak hours, when RPUcustomer demands for electricity are highest, the cost <strong>of</strong> providing electricity is greater than atmid- and <strong>of</strong>f-peak periods, when demand is lower. With Time-<strong>of</strong>-Use Rates, the cost variesaccording to the period in which RPU customers use the electricity. This cost incentive tends t<strong>of</strong>latten RPU’s on-peak demand by shifting that demand to mid-peak and <strong>of</strong>f-peak periods andreducing the amount <strong>of</strong> peaking capacity required by RPU.Market Redesign and Technology UpgradeOne <strong>of</strong> the crucial issues facing RPU is developing strategies for participating in the CAISO’snew Market Redesign and Technology Upgrade (“MRTU”). The MRTU will replace the existingenergy-based wholesale market that evolved in the aftermath <strong>of</strong> the 2000/01 western energycrisis. In terms <strong>of</strong> staff time and computer systems, RPU continues to invest significant resourcesin preparation for the implementation <strong>of</strong> MRTU.Two <strong>of</strong> the key components <strong>of</strong> MRTU are Resource Adequacy and Locational Marginal Pricing(“LMP”).Resource AdequacyResource Adequacy is the requirement that each Load Serving Entity (“LSE”), such as RPU,have sufficient unit-specific generation resources to meet its forecasted peak loads, plus CAISOmandatedreserves. By insuring that each LSE has sufficient resources to meet peak loads, plus a15 percent planning margin, the CAISO is attempting to prevent the possibility <strong>of</strong> energyshortages that were partially responsible for the 2000/01 energy crisis.The CAISO has also added a second type <strong>of</strong> capacity requirement, Local Capacity Requirement(“LCR”). LCR is supplied from generation resources located within the same transmission zone,or “load pocket,” as the LSE. RPU’s Local Capacity zone roughly includes the Los Angelesbasin area. For example, RPU receives Resource Adequacy credit from the CAISO in connectionwith its Intermountain <strong>Power</strong> Project entitlement, but does not receive LC credit due to itslocation outside <strong>of</strong> the transmission zone in which RPU physically resides. <strong>Riverside</strong>’sownership interest in the San On<strong>of</strong>re Nuclear Generating Station (“SONGS”), however, providesRPU with CAISO credit for both Resource Adequacy and LCR requirements.Locational Marginal PricingLMP was introduced in an attempt to encourage the future construction <strong>of</strong> generation atappropriate points on the existing transmission system through locational price signals. This is4
<strong>City</strong> <strong>of</strong> <strong>Riverside</strong> Public Utilities Department2008 <strong>Power</strong> Supply Integrated Resource Planare permitted to request Congestion Revenue Rights (“CRR”) from the CAISO. 4 Upon MRTUimplementation, LSEs will attempt to match their energy bids with theirs CRRs over the relevanttransmission path in order to receive the intended congestion price hedge 5 .Transmission LossesAs part <strong>of</strong> delivering energy using transmission lines, a portion <strong>of</strong> the energy will be consumedby those lines in the form <strong>of</strong> heat. Energy consumed by a transmission line itself is referred to astransmission losses. Market participants, such as RPU, cannot accurately plan for or bypass theCAISO’s allocation <strong>of</strong> marginal transmission losses related to the market participant’s acceptedenergy bids. All market participants will be allocated the same percentage <strong>of</strong> losses on thoseenergy bids for each five-minute ISO market interval.Summary <strong>of</strong> MRTU ImpactsImplementation <strong>of</strong> the CAISO’s MRTU market does not affect the amount <strong>of</strong> capacity resourcesthat RPU must purchase. Instead, MRTU will affect the type and potential location <strong>of</strong> futurecapacity additions. Generation resources subject to the MRTU market should only be acquired iflong-term transmission cost hedges, in the form <strong>of</strong> CRRs, can be secured, otherwise RPU wouldbe accepting the unhedged risk <strong>of</strong> higher transmission costs through congestion rents.The MRTU market places a premium on resource flexibility. Resources that can be bid into theMRTU market to cap costs are much preferred over higher cost units that must be dispatched.As a result <strong>of</strong> the MRTU market design, RPU can only estimate monthly or annual costs basedupon the assumption that specific resources will be dispatched to meet load. Based upon CAISOpredictedMRTU market clearing prices, it is probable that RPU’s internal generation will not berequired to operate for economic reasons. If this is the case, actual power supply costs will belower than RPU’s forecast. It is more likely, however, that RPU’s internal generation resourceswill operate for CAISO or RPU grid reliability reasons in the near term.A more detailed description <strong>of</strong> the CAISO’s MRTU market is presented in Appendix A.<strong>Riverside</strong>’s Future Resource RequirementsStarting in 2007, certain low-cost, long-term power supply contracts entered into by RPU in the1980’s and 1990’s began expiring. Additional power supply contracts are set to expire in the nexttwo years 6 , presenting RPU with the challenge <strong>of</strong> replacing these resources.4 An entity can largely protect itself against congestion costs by the acquisition <strong>of</strong> CRR, financial instruments madeavailable by the CAISO and intended to allow a market participant to hedge against the risk <strong>of</strong> congestion costs. Ineffect, CRRs act as a form <strong>of</strong> insurance that pays the CRR holder when congestion costs are incurred.5 At this time, RPU believes that its transmission congestion exposure for existing resources is relatively small butwill increase after 2010 when its pre-existing transmission rights expire and new resources are added to its resourcemix.6
<strong>City</strong> <strong>of</strong> <strong>Riverside</strong> Public Utilities Department2008 <strong>Power</strong> Supply Integrated Resource PlanPrior to the restructuring <strong>of</strong> California’s electricity markets in 1998, sellers in wholesale powermarkets were willing to enter into long-term, fixed price contracts. Today, due to the volatility <strong>of</strong>the primary fuels market, regulatory uncertainty and an overall shortage <strong>of</strong> regional generationcapacity, sellers are largely no longer willing to enter into such contracts. If a willing seller isidentified, purchases are nevertheless difficult to negotiate unless the purchaser (i.e., RPU)assumes much <strong>of</strong> the financial risk associated with non-performance <strong>of</strong> the contracted resource,whether due to forced outages, counterparty credit concerns, or failure <strong>of</strong> the CAISO’s marketmechanisms.Structural change, such as FERC Orders 888 and 890, affecting transmission use in thewholesale power industry has helped to eliminate some <strong>of</strong> the past regional price differences.These changes have largely prevented transmission owners from inappropriately reservingunused transmission capacity for their own future use, opening new markets for generators andhelping to equalize regional prices.As a result <strong>of</strong> these changes, power supply contracts that RPU entered into many years ago areunlikely to be renewed under their current favorable terms. For example, RPU’s current powersupply contract with Deseret Generation and Transmission Cooperative (Deseret) carries anaverage price <strong>of</strong> $24.50/MWh ($0.0254/KWh). The Deseret contract will expire at the end <strong>of</strong>2009 and will be replaced with a larger baseload renewable resource having a melded cost <strong>of</strong>approximately $77/MWh ($0.077/KWh), adding approximately $12 million to RPU’s annualwholesale power costs in 2010. Energy provided by the coal-based Deseret resource amounted toapproximately 18 percent <strong>of</strong> RPU’s total annual retail energy requirements, while energy from itsreplacement will provide approximately 8% <strong>of</strong> those requirements in 2010 and 17% <strong>of</strong> thoserequirements in 2011.Risk ManagementA common risk management measure <strong>of</strong> the need for new energy resources is the Value-at-Risk(“VAR”) metric. VAR is the expected cost <strong>of</strong> future energy needs if those needs were met atcurrent forward market prices.Table 1.1 on the next page shows RPU’s projected annual VAR for the period CY 2008 through2015.6 In 2007 power purchase agreements with the California Department <strong>of</strong> Water Resources for summer capacity andenergy expired. By 2009, the power purchase agreements related to the Milliken, Mid Valley and Badlandsresources will have expired, totaling 6 MW <strong>of</strong> landfill gas-fired baseload generation. At the end <strong>of</strong> 2009, the 52 MWDeseret Generation and Transmission Cooperative power purchase agreement expires, followed in early 2011 byone <strong>of</strong> RPU’s two Bonneville <strong>Power</strong> <strong>Administration</strong> capacity-energy exchange agreements (23 MW). Togetherthese resources represented 75 MW <strong>of</strong> summer capacity and approximately 26 percent <strong>of</strong> RPU’s total annual energyrequirements.7
<strong>City</strong> <strong>of</strong> <strong>Riverside</strong> Public Utilities Department2008 <strong>Power</strong> Supply Integrated Resource PlanTable 1.1: RPU’s Future Unmet Energy Requirements2008 2009 2010 2011 2012 2013 2014 2015Unmet EnergyGWh (VAR)262 248 328 70 6 65 72 93Exposure at$90/MWh $23.6 $22.3 $29.5 $6.3 $.54 $5.8 $6.5 $8.4($million)Unmet Energy(percent VAR)11 10 14 3 0.3 3 3 4As Table 1.1 shows, RPU’s VAR increases over the next few years due to the expiration <strong>of</strong>purchase agreements with the California Department <strong>of</strong> Water Resources (“CDWR”), DeseretGeneration & Transmission Co-operative, NM Milliken LLC, NM Mid Valley LLC and theCounty <strong>of</strong> <strong>Riverside</strong> (i.e., the Badlands resource). Additionally, RPU is examining the potentialimpact from expiration <strong>of</strong> one <strong>of</strong> RPU’s two capacity-energy exchange agreements with theBonneville <strong>Power</strong> <strong>Administration</strong> in early 2011.The CDWR contracts for non-specific power expired in 2007. Together they provided 53 MW <strong>of</strong>summer on-peak (May through October) capacity and approximately 30 GWh <strong>of</strong> monthly energyduring the summer months. RPU’s peak summer load is approximately 600 MW. Deseretprovides 52 MW <strong>of</strong> coal-based energy for all hours <strong>of</strong> the day, or approximately 420 GWh peryear. The coal-based Deseret power supply contract will expire on December 31, 2009.On January 31, 2011, the first <strong>of</strong> RPU’s Bonneville <strong>Power</strong> <strong>Administration</strong> (“BPA”) contracts fornon-specific power is scheduled to expire. RPU has two capacity-energy exchange contracts withBPA. The capacity-energy exchange agreements allow RPU to deliver inexpensive excessbaseload energy to BPA during low load periods in exchange for capacity and energy from BPAduring high load periods. The primary advantage <strong>of</strong> the BPA contracts is that they allow RPU touse its excess (in terms <strong>of</strong> RPU’s low load energy requirements) inexpensive baseload energyand leverage that excess energy as payment for capacity and energy provided by BPA duringhigh load periods.The expired CDWR contracts, in addition to the existing Deseret contract, provided almost 20percent <strong>of</strong> RPU’s summer peaking requirements and 25 percent <strong>of</strong> RPU’s total annual energyrequirements at relatively inexpensive prices in comparison to today’s markets. With theanticipated expiration <strong>of</strong> the first BPA contract in 2011, RPU will require more summer peakingcapacity and energy.Capacity RequirementsThe CAISO requires RPU to have sufficient resources to meet its forecasted monthly peakdemands, plus reserves <strong>of</strong> 15 percent. With the expiration <strong>of</strong> the CDWR contracts in 2007 and asmall increase in forecasted 2008 monthly peak demand, RPU required additional generationcapacity for the summer period.8
<strong>City</strong> <strong>of</strong> <strong>Riverside</strong> Public Utilities Department2008 <strong>Power</strong> Supply Integrated Resource PlanThis deficiency will continue throughout the planning horizon, absent short-term or long-termresource additions. However, approximately 100 MW <strong>of</strong> the deficit is due to CAISO-imposedreserve requirements that can be acquired fairly inexpensively in the short-term market. For2008, the capacity requirement shown was met with capacity purchases using the commonlyaccepted<strong>Western</strong> Systems <strong>Power</strong> Pool master agreement.Environmental ConstraintsIn 2006, California Governor Schwarzenegger signed Assembly Bill 32: The California GlobalWarming Solutions Act and Senate Bill 1368: The Greenhouse Gas Emissions PerformanceStandard into law. Together, these two bills require that California’s statewide greenhouse gasemissions be reduced to 1990 levels by 2020 and restrict greenhouse gas emissions from futurebaseload generation.These two bills effectively prohibit RPU from investing in coal-fired generation and require thatfuture investment be applied to state-<strong>of</strong>-the-art combined-cycle generation or renewableresources in order to <strong>of</strong>fset the greenhouse gas emissions associated with <strong>Riverside</strong>’s existingcoal-fired generation, the Intermountain <strong>Power</strong> Project (“IPP”).RPU is investigating a number <strong>of</strong> long-term renewable resources, primarily geothermal projects.While solar photovoltaic and wind generation are potentially attractive alternatives, neither canprovide the reliable level <strong>of</strong> capacity and energy required by RPU over the next few years. Solarphotovoltaic generation is still being pursued primarily as a small distributed generationalternative and the intermittent nature <strong>of</strong> wind generation resources currently precludes their useas a major component <strong>of</strong> RPU’s resource mix.Table 1.2: Resource CO2 Emissions per MWhResourceFuelCO2lbs/MWhDeseret – Bonanza Coal 2,312Deseret – Hunter Coal 2,133IPP Coal 2,225Palo Verde Nuclear 0Songs Nuclear 0Badlands Biogas 0Hoover Hydroelectric 0Salton Sea Unit 5 Geothermal 100Wintec Wind 0Springs Natural Gas 1,435RERC Natural Gas 1,277Non-Specific SourceBPA Hydroelectric 921Senate Bill 1368 (“SB1368”) restricts the ability <strong>of</strong> California’s LSE’s to make significantinvestments in long-term, baseload resources having average CO 2 emissions that exceed 1,1009
<strong>City</strong> <strong>of</strong> <strong>Riverside</strong> Public Utilities Department2008 <strong>Power</strong> Supply Integrated Resource Planlbs/MWh. As shown in Table 1.2 above, RPU’s existing coal and natural gas generation facilitiesexceed this level, although none <strong>of</strong> RPU’s natural gas resources are operated as baseloadgeneration and would therefore be exempted from the requirements <strong>of</strong> SB1368.Natural Gas PurchasesAssembly Bill 32 (“AB32”) and SB1368 essentially require California utilities to make themajority <strong>of</strong> new non-renewable investment in high efficiency natural gas-fired projects, primarilycombined cycle generation. Natural gas-fired combined cycle generation is generally veryefficient and clean compared to other types <strong>of</strong> fossil-fuel generation alternatives. As will bediscussed in more detail, RPU is cognizant <strong>of</strong> the primary fuel price risks that flow from an overdependenceon natural gas generation. Any disruptions in natural gas supplies could have asevere impact on RPU’s cost structure, unless natural gas purchases are managed strategically.RPU is investigating a number <strong>of</strong> long-term options to manage natural gas costs, including newpurchase and gas transportation agreements to hedge long-term natural gas price and supplyrisks.Regulatory RequirementsRegulatory risk has increased as municipal utilities become increasingly subject to rules andrequirements promulgated by state and federal regulatory entities that once had little or noinfluence over their operations. In addition to requirements imposed by the CAISO, the NorthAmerican Electric Reliability Corporation (“NERC”), the <strong>Western</strong> Electricity CoordinationCouncil (“WECC”) and the Federal Energy Regulatory Commission (“FERC”) have additionalregulatory powers to promote regional reliability and, where allowed, to impose significantmonetary penalties for failure to comply with mandated reliability standards. The need for thisnew authority largely stems from the widespread (multi-state) blackouts which have occurredover the last decade. Over the last few years, California regulators have obtained an everincreasinglevel <strong>of</strong> authority over municipal utility operations as a result <strong>of</strong> new legislativemandates.The CAISOThe CAISO is consistently moving forward with a number <strong>of</strong> Resource Adequacy and integratedcapacity market proposals that it intends to incorporate into its tariffs. Many <strong>of</strong> RPU’s concernshave centered on Resource Adequacy requirements, including Local Capacity obligations. Toensure that RPU is fully informed about initiatives proposed to be undertaken by the CAISO,RPU actively participates in the CAISO’s stakeholder processes and influences, to the extentpossible, the ultimate form <strong>of</strong> any requirements that may apply to RPU’s resource acquisitions.The NERCThe Energy Policy Act <strong>of</strong> 2005 imbued the NERC with new and far reaching regulatory powersrelated to system reliability policies, standards and practices. Along with the ability to mandatecompliance with its detailed reliability standards, the NERC has been vested with audit rights10
<strong>City</strong> <strong>of</strong> <strong>Riverside</strong> Public Utilities Department2008 <strong>Power</strong> Supply Integrated Resource Planand the ability to impose significant monetary penalties for non-compliance. Although many <strong>of</strong>the NERC’s new reliability standards do not directly apply to <strong>Riverside</strong>’s circumstances, RPU isobligated to comply with a significant number <strong>of</strong> those standards. Compliance is assured throughRPU’s designation <strong>of</strong> a full-time employee responsible for compliance with regulatory andlegislative mandates.The WECCThe WECC acts as the Regional Reliability Council, under NERC direction, responsible forpromulgating its own regional reliability standards for all or part <strong>of</strong> fourteen western states andportions <strong>of</strong> Canada and Mexico. In addition, the WECC bears responsibility for enforcing bothits own reliability standards and those <strong>of</strong> the NERC. The WECC has begun auditing utilities toinsure compliance with those reliability standards. Compliance audits are scheduled over a fiveyearperiod with the possibility <strong>of</strong> unannounced audits during this time period. As describedabove with respect to the NERC, RPU has designated a full-time employee to be responsible forRPU’s compliance with regulatory and legislative mandates, including those imposed by theWECC.The FERCIn addition to exercising regulatory authority over the reliability standards issued by the NERCand the WECC, as described above, the Federal Energy Regulatory Commission has issued newtransmission rules in its Order 890 proceeding that require LSEs to meet Resource Adequacyrequirements.In that order, the FERC ruled that only firm resources 7 transmitted over a firm transmission pathmay be considered as contributing to the satisfaction <strong>of</strong> Resource Adequacy requirements. In thepast, firm resources could be transmitted over interruptible, or “non-firm,” transmission pathsand still be considered as Resource Adequacy contributors. With this change, the FERC nowrequires the seller <strong>of</strong> firm resources to acquire specific, identified transmission paths between thegenerator and the purchaser’s point <strong>of</strong> receipt. This effectively prevents bilateral sales <strong>of</strong>unspecified system capacity 8 from being considered a firm resource because the capacity cannotbe tracked back to a specific generation source. More importantly, Order 890 prohibits thereservation <strong>of</strong> firm transmission service for transactions without a specifically identifiedgeneration source.7 Resources are considered “firm” when the entity selling the resource has agreed not to interrupt or curtail energydeliveries except under very specific circumstances. Those circumstances are typically related to a force majeureevent or an event that otherwise threatens the reliability <strong>of</strong> the supplier’s service to its own customers.8 “Unspecified system capacity” refers to capacity derived from all or a portion <strong>of</strong> a supplier’s resource portfolio, asopposed to a specific resource or combination <strong>of</strong> resources. Referred to as “unit contingent,” the designation <strong>of</strong>specific resource(s) underlying a power sale is considered inferior to unspecified system capacity, which implicitlyincludes the supplier’s obligation to provide capacity reserves in connection with the supply.11
<strong>City</strong> <strong>of</strong> <strong>Riverside</strong> Public Utilities Department2008 <strong>Power</strong> Supply Integrated Resource PlanThe California Air Resources BoardThe California Air Resources Board (“CARB”) is a part <strong>of</strong> the California EnvironmentalProtection Agency, an organization which reports directly to the Governor's Office. Theirmission is to promote and protect public health, welfare and ecological resources through theeffective and efficient reduction <strong>of</strong> air pollutants while recognizing and considering the effectson the economy <strong>of</strong> the state. The Federal Clean Air Act passed in 1970, and last amended in1990, forms the basis for the national air pollution control effort. Basic elements <strong>of</strong> the clean airact which the CARB has oversight, include stationary source emissions standards and permitrequirements. The CARB does not have authority to issue permits directly to stationary sources<strong>of</strong> air pollution. Primary responsibility for permitting all sources rests with the local and regionalair pollution control authorities known as Air Pollution Control Districts (“APCD”) or AirQuality Management Districts (“AQMD”).The California Energy CommissionThe California Energy Commission (“CEC”) is the state's primary energy policy and planningagency. Created in 1974 the CEC responsibilities include:i) Forecasting future energy needs and keeping historical energy data,ii) Licensing thermal power plants 50 megawatts or larger,iii) Promoting energy efficiency by setting the state's appliance and buildingiv)efficiency standards,Supporting public interest energy research that advances energy science andtechnology through research, development, and demonstration programs,v) Supporting renewable energy by providing market support to existing, new, andemerging renewable technologies; providing incentives for small wind and fuelcell electricity systems; and providing incentives for solar electricity systems innew home construction,vi)vii)Implementing the state's Alternative and Renewable Fuel and Vehicle TechnologyProgram, andPlanning for and directing the state response to energy emergencies.The most important development in the California energy policy in the past two years is thearrival at consensus that California must act to mitigate its greenhouse gas emissions, in order toreduce the impact <strong>of</strong> climate change. In 2006, the Legislature passed and the Governor signedtwo landmark pieces <strong>of</strong> legislation, AB32 and Assembly Bill 118, with far-reaching implicationsfor energy policy. The CEC has roles in implementing both successfully.The most comprehensive is AB32, the California Global Warming Solutions Act <strong>of</strong> 2006, whichsets an economy-wide cap on California greenhouse gas emissions at 1990 levels by no later than2020. This is an aggressive goal that represents approximately an 11 percent reduction fromcurrent emissions levels and nearly a 30 percent reduction from projected business-as-usuallevels in 2020. Twenty-five percent <strong>of</strong> the state's greenhouse gas emissions are attributable toelectricity generation while 38 percent is attributed to the transportation sector.12
<strong>City</strong> <strong>of</strong> <strong>Riverside</strong> Public Utilities Department2008 <strong>Power</strong> Supply Integrated Resource PlanAddressing the impacts <strong>of</strong> the transportation sector on climate change, Assembly Bill 118created the Alternative and Renewable Fuel and Vehicle Technology Program. The program isintended to increase the use <strong>of</strong> alternative and renewable fuels and innovative technologies thatwill transform California's fuel and vehicle types to help attain the state's climate changepolicies. Assembly Bill 118 authorizes the Energy Commission to provide, upon appropriationby the Legislature, approximately $120 million in annual incentives to public agencies, vehicleand technology consortia, businesses, public-private partnerships, workforce trainingpartnerships and collaboratives, fleet owners, consumers, recreational boaters, and academicinstitutions.The South Coast Air Quality Management DistrictLocal air district permitting activity in the Los Angeles is the responsibility <strong>of</strong> the South CoastAir Quality Management District (“SCAQMD”). Permitting activity in the Los Angeles basinfalls into two broad categories:i) Authority to Construct – any entity proposing to construct, modify, or operate afacility or equipment that may emit pollutants from a stationary source (i.e. powerplant) into the atmosphere must first obtain an Authority to Construct from theSCAQMD andii) Operating Permits – any entity operating a facility that emits air pollution mustobtain an operating permit from the SCAQMD.Other Regulatory RisksRegulatory risk includes the potential for increased costs to ratepayers if regulatory requirementsare reversed or dramatically changed. The current confusion surrounding MRTU implementationis an example <strong>of</strong> how regulatory changes can increase market participant costs. RPU investedsignificant staff time and funds in an effort to meet the CAISO’s announced goal <strong>of</strong> MRTUimplementation by April 2008. Yet, in late February 2008, the CAISO announced a delay inMRTU implementation to an unspecified future date. Later, a new implementation date <strong>of</strong>October 1, 2008 was established. Currently, the CAISO is suggesting that MRTUimplementation will occur April 1, 2009. Had the CAISO provided market participants, such asRPU, more advance notice that MRTU would not be implemented beginning in April 2008,RPU’s 2008 capacity procurement strategy would have been modified to minimize costs.Although unlikely, it is also possible that a new California governor could reverse the State’stimetable in moving toward dramatically increased renewable energy procurement, which resultsin higher costs for RPU’s ratepayers. RPU has positioned itself well in comparison tosurrounding utilities that have not invested in renewable resources and benefitted from earlypurchases <strong>of</strong> lower-than-market-cost renewable supplies. More importantly, RPU has securedsignificant renewable resources well into the future (e.g., 2020 to 2040).RPU can minimize regulatory risk by continuing to participate actively in the various legislativeand regulatory processes, ensuring that future resource acquisitions comport with current and13
<strong>City</strong> <strong>of</strong> <strong>Riverside</strong> Public Utilities Department2008 <strong>Power</strong> Supply Integrated Resource Plananticipated regulatory requirements, and engaging in sound resource planning practices with acomprehensive understanding <strong>of</strong> the State’s current and anticipated political environment.Renewable Energy AlternativesCurrently, RPU generates or purchases approximately 11 percent <strong>of</strong> its annual retail energyrequirements from renewable energy sources. By far, the most important current renewableresource is the Salton Sea Unit 5 geothermal project in Imperial County. This generationresource currently provides 20 MW <strong>of</strong> energy during all hours <strong>of</strong> the year and in 2009 willincrease to 46 MW hourly. RPU is committed to having a minimum <strong>of</strong> 20 percent <strong>of</strong> its annualenergy requirements met by renewable energy sources by 2010, with that minimum increasing to25 percent in 2015 and 33 percent in 2020. 9Renewable resources, including solar, geothermal, small hydroelectric, biomass and biogasgeneration, initially tend to cost approximately $20 - $35 per MWh more than traditional fossilfuel generation. However, because renewable resource prices are not subject to the samepolitico-economic forces as fossil fuels, renewable resource costs tend to become less expensiveover time than a comparable fossil fuel resource. RPU will achieve long-term price stability, andlower rates to its customers, by concentrating on the addition <strong>of</strong> renewable resources to itsresource mix.California’s environmental laws essentially preclude RPU from entering into any future supplyarrangements with coal-fired generation resources. Even gas-fired generation resources, otherthan combined cycle and cogeneration resources, <strong>of</strong>ten do not meet the 1,100 lbs/MWhemissions restriction contained in SB 1368.Table 1.3 on the next page summarizes 2008 RPU’s renewable resources.9 These goals were adopted by the Board <strong>of</strong> Public Utilities in May 4, 2007 and the <strong>Riverside</strong> <strong>City</strong> Council onDecember 9, 2008.14
<strong>City</strong> <strong>of</strong> <strong>Riverside</strong> Public Utilities Department2008 <strong>Power</strong> Supply Integrated Resource PlanTable 1.3: Summary <strong>of</strong> RPU’s Existing Renewable Resources.Resource Name Fuel Type CapacitySalton Sea Unit 5Geothermal20 MW(46 MW in 2009)Wintec Wind 1.32 MWBadlands Bio-gas 1.3 MWMilliken/Mid ValleyLandfill(expired June 2008)Utility Operations CenterBio-gasPhotovoltaic4.6 MW150 KWJanet Goeske Senior Center Photovoltaic 69.6 KW<strong>City</strong> Hall Ceremonial Patio Photovoltaic 17.4 KWHunt Park Photovoltaic 9.92 KWShamel Park Photovoltaic 9.92 KWIslander Park Photovoltaic 9.92 KWOrange Terrace Photovoltaic 89.72 KWRPU will expand its portfolio <strong>of</strong> renewable resources over the next few years in an economic andplanned manner that minimizes the effect <strong>of</strong> higher initial prices to the ratepayer. Among thelocal renewable resources RPU is pursuing is approximately 3 MW <strong>of</strong> existing grease-to-gaspowered baseload generation and a 1 MW fuel cell using local digester gas as a fuel source.These additional resources are in or near commercial operation at <strong>Riverside</strong>’s own RegionalWater Quality Control Plant and will be included in <strong>Riverside</strong>’s renewable portfolio in 2008,provided that certification <strong>of</strong> those resources by the CEC is possible and the renewable attributescan be retained by <strong>Riverside</strong>. Annual energy from these small resources is expected to totalapproximately 31.5 GWh with minimal cost to RPU’s customers.15
<strong>City</strong> <strong>of</strong> <strong>Riverside</strong> Public Utilities Department2008 <strong>Power</strong> Supply Integrated Resource PlanConservation and Demand-Side ManagementRPU intends to continue expanding its conservation and DSM programs to reduce the need foradditional on-peak capacity purchases.Many <strong>of</strong> the current RPU customer programs emphasize conservation, although future programswill emphasize DSM measures that shift on-peak demand to the <strong>of</strong>f-peak period, such as thermalenergy storage units.RPU recognizes the value to the utility and ratepayers <strong>of</strong> expanding cost-effective conservationand DSM programs. As importantly, well designed energy efficiency programs can promoteeconomic activity within the <strong>City</strong> <strong>of</strong> <strong>Riverside</strong>, as opposed to exporting revenue and jobs to othercommunities.Results and RecommendationsBased upon the analysis performed in this IRP, the following recommendations are presented:1. In 2009, RPU requires additional capacity and energy resources. RPU should enter into along-term power purchase agreement or asset purchase, if economic, with the <strong>City</strong> <strong>of</strong>Corona for 28 MW <strong>of</strong> capacity and energy from the Clearwater <strong>Power</strong> Plant, a naturalgas-fired cogeneration facility. This purchase will partially replace the energy from theexpired CDWR power purchase agreements;2. Recognizing the increasing risk <strong>of</strong> natural gas prices on RPU’s cost structure, natural gasmanagement and hedging efforts should be increased. This may include becoming part <strong>of</strong>the “Muni-Gas” purchasing group or other hedging alternatives and could result in RPUassuming balancing obligations for natural gas supplies. Also, prior to June 2008 RPUshould determine the type <strong>of</strong> transportation customer role it will assume under SouthernCalifornia Gas Company’s new “FAR OFF” program; 103. RPU should carefully monitor the progress <strong>of</strong> the Renaissance Geothermal Project toensure that at least one <strong>of</strong> the two planned 32 MW generators begin operation in 2010.This will replace the expiring coal-based Deseret power purchase agreement and providea long-term source <strong>of</strong> renewable energy with a low escalation rate;4. Beginning in 2013, RPU should enter into 10-15 MW baseload renewable resourcepurchases every other year to meet future load growth and replace expiring power supplycontracts. By choosing only renewable energy sources in the future, RPU can protect10 The Firm Access Receipt and Off-System Delivery (FAR OFF) program is the system <strong>of</strong> firm access rights and<strong>of</strong>f-system delivery on the SoCalGas transmission system. FAR OFF will be implemented on October 1, 2008, andwill provide customers, gas suppliers and California producers with new options and opportunities related totransmission pricing and character <strong>of</strong> service.16
<strong>City</strong> <strong>of</strong> <strong>Riverside</strong> Public Utilities Department2008 <strong>Power</strong> Supply Integrated Resource Planitself against rapidly escalating natural gas costs and actually reduce long-term costs asnatural gas prices escalate more quickly than renewable energy costs;5. RPU should attempt to extend the 23 MW BPA Capacity Sale/Exchange Agreement setto expire in 2011. This contract provides significant summer capacity and peaking energybenefits to RPU that would be difficult to replace with other types <strong>of</strong> power purchaseagreements;6. Several types <strong>of</strong> DSM programs are cost effective from a utility, participating and nonparticipatingcustomer viewpoint. These programs include thermal energy storage, centralheating and cooling districts and distributed solar generation programs. RPU’s <strong>Power</strong>Planning/Marketing group and Public Benefits group should work together closely toimplement these programs and reduce the need for additional generation to meet summerpeaking requirements;7. RPU should include the likelihood <strong>of</strong> carbon taxes or GHG taxes in all resource planningand conservation/DSM efforts beyond 2010. Proposals under AB 32 include carbon taxesranging between $30 and $50/MWh;8. MRTU could significantly change the way that RPU’s resources are dispatched. WhileRPU has the option to “self-schedule” 11 all its existing resources to meet load, MRTUcould result in lower energy costs if an appropriate bidding strategy is utilized. RPUshould also investigate the possibility <strong>of</strong> bidding its internal resources as both spin andnon-spinning reserve to increase revenues; and9. One <strong>of</strong> RPU’s greatest risks under MRTU is the effect <strong>of</strong> transmission congestionpricing. RPU should anticipate actively managing the acquisition and use <strong>of</strong> CongestionRevenue Rights to hedge these considerable cost risks.11 The term “Self-Schedule” refers to a MRTU market participant’s option to purchase transmission service from theCAISO as a price taker; i.e., resource schedules are submitted to the CAISO without associated congestionmanagement bids that might otherwise limit the market participant’s exposure to congestion costs. Without suchbids, the market participant is declaring to the CAISO’s business systems that it wishes to use CAISO transmissionregardless <strong>of</strong> potential congestion costs.17
<strong>City</strong> <strong>of</strong> <strong>Riverside</strong> Public Utilities Department2008 <strong>Power</strong> Supply Integrated Resource PlanCHAPTER 2 – DEMAND AND ENERGY FORECASTIntroductionThe load forecast is an integral part <strong>of</strong> RPU’s power resource planning process, with forecastedpeak demands and energy requirements vital for determining future resource acquisitions andMRTU strategies. It is also an effective process for predicting future retail sales revenue andestablishing strategic planning requirements for the electric distribution system.MethodologyThe objective <strong>of</strong> the load forecast model is to produce reliable estimates <strong>of</strong> RPU’s monthlysystem energy requirements and monthly peak demands. This is achieved by analyzing customerclass data components and examining trends in customer growth and energy use. Forecasts <strong>of</strong>customer growth are then developed using population and/or employment projections. Thismethod applies to Residential and Commercial classes. The Miscellaneous class, which makesup 2 percent <strong>of</strong> RPU’s energy requirements, is modeled as a simple function <strong>of</strong> <strong>Riverside</strong>’spopulation. Monthly peak demands are then derived by applying monthly load factors to themonthly energy requirements.Customer ClassesTo analyze historical energy usage, customers are divided into three classes:• Residential: Includes all rate subclasses;• Commercial: Includes all commercial, industrial and large time-<strong>of</strong>-use customers; and• Miscellaneous: Includes outdoor lighting, street lights and traffic signals.Independent VariablesA variety <strong>of</strong> independent variables and combinations <strong>of</strong> variables were evaluated in the customerenergy use sub-models to identify which ones were most significant for each customer class. Thehistorical data selected for independent variables, in order <strong>of</strong> significance, were: city population,heating and cooling degree-days, county employment, retail price <strong>of</strong> electricity and city percapitaincome.Statistical AnalysisLinear regressions <strong>of</strong> energy sales were performed for Residential and Commercial classes usingmonthly historical data from January 2002 through December 2007. The linear equationsdeveloped from these regressions were then used to project monthly energy sales by customerclass for 2008 through 2026. Linear regressions performed for the Miscellaneous class were notviable due to significant migration <strong>of</strong> accounts to the Commercial class over the past few years.18
<strong>City</strong> <strong>of</strong> <strong>Riverside</strong> Public Utilities Department2008 <strong>Power</strong> Supply Integrated Resource PlanResidentialThe residential rate class makes up 90 percent <strong>of</strong> the <strong>City</strong>’s electric customers and accounts for35 percent <strong>of</strong> total energy sales. Over the past ten years (1998-2007), energy sales grew at anaverage annual rate <strong>of</strong> 2.6 percent. During the same period, <strong>Riverside</strong>’s population—the primarydriver for this class—grew at an average annual rate <strong>of</strong> 1.9 percent. This would infer that energyuse per customer is increasing.Population, electricity price, and cooling and heating degree-days were the independent variablesused in the historical energy sales regression analysis, where Monthly Residential Energy Salesequal :(Population * 0.7590) + (CDD * 92) + (HDD * 36) – (Price * 1,353,977)Applying this equation to the forecast model, residential energy sales are expected to grow at anaverage annual rate <strong>of</strong> 1.8 percent between 2008 and 2017. Over the same period, <strong>City</strong>population is projected to grow at an average annual rate <strong>of</strong> 1.6 percent.CommercialThe commercial rate classes make up 10 percent <strong>of</strong> the <strong>City</strong>’s electric customers, but account for63 percent <strong>of</strong> total energy sales. Over the past ten years (1998-2007), energy sales grew at anaverage annual rate <strong>of</strong> 3.0 percent. During the same period, <strong>Riverside</strong> County employment—theprimary driver for this class—grew at an average annual rate <strong>of</strong> 3.8 percent.Employment and cooling/heating degree-days were the independent variables used in thehistorical energy sales regression analysis, where Monthly Commercial Energy Sales equal:(Employ * 0.1248) + (CDD * 48) – (HDD * 20)Applying this equation to the forecast model, commercial energy sales are expected to grow at anaverage annual rate <strong>of</strong> 2.2 percent between 2008 and 2017. Over the same period, Countyemployment is projected to grow at an average annual rate <strong>of</strong> 2.3 percent.MiscellaneousThe miscellaneous rate class accounts for only 2 percent <strong>of</strong> total energy sales. Due to asignificant migration <strong>of</strong> meters into the commercial class during the past few years, it wasimpossible to perform regression analysis on this data. Therefore the miscellaneous class wasforecasted as a simple function <strong>of</strong> <strong>City</strong> population, starting with 2007 data, where the MonthlyMiscellaneous Energy Growth Rate equals:(0.0082) * <strong>City</strong> Population Growth RateApplying this equation to the forecast model, miscellaneous energy sales are expected to grow atan average annual rate <strong>of</strong> 1.6 percent between 2008 and 2017.19
<strong>City</strong> <strong>of</strong> <strong>Riverside</strong> Public Utilities Department2008 <strong>Power</strong> Supply Integrated Resource PlanSystem Energy RequirementsOnce the monthly energy sales forecast model for the three customer classes is completed,individual class forecasts are summed to obtain total annual energy sales. Then, electricdistribution system losses <strong>of</strong> 5 percent are added to the total energy sales, where Monthly SystemEnergy Requirements equal:Monthly Energy Sales * 1.05System energy requirements are forecasted to grow at an average annual rate <strong>of</strong> 2.1 percentbetween 2008 and 2017. For comparison, the annual growth rate averaged 2.7 percent from 1998to 2007.Monthly Peak DemandsAverage monthly load factors were developed from historical energy and peak demands (1991-2007), where Monthly Load Factor equals:Monthly Energy (MWh)Monthly Peak Load (MW) x Hours in MonthForecasted monthly peak demands were then calculated by multiplying the respective month’sload factor by the forecasted monthly energy requirement, where Monthly Peak Load equals:Scenario AnalysisMonthly Energy RequirementMonthly Load Factor * 730In the forecast model, “normalized” monthly cooling degree- and heating degree-days were usedas independent variables. Therefore, the energy and peak demand projections in the forecastexpect “normal” weather throughout the years. However, weather conditions play a significantrole in how the <strong>City</strong>’s customers use energy. Summer heat waves especially have a significantimpact due to increased air conditioning load. For this reason, two modeling scenarios were runto reflect adverse hot and adverse cool weather conditions.Hot Weather ScenarioFor the effects <strong>of</strong> adverse warm weather, cooling degree- and heating degree-days from thewarmest year in the past twenty were used in the forecast model. The outcome demonstrated thatadverse warm weather can increase annual energy requirements by 4.4 percent and annual peakloads by 7.4 percent.20
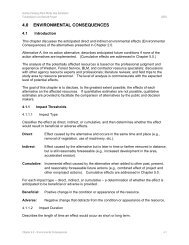
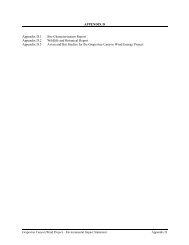
<strong>City</strong> <strong>of</strong> <strong>Riverside</strong> Public Utilities Department2008 <strong>Power</strong> Supply Integrated Resource PlanCool Weather ScenarioFor the effects <strong>of</strong> adverse cool weather, cooling degree-days and heating degree-days from thecoolest year in the past twenty were used in the forecast model. The outcome demonstrated thatadverse cool weather can reduce annual energy requirements by 2.3 percent and annual peakloads by 6.8 percent.Forecast ResultsFigure 2.1 presents the forecast <strong>of</strong> monthly energy requirements from 2008 through 2017 for thehot and cool scenarios. Annual energy growth is 1.9 percent between 2008 and 2017, althoughhot weather can increase annual requirements by as much as 100 GWh. At the other extreme,cool weather can reduce annual forecasted amounts by approximately 50 GWh. The primaryreason for the smaller impact <strong>of</strong> cool weather is that cooler weather does not significantly reducewinter energy use in comparison to baseline assumptions.Peak demand growth is projected to be 1.5 percent annually with temperature impacts on annualpeak demand adding or subtracting 43 MW. That is, a cool or hot summer can increase ordecrease annual peak demand by 43 MW from the baseline scenario. Figure 2.2 presents thelong-term peak demand forecast.300,000Figure 2.1: System Energy Requirements280,000260,000E n e r g y (M W h)240,000220,000200,000180,000160,000140,000120,000100,000Jan-02Jan-03Jan-04Jan-05Jan-06Jan-07Jan-08Jan-09Jan-10Jan-11Jan-12Jan-13Jan-14Jan-15Jan-16Jan-17HISTORICAL HOT FORECAST COOL FORECAST21
<strong>City</strong> <strong>of</strong> <strong>Riverside</strong> Public Utilities Department2008 <strong>Power</strong> Supply Integrated Resource PlanFigure 2.2: System Peak Demands800750700650600550500450400350300250200150100500Jan-02Jan-03Jan-04Jan-05Jan-06Jan-07Jan-08Jan-09Jan-10MWJan-11Jan-12Jan-13Jan-14Jan-15Jan-16Jan-17HISTORICAL HOT FORECAST COOL FORECAST 1 in 50 HOT FORECASTSummaryAppendix B presents the forecasts <strong>of</strong> monthly energy requirements and peak demand under thedifferent temperature assumptions.Both annual peak demand and energy requirements continue to grow but at a slower rate than hasbeen seen over the past five years, primarily due to the current weak economic conditions inCalifornia that are expected to continue into late 2009 or mid 2010.22
<strong>City</strong> <strong>of</strong> <strong>Riverside</strong> Public Utilities Department2008 <strong>Power</strong> Supply Integrated Resource PlanCHAPTER 3 – EXISTING GENERATION RESOURCESIntroductionRPU’s resource portfolio has evolved to address key issues such as market price volatility, risktolerances, internal generation needs, increasing load demands and a commitment to renewableresources. In particular, RPU is well positioned to respond favorably to regulatory risk andCalifornia’s legislative mandates by delaying long-term, non-renewable resource commitmentsduring the pendency <strong>of</strong> the CAISO’s MRTU market implementation.This mix <strong>of</strong> resources was sufficient to meet RPU’s all-time summer peak demand <strong>of</strong> 610 MWset in August 2007.Table 3.1: 2008 Long-term Resource PortfolioEXISTINGCAPACITYTYPERESOURCES(MW)EXPIRATION ASSET TYPESan On<strong>of</strong>re Baseload, Nuclear 40 2022 OwnershipIntermountain Baseload, Coal 137 2027 Bilateral ContractPalo Verde Baseload, Nuclear 12 2027 Bilateral ContractHoover Annual Peaking, Hydro 26 2017 Bilateral ContractSprings Internal Gen, Gas 40 None OwnershipRERC 1 & 2 Internal Gen, Gas 98 None OwnershipDeseret Baseload, Coal 52 2009 Bilateral ContractBPA lAnnual Peaking23 Summer16 Winter2011 Bilateral ContractBPA llAnnual Peaking60 Summer15 Winter2016 Bilateral ContractWintec Renewable, Wind 1 2017 Bilateral ContractBadlands Renewable, Biomass 1 2008 Bilateral ContractNeo Renewable, Biomass 5 2008 Bilateral ContractSalton SeaRenewable,Geothermal20/46 (6/2009) 2020 Bilateral ContractPOTENTIALRESOURCESClearwaterGeothermalTYPEBaseload, CombinedcycleRenewable,GeothermalCAPACITY(MW)EXPIRATIONASSET TYPE28 None Ownership50 ‣ 2025 Bilateral ContractFUTURE, UNDERCAPACITYTYPEEXPIRATION ASSET TYPECONTRACT(MW)Renewable,32 (2010)Renaissance30 Years Bilateral ContractGeothermal64 (2011)RERC 3 & 4 Internal Gen, Gas 98 (2010) None OwnershipHowever, several contracts are expiring. Note that in addition to the CDWR contracts thatexpired in 2007 (totaling 53 MW), RPU must also replace the 52 MW Deseret contract in 2009and the 23/16 MW BPA Capacity Sale/Exchange Agreement (i.e., BPA 1) in 2011. If approved23
<strong>City</strong> <strong>of</strong> <strong>Riverside</strong> Public Utilities Department2008 <strong>Power</strong> Supply Integrated Resource Planby its governing bodies, RPU’s planned economic acquisition <strong>of</strong> the <strong>City</strong> <strong>of</strong> Corona’s ClearwaterGenerating Station will partially replace the expired CDWR contracts, and RPU’s recentexecution <strong>of</strong> a long-term power purchase for the Renaissance geothermal power project willreplace the expiring Desert contract.Table 3.2 presents RPU’s loads and resources showing annual capacity requirements andexisting generation capacity.Table 3.2: Loads and ResourcesForecasted Peak Demand(MW)Required Reserves(15 percent)Total CapacityRequirement (MW)Resource Capacity (MW)20082009Q1/Q22009Q3/Q42010 2011 2012 2013 2014 2015580 5 590 590 600 611 621 632 643 65587 89 89 90 92 93 95 96 98667 679 679 690 703 714 727 739 753Internal Generation (MW)Springs 1 10.0 10.0 10.0 10.0 10.0 10.0 10.0 10.0 10.0Springs 2 10.0 10.0 10.0 10.0 10.0 10.0 10.0 10.0 10.0Springs 3 10.0 10.0 10.0 10.0 10.0 10.0 10.0 10.0 10.0Springs 4 10.0 10.0 10.0 10.0 10.0 10.0 10.0 10.0 10.0RERC 1 49.0 49.0 49.0 49.0 49.0 49.0 49.0 49.0 49.0RERC 2 49.0 49.0 49.0 49.0 49.0 49.0 49.0 49.0 49.0RERC 3 0 0 0 49.0 49.0 49.0 49.0 49.0 49.0RERC 4 0 0 0 49.0 49.0 49.0 49.0 49.0 49.0Within CAISOSONGS 2 20.1 20.1 20.1 20.1 20.1 20.1 20.1 20.1 20.1SONGS 3 20.1 20.1 20.1 20.1 20.1 20.1 20.1 20.1 20.1Badlands 1.2 0 0 0 0 0 0 0 0Wintec 1.3 1.3 1.3 1.3 1.3 1.3 1.3 1.3 1.3Neo 4.6 0 0 0 0 0 0 0 0Cogeneration Unit 14.0 28.0 28.0 28.0 28.0 28.0 28.0 28.0 28.0External to CAISOPVNGS 1 4.0 4.0 4.0 4.0 4.0 4.0 4.0 4.0 4.0PVNGS 2 4.0 4.0 4.0 4.0 4.0 4.0 4.0 4.0 4.0PVNGS 3 4.0 4.0 4.0 4.0 4.0 4.0 4.0 4.0 4.0IPP1 68.5 68.5 68.5 68.5 68.5 68.5 68.5 68.5 68.5IPP2 68.5 68.5 68.5 68.5 68.5 68.5 68.5 68.5 68.5Salton Sea Unit 5 20.0 20.0 46.0 46.0 46.0 46.0 46.0 46.0 46.0Hoover 26.0 26.0 26.0 26.0 26.0 26.0 26.0 26.0 26.0Deseret 52.0 52.0 52.0 0.0 0.0 0.0 0.0 0.0 0.0BPA 83.0 83.0 83.0 83.0 83.0 60.0 60.0 60.0 60.0BaseloadRenewable/Renaissance0 0 0 32.0 64.0 64.0 64.0 64.0 64.0Resource AdequacyCapacity Purchase165.0 0.0 0.0 0.0 0.0 0.0 0.0 0.0 0.0Total Resources 694.3 537.5 563.5 641.5 673.5 650.5 650.5 650.5 650.5Surplus (Deficit) 27.30 (141.50) (115.50) (48.50) (29.50) (63.50) (76.50) (88.50) (102.50)24
<strong>City</strong> <strong>of</strong> <strong>Riverside</strong> Public Utilities Department2008 <strong>Power</strong> Supply Integrated Resource PlanResource CapacityAs illustrated in Figure 3.1, <strong>Riverside</strong>’s resource portfolio has evolved over the past decade toaddress regulatory changes, market volatility and environmental concerns, while preserving theFigure 3.1: RPU's Resource Mix800M E G A W A T T S70060050040030020010001996 2001 2006 2008 2010Internal GenerationSummer PeakingAnnual PeakingQ3 Term ContractsRenewable ResourcesBaseloadSystem Peak Loadflexibility necessary to react to regulatory risk, RPU has delayed non-renewable long-termresource procurement to guard against entering into any power purchase agreement that wasinconsistent with the CAISO’s evolving market redesign.Summer ResourcesFrom a wholesale power supply perspective, there are presently adequate resources to meetshort-term summer peak loads, plus reserves, under both normal and adversely hot summerweather conditions. 12 Internal generation (Springs and RERC) would be dispatched last (as themost expensive generation) to meet high temperature related demand. Conversely, in a coolerthan-normalsummer scenario, internal generation units would only be needed to cover the forcedoutage <strong>of</strong> another resource or to respond to a RPU distribution system reliability concern.12 This IRP speaks only to the fulfillment <strong>of</strong> RPU’s wholesale power supply needs, and does not address internaltransmission system planning and operating criteria. Although RPU has “adequate resources to meet short-termsummer peak loads under both normal and adversely hot summer weather conditions” from a power supplystandpoint, RPU’s ability to import power through its interconnection to the CAISO grid is limited and must besupplemented by the use <strong>of</strong> RPU’s internal generating capability to maintain system reliability, typically duringsummer periods. RPU is constructing the <strong>Riverside</strong> Transmission Reliability Project, a second interconnection withCAISO grid, and when energized in 2014 the dependence on running out <strong>of</strong> merit internal generation will belessened.25
<strong>City</strong> <strong>of</strong> <strong>Riverside</strong> Public Utilities Department2008 <strong>Power</strong> Supply Integrated Resource PlanSpring/Fall ResourcesSummer-level capacity associated with the BPA contracts and internal generation help to providesufficient coverage for the transitional months in spring and fall. June and October loads areparticularly unpredictable due to a historically wide range <strong>of</strong> weather events, such as a cool“June Gloom” or “Indian Summer” heat wave in October.Winter ResourcesBaseload and winter peaking resources provide adequate capacity to meet docile loads duringthis 6-month period. Surplus baseload energy during the <strong>of</strong>f-peak hours is used to return energyto BPA in payment for peaking capacity and energy previously provided by BPA under theexchange agreements.Summary <strong>of</strong> ResourcesThe following charts illustrate the fuel diversity mix <strong>of</strong> energy sold to retail customers in 2005and 2007. Note that the California Energy Commission’s revision <strong>of</strong> its guidebook entitledRenewables Portfolio Standard Eligibility (Third Edition, 2007) precluded RPU’s use <strong>of</strong>Renewable Energy Credits (RECs) beginning in 2007. Thus, <strong>Riverside</strong> was prevented fromcontinuing its practice <strong>of</strong> at least levelizing its renewable energy percentage through theprocurement <strong>of</strong> small hydro and wind energy Renewable Energy Credits (a.k.a., “Green Tags”)from the Bonneville <strong>Power</strong> <strong>Administration</strong>.Figure 3.3: Energy Fuel Mix Comparison2005 Retail Sales - Energy Fuel MixNatural Gas0.1%Large Hydro4.9%Nuclear19.0%Renewable13.0%Coal63.0%26
<strong>City</strong> <strong>of</strong> <strong>Riverside</strong> Public Utilities Department2008 <strong>Power</strong> Supply Integrated Resource Plan2007 Retail Sales - Energy Fuel MixNatural Gas6.0%Large Hydro6.0%Nuclear11.0%Renewable9.0%Coal68.0%27
<strong>City</strong> <strong>of</strong> <strong>Riverside</strong> Public Utilities Department2008 <strong>Power</strong> Supply Integrated Resource PlanIntroductionCHAPTER 4 - CONSERVATION AND DEMAND-SIDE MANAGEMENTAn important portion <strong>of</strong> RPU’s resource strategy is expanded conservation and DSM programs.Conservation programs are intended to reduce the total amount <strong>of</strong> energy used by customers.Examples <strong>of</strong> conservation programs include replacement <strong>of</strong> incandescent light bulbs withcompact fluorescent bulbs, as well as replacement <strong>of</strong> air conditioner and refrigerator units withmore energy efficient models. In this case, the customer uses less energy at all times <strong>of</strong> the day.Another conservation example is encouraging industrial customers to use more efficient motorsto reduce total energy use.DSM programs, in contrast to strict conservation measures, do not necessarily reduce the totalamount <strong>of</strong> energy used by customers but instead change the timing <strong>of</strong> energy usage, movingenergy use from high production cost periods to low production cost periods. Examples <strong>of</strong> DSMprograms include pool pump programs that encourage customers to operate their pool pumpsduring <strong>of</strong>f-peak periods or thermal energy storage systems that shift air conditioning loads to <strong>of</strong>fpeakperiods.Conservation programs tend to save customers money by reducing the total amount <strong>of</strong> energypurchase, while DSM programs tend to reduce overall utility costs, hence allowing rate stabilityor reduction, by reducing the amount <strong>of</strong> capacity required to meet customer needs.Evaluating Conservation and DSM ProgramsThree high level perspectives can be used to evaluate the cost-effectiveness <strong>of</strong> a conservation orDSM program. These are:• Effect on the customer• Effect on the utility• Effect on societyBy examining the financial impacts on each <strong>of</strong> these groups, RPU can identify the mix <strong>of</strong>conservation/DSM programs that maximizes the benefits to each customer class and minimizesthe financial impacts on RPU and non-participating customers.Each type <strong>of</strong> conservation/DSM program affects the participating customer, non-participatingcustomers and the utility. Generally, a customer that participates in one or more <strong>of</strong> theseprograms reduces their costs and their payments to the utility. At the same time, the utility canreduce power supply costs. However, if the utility’s reduction in power supply costs is less thanthe customer’s reduction in costs, the utility must raise rates to other, non-participatingcustomers. That is, even though the utility’s costs decline as a result <strong>of</strong> a conservation/DSMprogram, the utility’s revenues decline more and the utility must raise rates to non-participatingcustomers.28
<strong>City</strong> <strong>of</strong> <strong>Riverside</strong> Public Utilities Department2008 <strong>Power</strong> Supply Integrated Resource PlanMany conservation programs raise costs to non-participating customers. DSM programsgenerally do not have the same negative impact on non-participating customers, instead reducingutility costs more than the decline in utility revenue, allowing the utility to reduce costs for allcustomers.RPU Avoided CostsThe underlying premise <strong>of</strong> DSM programs is that they encourage customers to switch energy usefrom a higher cost period (1 pm to 8 pm) to a lower cost period (11 pm to 7 am, or weekends).As a result, RPU’s total cost <strong>of</strong> meeting customer requirements will decline.The cost <strong>of</strong> producing energy to meet customer requirements varies during the day. During thelow load hours, energy from RPU’s inexpensive generation resources is used to meet customerdemands. But as load increases, more expensive generation resources are used to meet theincrease in customer demand.To the extent customers can reduce their energy consumption during the high cost periods anduse as much or more energy during the low cost periods, the utility’s total costs (and rates)decline.Measuring the Effect <strong>of</strong> a Conservation/DSM Program on a Participating CustomerIf a customer chooses to participate in a conservation/DSM program, their financial savings ineach year are equal to:Savings = ((kWh saved) * (retail rate)) + ((Demand Reduction) * (Demand Rate)) + ((UtilityIncentives) – (Program Costs))If the energy savings, plus any utility incentives, are greater than program participation costs, thecustomer should participate in the DSM/conservation program.For most non-demand metered customers, primarily those in the residential and smallcommercial classes, the financial success <strong>of</strong> a program is primarily due to reducing total energyuse. Hence, programs that are most attractive to residential customers are those that are targetedat high energy use applications, such as lighting, refrigeration and air conditioning (and electricheating).For demand metered customers, the program benefits are <strong>of</strong>ten dominated by demand chargesavings.Measuring the Effect <strong>of</strong> a Conservation/DSM Program on the UtilityThe impact <strong>of</strong> a new DSM/conservation program on the utility is the utility’s reduction in powersupply costs, less its costs that include any rebates or incentives paid to participating customersand the future reduction in retail revenues.29
<strong>City</strong> <strong>of</strong> <strong>Riverside</strong> Public Utilities Department2008 <strong>Power</strong> Supply Integrated Resource PlanFor most programs, the greatest cost to the utility is the future reduction in revenues from theretail customer, although the size <strong>of</strong> any program rebates will affect the overall program benefits.The reduction in power supply costs is more difficult to measure. If a program reduces on-peakcosts, then the savings could be substantial. But, a program that reduces energy costs (and thuscustomer energy use) during low load periods might have detrimental cost impacts if the utilitymust sell the newly-created surplus energy at a loss.The utility generally maximizes power supply cost savings by reducing its purchase <strong>of</strong> high cost,on-peak energy during the highest load periods <strong>of</strong> the day.One <strong>of</strong> the more important parts <strong>of</strong> the analysis is recognizing that if the financial impact on theutility is negative, non-participating customers will be required to subsidize the participatingcustomers through increased rates.Measuring the Effect <strong>of</strong> a Conservation/DSM Program on SocietyThe impact <strong>of</strong> a program on society is actually very difficult to quantify due to the large number<strong>of</strong> externalities that can be considered. How can the reduction in greenhouse gas emissions bequantified and included in the analysis? What other externalities should be included in theanalysis and how should they be priced?From a societal viewpoint, if any externalities are included in the analysis, the benefits <strong>of</strong>conservation/DSM programs are almost always positive. The biggest issue is then determininghow the program costs and benefits will be divided between the utility, participating and nonparticipatingcustomers.Existing RPU ProgramsRPU currently has a wide mix <strong>of</strong> conservation/DSM programs aimed at all segments <strong>of</strong> itscustomer base, as shown in Table 4.1 below. These programs result in annual energy savings toRPU <strong>of</strong> 7,311 MWh (0.3 percent <strong>of</strong> 2007 customer energy requirements) and demand savings <strong>of</strong>1.71 MW (0.3 percent <strong>of</strong> customer 2007 peak demand). Additionally, GHG emissions arereduced by 76,541 tons annually, equating to 0.01 percent <strong>of</strong> <strong>Riverside</strong>’s total 2005 GHGemissions. 13Future Conservation/DSM ProgramsAs energy prices continue to rise, the value <strong>of</strong> new conservation/DSM programs will continue toincrease. RPU is evaluating the cost-effectiveness <strong>of</strong> a variety <strong>of</strong> new programs with the intent <strong>of</strong>expanding as many programs as financially viable.13 2005 GHG emissions were quantified and audited through RPU’s membership and participation in the CaliforniaClimate Action Registry.30
<strong>City</strong> <strong>of</strong> <strong>Riverside</strong> Public Utilities Department2008 <strong>Power</strong> Supply Integrated Resource PlanTable 4.1: RPU's Current Conservation and DSM Programs and ResultsUnits InstalledCoincident Peak Savings(kW)Annual Energy Savings (kWh)Lifecycle Energy Savings(kWh)Incentive Provided by Utility($)Measure NameTOTAL 1,708 1,693 7,311,434 155,396,295 76,54114 SEER (11.99 EER)-Split System 800 0.04 29 522 $100 $93 34 53 23,200 417,600 21315 SEER (12.72 EER) -Split System 260 0.09 70 1,260 $100 $185 23 32 18,200 327,600 167Clothes Washer: GasWater Heating 736 0.01 29 290 $75 $181 9 9 21,344 213,440 98Dishwasher: Singlefamily– Gas WaterHeating 598 0.01 32 416 $50 $134 8 6 19,136 248,768 105Refrigerator: Side MountFreezer 600 0.02 98 1,764 $100 $97 10 10 58,800 1,058,400 450Refrigerator: Top MountFreezer 783 0.02 87 1,566 $100 $161 12 12 68,121 1,226,178 522Room Air Conditioner(10.8 EER) 113 106 1,272 $50 $30 19 12 11,978 143,736 73Totally Enclosed, FanCooled 500HP-1800RPM Motor 2 5 43,678 655,170 $10,000 $9,683 11 14 87,356 1,310,340 552Wall Blown-in R0 to R13Insulation-Batts 42 97 1,940 $100 $1,322 6 6 4,074 81,480 38Pool Pump: Two Speed 51 1 1,400 14,000 $125 $182 28 49 71,400 714,000 336ProgrammableThermostat 165 (192) (2,112) $25 $17 (60) (31,680) (348,480) (141)Weatherization for AirConditioned Residence 54 4 49 $250 $270 1 1 205 2,668 1Whole House Fan withAir Conditioning 40 (3) (45) $75 $695 () (120) (1,800) (1)Window Replacement:Clear Windows 4,112 9 180 $12 $340 90 90 37,008 740,160 341>=300 tons VSD onCentrifugal Water CooledChiller EarlyReplacement 1 458 9,160 $25,000 $373 458 9,160 4Packaged terminal heatpump (7-15k) EarlyReplacement 5 501 7,515 $1,100 $1,535 1 2 2,505 37,575 16Shade Trees 9,183 419 12,569 $25 $40 533 533 3,847,449 115,423,470 58,744T-12 to T-8: 4 foot lamp 1,200 .02 60.0 660 $42 $12.70 24 24 72,000 792,000 352HID (400w) to T-8 3,000 .30 1,000.0 11,000 $75 $12.70 900 900 3,000,000 33,000,000 14,672Measure Cost (per Cost Unit)Coincident Peak Savings(kW)Demand Savings (kW)Annual Energy Savings (kWh)Lifecycle Energy Savings(kWh)GHG Reductions (Tons)31
<strong>City</strong> <strong>of</strong> <strong>Riverside</strong> Public Utilities Department2008 <strong>Power</strong> Supply Integrated Resource PlanPrograms that reduce summer peak demand requirements tend to have the greatest value to RPU,although not necessarily to participating customers without time-<strong>of</strong>-use billing. From RPU’sviewpoint, the most economic programs would include expansion <strong>of</strong> thermal energy storage andair conditioner replacement programs. These programs tend to shift energy use to low costperiods with no significant impact on the total energy requirement. Residential and non-demandmetered commercial customers prefer programs that reduce the total amount <strong>of</strong> energy they use,such as lighting upgrades and refrigerator/freezer replacement programs.RPU can identify the avoided capacity costs due to installation <strong>of</strong> DSM programs by itscustomers. To encourage DSM programs, RPU can <strong>of</strong>fer incentives based upon its avoidedcapacity costs. DSM programs should be developed to reduce on-peak energy use, especiallyduring the summer months, and to increase the use <strong>of</strong> RPU’s current and forecasted surplus <strong>of</strong><strong>of</strong>f-peak generation.32
<strong>City</strong> <strong>of</strong> <strong>Riverside</strong> Public Utilities Department2008 <strong>Power</strong> Supply Integrated Resource PlanCHAPTER 5 – FUTURE RESOURCE REQUIREMENTSIntroductionWhen choosing the types <strong>of</strong> resources that RPU should acquire, either through long-term powersupply purchases or ownership interests, a number <strong>of</strong> different factors are taken intoconsideration. These evaluation factors include traditional measures such as the resource’soperating characteristics, transmission availability, cost, availability <strong>of</strong> fuel, compatibility withthe existing resource mix, and a variety <strong>of</strong> new regulatory requirements.In the past, resource planning was performed by identifying the unmet future requirements forboth capacity and energy and then adding resources exhibiting the appropriate costs andoperating characteristics. A variety <strong>of</strong> new resource options would be added to the existingresource mix and the net present value <strong>of</strong> power supply costs over some period would becalculated. The operating characteristics <strong>of</strong> the resources were varied to identify differentresource options. The resource option that resulted in the lowest net present value would beselected, assuming transmission access was available.This type <strong>of</strong> analysis <strong>of</strong>ten results in choosing the least-cost resource without regard to otherconsiderations such as environmental impacts or system reliability, each <strong>of</strong> which affect costs inthe future. As an example, adding a new coal-fired facility to replace the expired CDWRcontracts might result in the lowest overall power supply cost, but it does not account for theregulatory and non-price restrictions on the use <strong>of</strong> coal.Another example would be to select a resource that has inappropriate operating characteristics. Agas-fired, combined-cycle plant will have lower energy costs than a gas-fired, simple-cycleturbine if operated for sixteen hours each day, but may not be economic when restricted tooperating for only a few hours per day to meet peaking requirements. Conversely, utilizingrelatively high cost simple-cycle generating units for baseload or quasi-baseload operation istypically not viewed as an economic alternative.Choosing the appropriate resources can significantly reduce long-term power supply costs. Inaddition, other resource planning objectives, such as meeting renewable resource procurementgoals, are included in RPU’s resource analysis.Resource Acquisition GoalsRPU has several resource planning goals intended to provide reliability and price certainty forretail customers. These goals include, but are not limited to, acquiring sufficient resources tomeet load, including Resource Adequacy plus Local Capacity Requirements, minimizing powersupply costs and procuring renewable resources to meet the Renewable Portfolio Standard goalsset by the Board <strong>of</strong> Public Utilities and <strong>City</strong> Council.Renewable resources may have an initial cost that is greater than traditional natural gas-firedgeneration. However, the escalation rate <strong>of</strong> energy costs for renewable resources is significantly33
<strong>City</strong> <strong>of</strong> <strong>Riverside</strong> Public Utilities Department2008 <strong>Power</strong> Supply Integrated Resource Planless than the cost forecasted for natural gas-fired resources. As a result, after a few years manyrenewable resources are less expensive than comparable natural gas-fired resources.By adding 10 to 15 MW <strong>of</strong> new long-term baseload renewable resources to RPU’s renewableresource portfolio each year beginning in 2013, the rate impact <strong>of</strong> renewable resources can bemitigated and RPU would have almost 200 MW <strong>of</strong> renewable resources by 2015, providing overhalf <strong>of</strong> RPU’s energy requirements with no significant rate impact.Resource Requirements 2008 – 2010The first period examined was CY 2008 through CY 2010. This period was chosen to determineRPU’s immediate capacity and energy needs, including through the first year <strong>of</strong> MRTUoperation.2008 Resource RequirementsThe following table presents RPU’s loads and capacity resources for CY 2008:Table 5.1: 2008 Monthly Loads and ResourcesForecastedReservePeakMonthObligationDemand(MW)(MW)TotalRequirement(MW)ExistingResources(MW)Surplus orDeficit (-)(MW)Jan 311 47 358 473 115Feb 307 46 353 475 122Mar 317 48 365 440 75Apr 357 54 411 417 6May 409 61 470 496 26Jun 490 74 564 589 25July 564 85 649 651 2Aug 580 87 667 676 9Sep 539 81 620 626 6Oct 405 61 466 493 27Nov 345 52 397 486 89Dec 321 48 369 509 140From a Resource Adequacy, or capacity-only perspective, RPU will meet its capacity obligationsin FY 2008 by purchasing 20 MW <strong>of</strong> local capacity from Shell Trading, Inc. and summercapacity amounts ranging from 30 to 115 MW. RPU’s procurement <strong>of</strong> Resource Adequacycapacity guarantees the availability <strong>of</strong> energy to the CAISO, but does not include the availability<strong>of</strong> energy to RPU, therefore RPU must still ensure that it has sufficient energy resources to meetretail energy requirements.34
<strong>City</strong> <strong>of</strong> <strong>Riverside</strong> Public Utilities Department2008 <strong>Power</strong> Supply Integrated Resource PlanReplacing the now-expired CDWR summer capacity purchases has been an essential goal <strong>of</strong> theplanning process. CDWR provided 53 MW <strong>of</strong> on-peak capacity and energy that RPU utilized atalmost 100 percent <strong>of</strong> its capability, or slightly less than 10 percent <strong>of</strong> RPU’s total monthlyrequirements during the May through October period.RPU has partially replaced the CDWR purchases for 2008 with purchases <strong>of</strong> capacity and energyfrom the <strong>City</strong> <strong>of</strong> Corona’s 28 MW Clearwater Cogeneration Plant, and a 10 MW baseloadrenewable energy purchase. However, even with these two resource additions, RPU remains 15to 35 GWh (0.6% to 1.4% <strong>of</strong> projected customer energy requirements) short <strong>of</strong> meeting itssummer energy needs, even when operating its internal generation at its maximum level.2009 Resource RequirementsRPU’s Salton Sea Unit 5 geothermal contract increases from 20 MW to 46 MW starting June 1,2009. To meet summer 2009 capacity requirements, RPU has procured sufficient ResourceAdequacy capacity from Reliant Energy.The greatest challenge in 2009 will be operating under the CAISO’s new MRTU marketstructure, where high resource availability and dispatch flexibility have more value than intoday’s market.2010 Resource RequirementsOn December 31, 2009, the 52 MW coal-fired baseload Deseret power purchase agreementexpires. Deseret provides approximately 35 GWh per month <strong>of</strong> energy to meet <strong>Riverside</strong>’s retailcustomer requirements. With the expiration <strong>of</strong> the Deseret contract, RPU would be significantlyshort <strong>of</strong> energy, absent the contracted increase in its Salton Sea Unit 5 baseload geothermalresource from 20 to 46 MW, described above.Even with the 26 MW increase in capacity and energy available from Salton Sea Unit 5beginning June 1, 2009, expiration <strong>of</strong> the Deseret power purchase results in a net loss <strong>of</strong> 26 MW<strong>of</strong> generating capacity. With RPU’s recent finalization <strong>of</strong> the Shoshone Renaissance geothermalproject power purchase agreement, the 26 MW deficit left by the expiration <strong>of</strong> the Deseretresource will be seamlessly replaced before the summer <strong>of</strong> 2010 with a 32 MW baseloadrenewable resource. A second 32 MW unit will be placed in service by Renaissance in 2011 for atotal project capability <strong>of</strong> 64 MW.RPU also anticipates completing construction <strong>of</strong> the two additional gas-fired turbines within the<strong>City</strong> <strong>of</strong> <strong>Riverside</strong> in 2010. These two 49 MW gas-fired generators are intended to providesummer reliability rather than generate significant amounts <strong>of</strong> peaking energy. To meet energyrequirements, RPU is investigating several renewable resource projects in the west as well aslarge, efficient gas-fired combined-cycle facilities near <strong>Riverside</strong>.35
<strong>City</strong> <strong>of</strong> <strong>Riverside</strong> Public Utilities Department2008 <strong>Power</strong> Supply Integrated Resource PlanSummary <strong>of</strong> 2008 – 2010 Resource RequirementsEven though load growth is anticipated to be relatively low for the next two years as a result <strong>of</strong>the ongoing economic slowdown, the expiration <strong>of</strong> two important power supply contracts wouldhave resulted in a significant shortage <strong>of</strong> energy without corrective actions having been taken by<strong>Power</strong> Resources staff. From a capacity viewpoint, RPU is slightly short during the summer2010 months, but has sufficient capacity during the winter, spring and fall.RPU has purchased sufficient Resource Adequacy capacity for 2008 and 2009 in order to meetthe CAISO’s tariff requirements, and the commercial operation <strong>of</strong> the first 32 MW Renaissancegeothermal resource in 2010 will contribute significantly to meeting that year’s summer capacityrequirements.Resource Requirements 2010 – 2015The only expiring contract during this period is the 23 MW Bonneville <strong>Power</strong> <strong>Administration</strong>(“BPA”) Capacity Sale/Exchange Agreement (“BPA 1 Agreement”).The BPA 1 Agreement began in 1991 and provides an inexpensive source <strong>of</strong> summer and winterpeaking capacity and energy. RPU schedules up to 23 MW <strong>of</strong> energy from the Pacific Northwestduring limited on-peak hours in the summer period (May through October) and up to 16 MW perhour during limited on-peak hours in the winter period (November through April). RPU returnsthis energy during the evenings. RPU pays for a portion <strong>of</strong> the capacity with energy deliveriesduring the winter and early spring, with payment for the remaining portion settled monetarily.The BPA 1 Agreement’s value depends upon the historic diversity between the Desert Southwestregion, that experiences its peak demands during the summer afternoons due to air conditioning,and the Pacific Northwest region that sees its greatest demands during the winter period as aresult <strong>of</strong> electric heating requirements. Extending this agreement will be beneficial to RPU.However, due to the long-term growth <strong>of</strong> electric demand in the Pacific Northwest and concernsover the future availability <strong>of</strong> water and hydroelectric generation, it is unknown whether BPAwill be willing to extend the agreement for more than a few years, if at all.<strong>Riverside</strong>’s recently executed agreement for geothermal energy from the proposed Renaissanceproject is expected to provide at least 32 MW <strong>of</strong> baseload renewable energy beginning in 2010,with that amount increasing to 64 MW in 2010 or 2011. With the addition <strong>of</strong> this resource,<strong>Riverside</strong> anticipates achieving its goal <strong>of</strong> 33 percent renewable energy in 2011, fully nine yearsbefore the goal established by its Renewables Portfolio Standard.As previously discussed, new baseload renewable resource additions in 10 to 15 MW incrementsbeginning in 2013 can be expected to increase <strong>Riverside</strong>’s renewable energy mix toapproximately 50 percent <strong>of</strong> its retail customer requirements as early as 2013.Other IssuesOther issues include the ultimate disposition <strong>of</strong> RPU’s entitlement in the Intermountain <strong>Power</strong>Project. Currently, RPU has a long-term power purchase agreement with the Intermountain36
<strong>City</strong> <strong>of</strong> <strong>Riverside</strong> Public Utilities Department2008 <strong>Power</strong> Supply Integrated Resource Plan<strong>Power</strong> Agency (“IPA”) for generation from this project 14 . The State <strong>of</strong> California recentlyenacted very restrictive greenhouse gas requirements that will impact existing and potentialresources, such as the Intermountain <strong>Power</strong> Project.At this time, the State’s discussions on greenhouse gas taxes are preliminary and it is not knownwhat level, if any, <strong>of</strong> emission taxes will be imposed. RPU continues to dedicate significantresources, in terms <strong>of</strong> staff time and consulting costs, to monitoring and influencing legislationand the design and implementation rules and regulations affecting RPU’s provision <strong>of</strong> reliable,cost-effective power to its customers.2015 – 2020 Resource RequirementsBeyond 2015, RPU’s resource requirements will depend upon a variety <strong>of</strong> issues such as thesuccess <strong>of</strong> MRTU, development <strong>of</strong> new transmission resources by the CAISO and others in the<strong>Western</strong> States, as well as new regulatory and emissions requirements.At this time, there are no specific resources that RPU is investigating that would come on-lineafter 2015, although RPU’s resource requirements will increase at around 1.9 percent per yearwith the need for summer peaking resources growing faster than loads in the remainder <strong>of</strong> theyear.Consistent with the expressed desire <strong>of</strong> <strong>Riverside</strong>’s governing bodies to promote renewableresources, reduce greenhouse gas emissions and foster a sustainable community, it is expectedthat resource additions during and beyond the referenced period will primarily focus on theprocurement <strong>of</strong> renewable resources.Summary <strong>of</strong> Resource Requirements2008• Economically procured Clearwater gas-fired combined cycle plant (28 MW) for on-peakenergy and capacity needs.• Secured Calpine geothermal renewable contract (10 MW) for baseload energy needs.2009• June 1 st : Existing Salton Sea Unit 5 geothermal contract increases from 20 MW to 46MW.• Sufficient Resource Adequacy capacity for 2009 acquired from Reliant Energy during2008.• December 31 st : 1999 Deseret baseload contract (52 MW) expires.14 The power purchase agreement with IPA extends through 2027.37
<strong>City</strong> <strong>of</strong> <strong>Riverside</strong> Public Utilities Department2008 <strong>Power</strong> Supply Integrated Resource Plan2010• April 1 st : Renaissance Geothermal Project Unit 1 (32 MW) anticipated to begin initialbaseload operations.• June 1 st : RPU’s proposed gas-fired units RERC 3 and 4 (98 MW) expected on-line forsummer on-peak energy and capacity needs.• October 1 st : Renaissance Geothermal Project Unit 2 (32 MW) anticipated to begin initialbaseload operations.2011• January 1 st : Renew BPA 1 (23 MW) if possible, or replace with comparable annual onpeakenergy agreement with another party.• April 1 st : Renaissance Geothermal Project Unit 3 (32 MW) anticipated to begin initialbaseload operations.2013-15• Procure 10-15 MW <strong>of</strong> renewable resources by 2015.2016• Renew BPA 2 (60 MW), or replace with comparable annual on-peak capacity/energyagreement with another party.38
<strong>City</strong> <strong>of</strong> <strong>Riverside</strong> Public Utilities Department2008 <strong>Power</strong> Supply Integrated Resource PlanCHAPTER 6 – RESOURCE EVALUATIONIntroductionGiven the uncertainty <strong>of</strong> regulatory and legislative actions related to greenhouse gas concerns, aswell as implementation <strong>of</strong> the CAISO’s MRTU markets, identifying which resources should beadded to RPU’s existing resource mix is a particularly difficult process. Using Global EnergyDecisions, Inc. (“GED”) production cost model, PaR, a number <strong>of</strong> different resource scenariosare analyzed in an attempt to identify the resources (or the resource characteristics) that shouldbe added to RPU’s future resource mix.Production costing models are used in the electric power industry to simulate the expectedamount <strong>of</strong> electricity produced by different generation units and the expected cost <strong>of</strong> producingelectricity for a given power generation system. Production cost models account for theuncertainty in the availability and use <strong>of</strong> the generating units due to scheduled and forcedoutages and expected avoided costs. Usually, the major component <strong>of</strong> the operating cost for eachunit is its cost <strong>of</strong> fuel.Generally, the results are dependent upon the underlying assumptions used in the modelingprocess. The most critical assumptions used in RPU’s modeling approach include demand andenergy growth and the escalation <strong>of</strong> natural gas prices.The forecasts <strong>of</strong> demand and energy growth were discussed earlier (Chapter 2). This chapterdiscusses the various assumptions used in modeling long-term resource costs, options formeeting the electricity needs <strong>of</strong> RPU’s customers, and recommends a long-term resourceacquisition strategy.Impacts <strong>of</strong> Existing Resources on Future CostsRPU has invested in ownership or long-term power purchase agreements <strong>of</strong> generation resourcesas a way <strong>of</strong> stabilizing energy prices and insuring reliability. RPU’s long term resources 15essentially provide a cushion from market price shocks.RPU’s capacity resources meet almost 80 percent <strong>of</strong> RPU’s capacity needs over the forecastperiod, while its energy resources meet almost 70 percent <strong>of</strong> long-term needs.By far, the greatest risks to RPU’s future power supply costs are the CAISO’s market redesignefforts and environmental and regulatory risks that affect the Intermountain <strong>Power</strong> Project,especially GHG taxes or penalties.15 These resources include BPA1, BPA2, IPP, SONGS, PVNGS, Hoover, Wintec, Salton Sea Unit 5 geothermal,Renaissance geothermal, RERC and the Springs units.39
<strong>City</strong> <strong>of</strong> <strong>Riverside</strong> Public Utilities Department2008 <strong>Power</strong> Supply Integrated Resource PlanNatural Gas Price ForecastsBeginning in 2008, RPU began relying more heavily on natural gas-fired generation sources thanin the past. In 2007, RPU only generated 6 percent <strong>of</strong> its energy using natural gas-firedgeneration facilities. The addition <strong>of</strong> a natural gas-fired resource in 2008 increased thepercentage <strong>of</strong> gas-fired generation to 11.4 percent. Each new resource that is considered will beevaluated in relation to purchases from natural gas-fired resources. Even if RPU chooses not toacquire additional gas-fired generation in the future, the price <strong>of</strong> short-term energy and spotenergy purchases in California will be set by prevailing natural gas costs.It is important to analyze natural gas price forecasts for use in comparing resource options andcosts associated with the resource. Three different sources were used for natural gas forecasts –the federal government’s Energy Information <strong>Administration</strong> (“EIA”), Global Energy Decisions,Inc. (“GED”) and the California Public Utility Commission (“CPUC”). A summary <strong>of</strong> theirannual price forecasts is shown in Table 6.1.Table 6.1: Forecasts <strong>of</strong> Natural Gas Prices($/MMBTU)EIA GED CPUC2005 $ 7.62 - -2006 $ 6.24 - -2007 $ 6.00 - -2008 $ 6.99 $ 7.65 $ 9.102009 $ 6.81 $ 8.19 $ 8.972010 $ 6.56 $ 7.72 $ 8.662011 $ 6.45 $ 6.95 $ 8.362012 $ 6.55 $ 7.13 $ 8.152013 $ 6.79 $ 7.70 $ 8.072014 $ 6.87 $ 7.95 $ 7.992015 $ 6.94 $ 8.60 $ 7.912016 $ 7.17 $ 9.17 $ 7.822017 $ 7.41 $ 9.72 $ 8.132018 $ 7.69 $ 9.87 $ 8.232019 $ 8.05 $ 9.94 $ 8.472020 $ 8.24 $ 10.09 $ 8.78Source: EIA – Energy Information <strong>Administration</strong>, February 2008GED, “Fall 2007 Electricity and Fuel Price Outlook.”CPUC, “Energy Division Resolution E – 4118 October 4 2007.”All three <strong>of</strong> these forecasting groups anticipate that natural gas prices will decline over the nextfew years before increasing in real terms.40
<strong>City</strong> <strong>of</strong> <strong>Riverside</strong> Public Utilities Department2008 <strong>Power</strong> Supply Integrated Resource PlanGeneration from natural gas-fired resources accounts for more than 45 percent <strong>of</strong> all Californiaelectricity needs. 16 RPU currently utilizes only a small amount <strong>of</strong> gas-fired generation; i.e., theRERC and Springs units, which combined account for 138 MW <strong>of</strong> capacity, but are used only forsummer peaking requirements. These units typically generate 80 GWh annually, orapproximately 3 percent <strong>of</strong> RPU’s annual energy requirements.With the inclusion <strong>of</strong> a new natural gas-fired generator into RPU’s energy mix in 2008 (i.e., the<strong>City</strong> <strong>of</strong> Corona’s Clearwater Cogeneration Plant), natural gas-fired generation increased to 11.4percent <strong>of</strong> RPU’s annual retail energy requirements. If the Deseret purchase were replaced by agas-fired generator instead <strong>of</strong> the Renaissance geothermal project, RPU would be directlydependent upon natural gas for almost 30 percent <strong>of</strong> its annual energy needs in 2010.Effect <strong>of</strong> Rising Natural Gas Prices on RPU’s Resource MixThe forecasted rise in natural gas costs over the next decade impacts RPU’s willingness to enterinto renewable resource contracts that have either fixed prices or low escalation rates relative tonatural gas. A renewable resource that has a higher initial price will, at some point in time,become less expensive than gas-fired generation, depending upon the forecasted escalation ratefor natural gas. For example, RPU was attempting to decide between two long-term resourceadditions beginning in 2009, the first choice was a new power purchase agreement tied to naturalgas costs and having an assumed 11,000 BTU/kWh heat rate. 17 The second was a renewableenergy resource that escalated at 2 percent annually. Using GED’s forecasted natural gas costsshown in Table 6.1 above, the price for energy under the natural gas scenario, in comparison to arenewable resource initially priced higher would be:Table 6.2: Example <strong>of</strong> Prices <strong>of</strong> Renewable and Non-Renewable EnergyYearNatural Gas Price Energy Price Renewable Energy Price($/MMBTU) ($/MWh)($/MWh)2009 $ 8.19 $82.23 $90.562010 $ 7.72 $84.92 $92.372011 $ 6.95 $76.45 $94.222012 $ 7.13 $78.43 $96.102013 $ 7.70 $84.70 $98.032014 $ 7.95 $87.45 $99.992015 $ 8.60 $94.60 $101.992016 $ 9.17 $100.87 $104.022017 $ 9.72 $106.92 $106.112018 $ 9.87 $108.57 $108.232019 $ 9.94 $109.34 $110.3916 California Energy Commission, California Electricity Statistics & Data17 Heat rate is a measure <strong>of</strong> efficiency equating heat input, in terms <strong>of</strong> British Thermal Units, to electric energyoutput. A lower heat rate would suggest that less natural gas is necessary to produce one kilowatt-hour <strong>of</strong> energy(i.e., increased efficiency), while a higher heat rate indicates less efficiency.41
<strong>City</strong> <strong>of</strong> <strong>Riverside</strong> Public Utilities Department2008 <strong>Power</strong> Supply Integrated Resource PlanIn the first few years, the renewable energy resource would increase RPU’s total power supplycosts in comparison to a long-term purchase from a natural gas-fired resource. However thepower purchase from a natural gas resource would expose RPU’s customer to future pricevolatility and significant escalation risk as more natural gas generation replaces coal generationin utility resource portfolios. By 2017, the escalation <strong>of</strong> natural gas prices results in the naturalgas-fired resource rising to cost parity with the renewable resource. RPU’s customers are still leftexposed to future increases in natural gas price volatility and price escalation that can result inthe long term cost <strong>of</strong> the natural gas resource exceeding the cost <strong>of</strong> the renewable resource whichraises the total power supply costs.If RPU began layering a small amount <strong>of</strong> baseload renewable resources into its resource mixeach year, lower overall costs would likely result within a few years. Acquiring renewableresources without initially adversely impacting RPU’s retail rates will present a challenge to<strong>Power</strong> Resources staff. That is, it is not RPU’s intent to penalize existing customers by acquiringrenewable resources at above market prices in order to benefit future customers with belowmarket rates.Under the <strong>City</strong> <strong>of</strong> <strong>Riverside</strong>’s Renewables Portfolio Standard, RPU can acquire renewableresources so long as they do not increase retail rates by more than 5 percent. At current ratelevels, this translates into an annual investment <strong>of</strong> approximately $9,500,000 for the abovemarketcomponent <strong>of</strong> renewable energy resources.Another important point is that renewable energy sources are much less volatile than natural gasfiredresources over long time periods. Natural gas is the most volatile commodity traded incommodity markets. Natural gas supplies can be hedged for two or three years into the future butthey cannot be hedged (without physical ownership or significant credit risk) for longer periods.Renewable resources provide a hedge against natural gas volatility, protecting RPU from rapidlyescalating fossil fuel costs.Natural Gas ManagementWhen RPU’s current resource mix is examined, the most important determinate <strong>of</strong> future energycosts will be the price <strong>of</strong> natural gas. RPU continues to devote significant efforts towardmitigating the forecasted increase in natural gas costs.Managing natural gas costs includes investigating the feasibility <strong>of</strong> long-term, fixed price gascontracts and pre-payment options <strong>of</strong>fered through the Southern California Public <strong>Power</strong>Authority, as well as directly through “Muni-gas,” a firm that provides pre-paid gas supplies tomunicipal entities.RPU will also need to become heavily involved in the daily scheduling <strong>of</strong> spot market gassupplies and monthly balancing <strong>of</strong> those supplies against actual needs. Currently, RPU purchasesthese services from BP Energy, Inc., although the recent adoption by RPU’s governing bodies <strong>of</strong>the North American Energy Standards Board’s standard contract terms and conditions willsignificantly expand the number <strong>of</strong> potential gas-supplier counterparties.42
<strong>City</strong> <strong>of</strong> <strong>Riverside</strong> Public Utilities Department2008 <strong>Power</strong> Supply Integrated Resource PlanHistoric Relationship Between Gas and Electricity PricesOver the past few years, there has been a strong relationship between natural gas price levels andenergy prices. Summer on-peak energy prices have been priced at the conversion rate <strong>of</strong> naturalgas into electricity using a 12,000 BTU/kWh heat rate, while summer <strong>of</strong>f-peak prices have beentrading at a heat rate <strong>of</strong> around 8,500 – 9,000 BTU/kWh. Annual purchases have been trading atapproximately a 10,000 BTU/kWh average heat rate.For comparison, the two <strong>Riverside</strong> Energy Resource Center (RERC) units have estimated heatrates <strong>of</strong> 10,600 BTU/kWh and the four Springs units have an estimated heat rate <strong>of</strong> 14,400BTU/kWh.Resource Planning ScenariosThe resource planning process was initially performed based on four scenarios. These include:1) Do nothing;2) Add a 28 MW cogeneration facility in 2008 and 32 MW renewable resources in 2010 and2011;3) Meet all requirements after 2010 with natural gas-fired combined cycle facilities;4) Meet all requirements after 2010 with renewable resources;The first scenario is intended to identify RPU’s future resource requirements, including monthlyVAR. This scenario can also be used to evaluate the potential costs <strong>of</strong> using financial instrumentsin a MRTU marketplace to hedge energy costs rather than using physical generation sources tomeet future needs.The second scenario relies primarily on green resources to meet <strong>Riverside</strong>’s future electricityneeds with a combined cycle generator satisfying a portion <strong>of</strong> those needs. The primary reasonfor this resource recommendation is that it will be difficult to satisfy future capacity and energyneeds solely with renewable resources having the necessary operating characteristics.The third scenario, meeting future requirements with combined cycle facilities, essentially looksat high efficiency, central generation gas-fired facilities to meet future needs.The final scenario, meeting almost all future resource needs with renewable resources, attemptsto determine the cost to RPU <strong>of</strong> becoming essentially a “green” utility by entering into 10 to 15MW <strong>of</strong> baseload renewable resource contracts in alternating years beginning in 2015.Risks Associated With Resource AcquisitionsChoosing how to acquire resources in the future implies a willingness to accept risk. Choosingthe wrong resource could significantly increase long-term power supply costs. At the same time,relying on the short-term or spot markets for any future energy requirements could also increasecosts.43
<strong>City</strong> <strong>of</strong> <strong>Riverside</strong> Public Utilities Department2008 <strong>Power</strong> Supply Integrated Resource PlanThe primary risks that RPU faces when making a resource decision include:Market Price Risk: The financial penalty for acquiring resources at above market prices.This occurs when energy prices are fixed and then decline, or prices are not fixed and then rise.There is no easy way to guard against price risk other than to use financial instruments. Forexample, in a period <strong>of</strong> rapidly rising prices RPU can purchase energy at a fixed price (protectingitself against future price increases) and then purchase a Put Option. 18 If energy prices increase,the value <strong>of</strong> the Put Option is lost, although RPU would not pay additional energy costs. Ifenergy prices fall, however, the Put Option increases in value, reducing energy costs as themarket price declines.Regulatory Risk: Regulatory risk refers to the financial penalty that could be incurred whenregulatory bodies change or amend regulations in a manner that adds costs to the use <strong>of</strong> existingresource assets. RPU faces significant regulatory risk due to its long-term ownership interest inthe Intermountain <strong>Power</strong> Project. When RPU committed to a long-term entitlement in theIntermountain <strong>Power</strong> Project, the threat <strong>of</strong> carbon taxes and GHG emission penalties wasunknown. Over time, changing regulatory requirements have added costs to the facility with thepossibility <strong>of</strong> additional costs in the future to meet GHG emission limits.It is difficult to mitigate the possibility <strong>of</strong> regulatory risk. <strong>Power</strong> purchase agreements can bewritten to allow regulatory “outs” if the counter-party agrees (or is willing to accept all theregulatory risk themselves) but this comes with additional costs. 19The most effective way to attempt to mitigate regulatory risk is to participate in variouslegislative and regulatory forums to identify and influence potential initiatives and incorporatethem into the planning process.Non-performance Risk: Non-performance risk refers to the risk that high replacement costs, aswell as deficiency penalties may be incurred by RPU if a resource provider fails to provide thecontracted commodity. Even if the purchase agreement specifies the supplier’s payment <strong>of</strong>liquidated damages for non-performance, it is likely that RPU would still recognize somemonetary loss.Non-performance risks have increased recently as RPU works with smaller renewable energyresource developers. Protecting against non-performance risk from these entities is difficultbecause these suppliers typically form limited-liability corporations with no significant assets,other than the power sales agreement with RPU.18 The seller <strong>of</strong> a Put Option collects an up-front cash premium in exchange for agreeing to accept a specifiedamount <strong>of</strong> energy from the Put Option purchaser at a pre-determined price. Put Option purchasers typicallyanticipate declining prices in the relevant power markets, thus allowing the option purchaser to “lock-in” a minimumprice at which its energy may be sold. Put Option sellers rely on increasing prices that ideally will prevent thepurchaser’s exercise <strong>of</strong> the Put Option.19 An example includes RPU’s Deseret power purchase agreement, executed in 1992, which included an option for<strong>Riverside</strong> to unilaterally terminate the agreement in the event that emissions reductions were required.44
<strong>City</strong> <strong>of</strong> <strong>Riverside</strong> Public Utilities Department2008 <strong>Power</strong> Supply Integrated Resource PlanEven larger renewable energy developers are willing to declare bankruptcy and abrogate theircontractual obligations if the cost <strong>of</strong> complying becomes too high.One <strong>of</strong> the most effective ways to protect against non-performance is for RPU to develop smallerrenewable projects on its own. This option may not be feasible for larger projects but for smallprojects is a viable alternative.Summary <strong>of</strong> RiskBesides price risk, regulatory risk and non-performance risk, RPU faces considerable uncertaintyin the marketplace and cannot protect itself against all forms <strong>of</strong> financial risk. RPU’s strategy isto recognize that risk exists and attempt to minimize it through appropriate hedging activities thatdiversify risks and active participation in legislative and regulatory arenas.With the implementation <strong>of</strong> the CAISO’s MRTU market in California, the nature <strong>of</strong> risk maychange depending upon how the market develops. It is possible that financial instruments willbecome much more important in the market as opposed to physical resources that act as a hedge.In the MRTU market, identifying and purchasing price caps for energy will likely become moreimportant than in the current bi-lateral physical market.Scenario 1: Do NothingThe first scenario assumes that RPU’s resource mix is set between 2008 and 2020, and that asexisting power purchase agreements terminate (such as the Deseret contract in 2009 and the BPA1 Agreement on December 31, 2010), RPU purchases all <strong>of</strong> its remaining energy requirementsfrom the MRTU spot market.Only the third and fourth RERC units were added into the generation base case because theyhave already been approved by the <strong>City</strong> Council and permitting has commenced. Also, the SaltonSea Unit 5 geothermal project begins providing an additional 26 MW <strong>of</strong> capacity and energystarting in June 2009 under an existing contract.The primary reason for this scenario was to specifically identify RPU’s future resource needs ona monthly basis for the next 13 years.The analysis shows that RPU requires increasing amounts <strong>of</strong> capacity over the next 13 years asillustrated in Figure 6.1 for the period 2008 – 2015.45
<strong>City</strong> <strong>of</strong> <strong>Riverside</strong> Public Utilities Department2008 <strong>Power</strong> Supply Integrated Resource PlanFigure 6.1Summer Capacity Deficit (MW)Including 15 percent reserve obligations2502001501005002008 2009 2010 2011 2012 2013 2014 2015The capacity deficit is partially due to the CAISO’s 15 percent reserve requirement. AlthoughRPU is capacity short during the summer months by approximately 100 MW, reserverequirements increase capacity requirements by an additional 90 to 105 MW.In one sense, annual summer capacity deficits may be misleading. RPU has sufficient capacity tomeet forecasted loads for the months <strong>of</strong> October through March <strong>of</strong> 2012 and is deficit capacity inMay and June by only minimal amounts. RPU is actually only deficient in capacity when airconditioning loads increase the heavy load hour system peak demand.Currently, the capacity deficit is met through short-term purchases <strong>of</strong> Resource Adequacycapacity. Resource Adequacy capacity is a capacity purchase made from a qualified generationresource that guarantees the delivery <strong>of</strong> energy to the CAISO markets if called upon by theCAISO.Capacity purchases during the summer on-peak period can be partially <strong>of</strong>fset by DSM programs,although these programs are unlikely to significantly reduce summer capacity requirements (5 to7 MW) during this planning period.While capacity is obviously important, RPU suffers from a much larger shortage <strong>of</strong> energy.RPU’s energy shortages, as measured by its VAR (value at risk) show that within the next twoyears 20 percent <strong>of</strong> RPU’s forecasted energy requirements need to be purchased or constructed.46
<strong>City</strong> <strong>of</strong> <strong>Riverside</strong> Public Utilities Department2008 <strong>Power</strong> Supply Integrated Resource PlanTable 6.2: RPU's Future Unmet Energy Requirementsas a Percentage <strong>of</strong> Annual Needs16%14%12%10%8%6%4%2%0%2008 2009 2010 2011 2012 2013 2014 2015Even when RPU adds RERC 3 and RERC 4 with a total capacity <strong>of</strong> 98 MW, there limited energyassociated with these units due to operating restrictions imposed by the South Coast Air QualityManagement District.Financial ModelThe financial results <strong>of</strong> the “Do Nothing” scenario show that RPU’s power supply costs wouldrise by 18.6 percent over the next five years, as shown in the following table:Table 6.3: Results <strong>of</strong> “Do Nothing” ScenarioSummary$0002009 2010 2011 2012 2013Gross Cost $173,502 $185,999 $197,385 $193,664 $197,746Net Cost $151,835 $164,727 $176,790 $173,027 $177,125Spot EnergyBuy Percent11.3% 14.3% 21.3% 18.5% 19.3%Spot EnergySell Percent3.2% 2.2% 0.7% 1.0% 0.9%AverageCost/MWh$61.14 $65.19 $69.30 $67.41 $68.0147
<strong>City</strong> <strong>of</strong> <strong>Riverside</strong> Public Utilities Department2008 <strong>Power</strong> Supply Integrated Resource PlanTotal power supply costs show a slight dip in 2012 due to the forecasted decline in natural gascosts and reduced <strong>of</strong>f-peak requirements with the expiration <strong>of</strong> the BPA 1 Agreement.The increase in power supply costs is attributable to the expiration <strong>of</strong> the CDWR summerpeaking energy contract in FY 2007/2008 and the Deseret contract in FY 2009/2010. Both <strong>of</strong>these contracts provided lower cost energy to RPU and their expiration results in RPU having tomake significant purchases from the short-term markets to meet load requirements.A risk to RPU <strong>of</strong> this scenario is that as much as 20 percent <strong>of</strong> future energy purchases areunhedged or subject to both market price and supply risks. A rapid increase in energy costs dueto supply disruptions or other problems could result in significant increases in overall powersupply costs.By not acquiring future capacity and energy to meet anticipated load requirements, RPU wouldbe accepting significant market price and delivery risks. RPU would essentially be gambling thatfuture spot prices will remain low relative to the cost <strong>of</strong> new generation facilities.However, in a world with significant regulatory/legislative risk, chronic capacity shortages andvolatile primary fuel prices, relying on spot market prices to remain below long-term marketprices for any significant period is not the recommended alternative.Scenario 2: Cogeneration And Renewable Resource AlternativeThe next scenario examined replacement <strong>of</strong> the CDWR contracts with an in-basin, gas-firedcogeneration facility, the Clearwater <strong>Power</strong> Plant, and then a baseload renewable resourcereplacement for the expiring Deseret contract in 2010. The Renaissance Geothermal Project innorthern Utah was chosen as the most desirable resource addition based upon its renewableaspect, costs, on-line date and transmission availability. The first 32 MW generating unit fromthis project is expected on-line in early 2010, with the second 32 MW unit expected in operationlater in 2010 or early 2011. <strong>Riverside</strong>’s agreement for the purchase <strong>of</strong> power from this projectextends for thirty years.Clearwater <strong>Power</strong> PlantWith the expiration <strong>of</strong> the coal-based Deseret power purchase agreement in 2009, RPU ischallenged with replacing an economic baseload resource that provided almost 20 percent 20 <strong>of</strong>RPU’s annual energy requirements and 52 MW <strong>of</strong> capacity. In addition, RPU must meet localcapacity requirements as part <strong>of</strong> the CAISO’s Resource Adequacy program.RPU began looking for a local, high efficiency power plant and began discussions with the <strong>City</strong><strong>of</strong> Corona for a long-term power purchase agreement or (preferably) ownership <strong>of</strong> theClearwater <strong>Power</strong> Plant.20 Deseret provides approximately 455 GWh <strong>of</strong> energy annually to RPU.48
<strong>City</strong> <strong>of</strong> <strong>Riverside</strong> Public Utilities Department2008 <strong>Power</strong> Supply Integrated Resource PlanThe Clearwater <strong>Power</strong> Plant is a 22 MW gas-fired turbine with an associated 6 MW steamturbine and generator. The hot exhaust from the gas turbine is recycled by a heat recovery steamgenerator (“HRSG”) to generate steam which in turn drives the steam turbine/generator. Thiscombination produces electricity overall more efficiently than either the gas turbine or steamturbine alone.The Clearwater <strong>Power</strong> Plant gas turbine exhaust also provides heat for a system used to drywastewater sludge from the <strong>City</strong> <strong>of</strong> Corona’s wastewater treatment facility, reducing the <strong>City</strong> <strong>of</strong>Corona’s cost <strong>of</strong> transporting the solid waste. Preliminary discussions with Corona indicate thatit is willing to purchase this heat from RPU at prevailing market prices if <strong>Riverside</strong> purchases theasset itself, partially <strong>of</strong>fsetting RPU’s cost <strong>of</strong> Clearwater Plant operations.The Clearwater <strong>Power</strong> Plant has a nominal minimum operating level <strong>of</strong> 14 MW and a nominalmaximum operating level <strong>of</strong> approximately 28 MW, and can operate within this range with littleefficiency loss.In combined-cycle mode, the Clearwater <strong>Power</strong> Plant has an estimated heat rate <strong>of</strong>approximately 8,520 BTU/kWh. In contrast, RPU’s existing RERC and Springs simple-cyclegenerators have heat rates <strong>of</strong> 10,600 and 14,400 BTU/kWh, respectively. Based upon theefficiency <strong>of</strong> its operation, the Clearwater Plant is expected to economically generate during allon-peak hours <strong>of</strong> the year and most hours during the summer months, the RERC units areexpected to be utilized during summer on-peak periods and the Springs units during super onpeakand emergency periods.Renaissance Geothermal ProjectThe Renaissance Geothermal Project (“Renaissance”) is planned to be located in northern Utahon Shoshone tribal land and is being developed jointly between the Northwestern Band <strong>of</strong> theShoshone Nation and IdaTherm, Inc., a company created to develop the local geothermal fields.As previously described, the first 32 MW Renaissance unit is scheduled to go on-line in 2010,just as RPU’s Deseret power supply agreement terminates. The power from Renaissance woulduse the same transmission path as the Deseret purchase, easing the transition between the twopurchases.RPU indicated an interest in initially purchasing up to 50 MW <strong>of</strong> hourly capacity and energyfrom the project. However, given the price <strong>of</strong> energy from the unit and the project developers’unwillingness to sell “partial units,” RPU agreed to purchase the project’s full 64 MW <strong>of</strong>capability. The term <strong>of</strong> RPU’s purchase extends thirty years, coinciding with the anticipated life<strong>of</strong> the project.49
<strong>City</strong> <strong>of</strong> <strong>Riverside</strong> Public Utilities Department2008 <strong>Power</strong> Supply Integrated Resource PlanModeling ProcessTwo new generation facilities were added to RPU’s resource mix, Clearwater <strong>Power</strong> Plant inApril 2008 and a 32 MW Renaissance unit in January 2010 21 . Clearwater <strong>Power</strong> Plant providedan additional 28 MW <strong>of</strong> local and system capacity reducing RPU’s spot energy purchases andannual Resource Adequacy capacity purchases, while Renaissance provided Resource Adequacycapacity, but did not provide any additional LCR. 22Table 6.4: Results <strong>of</strong> Clearwater <strong>Power</strong> Plant and Renaissance SimulationSummary$0002009 2010 2011 2012 2013Gross Cost $180,425 $199,781 $210,842 $211,036 $215,537Net Cost $144,606 $157,315 $172,371 $169,707 $175,786Spot EnergyBuy Percent5.3% 3.7% 3.5% 2.7% 3.4%Spot EnergySell Percent7.1% 9.9% 8.5% 10.3% 9.7%AverageCost/MWh$58.42 $62.45 $67.74 $66.12 $67.43Adding these two resources will reduce RPU’s future power supply costs while simultaneouslyproviding a degree <strong>of</strong> future price stability. As previously discussed, limiting RPU’s exposure tothe volatile natural gas market is highly recommended. The addition <strong>of</strong> the Clearwater <strong>Power</strong>Plant to RPU’s resource portfolio is not inconsistent with this approach.The rate for energy related to Renaissance is initially set at $77/MWh, with an annual escalationrate tied to the implicit price deflator. This is below the forecasted price <strong>of</strong> energy (renewableand non-renewable) in the California marketplace.The Clearwater <strong>Power</strong> Plant has an 8,520 BTU/kWh heat rate, significantly below the heat ratetypically assumed by spot market sellers to establish energy prices for on-peak spot marketpurchases, while approximately equal to the <strong>of</strong>f-peak heat rate. The high efficiency <strong>of</strong> the unitmeans that energy costs will be approximately $34/MWh less expensive than on-peak purchaseswhen gas is priced at $9.00/MMBTU, reducing annual energy costs by $4.5 million in21 A delay from January 2010 to April 2010 for the in-service date <strong>of</strong> this resource, if such a delay should occur,would have no significant impact on the model results.22 To be considered a Local Capacity resource for RPU, the resource must be located in the same CAISO-definedregion as the load it serves. In RPU’s case, the Los Angeles Basin <strong>Area</strong>.50
<strong>City</strong> <strong>of</strong> <strong>Riverside</strong> Public Utilities Department2008 <strong>Power</strong> Supply Integrated Resource Plancomparison to spot market purchases. The savings is reduced by the estimated capital andoperating and maintenance (O&M) costs <strong>of</strong> $4.2 million per year. As gas prices increase anddrive heavy load hour electricity prices higher, the benefits <strong>of</strong> the Clearwater <strong>Power</strong> Plantincrease.The Clearwater <strong>Power</strong> Plant actually shows better financial results as natural gas costs rise andthe energy cost savings increase. With low natural gas costs, the energy savings alone cannot<strong>of</strong>fset the capital and O&M costs associated with the unit. Off-setting the CAISO’s LCR whilereducing the transmission congestion risks <strong>of</strong> power imported from outside the CAISO system,however, is expected to materially outweigh the risk <strong>of</strong> lower than forecasted natural gas pricesand adds significantly to the value <strong>of</strong> the Clearwater <strong>Power</strong> Plant.Including these two resources in RPU’s resource mix reduces total power supply costs byapproximately $2.0 million in 2009, increasing the savings to $7.0 million by 2013 incomparison to the “Do Nothing” scenario. In addition, RPU’s VAR exposure declinessignificantly as spot market electricity purchases decline to less than 5 percent annually,compared to approximately 20 percent in the “Do Nothing” scenario.Another factor not expressly considered in the annual cost <strong>of</strong> power is the immediate reductionin greenhouse gas emissions due to the power purchase from Renaissance.AB32 and SB1368 require the State’s utilities and industries to reduce their emissions <strong>of</strong>greenhouse gases under threat <strong>of</strong> significant administrative costs and potential fines. Renewableresources in California generally have an environmental premium attached to their price and costbetween $22 and $35 more per MWh than non-renewable resources.In the first, “Do Nothing” scenario, renewable energy as a percentage <strong>of</strong> total purchases isapproximately 16 percent after 2009, primarily due to the Salton Sea Unit 5 geothermal projectincrease 23 .In the second case, the addition <strong>of</strong> the Renaissance Project increases RPU’s renewablegeneration to approximately 33 percent <strong>of</strong> its projected customer requirements in 2011.This increase in renewable energy adds approximately $4.0 million to RPU’s annual energy costsin 2010 while reducing RPU’s emissions <strong>of</strong> greenhouse gases by 12.5 percent in comparison tonatural gas-fired generation.Finally, RPU’s VAR is significantly reduced in the second scenario with less than 4 percent <strong>of</strong>future forecasted energy requirements unhedged after 2010.23 The Salton Sea Unit 5 geothermal project is expected to generate approximately 193 GWh in FY 2008/09,increasing to 400 GWh thereafter.51
<strong>City</strong> <strong>of</strong> <strong>Riverside</strong> Public Utilities Department2008 <strong>Power</strong> Supply Integrated Resource PlanScenario 3: Meet All Future Needs with Natural Gas-Fired ResourcesThe third scenario studied the possibility <strong>of</strong> meeting future energy requirements with highefficiency natural gas-fired generation facilities located within the Los Angeles Basin.Combined-cycle units would be acquired once the Clearwater <strong>Power</strong> Plant and Renaissanceresources came online to meet future energy needs.<strong>Power</strong> marketers, such as Reliant and AES, have proposed a number <strong>of</strong> new or re-powered largecombined-cycle facilities between 2012 and 2015. These proposed units would meet the currentSB1368 Emissions Performance Standard and would be located within the Los Angeles Basinarea. Any capacity or energy purchased from these proposed facilities would be accomplishedthrough power purchase agreements.The proposed units would be very efficient, with heat rates <strong>of</strong> approximately 8,000 BTU/kWh(or better). Capacity prices range from $6 to $10 per kW-month, reflecting the capital-intensivenature <strong>of</strong> the units with estimated construction costs ranging from $2,000 to $2,500 per kW <strong>of</strong>installed capacity.Using the CPUC’s forecast <strong>of</strong> natural gas prices, energy from the proposed units would costbetween $70 and $75 in 2012, well below the forecasted “spot” market price.The simulation <strong>of</strong> power supply costs after adding one 15 MW combined-cycle unit in 2012 anda second in 2015 are shown in Table 6.5 below:Table 6.5: Results <strong>of</strong> Additional Natural Gas Generation AdditionsSummary$0002009 2010 2011 2012 2013Gross Cost $180,425 $199,781 $210,842 $215,980 $224,777Net Cost $144,606 $157,315 $172,371 $169,024 $175,275Spot EnergyBuy percent5.3% 3.7% 3.5% 2.0% 2.2%Spot EnergySell percent7.1% 9.9% 8.5% 13.2% 15.6%Average Cost $58.4 $62.5 $67.7 $65.9 $67.3In comparison to the Clearwater/Renaissance scenario, power supply costs are reduced byapproximately $500,000 to $700,000 annually. This savings is primarily due to the highefficiency <strong>of</strong> the gas-fired combined cycle generators in comparison to spot market purchases,but does not include savings expected to result from RPU’s avoidance <strong>of</strong> CAISO Local Capacityand other Resource Adequacy requirements. Absent these new resources, RPU would likely berequired to pay a monthly demand charge, estimated at $10/kW-month or $1,800,000 annually,for capacity from the proposed combined-cycle units.52
<strong>City</strong> <strong>of</strong> <strong>Riverside</strong> Public Utilities Department2008 <strong>Power</strong> Supply Integrated Resource PlanIt may be possible for RPU to enter into a gas hedging agreement with the unit’s owners to fixgas prices. This would provide additional price certainty for RPU, at least on a year-to-yearbasis.Scenario 4: Renewable AlternativeThe final alternative studied was acquiring the Clearwater <strong>Power</strong> Plant and Renaissance inaddition to the third and fourth RERC units, and then purchasing 10-15 MW <strong>of</strong> baseloadrenewable resources by 2015. Thereafter, 10-15 MW <strong>of</strong> baseload renewable energy would bepurchased roughly every other year. This alternative has the price certainty benefit <strong>of</strong> long-termcontracts with relatively low escalation rates. RPU would meet over 50 percent <strong>of</strong> its retail loadrequirements with renewable resources, primarily geothermal, with only the Clearwater <strong>Power</strong>Plant and RPU’s internal generation resources powered by natural gas. The difficulty withbecoming a predominantly renewable utility is overcoming the generally high initial cost <strong>of</strong>renewable resources relative to less expensive gas-fired generation.Renewable resources are currently priced at a premium compared to traditional resources. This ispartly due to the State <strong>of</strong> California’s legislated desire to reduce greenhouse gas emissions byrequiring CPUC regulated utilities to have at least 20 percent <strong>of</strong> their resource needs met byrenewable resources by 2010, with the possibility <strong>of</strong> this percentage increasing to at least 33percent by 2020.Renewable resources would also be exempt from some <strong>of</strong> the potential effects <strong>of</strong> carbon taxes orother emission penalties should the State legislature decide to impose them in the future.RPU began investing in renewable power resources during the 2000-2001 energy crisis with theinstallation <strong>of</strong> a 150 kW photovoltaic generation carport structure at the Utility OperationsCenter. In 2002, California adopted legislation directed to support the procurement <strong>of</strong> “Eligible”renewable power resources, thereby reducing the states reliance on conventional sources <strong>of</strong>power considered harmful to the environment. Responding to the State’s mandate, the PublicUtilities Board and the <strong>City</strong> Council adopted a Renewables Portfolio Standard (“RPS”) andrenewable energy procurement goals to further define <strong>Riverside</strong>’s role and commitment toenvironmental stewardship through the procurement <strong>of</strong> renewable power resources. Goalsadopted included 25 MW <strong>of</strong> renewable resources from long term contracts and 1 MW from localgeneration.Renewables Portfolio Standard (RPS)Senate Bill 1078 (2002) required that each governing body <strong>of</strong> a local publicly owned electricutility implement and enforce a RPS that recognizes the intent <strong>of</strong> the legislature to encouragerenewable resources, while taking into consideration the effect <strong>of</strong> the standard on rates,reliability, and financial resources and the goal <strong>of</strong> environmental improvement. The expressedgoal <strong>of</strong> SB1078 was for CPUC-jurisdictional entities to reach a 20 percent reliance on renewablepower resources by year 2020. These entities were further required to increase renewable energyprocurement at a minimum <strong>of</strong> 1 percent each year in order to reach the goal by 2020.53
<strong>City</strong> <strong>of</strong> <strong>Riverside</strong> Public Utilities Department2008 <strong>Power</strong> Supply Integrated Resource PlanThe Board <strong>of</strong> Public Utilities and <strong>City</strong> Council initially approved a Renewables PortfolioStandard in 2003 with stated goals and targets. The expressed goal required that RPU increase itssupply <strong>of</strong> electricity from “eligible” renewable resources. “Eligible” renewable resources forpurposes <strong>of</strong> this RPS include: biomass, solar thermal, photovoltaic, wind, geothermal, fuel cellsusing renewable fuels, hydroelectric generation, digester gas, municipal solid waste, landfill gas,ocean wave, ocean thermal, and tidal current. The initial RPS further specified that at least 15percent <strong>of</strong> <strong>Riverside</strong>’s retail energy requirements be met by renewable resources no later than2010, with that requirement increasing to 20 percent by the year 2017. In 2007, RPU’s Board <strong>of</strong>Public Utilities adopted more aggressive renewable energy procurement targets by establishing20, 25 and 33 percent thresholds by the years 2010, 2015 and 2020, respectively.Emissions RegulationsIn 2006, Governor Schwarzenegger signed into law AB32: The California Global WarmingSolutions Act, and SB1368: The Greenhouse Gas Emissions Performance Standard. AB32requires that California’s statewide greenhouse gas emissions be reduced to 1990 levels by 2020.SB1368 restricts greenhouse gas emissions for new baseload generation and states that carbondioxide emissions not exceed 1,100/lbs per MWh, an amount equal to the emissions <strong>of</strong> a state-<strong>of</strong>the-artcombined-cycle generating facility, for a long-term (greater than five years) baseloadgeneration resource.Significant financial commitments related to non-compliant resources are prohibited underSB1368. Thus, these resources cannot be considered by RPU in evaluating future procurementoptions. As a result, future resource options are limited to technologies such as renewables, highefficiency natural gas, hydroelectric and nuclear power generation. While natural gas resourcesmay comply with the SB1368 limitations, potential carbon impacts and regulations from AB32legislation currently under development could affect the price <strong>of</strong> the resource by the adoption <strong>of</strong>a carbon adder fee. Therefore, any evaluation <strong>of</strong> a natural gas resource should include anestimate <strong>of</strong> the potential financial impact on the utility’s carbon footprint.AB32 directs the California Air Resources Board (“CARB”) to quantify California’s 1990emission levels and establish reduction targets and methods required to reduce California’sgreenhouse gas emissions to that level (estimated to be 25 percent, or 174 million tons <strong>of</strong> CO 2 )by 2020. CARB is tasked with developing the point <strong>of</strong> regulation and market mechanismsrequired to reach this target.A Proposed Interim Decision, released in March 2008 by the California Public UtilitiesCommission (“CPUC”) and the California Energy Commission (“CEC”), recommends a number<strong>of</strong> policies and requirements that CARB adopt in its scoping plan for electricity sectorgreenhouse gas reductions. These recommendations include:1. Mandatory reductions through programmatic measures: All retail providers should berequired to meet the same energy efficiency requirements, Renewables Portfolio Standardand Emissions Performance Standard.54
<strong>City</strong> <strong>of</strong> <strong>Riverside</strong> Public Utilities Department2008 <strong>Power</strong> Supply Integrated Resource Plan2. Establishment <strong>of</strong> a cap-and-trade program to reduce costs by permitting the trading <strong>of</strong>carbon allowances.3. Designating the Point <strong>of</strong> Regulation in a cap-and-trade program as the first “deliverer” <strong>of</strong>electricity imported into California or the first entity that generates power in California(in-state generators). The energy deliverer will carry the emissions complianceobligation, buying carbon allowances through auction and reporting compliance efforts tothe CARB.4. Establishment <strong>of</strong> an allowances auction (partial or full) with proceeds allocated togreenhouse gas reduction measures or electricity rate mitigation.Mandatory greenhouse gas caps will begin in 2012 for significant sources and decrease in alinear fashion to meet the 2020 goal.The addition <strong>of</strong> emission regulations accelerates and supports RPU’s need to procure cleanrenewable resources.Future Resource OptionsIn 2005, RPU’s CO 2 footprint from owned generation resources was 1,023,225 metric tons andwas forecasted to increase to 1,062,810 tons in 2006 24 . The possibility <strong>of</strong> an emissions allowanceauction could result in an increase in wholesale power costs <strong>of</strong> $8 -$25 per ton, or $4 - $13 perMWh for a fossil fuel resource as suggested by CPUC Commissioner Peevey. For purposes <strong>of</strong>financial analysis <strong>of</strong> resource options, a $10 per MWh carbon fee will be added to the evaluation<strong>of</strong> all fossil fuel-based resource options.Renewable resources have long been considered desirable for their environmental benefits, butalso a more expensive resource that is difficult to justify to the ratepayer. Attempts to complywith the spirit <strong>of</strong> the RPS legislation, SB1078, have centered on incorporating small amounts <strong>of</strong>renewable resources into RPU’s overall portfolio mix, thus minimizing the incremental financialimpacts to the ratepayers. RPU’s overall resource mix remains largely based on fossil fuelresources, although RPU has already procured a significant amount <strong>of</strong> long-term renewableenergy and is continuing to pursue all renewable resource options that are consistent with thegoals established by its governing bodies.The following graph illustrates the price <strong>of</strong> natural gas required to remain more economical thana $100/MWh renewable resource. Natural gas prices for 2008 have exceeded $9/MMBTU, whilevarious forecasts predict that natural gas prices will dip below $8/MMBtu for several yearsbefore climbing above $9/MMBtu. The comparison reflects a $1 to $2/MMBtu increase fromcurrent gas prices depending on the efficiency <strong>of</strong> the gas-fired resource. AB32 imposedregulations could increase wholesale natural gas prices with the addition <strong>of</strong> a carbon adder fee.The graph also includes an assumed $10/MWh carbon fee beginning in 2012. The addition <strong>of</strong> the24 These values have been audited by the California Climate Action Registry as part <strong>of</strong> RPU’s membership in thatorganization.55
<strong>City</strong> <strong>of</strong> <strong>Riverside</strong> Public Utilities Department2008 <strong>Power</strong> Supply Integrated Resource Plancarbon fee more realistically brings the renewable “clean” resource into price competition withthe natural gas resource, and thus a viable resource option for significant long-term energysupply.$20Figure 6.3: Natural Gas Price ForecastMaximum Price to Generate BelowRenewable Energy Alternatives$18$16$14$12$ MMbtu$10$8$6$4$28,000 Btu/kwh, $10 Carbon Adder10,000 Btu/kwh, $10 Carbon Adder10,000 Btu/kwh, No AdderCPUC Gas Forecast$-2008 2009 2010 2011 2012 2013 2014 2015 2016 2017 2018 2019 2020 2021 2022 2023 2024 2025 2026Note: Assumes $10 Carbon Adder in 2012Renewable Resource $100 w/2.5 esc.Results <strong>of</strong> SimulationA power supply cost simulation was performed using RPU’s existing resources, plus theClearwater <strong>Power</strong> Plant and Renaissance facilities. Then, additional purchases <strong>of</strong> baseloadrenewable resources in 10 MW blocks were added in alternative years beginning in 2013.The simulation shows that adding renewable resources on a staggered basis has a small impacton total resource costs in comparison to natural gas-fired facilities.56
<strong>City</strong> <strong>of</strong> <strong>Riverside</strong> Public Utilities Department2008 <strong>Power</strong> Supply Integrated Resource PlanTable 6.6: Total <strong>Power</strong> Supply Costs with Renewable Energy ResourcesSummary$0002009 2010 2011 2012 2013Gross Cost $180,425 $199,781 $210,841 $211,035 $224,433Net Cost $144,605 $157,315 $172,370 $169,707 $179,978Spot EnergyBuy percent4.7% 3.2% 3.4% 2.4% 2.5%Spot EnergySell percent7.0% 9.8% 8.5% 10.2% 12.0%Average Cost $58.42 $62.45 $67.75 $66.12 $69.0Under the renewable scenario, total power supply costs rise by $4.7 million in comparison to thenatural gas alternative. However, the renewable energy prices now begin escalating at a slowerrate and with less volatility so that by 2017, the natural gas scenario actually leads to higher totalcosts.High Natural Gas PricesThe analyses <strong>of</strong> future generation costs are based upon natural gas price forecasts provided bythe CPUC. No entity has a proven record <strong>of</strong> correctly forecasting long-term energy prices,primarily due to non-economic factors that affect oil and natural gas costs. That is, it is difficultto forecast the political and socio-economic factors that impact world energy prices.The forecasts <strong>of</strong> natural gas prices presented above were prepared under the assumption thatthere would be no significant political disruptions that impacted world energy markets.Nevertheless, world oil markets are being impacted by a variety <strong>of</strong> minor events – politicalunrest in Nigeria, increasing tensions between Venezuela, Columbia and Ecuador, and Turkishmilitary incursions against Kurds in western Iraq that threaten major oil pipelines.While none <strong>of</strong> the above circumstances by themselves would significantly impact world markets,the combination <strong>of</strong> these political activities, plus continued uncertainty in the US economy, isdriving natural gas prices upward. When compared to the natural gas forecasts prepared by theCPUC, GED and EIA, energy prices are currently well above the GED and EIA forecasts andslightly greater than the CPUC forecast for 2008. However, the CPUC forecast shows thatenergy prices will decline in the future. If instead natural gas prices rise, then a utility plan that isbased upon low natural gas prices is at risk.The evaluations <strong>of</strong> alterative resource acquisitions used the CPUC natural gas price forecast.Using this forecast, the least cost alternative for RPU is to acquire 25 MW <strong>of</strong> additional naturalgas-fired generation in 2012 and 2015. If, however, natural gas prices do not decline in thefuture, the least cost generation expansion plan would no longer include natural gas generation.An analysis <strong>of</strong> power costs was performed where natural gas prices were allowed to increase at a4 percent annual rate beginning with 2007 average costs.57
<strong>City</strong> <strong>of</strong> <strong>Riverside</strong> Public Utilities Department2008 <strong>Power</strong> Supply Integrated Resource PlanIn this scenario, the increasing cost <strong>of</strong> natural gas, occurring just as RPU begins investing innatural gas resources, causes total power supply costs to rise by $5 million in FY 2008/09 and asmuch as $16 million by 2013.By choosing to invest in natural gas resources to meet future needs, RPU would be accepting thelikelihood that natural gas prices will rise and force retail rates upwards in the future.Table 6.7: Effects <strong>of</strong> Rapidly Escalating Natural Gas PricesSummary$0002009 2010 2011 2012 2013Gross Cost $180,425 $199,781 $210,842 $218,237 $230,501Net Cost $144,606 $166,959 $179,735 $181,760 $191,520Spot EnergyBuy percent5.3% 3.7% 3.5% 2.0% 2.2%Spot EnergySell percent7.1% 9.9% 8.5% 13.2% 15.6%Average Cost $58.4 $64.0 $69.3 $69.3 $71.6Effects <strong>of</strong> Emission TaxAs discussed above, California regulators are discussing the imposition <strong>of</strong> an emission tax <strong>of</strong> $8per ton <strong>of</strong> CO 2 beginning in 2012 and increasing to $20-$25 per ton by 2025. With RPU’scurrent resource mix, this proposal would add as much as $30,000,000 annually to power supplycosts.This estimate is based upon RPU’s 2012 coal-fired resources (the Intermountain <strong>Power</strong> Project,with approximately 1,140 GWh <strong>of</strong> annual generation) and natural gas-fired resources(Clearwater <strong>Power</strong> Plant , RERC and Springs) at an average “tax” <strong>of</strong> $4 per MWh.Since it is not known exactly how the CARB will apply the tax, only wide estimates are currentlypossible. Regardless, the potential cost to RPU <strong>of</strong> an emissions tax would significantly impactretail rates.Comparison <strong>of</strong> ScenariosA comparison <strong>of</strong> the various scenarios studied provides a somewhat surprising result. If RPUadopts the renewable resource acquisition strategy, total power supply costs would not besignificantly greater than acquiring efficient natural gas resources, even if natural gas pricesfollowed the CPUC’s natural gas price forecast and declined for the next several years.If natural gas prices increase from 2007 levels rather than decline, the renewable alternativebecomes significantly more valuable.58
<strong>City</strong> <strong>of</strong> <strong>Riverside</strong> Public Utilities Department2008 <strong>Power</strong> Supply Integrated Resource PlanTable 6.8: Net Present Value (NPV) SummaryFY 2009 2010 2011 2012 2013 NPVDo NothingScenario$151,835 $164,727 $176,790 $173,027 $177,125 $843,504NPV $144,605 $149,412 $152,718 $142,350 $138,782 $727,867PlusClearwaterand$144,606 $157,315 $172,371 $169,707 $175,786 $819,785RenaissanceNPV $137,720 $142,689 $148,901 $139,618 $137,733 $706,661Plus NaturalGas $144,606 $157,315 $172,371 $169,024 $175,275 $818,591GenerationNPV $137,720 $142,689 $148,901 $139,056 $137,333 $705,699HighNatural Gas $144,606 $157,896 $174,144 $171,275 $180,418 $828,339PricesNPV $137,720 $143,216 $150,432 $140,908 $141,362 $713,639PlusRenewable$144,332 $157,108 $173,241 $170,823 $179,978 $825,482NPV $137,459 $142,502 $149,652 $140,537 $141,017 $711,167Summary and ConclusionThe scenarios presented above show that adding the Clearwater <strong>Power</strong> Plant to RPU’s resourcemix in 2008, the Renaissance Project in 2010/2011 and another 10 to 15 MW <strong>of</strong> baseloadrenewable generation in 2013 leads to the lowest total power supply costs over the planninghorizon. If natural gas prices decline, a combined-cycle facility results in the lowest total costs,assuming that there are no carbon taxes or other environmental penalties.If natural gas prices rise in the future, adding 10 to 15 MW <strong>of</strong> baseload renewable resourcesevery two years beginning in 2013 results in the lowest long-term power supply costs, along withthe added benefits <strong>of</strong> greater price certainty and less risk <strong>of</strong> penalties. Even with the decliningforecast <strong>of</strong> natural gas costs used by regulatory bodies at the state and federal level, a renewableresource portfolio has a slight impact on rates over the next five years.59
<strong>City</strong> <strong>of</strong> <strong>Riverside</strong> Public Utilities Department2008 <strong>Power</strong> Supply Integrated Resource PlanThere is no reason to believe that fossil fuel prices in the foreseeable future will begin a longtermprice decline. As such, entering into long-term renewable resource contracts will result inthe lowest risked-balanced rates for RPU ratepayers.Figure 6.4 shows the effects on RPU’s total resource portfolio <strong>of</strong> the recommended supply plan.Figure 6.4: Renewable EnergyPlanned RenewableCalendar Year ForecastRPS Level (GWh)15001400130012001100100090080070060050040030010%11%Existing & ProposedRenewablesRPS % <strong>of</strong> RetailLoad33%50%APPENDICESA. Description <strong>of</strong> MRTUB. <strong>Riverside</strong>’s Transmission ResourcesC. Load Forecast Methodology55%50%45%40%35%30%25%20%15%10%RPS % OF RETAIL LOAD2005%2008 2010 2012 2014 2016 2018 2020 2022 2024 2026RPS % Based on Calendar Year60
<strong>City</strong> <strong>of</strong> <strong>Riverside</strong>Public Utilities Department - Resources Division2008 <strong>Power</strong> SupplyIntegrated Resource PlanAppendix ACalifornia Independent System OperatorMarket Redesign and Technology UpgradeIntroductionSoon after the CAISO’s initial operations in 1998, the FERC directed the CAISO to redesign itstransmission market methodology, particularly its zonal approach to transmission congestionmanagement. This redesign effort was given the moniker Market Design 2002 (MD02) and wasintended to correct numerous identified flaws in the CAISO’s market mechanisms. The CAISO’sMD02 effort was not implemented in a timely fashion and, ultimately, these flaws were exploitedby a number <strong>of</strong> market participants - leading to what has been termed the 2000-2001 EnergyCrisis. The CAISO has continued attempting to redesign the California wholesale energymarkets in order to prevent a repeat <strong>of</strong> the 2000-2001 Energy Crisis. The CAISO’s latest attemptat redesigning its markets has been designated Market Redesign and Technology Upgrade(“MRTU”). The MRTU wholesale market redesign requires significant changes to the way RPUplans for, acquires and operates its generation resources and wholesale power supplytransactions.The current pre-MRTU market relies primarily on traditional bilateral transactions betweenmarket participants, where LSE’s meet their loads through generation resources and powerpurchase agreements. The CAISO’s current Imbalance Energy market is used to supply orabsorb, as appropriate, any energy deviations between forecasted loads and LSE-suppliedbilateral energy transactions. Because the CAISO’s Imbalance Energy market is only intended toaccommodate small deviations between LSE supply and demand, its expected energy volumesshould be small compared to the amount <strong>of</strong> load represented by the CAISO system. During the2000-2001 Energy Crisis, the CAISO’s Imbalance Energy market was inappropriately used as anoptional real-time market mechanism, resulting in abnormally large LSE deviations andextraordinarily high energy prices. The CAISO does not currently operate any forward energymarkets, leaving this obligation to the LSEs and their bilateral transactions.Although the CAISO also operates an Ancillary Services (i.e., capacity-based) market, LSEstoday are primarily concerned with the supply <strong>of</strong> energy to meet their load. Nevertheless, theCAISO has implemented new capacity procurement requirements for LSEs as MRTUimplementation approaches. These new obligations for LSEs to procure capacity reflects theA - 1
CAISO’s increasing concern that sufficient generating capacity may not be available at all timesto meet CAISO system load.The MRTU market represents a significant shift away from the CAISO’s original thinking. TheCAISO’s original design was expected to promote a prolific new electricity commodity market,with system reliability a by-product <strong>of</strong> that activity. This original philosophy was embodied inthe CAISO’s corporate mantra “Reliability Through Markets,” which was discontinued soonafter the 2000-2001 Energy Crisis. With the implementation <strong>of</strong> the MRTU market, CAISOelectric system reliability is the primary consideration and cost is considered secondarily.The Current CAISO MarketThe CAISO currently operates as a single control area, now referred to as a “BalancingAuthority,” originally derived from the combined transmission grids <strong>of</strong> California’s three majorinvestor-owned utilities; Southern California Edison (“SCE”), Pacific Gas & Electric (“PG&E”)and San Diego Gas & Electric (“SDG&E”). Since its initial operation in 1998, the CAISO’soperational control <strong>of</strong> transmission facilities has been extended by the inclusion <strong>of</strong> several <strong>of</strong> theState’s governmental utilities’ transmission entitlements (excluding those <strong>of</strong> the Los AngelesDepartment <strong>of</strong> Water and <strong>Power</strong> and the Sacramento Municipal Utility District, among others).Using the transmission entitlements under its operational control, the CAISO provides nondiscriminatoryaccess to the transmission grid for wholesale buyers and sellers <strong>of</strong> electricity.Much <strong>of</strong> the CAISO’s pre-MRTU efforts have been aimed at ensuring feasible schedules 25 andthe maintenance <strong>of</strong> reliable system operating conditions. This requires the CAISO to managecongestion between the three major transmission zones comprising the CAISO grid, whileensuring that sufficient generation is available for reliability. Flaws associated with this zonalapproach to management <strong>of</strong> the transmission grid include generators ignoring intra-zonaltransmission constraints (assuming generator awareness <strong>of</strong> the constraints) and a potential lack <strong>of</strong>adequate generating capacity to ensure reliable system operation. That is, the CAISO cannot beassured that sufficient capacity, strategically located within the CAISO transmission grid andresponsive to CAISO operating instructions, is available to reasonably assure reliable gridoperations.Finally, from an economic standpoint, there is no ability to ensure that the lowest cost resourceswill be used to satisfy load and system reliability requirements. In many instances, high costgeneration is operated to address locational reliability concerns, while low cost generationremains idle.In addition to those identified above, a number <strong>of</strong> additional problems should be addressed toincrease reliability and help keep wholesale energy prices low. These identified problemsinclude:25 The feasibility <strong>of</strong> schedules refers to the CAISO transmission grid’s ability to accommodate the requested use <strong>of</strong>certain CAISO grid components. The use <strong>of</strong> the CAISO grid is requested by market participants through theirsubmission <strong>of</strong> resource “schedules,” which represent hourly amounts <strong>of</strong> energy to flow over those components. Forexample, market participant schedules totaling 1000 MW and requested to flow from Point A to Point B would beconsidered infeasible if the facilities between those points could only accommodate 900 MW.A - 2
generators at different locations on the CAISO transmission grid; one can generate at$50/MWh and the other at $100/MWh. If the grid cannot accommodate all <strong>of</strong> thegeneration from the lower cost unit and the CAISO must use energy from the higher costunit, the congestion cost would be the difference between the two generator costs, or$50/MWh.Identifying and measuring congestion costs in a LMP environment is exceptionally difficult andlargely dependant on a variety <strong>of</strong> factors, such as load levels and the location <strong>of</strong> individualgenerators on the grid. In addition to LMP, the CAISO intends to operate day-ahead and realtimeenergy markets in conjunction with its Ancillary Services market. These energy markets arecreated by the removal <strong>of</strong> the CAISO’s “Market Separation Rule.” The Market Separation Rulerequired that all LSEs submit resource schedules exactly equal to, or in “balance” with, their loadschedules. With MRTU’s elimination <strong>of</strong> this rule, LSEs will be free to submit load schedules thatexceed their resource schedules, thus making an implicit <strong>of</strong>fer to purchase energy from theCAISO’s markets for the difference. Likewise, LSEs may submit resource schedules that exceedtheir load schedules, thus making an implicit <strong>of</strong>fer to sell energy to the CAISO’s markets for thedifference.Scheduling and BiddingAs described above, today’s pre-MRTU marketplace requires each LSE to schedule its energyresources to exactly meet its load. In MRTU, entities can purchase energy from the CAISO’sday-ahead market in addition to meeting load with their own contracts or generation.Under MRTU, each generation resource will bid its energy supplies into the CAISO’s markets ata specific transmission node. The CAISO will then choose which <strong>of</strong> the available resources to bedispatched based upon costs, transmission availability, the need for local capacity and otherfactors (LSE’s can choose to dispatch their own resources in non-economic order by Self-Scheduling 28 if they so choose).By requiring each resource to show its cost <strong>of</strong> generation, the CAISO can theoretically minimizethe overall cost <strong>of</strong> energy for the State and ensure that no LSE pays more for energy than if itdispatched it’s own resources.MRTU Impact on RPUAny discussion <strong>of</strong> the CAISO’s MRTU effort must recognize the dynamic nature <strong>of</strong> its ongoingdevelopment. New and revised aspects <strong>of</strong> the proposed MRTU market are discovered at abreakneck pace. Therefore, it is impossible at this time to accurately predict how MRTUimplementation will affect RPU’s power supply costs. RPU can choose to Self-Schedule itsresources and, ideally, be no worse <strong>of</strong>f than if MRTU did not exist; provided, that transmissionsystem congestion does not occur. If the CAISO’s prediction <strong>of</strong> MRTU operations is accurate,28 Self-Scheduling refers to an entity’s ability to force the dispatch <strong>of</strong> a specific resource to meet the entity’srequirements, regardless <strong>of</strong> potential congestion costs. Thus, an entity that elects to Self-Schedule the output <strong>of</strong> aspecified resource assumes the full risk <strong>of</strong> congestion costs and adopts the role <strong>of</strong> a price-taker with respect to thesecosts.A - 4
RPU’s future power supply costs should be lower than if RPU operated its own resources to meetits customer loads.RPU has expended approximately $4.5 million to date in preparation for MRTU implementation.This money is being used to upgrade RPU’s computer hardware and scheduling/accountingapplications to conform with MRTU requirements, training <strong>of</strong> personnel and development <strong>of</strong> thenecessary s<strong>of</strong>tware and communications equipment and services necessary to efficiently leverageMRTU implementation. Through its provision <strong>of</strong> certain wholesale power supply services to thecities <strong>of</strong> Azusa, Banning and Corona, a portion <strong>of</strong> these RPU costs are shared by other similarlysituated utilities, thus significantly helping to mitigate the cost <strong>of</strong> RPU’s infrastructureinvestments, while leveraging RPU’s staff expertise.If the CAISO’s predictions related to MRTU operations is accurate, RPU’s future power supplycosts should be lower than if RPU operated its own resources to meet its customer loads, andRPU should see a return on this investment. If the CAISO is unable to implement the MRTUmarketplace, or implementation delays continue, some <strong>of</strong> these expenditures will have beenunnecessary.A - 5
<strong>City</strong> <strong>of</strong> <strong>Riverside</strong>Public Utilities Department - Resources Division2008 <strong>Power</strong> SupplyIntegrated Resource PlanAppendix BSummary <strong>of</strong> Transmission Rights and CostsIntroductionRPU began acquiring transmission rights in the late 1970’s as a necessary means <strong>of</strong> accessinginexpensive energy from regions outside <strong>of</strong> Southern California. Most <strong>of</strong> RPU’s transmissionresources were originally acquired to allow power purchases from a specific resource.At its inception, the CAISO’s transmission system was comprised <strong>of</strong> the combined transmissionsystems <strong>of</strong> California’s major investor-owned utilities (“IOU’s”). The IOU’s were SCE, PG&Eand SDG&E, which became the CAISO’s first Participating Transmission Owners (“PTO’s”)under the CAISO’s tariff by transferring operational control <strong>of</strong> their transmission facilities andentitlements to the CAISO. In return for this transfer, the IOU’s, as PTO’s, began receivingmonthly payments from the CAISO for recovery <strong>of</strong> their annual transmission revenuerequirements. The funds for these payments originate from the fees charged by the CAISO to allusers <strong>of</strong> the CAISO grid.Not having initially transferred its transmission entitlements to the CAISO, <strong>Riverside</strong> wasrequired to continue paying the cost <strong>of</strong> those entitlements (debt service, O&M, capitalimprovements), as well as the CAISO’s transmission wheeling cost, 29 in order to obtaincontiguous transmission services from its various resources to its load. On January 1, 2003, RPUitself became a PTO by transferring operational control <strong>of</strong> its transmission entitlements to theCAISO. Like the IOU’s, RPU then began receiving monthly payments from the CAISO forrecovery <strong>of</strong> RPU’s annual transmission revenue requirement. RPU continues to receive thosemonthly payments.As a further incentive to encourage entities to become a PTO, RPU also receives FirmTransmission Rights (“FTR’s”) equal to its entitlements transferred to the CAISO. RPU willcontinue to receive these FTR’s until the earlier <strong>of</strong> (i) MRTU implementation, when FTR’s willbe converted to CRR’s, or (ii) December 31, 2010. Upon MRTU implementation, all LSE’s willbe allocated CRR’s based on their load requirements. If MRTU implementation is delayed until29 The CAISO’s transmission wheeling cost is derived from the aggregate transmission revenue requirements <strong>of</strong> allPTOs; i.e., entities that have transferred operational control <strong>of</strong> their transmission entitlements to the CAISO.B - 1
after December 31, 2010, RPU would be required to purchase in the CAISO’s auction any FTR’sit desired to hedge congestion costs during the intervening period.Becoming a PTO reduced RPU’s net annual transmission costs by approximately $17,500,000.This net reduction results from the CAISO’s reimbursement <strong>of</strong> RPU’s annual transmissionrevenue requirement, while assessing RPU for transmission service at a rate reflecting theaverage cost <strong>of</strong> all PTO transmission revenue requirements. In 2008 this represented a reductionin RPU’s transmission service costs from $7.54 per MWh to $3.30 per MWh.A brief description <strong>of</strong> RPU’s different transmission entitlements is provided below. It isimportant to recognize, though, that as <strong>of</strong> 2010 RPU will lose any priority rights on these linesand would need to purchase CRR’s on these transmission paths in order to continue bringing unitspecific power into <strong>Riverside</strong> and avoid the risk <strong>of</strong> transmission congestion charges.Mead-Phoenix ProjectThe Mead-Phoenix Project consists <strong>of</strong> 500 kV alternating current transmission lines betweenWestwing and Perkins Substations, between Perkins and Mead Substations, and between Meadand Marketplace Substations. Westwing and Perkins Substations are located near Phoenix,Arizona, while Mead and Marketplace Substations are located near Boulder <strong>City</strong>, Nevada.RPU’s entitlement in this 1,300 MW transmission path is 12 MW. RPU’s participation in thispath was prompted by the need to procure long-term transmission related to its 12 MWentitlement in the Palo Verde Nuclear Generating Station.Mead-Adelanto ProjectThe Mead-Adelanto Project consists <strong>of</strong> a 500 kV alternating current transmission line betweenMarketplace and Adelanto Substations. Marketplace Substation is located near Boulder <strong>City</strong>,Nevada, while Adelanto Substation is located near the <strong>City</strong> <strong>of</strong> Adelanto, California. RPU’sentitlement in this 1,800 MW transmission path is 118 MW. RPU’s participation in this path wasprompted by the need to procure long-term transmission related to its 12 MW entitlement in thePalo Verde Nuclear Generating Station, and to allow for future resources expected to use thenow-defunct Utah-Nevada Transmission Project, a high voltage transmission line originallyplanned to connect the Pacific Northwest and the Desert Southwest.Southern Transmission System (“STS”)The STS is a 1000 kV direct current transmission line between the Intermountain <strong>Power</strong> Projectand the Adelanto Substation. The Intermountain <strong>Power</strong> Project is located near Delta, Utah, whilethe Adelanto Substation is located near the <strong>City</strong> <strong>of</strong> Adelanto, California. RPU’s entitlement inthis 1,920 MW transmission path is 195 MW. At present, the STS is a transmission componentrequired for delivery <strong>of</strong> power related to RPU’s Intermountain <strong>Power</strong> Project entitlement, as wellas power under RPU’s power purchase agreement with the Deseret Generation & TransmissionCooperative.The STS will be used to convey RPU’s energy entitlements from the Renaissance GeothermalProject beginning in 2010.B - 2
Northern Transmission System (“NTS”)The NTS consists <strong>of</strong> two transmission paths: two 345 kV alternating current transmission linesbetween the Intermountain <strong>Power</strong> Project and the Mona Substation, and one 230 kV alternatingcurrent transmission line between the Intermountain <strong>Power</strong> Project and the Gonder Substation.The Intermountain <strong>Power</strong> Project is located near Delta, Utah, while the Mona Substation islocated near the <strong>City</strong> <strong>of</strong> Mona, Utah, and the Gonder Substation is located near Ely, Nevada.RPU’s NTS entitlements are currently reduced by 20 MW by virtue <strong>of</strong> its sale <strong>of</strong> firmbidirectional service to Deseret between Mona and Gonder, leaving 51 MW available on theIntermountain-Mona path and zero on the IPP-Gonder path.The IPP-Mona portion <strong>of</strong> the NTS will be used to convey RPU’s Renaissance GeothermalProject energy entitlements beginning in 2010.Celilo – Sylmar 1000 kV DC LineAlso known as the Pacific DC Intertie, the Celilo-Sylmar 1000 kV DC line is a direct currenttransmission line between Sylmar, California and The Dalles, Oregon. <strong>Riverside</strong>’s 23 MW bidirectionalfirm transmission service entitlement was purchased from the cities <strong>of</strong> Burbank andPasadena in 1990 to convey energy associated with the BPA-<strong>Riverside</strong> Capacity Sale/ExchangeAgreement and will terminate concurrent with termination <strong>of</strong> that agreement in 2010.Adelanto – Lugo Transmission ServiceUnder three separate agreements with the Los Angeles Department <strong>of</strong> Water and <strong>Power</strong>(“LADWP”), RPU currently has firm transmission service entitlements totaling (i) 313 MWfrom LADWP’s Adelanto Switching Station to the midpoint <strong>of</strong> the Lugo-Victorville 500 KVline, and (ii) 118 MW from the midpoint <strong>of</strong> the Lugo-Victorville 500 KV line to LADWP’sAdelanto Switching Station. These transmission service entitlements provide a path between theISO Controlled Grid and <strong>Riverside</strong>’s entitlements in the STS and the Mead-Adelanto Project.Mead – VistaUnder contract with SCE, RPU holds a 30 MW entitlement to firm transmission service from the<strong>Western</strong> <strong>Area</strong> <strong>Power</strong> <strong>Administration</strong>’s Mead 230 KV Substation located in Boulder <strong>City</strong>, Nevadato <strong>Riverside</strong>’s point <strong>of</strong> interconnection on the CAISO Controlled Grid at SCE’s Vista Substation.This transmission right was initially procured in order to transmit energy and capacity associatedwith <strong>Riverside</strong>’s Hoover <strong>Power</strong> Station entitlement.Lugo-Vista Transmission ServiceUnder two contracts with SCE, RPU holds a total <strong>of</strong> 168 MW in firm transmission serviceentitlements from the midpoint <strong>of</strong> the Lugo-Victorville 500 KV line to <strong>Riverside</strong>’s point <strong>of</strong>interconnection on the CAISO Controlled Grid at SCE’s Vista Substation. These rights wereoriginally procured to accommodate RPU’s entitlements in IPP and the Palo Verde NuclearGenerating Station.B - 3
San On<strong>of</strong>re-Vista Transmission ServiceUnder a contract with SCE RPU holds a 42 MW entitlement to firm transmission service fromthe San On<strong>of</strong>re Nuclear Generating Station (“SONGS”) to <strong>Riverside</strong>’s point <strong>of</strong> interconnectionon the ISO Controlled Grid at SCE’s Vista Substation. This entitlement was procured toaccommodate RPU’s ownership entitlement in SONGS.B - 4
<strong>City</strong> <strong>of</strong> <strong>Riverside</strong>Public Utilities Department - Resources Division2008 <strong>Power</strong> SupplyIntegrated Resource PlanAppendix CLong-Term Demand ForecastRegression StatisticsFollowing are the regression statistics for historical energy sales in the Residential andCommercial rate classes.RESIDENTIALMultiple R 0.9917R Square 0.9834Adj R Square 0.9680Standard Error 7,884Observations 72df SS MS FRegression 4 2.505E+11 6.262E+10 1,007Residual 68 4.226E+9 62,157,014Total 72 2.547E+11Coefficients Std Error t Stat P-valuePopulation 0.759027 0.294638 2.57613 0.012167CDD 91.9939 8.16665 11.2645 3.36E-17HDD 36.0868 11.3473 3.18021 0.002217Price -1,353,977 642,387 -2.10772 0.038743COMMERCIALMultiple R 0.9984R Square 0.9968Adj R Square 0.9823Standard Error 6,023Observations 72C - 1
df SS MS FRegression 3 7.911E+11 2.637E+10 7,268Residual 69 2.503E+9 36,282,195Total 72 7.936E+11Coefficients Std Error t Stat P-valueCDD 48.5936 6.20794 7.82765 4.13E-11HDD -19.5283 8.61698 -2.26626 0.026575Employment 0.124789 0.002395 52.0962 3.9E-57Data SourcesThe following data sources were used in this forecast model:Customer Energy Sales:RPU-FinanceRetail Electricity Prices:RPU-Finance<strong>City</strong> Population:<strong>City</strong> Planning Dept.Cooling/Heating Degree-Days: Nat’l Weather Bureau (UCR Station)County Employment—historical: State Finance Dept.County Employment—projections: <strong>City</strong> Planning Dept / Webb & Assoc.Historical Energy/Peak Loads: RPU-<strong>Power</strong> ResourcesMONTHLY ENERGY (MWh)JAN FEB MAR APR MAY JUN JUL AUG SEP OCT NOV DEC ANNUAL2008 173,635 172,490 172,440 170,016 180,288 200,682 225,784 229,187 213,055 184,289 174,489 178,466 2,274,8212009 177,532 176,390 176,350 173,928 184,209 204,612 229,722 233,138 217,014 188,255 178,464 182,463 2,322,0772010 181,515 180,377 180,348 177,928 188,217 208,629 233,748 237,178 221,060 192,310 182,526 186,548 2,370,3832011 185,586 184,452 184,434 182,016 192,315 212,735 237,862 241,307 225,197 196,454 186,679 190,725 2,419,7622012 189,748 188,619 188,610 186,195 196,503 216,933 242,069 245,528 229,425 200,690 190,924 194,993 2,470,2372013 194,003 192,877 192,880 190,467 200,784 221,223 246,368 249,842 233,747 205,021 195,263 199,357 2,521,8322014 198,351 197,230 197,244 194,833 205,161 225,609 250,763 254,252 238,165 209,447 199,699 203,816 2,574,5712015 202,797 201,680 201,705 199,297 209,634 230,092 255,255 258,760 242,680 213,971 204,232 208,375 2,628,4802016 207,340 206,228 206,265 203,859 214,207 234,675 259,847 263,368 247,296 218,596 208,867 213,035 2,683,5842017 211,985 210,877 210,926 208,523 218,881 239,359 264,541 268,078 252,014 223,323 213,603 217,797 2,739,9092018 216,732 215,630 215,691 213,290 223,659 244,147 269,339 272,892 256,837 228,155 218,445 222,665 2,797,4822019 221,585 220,487 220,561 218,163 228,542 249,041 274,243 277,813 261,766 233,094 223,394 227,641 2,856,3312020 226,545 225,452 225,538 223,144 233,534 254,044 279,256 282,843 266,804 238,142 228,453 232,727 2,916,4822021 231,615 230,527 230,626 228,235 238,636 259,157 284,380 287,984 271,954 243,302 233,623 237,925 2,977,9652022 236,797 235,715 235,827 233,438 243,852 264,384 289,617 293,239 277,218 248,576 238,908 243,238 3,040,8082023 242,094 241,017 241,143 238,757 249,182 269,726 294,970 298,610 282,599 253,967 244,309 248,669 3,105,0412024 247,508 246,437 246,576 244,194 254,631 275,186 300,441 304,099 288,098 259,476 249,830 254,219 3,170,6962025 253,042 251,976 252,129 249,751 260,200 280,767 306,034 309,711 293,719 265,108 255,474 259,892 3,237,8022026 258,698 257,638 257,806 255,430 265,892 286,472 311,750 315,446 299,464 270,864 261,241 265,690 3,306,391C - 2
MONTHLY PEAKS (MW)JAN FEB MAR APR MAY JUN JUL AUG SEP OCT NOV DEC0.001791 0.001780 0.001840 0.002100 0.002271 0.002440 0.002500 0.002530 0.002530 0.002200 0.001976 0.0018002008 311 307 317 357 409 490 564 580 539 405 345 3212009 318 314 324 365 418 499 574 590 549 414 353 3282010 325 321 332 374 427 509 584 600 559 423 361 3362011 332 328 339 382 437 519 595 611 570 432 369 3432012 340 336 347 391 446 529 605 621 580 442 377 3512013 347 343 355 400 456 540 616 632 591 451 386 3592014 355 351 363 409 466 550 627 643 603 461 395 3672015 363 359 371 419 476 561 638 655 614 471 404 3752016 371 367 380 428 486 573 650 666 626 481 413 3832017 380 375 388 438 497 584 661 678 638 491 422 3922018 388 384 397 448 508 596 673 690 650 502 432 4012019 397 392 406 458 519 608 686 703 662 513 441 4102020 406 401 415 469 530 620 698 716 675 524 451 4192021 415 410 424 479 542 632 711 729 688 535 462 4282022 424 420 434 490 554 645 724 742 701 547 472 4382023 434 429 444 501 566 658 737 755 715 559 483 4482024 443 439 454 513 578 671 751 769 729 571 494 4582025 453 449 464 524 591 685 765 784 743 583 505 4682026 463 459 474 536 604 699 779 798 758 596 516 478SCENARIO: MONTHLY ENERGY (MWh) in Adverse Hot WeatherJAN FEB MAR APR MAY JUN JUL AUG SEP OCT NOV DEC ANNUAL2008 173,635 173,970 176,141 177,417 185,469 215,189 242,216 246,063 232,596 190,507 181,891 178,466 2,373,5602009 177,489 177,831 180,009 181,293 189,351 219,079 246,113 249,967 236,508 194,426 185,817 182,401 2,420,2832010 181,429 181,778 183,964 185,254 193,320 223,055 250,097 253,959 240,507 198,432 189,831 186,423 2,468,0472011 185,457 185,813 188,006 189,304 197,377 227,120 254,169 258,039 244,594 202,527 193,934 190,535 2,516,8752012 189,575 189,938 192,139 193,443 201,525 231,275 258,332 262,210 248,773 206,714 198,128 194,738 2,566,7882013 193,784 194,154 196,363 197,675 205,764 235,523 262,587 266,474 253,045 210,993 202,415 199,034 2,617,8122014 198,086 198,465 200,682 202,001 210,098 239,865 266,938 270,833 257,411 215,368 206,798 203,427 2,669,9712015 202,485 202,871 205,096 206,423 214,529 244,303 271,384 275,288 261,875 219,840 211,278 207,916 2,723,2892016 206,981 207,375 209,609 210,944 219,058 248,841 275,930 279,843 266,438 224,411 215,858 212,506 2,777,7922017 211,577 211,979 214,222 215,565 223,687 253,479 280,577 284,499 271,102 229,084 220,540 217,197 2,833,5062018 216,275 216,686 218,937 220,288 228,420 258,220 285,327 289,258 275,870 233,861 225,325 221,993 2,890,4582019 221,078 221,497 223,757 225,117 233,257 263,066 290,182 294,123 280,744 238,743 230,217 226,894 2,948,6742020 225,987 226,414 228,684 230,052 238,202 268,020 295,145 299,095 285,726 243,734 235,217 231,905 3,008,1822021 231,005 231,441 233,721 235,097 243,256 273,084 300,218 304,178 290,818 248,836 240,328 237,027 3,069,0102022 236,134 236,580 238,869 240,254 248,423 278,261 305,404 309,374 296,023 254,051 245,553 242,262 3,131,1882023 241,377 241,832 244,131 245,526 253,704 283,552 310,705 314,685 301,344 259,381 250,893 247,614 3,194,7452024 246,737 247,201 249,510 250,914 259,103 288,960 316,124 320,114 306,783 264,830 256,352 253,084 3,259,7112025 252,215 252,689 255,008 256,422 264,621 294,488 321,662 325,663 312,342 270,400 261,932 258,675 3,326,1172026 257,814 258,299 260,628 262,052 270,261 300,139 327,323 331,336 318,025 276,092 267,635 264,390 3,393,994SCENARIO: MONTHLY PEAKS (MW) in Adverse Hot WeatherJAN FEB MAR APR MAY JUN JUL AUG SEP OCT NOV DEC0.001791 0.001780 0.001840 0.002100 0.002271 0.002440 0.002500 0.002530 0.002530 0.002200 0.001976 0.0018002008 311 310 324 373 421 525 606 623 588 419 359 3212009 318 317 331 381 430 535 615 632 598 428 367 3282010 325 324 338 389 439 544 625 643 608 437 375 3362011 332 331 346 398 448 554 635 653 619 446 383 3432012 340 338 354 406 458 564 646 663 629 455 392 3512013 347 346 361 415 467 575 656 674 640 464 400 3582014 355 353 369 424 477 585 667 685 651 474 409 3662015 363 361 377 433 487 596 678 696 663 484 417 3742016 371 369 386 443 497 607 690 708 674 494 427 3832017 379 377 394 453 508 618 701 720 686 504 436 3912018 387 386 403 463 519 630 713 732 698 514 445 4002019 396 394 412 473 530 642 725 744 710 525 455 4082020 405 403 421 483 541 654 738 757 723 536 465 4172021 414 412 430 494 552 666 751 770 736 547 475 4272022 423 421 440 505 564 679 764 783 749 559 485 4362023 432 430 449 516 576 692 777 796 762 571 496 4462024 442 440 459 527 588 705 790 810 776 583 507 4562025 452 450 469 538 601 719 804 824 790 595 518 4662026 462 460 480 550 614 732 818 838 805 607 529 476C - 3
SCENARIO: MONTHLY ENERGY (MWh) in Adverse Cool WeatherJAN FEB MAR APR MAY JUN JUL AUG SEP OCT NOV DEC ANNUAL2008 173,635 172,490 172,440 170,016 177,499 193,006 212,061 214,812 202,700 181,103 174,489 178,466 2,222,7162009 177,489 176,351 176,308 173,891 181,382 196,895 215,958 218,716 206,611 185,022 178,415 182,401 2,269,4392010 181,429 180,298 180,263 177,852 185,351 200,871 219,941 222,708 210,610 189,028 182,429 186,423 2,317,2032011 185,457 184,333 184,305 181,902 189,408 204,936 224,014 226,788 214,698 193,123 186,532 190,535 2,366,0302012 189,575 188,457 188,438 186,042 193,555 209,091 228,177 230,959 218,877 197,310 190,726 194,738 2,415,9442013 193,784 192,674 192,662 190,273 197,795 213,339 232,432 235,223 223,148 201,589 195,014 199,034 2,466,9682014 198,086 196,984 196,981 194,599 202,129 217,681 236,782 239,582 227,515 205,964 199,396 203,427 2,519,1272015 202,485 201,390 201,395 199,021 206,559 222,120 241,229 244,037 231,979 210,436 203,877 207,916 2,572,4452016 206,981 205,895 205,908 203,542 211,088 226,657 245,775 248,592 236,541 215,007 208,456 212,506 2,626,9482017 211,577 210,499 210,521 208,163 215,718 231,295 250,422 253,247 241,206 219,680 213,138 217,197 2,682,6622018 216,275 215,205 215,236 212,886 220,450 236,036 255,172 258,007 245,974 224,457 217,923 221,993 2,739,6132019 221,078 220,016 220,056 217,715 225,288 240,883 260,027 262,871 250,847 229,339 222,815 226,894 2,797,8292020 225,987 224,934 224,983 222,650 230,232 245,837 264,990 267,844 255,829 234,330 227,815 231,905 2,857,3372021 231,005 229,961 230,020 227,696 235,287 250,901 270,063 272,927 260,922 239,432 232,926 237,027 2,918,1662022 236,134 235,099 235,168 232,853 240,454 256,077 275,249 278,123 266,127 244,647 238,151 242,262 2,980,3442023 241,377 240,352 240,430 238,124 245,735 261,368 280,550 283,434 271,448 249,978 243,491 247,614 3,043,9012024 246,737 245,721 245,809 243,513 251,133 266,776 285,968 288,863 276,886 255,426 248,950 253,084 3,108,8672025 252,215 251,209 251,307 249,021 256,651 272,305 291,507 294,412 282,446 260,996 254,530 258,675 3,175,2722026 257,814 256,818 256,927 254,650 262,292 277,955 297,168 300,084 288,128 266,689 260,233 264,390 3,243,150SCENARIO: MONTHLY PEAKS (MW) in Adverse Cool WeatherJAN FEB MAR APR MAY JUN JUL AUG SEP OCT NOV DEC0.001791 0.001780 0.001840 0.002100 0.002271 0.002440 0.002500 0.002530 0.002530 0.002200 0.001976 0.0018002008 311 307 317 357 403 471 530 543 513 398 345 3212009 318 314 324 365 412 480 540 553 523 407 353 3282010 325 321 332 373 421 490 550 563 533 416 360 3362011 332 328 339 382 430 500 560 574 543 425 369 3432012 340 335 347 391 440 510 570 584 554 434 377 3512013 347 343 354 400 449 521 581 595 565 443 385 3582014 355 351 362 409 459 531 592 606 576 453 394 3662015 363 358 371 418 469 542 603 617 587 463 403 3742016 371 366 379 427 479 553 614 629 598 473 412 3832017 379 375 387 437 490 564 626 641 610 483 421 3912018 387 383 396 447 501 576 638 653 622 494 431 4002019 396 392 405 457 512 588 650 665 635 505 440 4082020 405 400 414 468 523 600 662 678 647 516 450 4172021 414 409 423 478 534 612 675 691 660 527 460 4272022 423 418 433 489 546 625 688 704 673 538 471 4362023 432 428 442 500 558 638 701 717 687 550 481 4462024 442 437 452 511 570 651 715 731 701 562 492 4562025 452 447 462 523 583 664 729 745 715 574 503 4662026 462 457 473 535 596 678 743 759 729 587 514 476C - 4
<strong>City</strong> <strong>of</strong> <strong>Riverside</strong>Public Utilities Department - Resources Division2008 <strong>Power</strong> SupplyIntegrated Resource PlanAppendix DSummary <strong>of</strong> Simulation ResultsD - 1
5 Year <strong>Power</strong> Supply Cost Projections - EXISTING RESOURCES ONLYResourceCapacity Costs$000 2009 2010 2011 2012 2013Palo Verde 3,780 3,780 3,780 3,780 3,780IPP 47,431 48,617 49,832 51,078 52,355Hoover 460 460 460 460 460Deseret 3,432 1,716Deseret Amort 3,340 1,670RA Capacity 2,963 1,567 1,707 2,206 2,361Placeholder - - - - -PlaceholderPlaceholderISO OP. Res. 684 684 684 684 684ISO Regulation 1,086 1,086 1,086 1,086 1,086BPA 1 842 842 434 - -Total $64,018 $60,422 $57,983 $59,294 $60,726SONGS 2009 2010 2011 2012 2013O&M 7,464 8,210 9,031 9,935 10,928Insurance 139 133 136 138 141Decom Expense 3,630 3,351 3,630 3,775 3,926Taxes andAssessments 872 921 939 958 977Nuclear FuelPurchase 1,987 1,019 1,332 1,386 1,172Total $14,092 $13,634 $15,069 $16,192 $17,145Transmission$000 2009 2010 2011 2012 2013Mead-Adelanto 2,865 2,865 2,865 2,865 2,865Mead-Phx 290 290 290 290 290STS 13,659 13,659 13,659 13,659 13,659NTS 1,490 1,490 1,490 1,490 1,490SCE 2,880 2,880 2,880 2,880 2,880ISO TAC 6,720 6,720 6,720 6,720 6,720ISO FTR's/CRR's 650 1,440 1,440 1,440 1,440ISO MLCC 1,200 1,200 1,200 1,200 1,200ISO RA MLCC 600 600 600 600 600ISO IntrazonalCong 600 600 600 600 600ISO InterzonalCong 600 600 600 600 600ISO WheelingCharge 604 604 604 604 604ISO GMC 1,877 1,877 1,877 1,877 1,877ISO Other Gross 600 600 600 600 600ISO MRTU 2,040 2,040 2,040 2,040 2,040Burb/Pasa DC 1,080 1,080 1,080 1,080 1,080LADWP Service 1,075 1,075 1,075 1,075 1,075SCE WDAT(NonTRR) 1,296 1,296 1,296 1,296 1,296D - 2
Total $40,126 $40,916 $40,916 $40,916 $40,916Resource Energy$000 2009 2010 2011 2012 2013Palo Verde 536 579 630 675 723IPP 2,481 3,620 3,733 3,857 3,958Hoover 331 334 332 331 331Deseret 7,516 3,789 - - -Cal EnergyGeothermal 11,829 24,581 24,581 24,648 24,581Neo Landfill 646 - - - -Badlands 340 - - - -Wintec 533 533 533 534 533RA Capacity - - - - -CDWR Super - - - - -RERC 1,2 (Fuel) 3,580 2,371 2,313 3,326 3,204Springs Fuel - - - - -Total $27,792 $35,806 $32,122 $33,371 $33,330PlannedAdditions 2009 2010 2011 2012 2013HL DA OptionsTerm MarketRERC 3,4 FuelWintec ExpansionGeneric Green BLGeneric BaseloadGeneric AnnualHLCapacityReservesSpot (Un-Hedged) 27,473 35,221 51,295 43,891 45,630Total $27,473 $35,221 $51,295 $43,891 $45,630WholesaleRevenue $000 2009 2010 2011 2012 2013Spot Market 1,180 786 109 151 135Term Market - - - - -ISO Wheel/Cong 1,200 1,200 1,200 1,200 1,200ISO TRR 19,286 19,286 19,286 19,286 19,286Total $21,666 $21,272 $20,595 $20,637 $20,621Summary $000 2009 2010 2011 2012 2013Gross Cost $173,502 $185,999 $197,385 $193,664 $197,746Net Cost $151,835 $164,727 $176,790 $173,027 $177,125Annual ReserveMarg. 0.0% 0.0% 0.0% 0.0% 0.0%Spot Energy Buy% 11.3% 14.3% 21.3% 18.5% 19.3%Spot Energy Sell% 3.2% 2.2% 0.7% 1.0% 0.9%D - 3
Average Cost/kWh $ 61.14 $ 65.19 $ 69.30 $ 67.41 $ 68.01Average Cost/kWh $61.14 $65.19 $69.30 $67.41 $68.01D - 4
5 Year <strong>Power</strong> Supply Cost Projections – ExistingResources Plus Clearwater and RenaissanceResourceCapacity Costs$000 2009 2010 2011 2012 2013Palo Verde 3780 3780 3780 3780 3780IPP 47431 48617 49832 51078 52355Hoover 460 460 460 460 460Deseret 3432 1716Deseret Amort 3340 1670RA Capacity 610 1763 1471 270 541Clearwater O&M $ 1,226 $ 1,226 $ 1,226 $ 1,230 $ 1,226Clearwater 3122 3122 3122 3122 3122RenaissanceISO OP. Res. 684 684 684 684 684ISO Regulation 1086 1086 1086 1086 1086BPA 1 842 842 434 0 0Total $66,014 $64,966 $62,096 $61,710 $63,255SONGS 2009 2010 2011 2012 2013O&M 7464 8210 9031 9935 10928Insurance 139 133 136 138 141Decom Expense 3630 3351 3630 3775 3926Taxes andAssessments 872 921 939 958 977Nuclear FuelPurchase 1987 1019 1332 1386 1172Total $14,092 $13,634 $15,069 $16,192 $17,145Transmission$000 2009 2010 2011 2012 2013Mead-Adelanto 2865 2865 2865 2865 2865Mead-Phx 290 290 290 290 290STS 13659 13659 13659 13659 13659NTS 1490 1490 1490 1490 1490SCE 2880 2880 2880 2880 2880ISO TAC 6720 6720 6720 6720 6720ISO FTR's/CRR's 650 650 650 650 650ISO MLCC 1200 1200 1200 1200 1200ISO RA MLCC 600 600 600 600 600ISO IntrazonalCong 600 600 600 600 600ISO InterzonalCong 600 600 600 600 600ISO WheelingCharge 604 604 604 604 604ISO GMC 1877 1877 1877 1877 1877ISO Other Gross 600 600 600 600 600ISO MRTU 2040 2040 2040 2040 2040Burb/Pasa DC 1080 1080 1080 1080 1080LADWP Service 1075 1075 1075 1075 1075D - 5
SCE WDAT(NonTRR) 1296 1296 1296 1296 1296Total $40,126 $40,126 $40,126 $40,126 $40,126ResourceEnergy $000 2009 2010 2011 2012 2013Palo Verde 536 579 630 675 723IPP 2481 3620 3733 3857 3958Hoover 331 334 332 331 331Deseret 7516 3789 0 0 0Cal EnergyGeothermal 11829 24581 24581 24648 24581Neo Landfill 646 0 0 0 0Badlands 340 0 0 0 0Wintec 533 533 533 534 533Clearwater 14938 15535 16312 17174 17984CDWR Super 0 0 0 0 0RERC 1,2 (Fuel) 2655 1867 1970 3031 3159Springs Fuel 0 0 0 0 0Total $41,804 $50,837 $48,090 $50,251 $51,269Additions 2009 2010 2011 2012 2013HL DA OptionsTerm MarketRERC 3,4 FuelWintecExpansionRenaissance 16724 34569 35530 36319GenericBaseloadGeneric AnnualHLCapacityReservesSpot (Un-Hedged) 10086 7672 7469 6131 8397Total $10,086 $24,397 $42,038 $41,661 $44,716WholesaleRevenue $000 2009 2010 2011 2012 2013Spot Market 8577 12336 10620 12827 12235Term Market 0 0 0 0 0ISO Wheel/Cong 1200 1200 1200 1200 1200ISO TRR 19286 19286 19286 19286 19286Total $29,063 $32,822 $31,106 $33,313 $32,721Summary $000 2009 2010 2011 2012 2013Gross Cost $172,122 $193,960 $207,419 $209,940 $216,510Net Cost $143,058 $161,138 $176,313 $176,627 $183,789Annual ReserveMarg. 0.0% 0.0% 0.0% 0.0% 0.0%D - 6
Spot Energy Buy% 5.3% 3.7% 3.5% 2.7% 3.4%Spot Energy Sell% 7.1% 9.9% 8.5% 10.3% 9.7%Pct Renewablewo/REC's 0% 0% 0% 0% 0%Average Cost $57.8 $64.0 $69.3 $68.8 $70.5D - 7
5 Year <strong>Power</strong> Supply Cost Projections - Clearwater/Renaissance and GasUnitsResourceCapacity Costs$000 2009 2010 2011 2012 2013Palo Verde 3,780 3,780 3,780 3,780 3,780IPP 47,431 48,617 49,832 51,078 52,355Hoover 460 460 460 460 460Deseret 3,432 1,716Deseret Amort -Gas 2102 3,340 1,670 1,800 1,800RA Capacity 610 1,763 1,471 - -Clearwater O&M 1,226 1,226 1,226 1,230 1,226Clearwater 3,122 3,122 3,122 3,122 3,122RenaissanceISO OP. Res. 684 684 684 684 684ISO Regulation 1,086 1,086 1,086 1,086 1,086BPA 1 842 842 434 - -Total $66,014 $64,966 $62,096 $63,240 $64,514SONGS 2009 2010 2011 2012 2013O&M 7,464 8,210 9,031 9,935 10,928Insurance 139 133 136 138 141Decom Expense 3,630 3,351 3,630 3,775 3,926Taxes andAssessments 872 921 939 958 977Nuclear FuelPurchase 1,987 1,019 1,332 1,386 1,172Total $14,092 $13,634 $15,069 $16,192 $17,145Transmission$000 2009 2010 2011 2012 2013Mead-Adelanto 2,865 2,865 2,865 2,865 2,865Mead-Phx 290 290 290 290 290STS 13,659 13,659 13,659 13,659 13,659NTS 1,490 1,490 1,490 1,490 1,490SCE 2,880 2,880 2,880 2,880 2,880ISO TAC 6,720 6,720 6,720 6,720 6,720D - 8
ISO FTR's/CRR's 650 650 650 650 650ISO MLCC 1,200 1,200 1,200 1,200 1,200ISO RA MLCC 600 600 600 600 600ISO IntrazonalCong 600 600 600 600 600ISO InterzonalCong 600 600 600 600 600ISO WheelingCharge 604 604 604 604 604ISO GMC 1,877 1,877 1,877 1,877 1,877ISO Other Gross 600 600 600 600 600ISO MRTU 2,040 2,040 2,040 2,040 2,040Burb/Pasa DC 1,080 1,080 1,080 1,080 1,080LADWP Service 1,075 1,075 1,075 1,075 1,075SCE WDAT(NonTRR) 1,296 1,296 1,296 1,296 1,296Total $40,126 $40,126 $40,126 $40,126 $40,126Resource Energy$000 2009 2010 2011 2012 2013Palo Verde 536 579 630 675 723IPP 2,481 3,620 3,733 3,857 3,958Hoover 331 334 332 331 331Deseret 7,516 3,789 - - -Cal EnergyGeothermal 11,829 24,581 24,581 24,648 24,581Neo Landfill 646 - - - -Badlands 340 - - - -Wintec 533 533 533 534 533Clearwater 19,419 19,141 18,480 17,889 17,392- - - - -RERC 1,2,3,4(Fuel) 3,451 2,300 2,231 3,157 2,634Springs Fuel - - - - -Total $47,082 $54,877 $50,520 $51,091 $50,151Additions 2009 2010 2011 2012 2013HL DA OptionsTerm MarketRERC 3,4 FuelD - 9
Wintec ExpansionRenaissance 16,724 34,569 35,530 36,319Gas 2012 - - - 6,686 14,082Generic Annual HLCapacity ReservesSpot (Un-Hedged) 13,112 9,453 8,462 3,115 2,440Total $13,112 $26,178 $43,031 $45,331 $52,841WholesaleRevenue $000 2009 2010 2011 2012 2013Spot Market 15,334 21,980 17,985 26,470 29,016Term Market - - - - -ISO Wheel/Cong 1,200 1,200 1,200 1,200 1,200ISO TRR 19,286 19,286 19,286 19,286 19,286Total $35,820 $42,466 $38,471 $46,956 $49,502Summary $000 2009 2010 2011 2012 2013Gross Cost $180,425 $199,781 $210,842 $215,980 $224,777Net Cost $144,606 $157,315 $172,371 $169,024 $175,275Annual ReserveMarg. 0.0% 0.0% 0.0% 0.0% 0.0%Spot Energy Buy % 5.3% 3.7% 3.5% 1.4% 1.1%Spot Energy Sell % 7.1% 9.9% 8.5% 12.9% 14.4%Average Cost $58.4 $62.5 $67.7 $65.9 $67.3D - 10
5 Year <strong>Power</strong> Supply Cost Projections - Clearwater/Renaissance/High GasResourceCapacity Costs$000 2009 2010 2011 2012 2013Palo Verde 3,780 3,780 3,780 3,780 3,780IPP 47,431 48,617 49,832 51,078 52,355Hoover 460 460 460 460 460Deseret 3,432 1,716Deseret Amort -Gas 2102 3,340 1,670 1,800 1,800RA Capacity 610 1,763 1,471 270 541Clearwater O&M 1,226 1,226 1,226 1,230 1,226Clearwater 3,122 3,122 3,122 3,122 3,122RenaissanceISO OP. Res. 684 684 684 684 684ISO Regulation 1,086 1,086 1,086 1,086 1,086BPA 1 842 842 434 - -Total $66,014 $64,966 $62,096 $63,510 $65,055SONGS 2009 2010 2011 2012 2013O&M 7,464 8,210 9,031 9,935 10,928Insurance 139 133 136 138 141Decom Expense 3,630 3,351 3,630 3,775 3,926Taxes andAssessments 872 921 939 958 977Nuclear FuelPurchase 1,987 1,019 1,332 1,386 1,172Total $14,092 $13,634 $15,069 $16,192 $17,145Transmission$000 2009 2010 2011 2012 2013Mead-Adelanto 2,865 2,865 2,865 2,865 2,865Mead-Phx 290 290 290 290 290STS 13,659 13,659 13,659 13,659 13,659NTS 1,490 1,490 1,490 1,490 1,490SCE 2,880 2,880 2,880 2,880 2,880ISO TAC 6,720 6,720 6,720 6,720 6,720ISO FTR's/CRR's 650 650 650 650 650ISO MLCC 1,200 1,200 1,200 1,200 1,200ISO RA MLCC 600 600 600 600 600ISO IntrazonalCong 600 600 600 600 600ISO InterzonalCong 600 600 600 600 600ISO WheelingCharge 604 604 604 604 604ISO GMC 1,877 1,877 1,877 1,877 1,877ISO Other Gross 600 600 600 600 600ISO MRTU 2,040 2,040 2,040 2,040 2,040Burb/Pasa DC 1,080 1,080 1,080 1,080 1,080LADWP Service 1,075 1,075 1,075 1,075 1,075D - 11
SCE WDAT(NonTRR) 1,296 1,296 1,296 1,296 1,296Total $40,126 $40,126 $40,126 $40,126 $40,126Resource Energy$000 2009 2010 2011 2012 2013Palo Verde 536 579 630 675 723IPP 2,481 3,620 3,733 3,857 3,958Hoover 331 334 332 331 331Deseret 7,516 3,789 - - -Cal EnergyGeothermal 11,829 24,581 24,581 24,648 24,581Neo Landfill 646 - - - -Badlands 340 - - - -Wintec 533 533 533 534 533Clearwater 19,419 20,390 21,409 22,541 23,604- - - - -RERC 1,2,3,4(Fuel) 3,451 2,450 2,585 3,979 3,575Springs Fuel - - - - -Total $47,082 $56,275 $53,803 $56,565 $57,304Additions 2009 2010 2011 2012 2013HL DA OptionsTerm MarketRERC 3,4 FuelWintec ExpansionRenaissance 16,724 34,569 35,530 36,319Gas 2012 - - - 9,267 21,023Generic AnnualHLCapacityReservesSpot (Un-Hedged) 13,112 10,070 9,803 3,925 3,312Total $13,112 $26,794 $44,372 $48,723 $60,654WholesaleRevenue $000 2009 2010 2011 2012 2013Spot Market 15,334 23,414 20,836 33,355 39,380Term Market - - - - -ISO Wheel/Cong 1,200 1,200 1,200 1,200 1,200ISO TRR 19,286 19,286 19,286 19,286 19,286Total $35,820 $43,900 $41,322 $53,841 $59,866Summary $000 2009 2010 2011 2012 2013Gross Cost $180,425 $201,796 $215,466 $225,116 $240,284Net Cost $144,606 $157,896 $174,144 $171,275 $180,418Annual ReserveMarg. 0.0% 0.0% 0.0% 0.0% 0.0%Spot Energy Buy% 5.3% 3.7% 3.5% 2.0% 2.2%D - 12
Spot Energy Sell% 7.1% 9.9% 8.5% 13.2% 15.6%Average Cost $58.4 $64.0 $69.3 $69.3 $71.6D - 13
5 Year <strong>Power</strong> Supply Cost Projections - RenewablesResourceCapacity Costs$000 2009 2010 2011 2012 2013Palo Verde 3,780 3,780 3,780 3,780 3,780IPP 47,431 48,617 49,832 51,078 52,355Hoover 460 460 460 460 460Deseret 3,432 1,716Deseret Amort 3,340 1,670RA Capacity 610 1,763 1,471 270 541Clearwater O&M 1,226 1,226 1,226 1,230 1,226Clearwater 3,122 3,122 3,122 3,122 3,122RenaissanceISO OP. Res. 684 684 684 684 684ISO Regulation 1,086 1,086 1,086 1,086 1,086BPA 1 842 842 434 - -Total $66,014 $64,966 $62,096 $61,710 $63,255SONGS 2009 2010 2011 2012 2013O&M 7,464 8,210 9,031 9,935 10,928Insurance 139 133 136 138 141Decom Expense 3,630 3,351 3,630 3,775 3,926Taxes andAssessments 872 921 939 958 977Nuclear FuelPurchase 1,987 1,019 1,332 1,386 1,172Total $14,092 $13,634 $15,069 $16,192 $17,145Transmission$000 2009 2010 2011 2012 2013Mead-Adelanto 2,865 2,865 2,865 2,865 2,865Mead-Phx 290 290 290 290 290STS 13,659 13,659 13,659 13,659 13,659NTS 1,490 1,490 1,490 1,490 1,490SCE 2,880 2,880 2,880 2,880 2,880ISO TAC 6,720 6,720 6,720 6,720 6,720ISO FTR's/CRR's 650 650 650 650 650ISO MLCC 1,200 1,200 1,200 1,200 1,200ISO RA MLCC 600 600 600 600 600ISO IntrazonalCong 600 600 600 600 600ISO InterzonalCong 600 600 600 600 600ISO WheelingCharge 604 604 604 604 604ISO GMC 1,877 1,877 1,877 1,877 1,877ISO Other Gross 600 600 600 600 600ISO MRTU 2,040 2,040 2,040 2,040 2,040Burb/Pasa DC 1,080 1,080 1,080 1,080 1,080LADWP Service 1,075 1,075 1,075 1,075 1,075SCE WDAT(Non 1,296 1,296 1,296 1,296 1,296D - 14
TRR)Total $40,126 $40,126 $40,126 $40,126 $40,126ResourceEnergy $000 2009 2010 2011 2012 2013Palo Verde 536 579 630 675 723IPP 2,481 3,620 3,733 3,857 3,958Hoover 331 334 332 331 331Deseret 7,516 3,789 - - -Cal EnergyGeothermal 11,829 24,581 24,581 24,648 24,581Neo Landfill 646 - - - -Badlands 340 - - - -Wintec 533 533 533 534 533Clearwater 19,419 19,141 18,480 17,889 17,392CDWR Super - - - - -RERC 1,2 (Fuel) 3,451 2,300 2,231 3,157 4,355Springs Fuel - - - - -Total $47,081 $54,877 $50,519 $51,090 $51,873Additions 2009 2010 2011 2012 2013HL DA OptionsTerm MarketRERC 3,4 FuelWintecExpansionRenaissance 16,724 34,569 35,530 36,319RenewableBaseload - - - - 9,897Generic AnnualHLCapacityReservesSpot (Un-Hedged) 13,112 9,453 8,462 6,386 5,819Total $13,112 $26,177 $43,031 $41,916 $52,035WholesaleRevenue $000 2009 2010 2011 2012 2013Spot Market 15,334 21,980 17,985 20,842 23,970Term Market - - - - -ISO Wheel/Cong 1,200 1,200 1,200 1,200 1,200ISO TRR 19,286 19,286 19,286 19,286 19,286Total $35,820 $42,466 $38,471 $41,328 $44,456Summary $000 2009 2010 2011 2012 2013Gross Cost $180,425 $199,781 $210,841 $211,035 $224,433Net Cost $144,605 $157,315 $172,370 $169,707 $179,978Annual ReserveMarg. 0.0% 0.0% 0.0% 0.0% 0.0%Spot Energy Buy 4.7% 3.2% 3.4% 2.4% 2.5%D - 15
%Spot Energy Sell% 7.0% 9.8% 8.5% 10.2% 12.0%Average Cost $ 58.42 $ 62.45 $ 67.75 $ 66.12 $ 69.05D - 16
<strong>City</strong> <strong>of</strong> <strong>Riverside</strong>Public Utilities Department - Resources Division2008 <strong>Power</strong> SupplyIntegrated Resource PlanAppendix EExisting and Planned Conservation and DSM ProgramsTable A: DSM ProgramsDemand Side ResourceProgramOff-Peak Swimming Pool FilterPump Use (Pool Saver Program)Residential Weatherization forSeniors And Disabled (WeCareProgram)Thermal Energy StorageIncentives for CoolingEquipment Replacement(TES Program)Non Residential AirConditioning Replacement/NewIncentiveEnergy Management TechnicalAssistance ProgramEnergy Management ControlSystemEfficient Refrigerator Incentives(Cool Rewards/ Energy Star)Residential/Commercial AirConditioner ReplacementIncentive (Cool Cash)Low Income Weatherizationprogram For Electrically HeatedDwellingsCustomer ClassResidential – RCommercial – CIndustrial – ILoad ChangeObjectiveProgram DurationR Load Shifting Feb 79 - presentRStrategicConservationMar 83 – presentC / I Load Shifting Jan 88 – presentCC / ICR / CR / CRPeak Clipping,StrategicConservationStrategicConservationStrategicConservationStrategicConservationPeak ClippingStrategicConservationJan 92 – presentJul 92 – Jun 93Dec 98 – presentSep 99 - presentJan 92 – Jun 94Dec 98 – Jun 02Jan 88 - Jun 96Dec 98 – presentJul 96 – Jun 02E - 1
(Mandated by CA SB 1601)Energy Efficient LightingOutdoor Security LightingEnergy Efficiency for MotorsProgramEfficient Cooling EquipmentReplacement & Variable Speed /Frequency Motor DrivesEnergy Star Rebate ProgramRefrigerator Recycling ProgramC / IC / IC / IC / IR / CRStrategicConservationStrategicConservationStrategicConservationStrategicConservationStrategicConservationStrategicConservationDec 98 – presentDec 98 – 02Dec 98 – presentDec 98 – Jun 04Feb 00 – Jun 04Dec 99 – Jun 04Aug 00 - presentApr 00 – presentTable B: Conservation ProgramsTIMEPERIODFYPROJECTEDCUMULATIVEKW REDUCTIONPROJECTED CUMULATIVEKWh REDUCTION1999-2000 13,126 15,750,0282000-2001 15,458 16,251,0652001-2002 19,709 30,323,8212002-2003 20,774 31,195,1622003-2004 23,760 33,485,8072004- 2005 25,662 48,809,2052005- 2006 26,593 47,075,8372006- 2007 29,479 53,193,6062007-2008 31,542 58,512,9662008-2009 33,750 64,364,2622009-2010 36,113 70,800,6882010-2011 38,640 77,880,7562011-2012 41,345 85,668,8311. Off-Peak Swimming Pool Filter Pump Use (Pool Saver Program)This program <strong>of</strong>fers residential customers a $5.00 per month credit on their statement when theyshift their swimming pool filter pump usage to the <strong>of</strong>f-peak period. This program has an annualbudget <strong>of</strong> $225, 000.E - 2
Through fiscal year 2006 - 2007 there was an average <strong>of</strong> 3,385 customers enrolled in thisprogram. Useful life <strong>of</strong> the measures installed as part <strong>of</strong> this program is more than 30 years.Projected cumulative kilowatt capacity reductions are based on 1.13 kilowatts per participant.Kilowatt-hour reductions can be projected based on kW demand times the number <strong>of</strong> peak hours.Participant growth in this program is projected at less than 1 percent per year and decreasing.TIMEPERIODFYPROJECTEDCUMULATIVEKW REDUCTIONPROJECTED CUMULATIVEKWh REDUCTION1999-2000 3,315 33,1502000-2001 3,348 33,4802001-2002 5,018 50,1802002-2003 3,781 37,8102003-2004 3,805 38,0502004-2005 3,573 35,7302005-2006 3,459 34,5902006-2007 3,320 33,2002007-2008 3,207 32,0702008-2009 3,094 30,9402009-2010 2,981 29,8102010-2011 2,868 28,6802011-2012 2,755 27,5502. Residential Weatherization for Seniors and Disabled - (WECARE Program)This program is <strong>of</strong>fered as a complementary service to encourage senior and disabled residentialcustomers to be more energy efficient. WeCare is an acronym for Wise Energy use CampaignAid the Retired and Elderly. Senior part-time utility staff visit the home and perform an energyaudit, water audit, and install weather stripping and low flow shower heads. If the water heater iselectric then a water heater blanket is installed.This program began in March 1983. From 1983 through fiscal year 2006-2007 there were 15,682customers who had participated in this program. Useful life <strong>of</strong> the measures installed as part <strong>of</strong>this program is more than 15 years. Projected cumulative kilowatt-hour reductions are based on561 kWh per participant. There are no associated kilowatt reductions with this strategicconservation program. Participant growth in this program is projected at around 1 percent peryear with a program budget <strong>of</strong> $5,000 annually.E - 3
TIMEPERIODFYPROJECTED CUMULATIVEKW REDUCTIONPROJECTED CUMULATIVEKWh REDUCTION1999-2000 NA 7,993,1282000-2001 NA 8,073,0592001-2002 NA 8,207,1382002-2003 NA 8,306,4352003- 2004 NA 8,354,6812004- 2005 NA 8,450,0512005-2006 NA 8,525,7862006-2007 NA 8,609,3752007-2008 NA 8,695,4682008-2009 NA 8,782,4232009-2010 NA 8,870,2472010-2011 NA 8,958,9492011-2012 NA 9,048,5393. Thermal Energy Storage Incentives for Cooling Equipment (“TES”) ProgramThis incentive program assists customers with funds when they consider an Off-Peak Coolingsystem at their existing facilities. These cooling systems can be for space conditioning as well asfor process cooling applications. To help with the cost <strong>of</strong> a feasibility study, the utility willprovide a 50 percent match, up to $5,000, toward the cost <strong>of</strong> a study. If the customer constructsan Off-Peak Cooling system, then the utility has an incentive <strong>of</strong> $200 per kilowatt <strong>of</strong> demandshifted from on-peak to <strong>of</strong>f-peak.Presently, there are seven Off-Peak Cooling systems in the utility service area that were installedto shift existing load from on-peak to <strong>of</strong>f-peak. They are:• University <strong>of</strong> California, <strong>Riverside</strong> campus - 3 systems• Public Utilities Operations Center - 1 system• <strong>Riverside</strong> Unified School District - 1 system• <strong>Riverside</strong> <strong>City</strong> Hall - 1 system• <strong>Riverside</strong> County Circle - 1 systemUseful life <strong>of</strong> the measures installed as part <strong>of</strong> this program is more than 30 years. Projectedcumulative kilowatt reductions are based on 1,000 kW per measure installed. There are noassociated kilowatt hour reductions with this load shifting program. There is no participantgrowth projected in this program due to the associated cost <strong>of</strong> a TES system. The budget iscalculated on per project need.E - 4
TIMEPERIODFYPROJECTED CUMULATIVEKW REDUCTIONPROJECTED CUMULATIVEKWh REDUCTION1999-2000 1,000 NA2000-2001 2,000 NA2001-2002 3,000 NA2002-2003 3,000 NA2003-2004 3,000 NA2004-2005 3,000 NA2005-2006 3,000 NA2006-2007 3,000 NA2007-2008 3,000 NA2008-2009 3,000 NA2009-2010 3,000 NA2010-2011 3,000 NA2011-2012 3,000 NA4. Non-Residential Air Conditioner Replacement IncentiveThis program <strong>of</strong>fers incentives to commercial customers when they replace older, less efficientcentral air conditioners with new high efficiency units. Rebates ranged from $70 to $120 per tonbased on size and efficiency rating <strong>of</strong> the new units.Through fiscal year 2006-2007 there were a total <strong>of</strong> 88 customers who had participated in thisprogram. Useful life <strong>of</strong> the measures installed as part <strong>of</strong> this program is more than 15 years.Projected cumulative kilowatt-hour reductions are based on 1,090 kWh per participant. Projectedcumulative kilowatt capacity reductions are based on 1.09 kW per participant. Participant growthin this program is projected at around 1.5 percent per year with an annual budget <strong>of</strong> $50,000.TIMEPERIODFYPROJECTED CUMULATIVEKW REDUCTIONPROJECTED CUMULATIVEKWh REDUCTION1999-2000 1,090 1,090,0002000-2001 1,101 1,101,0002001-2002 1,112 1,139,3682002-2003 1,150 1,261,4482003-2004 1,163 1,274,5282004-2005 1,190 1,301,7782005-2006 1,192 1,332,2982006-2007 1,195 1,387,8882007-2008 1,213 1,408,7062008-2009 1,232 1,429,836E - 5
2009-2010 1,250 1,451,2842010-2011 1,269 1,473,0532011-2012 1,288 1,495,1495. Energy Management Technical Assistance ProgramThis program <strong>of</strong>fers all commercial / industrial customers a comprehensive energy audit using as<strong>of</strong>tware program designed specifically for businesses. Demand rate and Time <strong>of</strong> Use customerscan receive the services <strong>of</strong> a technical consultant in addition to the audit.Through fiscal year 2006-2007 there were 31 customers who had participated in this program.Projected cumulative kilowatt reductions are based on 390 kW per participant. Participantgrowth in this program is projected around 1 percent per year with an annual budget <strong>of</strong> $100,000.TIMEPERIODFYPROJECTED CUMULATIVEKW REDUCTIONPROJECTED CUMULATIVEKWh REDUCTION1999-2000 6,240 NA2000-2001 7,410 NA2001-2002 8,580 NA2002-2003 10,530 NA2003-2004 12,870 NA2004-2005 14,430 NA2005-2006 15,210 NA2006-2007 17,940 NA2007-2008 20,451 NA2008-2009 23,314 NA2009-2010 26,579 NA2010-2011 30,300 NA2011-2012 34,542 NA6. Energy Management System AssistanceThis program <strong>of</strong>fers all non-residential customers an incentive <strong>of</strong> 50 percent <strong>of</strong> the purchaseprice or $50,000 (whichever is less) for installing an energy management system that will controlwhen the lights, heating and air-conditioning equipment, motors, etc. are turned on and <strong>of</strong>f foroptimal energy use.There were three energy management systems installed during the fiscal year 2001-2002. Therewas a savings potential <strong>of</strong> 3,899,668 kWh. There was one additional energy management systemE - 6
installed in fiscal year 2004-2005. The savings was calculated at 3,900,000 kWh. The annualbudget for this program is $50,000.7. Efficient Refrigerator Incentives (Cool Rewards Program)<strong>Riverside</strong> Public Utilities <strong>of</strong>fers a rebate for energy efficient refrigerators purchased forresidences when such purchases were made to replace an existing refrigerator. The amount <strong>of</strong> thefinancial incentives <strong>of</strong>fered, ranging from $75 to $100, was based on the ENERGY STAR`Srating <strong>of</strong> at least 20 percent more efficient than a standard refrigerator <strong>of</strong> comparable size. TheRefrigerator Rebate program has since merged with the Energy Star Program. Rebates forrefrigerators can be obtained through the Energy Star Program.The program was approved in December 1998, with active participation beginning in December1999. Target participation is expected to be approximately 1,000 per year. Useful life <strong>of</strong> themeasures installed as part <strong>of</strong> this program is more than 15 years. Projected cumulativekilowatt-hour reductions are based on 150 kWh per participant. Projected cumulative kilowattcapacity reductions are based on 0.2 kW per participant. Participant growth in the program isprojected at around 5 percent a year. The program was stopped at the end <strong>of</strong> fiscal year 2001-2002 and merged into the Energy Star Rebate program. There is no associated budget with thisprogram.TIME PERIODFYPROJECTED CUMULATIVEKW REDUCTIONPROJECTED CUMULATIVEKWh REDUCTION1999-2000 200 150,0002000-2001 210 300,0002001-2002 220 490,0502002-2003 NA NA8. Residential Air Conditioner Replacement Incentives (Cool Cash Program)This program <strong>of</strong>fers incentives to residential customers when they replace older, less efficientcentral air conditioners with new high efficiency units. Rebates ranged from $50 to $90 per tonbased on size and efficiency rating <strong>of</strong> the new units. This program was discontinued on June 30,1996, and started again December 1998. Program guidelines were updated to include financialincentives to participants who installed new high efficient central systems or replaced existinginefficient window units with new high efficiency central systems.Useful life <strong>of</strong> the measures installed as part <strong>of</strong> this program is more than 15 years. Projectedcumulative kilowatt-hour reductions are based on 1.090 kWh per participant. Projectedcumulative kilowatt capacity reductions are based on 1.09 kW per participant. Participant growthin this program is decreasing, while cumulative growth is increasing. The annual budget <strong>of</strong> thisprogram is $180,000.E - 7
TIME PERIODFYPROJECTED CUMULATIVEKW REDUCTIONPROJECTED CUMULATIVEKWh REDUCTION1999-2000 1,090 1,090,0002000-2001 1,145 1,145,0002001-2002 1,569 1,569,0102002-2003 2,096 2,096,5702003-2004 2,695 2,696,0702004-2005 3,231 3,232,3502005-2006 3,490 3,491,7702006-2007 3,779 3,780,6202007-2008 4349 4,347,7132008-2009 5,001 4,999,8692009-2010 5,751 5,749,8502010-2011 6,613 6,612,3272011-2012 7,604 7,604,1769. Low Income Weatherization Program for Electrically Heated Dwellings - (Mandated byCalifornia State Assembly Bill 1601)The utility <strong>of</strong>fers a free service to low-income customers who heat their dwellings withelectricity. Participants receive up to two free water-saving showerheads and a blanket for anelectric water heater. It is estimated that 3,500 customers qualify at any one time for thisprogram. This represents approximately 4 percent <strong>of</strong> the utilities total residential customers.This program began in fiscal year 1996-1997. It is projected that 350 low-income customers willparticipate each fiscal year in this program. Useful life <strong>of</strong> the measures installed as part <strong>of</strong> thisprogram is more than 15 years. Projected cumulative kilowatt-hour reductions are based on 175kWh per participant. There are no associated kilowatt reductions with this strategic conservationprogram. The program was cancelled at the end <strong>of</strong> fiscal year 2001-2002 and there is no longer abudget for this program.TIME PERIODFYPROJECTED CUMULATIVEKW REDUCTIONPROJECTED CUMULATIVEKWh REDUCTION1999-2000 NA 57,7502000-2001 NA 115,5002001-2002 NA 173,2502002-2003 NA NAE - 8
10. Energy Efficient Lighting ProgramThis program <strong>of</strong>fers incentives to commercial / industrial customers when they replace older, lessefficient lighting with high efficiency lighting. The incentive is 5 cents per kilowatt-hour <strong>of</strong>energy savings for one year. This program was approved in December 1998. Through fiscal year2006-2007 there were a total <strong>of</strong> 450 customers who had participated in this program.The energy savings under this program vary because <strong>of</strong> technology and differences in operatinghours. There is a maximum incentive amount <strong>of</strong> $25,000 per customer account. Cumulativekilowatt-hour reduction in this program is projected at upwards <strong>of</strong> 17 percent per year with anannual budget <strong>of</strong> $228,000.TIME PERIODFYPROJECTED CUMULATIVEKW REDUCTIONPROJECTED CUMULATIVEKWh REDUCTION1999-2000 NA 3,500,0002000-2001 NA 3,535,0002001-2002 NA 9,109,7582002-2003 NA 11,923,3362003-2004 NA 11,934,5502004-2005 NA 20,384,7692005-2006 NA 22,062,3652006-2007 NA 26,661,5552007-2008 NA 31,194,0192008-2009 NA 36,497,0022009-2010 NA 42,701,4922010-2011 NA 49,960,7452011-2012 NA 58,454,07111. Outdoor Security Lighting ProgramThis program <strong>of</strong>fers incentives to commercial / industrial customers when they replace older lessefficient outdoor security lighting with high efficiency lighting. The incentives range from $10 -$35 per fixture. This program was cancelled at the end <strong>of</strong> fiscal year 2002-2003 and there is noassociated budget with this program.This program was approved in December 1998. The energy savings vary because <strong>of</strong> technologyand differences in operating hours. The program is based on financial incentives with a goal <strong>of</strong>$50,000 per year. There is a maximum incentive amount <strong>of</strong> $500 per account. Projected energysavings can be estimated by program budget amount ($50,000) divided by financial incentive($35 per 175-watt fixture.)E - 9
TIME PERIODFYPROJECTED CUMULATIVEKW REDUCTIONPROJECTED CUMULATIVEKWh REDUCTION1999-2000 1.75 NA2000-2001 1.87 NA2001-2002 2.04 NA2002-2003 NA NA12. Energy Efficiency for Motors ProgramThis program is intended to promote market transformation, which means to encourage thewidespread use <strong>of</strong> the most energy efficient motors available. Incentives are <strong>of</strong>fered for replacingolder, inefficient motors with equipment that exceeds the federal minimum standards. Rebateamounts range from $35 for a one horsepower motor to $630 for a 200 horsepower motor. Thebudget is $50,000 annually for this program.This program was approved in December 1998. The energy savings vary because <strong>of</strong> technologyand differences in operating hours. The program is based on financial incentives with a goal <strong>of</strong>$75,000 per year. There is a maximum incentive amount <strong>of</strong> $20,000 per account. Cumulativekilowatt-hour reductions are projected to increase by 10 percent per year.TIMEPERIODFYPROJECTED CUMULATIVEKW REDUCTIONPROJECTED CUMULATIVEKWh REDUCTION1999-2000 NA2000-2001 NA2001-2002 NA 6,8402002-2003 NA 13,6802003- 2004 NA 13,6802004- 2005 NA 17,1002005-2006 NA 17,9552006-2007 NA 21,1952007-2008 NA 23,3142008-2009 NA 25,6452009-2010 NA 28,2102010-2011 NA 31,0312011-2012 NA 34,13413. Efficient Cooling Equipment Replacement & Variable Speed / Frequency Motor DrivesThis program <strong>of</strong>fers incentives for cooling equipment replacement and variable speed /frequency motor drives. The program is designed to encourage improvements to equipment thatE - 10
will increase energy efficiency and reduce the energy consumption <strong>of</strong> existing or new equipment.Cooling equipment incentives are for replacing older, inefficient chillers and refrigerationequipment. This closes the gap in cost between standard equipment and high efficiencyequipment. The program target is to issue a minimum <strong>of</strong> $50,000 in incentives for energyimprovements associated with chiller and refrigeration replacements and/or efficiencyimprovements. Variable speed/frequency motor drive incentives are based on the new unit'selectrical energy reduction in relationship to the replaced unit <strong>of</strong> similar size. This is adownstream incentive program that helps reduce the cost <strong>of</strong> new equipment. The anticipatedprogram target is to issue a minimum <strong>of</strong> $50,000 in incentives for energy improvementsassociated with improvements to variable speed/frequency motor drive efficiency.This program was approved in December 1998. The energy savings vary because <strong>of</strong> technologyand differences in operating hours. There is a maximum incentive amount <strong>of</strong> $50,000 peraccount. Participant growth in this program is projected at 1 percent per year. The program wasdiscontinued at the end <strong>of</strong> FY 2004-2005 and there is no associated budget.TIME PERIODFYPROJECTED CUMULATIVEKW REDUCTIONPROJECTED CUMULATIVEKWh REDUCTION1999-2000 NA2000-2001 NA2001-2002 NA 3,4202002-2003 NA 10,2602003- 2004 NA 34,2002004- 2005 NA 878,95414. Energy Star Rebate ProgramThis program <strong>of</strong>fers incentives for buying new high efficiency Energy Star rated products thatuse less electricity than standard units <strong>of</strong> comparable size. The Energy Star Rebate program hasbeen our most popular program through fiscal year 2006-2007 with 27,917 participants total. Theannual budget for this program is $500,000.There was a total participation <strong>of</strong> 9,861 customers in 2001-2002 with rebates totaling$3,339,997. The approximate savings based on the program participation was 3,697,875 kWh.Program growth was 197 percent over the estimated participation. There is no way to determinehow much <strong>of</strong> the 3,339,875 kWh is savings as these were not necessarily replacementappliances. Cumulative kilowatt hour reduction is projected to be increased by 18 percent peryear starting in Fiscal Year 2007-2008.E - 11
TIMEPERIODFYPROJECTED CUMULATIVEKW REDUCTIONPROJECTED CUMULATIVEKWh REDUCTION1999-2000 NA NA2000-2001 NA NA2001-2002 NA 3,697,8752002-2003 NA 5,559,3752003- 2004 NA 7,075,5002004- 2005 NA 8,440,8752005-2006 NA 9,407,6252006-2007 NA 10,468,8752007-2008 NA 12,353,2722008-2009 NA 14,576,8602009-2010 NA 17,200,6942010-2011 NA 20,296,8182011-2012 NA 23,950,24515. Refrigerator / Freezer Recycling ProgramThis program <strong>of</strong>fers incentives to residential customers for recycling old operating refrigeratorsand stand-alone freezers picked up and transported to a recycling facility for dismantling andprocessing.This program began in April 2000. Target projections are estimated to be 500 participantsannually. The projected kW demand is based on kWh reduction divided by annual operatinghours (8,760). Projected cumulative kilowatt-hour reductions are based on 1,656 kWh perparticipant, based on similar programs. Participant growth in the program is projected at around3 percent a year with an annual budget <strong>of</strong> $150,000.TIMEPERIOD(FY)PROJECTED CUMULATIVEKW REDUCTIONPROJECTED CUMULATIVEKWh REDUCTION1999-2000 189 1,656,0002000-2001 198 1,738,8002001-2002 208 1,977,2642002-2003 217 1,986,2482003-2004 227 2,064,5482004-2005 238 2,167,5982005-2006 242 2,203,4482006-2007 245 2,230,8982007-2008 252 2,297,8242008-2009 259 2,366,759E - 12
2009-2010 266 2,437,7622010-2011 273 2,510,8952011-2012 280 2,586,221E - 13
<strong>City</strong> <strong>of</strong> <strong>Riverside</strong>Public Utilities Department - Resources Division2008 <strong>Power</strong> SupplyIntegrated Resource PlanAppendix FAcronyms and Industry TermsASBPABTUCECCAISOCARBCDWRCO 2CPUCCRRAncillary Services: Services required as a function <strong>of</strong> transmitting energy. Theseservices include Operating Reserves (Spinning and Non-Spinning Reserves),Regulation (Up and Down).The Bonneville <strong>Power</strong> <strong>Administration</strong>: A federal power marketing agencylocated in the Pacific Northwest and responsible for the marketing and operation<strong>of</strong> the federal government’s Columbia River hydroelectric and transmissionsystem.British Thermal Unit: A unit <strong>of</strong> measure for the quantity <strong>of</strong> heat required to raisethe temperature <strong>of</strong> one pound <strong>of</strong> water from 60° to 61°F at a constant pressure <strong>of</strong>one atmosphere. In the power industry, this term is typically used to expressquantities <strong>of</strong> natural gas. See MMBTU.The California Energy Commission.The California Independent System Operator.The California Air Resources Board.The California Department <strong>of</strong> Water Resources.Carbon Dioxide: The greenhouse gas <strong>of</strong> primary concern in California andincluded in the Kyoto Protocol’s “basket” <strong>of</strong> emissions along with methane(CH 4 ), nitrous oxide (N 2 O), hydr<strong>of</strong>luorocarbons (HFCs), perfluorocarbons(PFCs), and sulfur hexafluoride (SF 6 ).The California Public Utilities Commission.Congestion Revenue Right: Financial instruments, expressed in 1 MWincrements, made available by the CAISO for purchase by market participants andintended to provide a hedge against the risk <strong>of</strong> congestion costs. In effect, CRRsF - 1
act as a form <strong>of</strong> insurance that pays the CRR holder when congestion costs areincurred.CYDCDSMEIAEPSFERCFYGEDGHGGWhHRSGIPPIRPkWhLCCalendar Year.Direct Current.Demand-side Management.The federal government’s Energy Information <strong>Administration</strong>.The Emissions Performance Standard established through the passage <strong>of</strong> SenateBill 1368.The Federal Energy Regulatory Commission.Fiscal Year.Global Energy Decisions, Inc.: The developer <strong>of</strong> Planning and Risk (”PAR”),RPU’s production cost model application used for the economic analysis <strong>of</strong>resources under differing market conditions.Greenhouse Gas: Defined in the Kyoto Protocol “basket” <strong>of</strong> emissions as carbondioxide (CO 2 ), methane (CH 4 ), nitrous oxide (N 2 O), hydr<strong>of</strong>luorocarbons (HFCs),perfluorocarbons (PFCs), and sulfur hexafluoride (SF 6 ).Gigawatt-hour: One thousand megawatt-hours <strong>of</strong> energy.Heat Recovery Steam Generator: A boiler producing steam by using the heatedexhaust gasses from a gas turbine. The steam produced by a HRSG is typicallyused to drive a steam turbine-generator in a combined cycle generating unitconfiguration.The Intermountain <strong>Power</strong> Project: The two coal-fired generating units nominallyrated at 900 MW each and located near Delta, Utah, with associated switchyardfacilities. <strong>Riverside</strong> holds a 7.617% ownership-like interest in this project.Integrated Resource Plan: Through the analysis and integration <strong>of</strong> supply- anddemand-side options, a plan developed for the future supply <strong>of</strong> energy to serveprojected customer requirements over a selected time horizon.Kilowatt-hour: One thousand watt-hours <strong>of</strong> energy.Local Capacity Requirement: The requirement imposed by the CAISO providingthat Load Serving Entities supply physical generating capacity in a designationportion <strong>of</strong> the ISO Controlled Grid to support reliable grid operations. LoadF - 2
Serving Entities not providing their proportionate amount <strong>of</strong> Local Capacity arecharged by the CAISO for procurement <strong>of</strong> such capacity on the Load ServingEntity’s behalf.LMPLSEMMBTUMRTUMWMWhNERCNTSPG&EPTOPVNGSLocational Marginal Pricing: The real-time calculation <strong>of</strong> marginal prices atdiscrete “nodes” within a transmission system.Load Serving Entity: An entity operating within the CAISO’s markets andresponsible for serving end use customer requirements.One million British Thermal Units. See BTU.Market Redesign and Technology Upgrade: The CAISO’s redesign <strong>of</strong> itsmarkets. Originally referred to Market Design 2002, the process <strong>of</strong> updating theCAISO’s systems, processes and procedures to accommodate a drastic revision inmarket operations.Megawatt: One thousand kilowatts. One MW is typically estimated to besufficient for the instantaneous demand <strong>of</strong> 750 retail customers.Megawatt-hour: One thousand kilowatt-hours. One MWh is typically estimatedto be sufficient for the supply <strong>of</strong> energy 750 retail customers for one hour.The North American Electric Reliability Corporation: The entity imbued by theFERC with responsibility for promulgating and enforcing electric reliabilitypolicies and standards.The Northern Transmission System: Together, the two 345 kV transmission linesbetween the Intermountain <strong>Power</strong> Project and the Mona Substation and the one230 kV line extending between the Intermountain <strong>Power</strong> Project and the GonderSubstation.The Pacific Gas & Electric Company: The largest California investor-ownedutility based in San Francisco and providing natural gas and electric services.Participating Transmission Owner: A holder <strong>of</strong> transmission facilities orentitlements that has transferred Operational Control <strong>of</strong> those facilities andentitlements to the CAISO in return for reimbursement <strong>of</strong> their annualtransmission revenue requirement.The Palo Verde Nuclear Generating Station: The three-unit nuclear generatingstation having a combined capacity <strong>of</strong> approximately 3,660 MW and located 50miles west <strong>of</strong> Phoenix, Arizona. RPU’s entitlement to power from this facilitytotals 12 MW.F - 3
RARERCRPSSCAQMDSCESDG&ESONGSSPRINGSSTSVARWECCResource Adequacy: The requirement imposed by the CAISO and requiring thatLSEs procure an amount <strong>of</strong> capacity equal to the LSE’s projected peak demand,plus and reserve amount equal to 15% <strong>of</strong> such projected peak demand.The <strong>Riverside</strong> Energy Resource Center, where <strong>Riverside</strong>’s two 49 MW simplecyclegenerating units are located.Renewable Portfolio Standard: A standard for the procurement <strong>of</strong> renewableenergy to serve retail customer requirements. <strong>Riverside</strong>’s currently-adopted RPSgoals are 20% <strong>of</strong> retail customer requirements by 2010, 25% by 2015, and 33%by 2020.The South Coast Air Quality Management District.The Southern California Edison Company: The second largest Californiainvestor-owned utility based in Rosemead and providing electric services.The San Diego Gas and Electric Company: The third largest California investorownedutility based in San Diego and providing natural gas and electric services.The San On<strong>of</strong>re Nuclear Generating Station: The two-unit nuclear generatingstation having a combined capacity <strong>of</strong> approximately 2,200 MW and near SanClemente, California. RPU’s entitlement to power from this facility totals 40MW.<strong>Riverside</strong>’s four 10 MW simple-cycle gas turbine driven internal generating units.The Southern Transmission System: The + 500 KV DC transmission lineextending between the Intermountain <strong>Power</strong> Project and the Los AngelesDepartment <strong>of</strong> Water and <strong>Power</strong>’s Adelanto Switching Station.Value-At-Risk: The calculated cost <strong>of</strong> meeting future energy needs if those needswere met at current forward market prices.The <strong>Western</strong> Electricity Coordinating Council: Under the direction <strong>of</strong> the NERC,the Regional Reliability Council responsible for promulgating and enforcing itsown system reliability policies and standards, and for enforcing those <strong>of</strong> theNERC.F - 4