Waves in Non-Neutral Plasmas - Nonneutral Plasma Group
Waves in Non-Neutral Plasmas - Nonneutral Plasma Group
Waves in Non-Neutral Plasmas - Nonneutral Plasma Group

You also want an ePaper? Increase the reach of your titles
YUMPU automatically turns print PDFs into web optimized ePapers that Google loves.
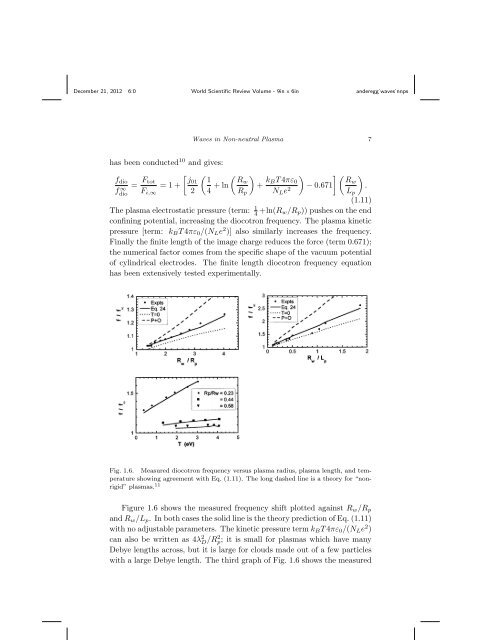
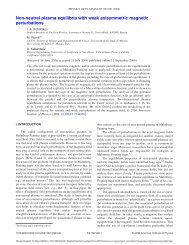
December 21, 2012 6:0 World Scientific Review Volume - 9<strong>in</strong> x 6<strong>in</strong> anderegg˙waves˙nnps<strong>Waves</strong> <strong>in</strong> <strong>Non</strong>-neutral <strong>Plasma</strong> 7has been conducted 10 and gives:f diofdio∞ = F [ ( ( )tot j01 1= 1 +F i,∞ 2 4 + ln Rw+ k ) ] ( )BT 4πε 0RwR p N L e 2 − 0.671 .L p(1.11)The plasma electrostatic pressure (term: 1 4 +ln(R w/R p )) pushes on the endconf<strong>in</strong><strong>in</strong>g potential, <strong>in</strong>creas<strong>in</strong>g the diocotron frequency. The plasma k<strong>in</strong>eticpressure [term: k B T 4πε 0 /(N L e 2 )] also similarly <strong>in</strong>creases the frequency.F<strong>in</strong>ally the f<strong>in</strong>ite length of the image charge reduces the force (term 0.671);the numerical factor comes from the specific shape of the vacuum potentialof cyl<strong>in</strong>drical electrodes. The f<strong>in</strong>ite length diocotron frequency equationhas been extensively tested experimentally.Fig. 1.6. Measured diocotron frequency versus plasma radius, plasma length, and temperatureshow<strong>in</strong>g agreement with Eq. (1.11). The long dashed l<strong>in</strong>e is a theory for “nonrigid”plasmas. 11Figure 1.6 shows the measured frequency shift plotted aga<strong>in</strong>st R w /R pand R w /L p . In both cases the solid l<strong>in</strong>e is the theory prediction of Eq. (1.11)with no adjustable parameters. The k<strong>in</strong>etic pressure term k B T 4πε 0 /(N L e 2 )can also be written as 4λ 2 D /R2 p; it is small for plasmas which have manyDebye lengths across, but it is large for clouds made out of a few particleswith a large Debye length. The third graph of Fig. 1.6 shows the measured
![WORKSHOP PARTICIPANTS LIST [pdf] - UC San Diego](https://img.yumpu.com/35298899/1/190x245/workshop-participants-list-pdf-uc-san-diego.jpg?quality=85)