Asia Pacific Office Market Overview - Colliers
Asia Pacific Office Market Overview - Colliers
Asia Pacific Office Market Overview - Colliers

You also want an ePaper? Increase the reach of your titles
YUMPU automatically turns print PDFs into web optimized ePapers that Google loves.
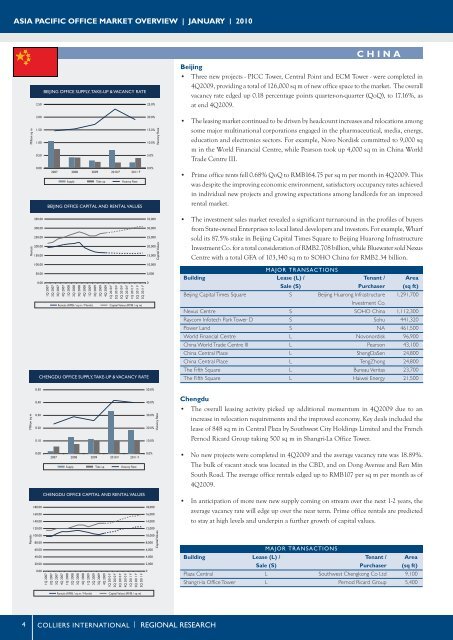
ASIA PACIFIC OFFICE MARKET OVERVIEW | JANUARY | 2010CHINA2.50BEIJING OFFICE SUPPLY, TAKE-UP & VACANCY RATE25.0%Beijing• Three new projects - PICC Tower, Central Point and ECM Tower - were completed in4Q2009, providing a total of 126,000 sq m of new office space to the market. The overallvacancy rate edged up 0.18 percentage points quarter-on-quarter (QoQ), to 17.16%, asat end 4Q2009.Million sq m2.001.501.000.5020.0%15.0%10.0%5.0%Vacancy Rate• The leasing market continued to be driven by headcount increases and relocations amongsome major multinational corporations engaged in the pharmaceutical, media, energy,education and electronics sectors. For example, Novo Nordisk committed to 9,000 sqm in the World Financial Centre, while Pearson took up 4,000 sq m in China WorldTrade Centre III.0.002007 2008 2009 2010 F 2011 FSupply Take up Vacancy RateBEIJING OFFICE CAPITAL AND RENTAL VALUES0.0%• Prime office rents fell 0.68% QoQ to RMB164.75 per sq m per month in 4Q2009. Thiswas despite the improving economic environment, satisfactory occupancy rates achievedin individual new projects and growing expectations among landlords for an improvedrental market.Rentals350.00300.00250.00200.00150.00100.0050.000.001Q 20072Q 20073Q 20074Q 20071Q 20082Q 20083Q 20084Q 20081Q 20092Q 20093Q 20094Q 20091Q 2010 F2Q 2010 F3Q 2010 F4Q 2010 F1Q 2011 F2Q 2011 F3Q 2011 FRentals (RMB / sq m / Month) Capital Values (RMB / sq m)CHENGDU OFFICE SUPPLY, TAKE-UP & VACANCY RATE35,00030,00025,00020,00015,00010,0005,0000Capital Values• The investment sales market revealed a significant turnaround in the profiles of buyersfrom State-owned Enterprises to local listed developers and investors. For example, Wharfsold its 87.5% stake in Beijing Capital Times Square to Beijing Huarong InfrastructureInvestment Co. for a total consideration of RMB2.708 billion, while Bluewater sold NexusCentre with a total GFA of 103,340 sq m to SOHO China for RMB2.34 billion.MAJOR TRANSACTIONSBuilding Lease (L) / Tenant / AreaSale (S) Purchaser (sq ft)Beijing Capital Times Square S Beijing Huarong Infrastructure 1,291,700Investment Co.Nexus Centre S SOHO China 1,112,300Raycom Infotech Park Tower D S Sohu 441,320Power Land S NA 461,500World Financial Centre L Novonordisk 96,900China World Trade Centre III L Pearson 43,100China Central Place L ShengDaSen 24,800China Central Place L TengZhong 24,800The Fifth Square L Bureau Veritas 23,700The Fifth Square L Haiwei Energy 21,5000.5050.0%Million sq m0.400.300.200.1040.0%30.0%20.0%10.0%Vacancy RateChengdu• The overall leasing activity picked up additional momentum in 4Q2009 due to anincrease in relocation requirements and the improved economy. Key deals included thelease of 848 sq m in Central Plaza by Southwest City Holdings Limited and the FrenchPernod Ricard Group taking 500 sq m in Shangri-La <strong>Office</strong> Tower.0.002007 2008 2009 2010 F 2011 FSupply Take up Vacancy Rate0.0%• No new projects were completed in 4Q2009 and the average vacancy rate was 18.89%.The bulk of vacant stock was located in the CBD, and on Dong Avenue and Ren MinSouth Road. The average office rentals edged up to RMB107 per sq m per month as of4Q2009.Rentals180.00160.00140.00120.00100.0080.0060.0040.0020.000.00CHENGDU OFFICE CAPITAL AND RENTAL VALUES1Q 20072Q 20073Q 20074Q 20071Q 20082Q 20083Q 20084Q 20081Q 20092Q 20093Q 20094Q 20091Q 2010 F2Q 2010 F3Q 2010 F4Q 2010 F1Q 2011 F2Q 2011 F3Q 2011 F18,00016,00014,00012,00010,0008,0006,0004,0002,0000Capital Values• In anticipation of more new new supply coming on stream over the next 1-2 years, theaverage vacancy rate will edge up over the near term. Prime office rentals are predictedto stay at high levels and underpin a further growth of capital values.MAJOR TRANSACTIONSBuilding Lease (L) / Tenant / AreaSale (S) Purchaser (sq ft)Plaza Central L Southwest Chengkong Co Ltd 9,100Shangri-la Offi ce Tower L Pernod Ricard Group 5,400Rentals (RMB / sq m / Month) Capital Values (RMB / sq m)4COLLIERS INTERNATIONAL | REGIONAL RESEARCH