Asia Pacific Office Market Overview - Colliers
Asia Pacific Office Market Overview - Colliers
Asia Pacific Office Market Overview - Colliers

Create successful ePaper yourself
Turn your PDF publications into a flip-book with our unique Google optimized e-Paper software.
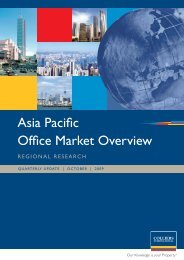
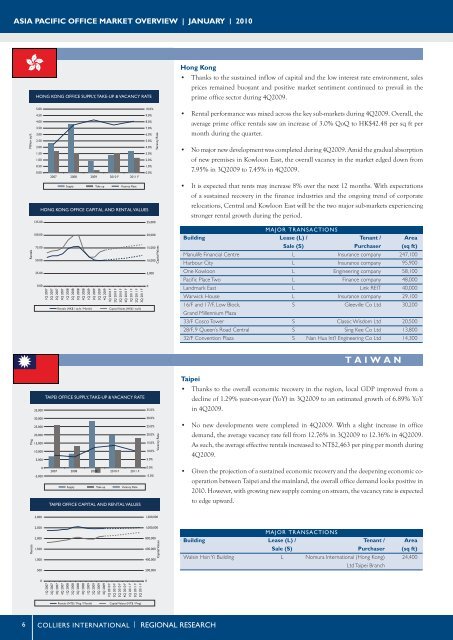
ASIA PACIFIC OFFICE MARKET OVERVIEW | JANUARY | 2010Million sq ftRentalsHONG KONG OFFICE SUPPLY, TAKE-UP & VACANCY RATE5.0010.0%4.509.0%4.008.0%3.507.0%3.006.0%2.505.0%2.004.0%1.503.0%1.002.0%0.501.0%0.000.0%2007 2008 2009 2010 F 2011 FSupply Take up Vacancy RateHONG KONG OFFICE CAPITAL AND RENTAL VALUES125.00100.0075.0050.001Q 20072Q 20073Q 20074Q 20071Q 20082Q 20083Q 20084Q 20081Q 20092Q 20093Q 20094Q 20091Q 2010 F2Q 2010 F3Q 2010 F4Q 2010 F1Q 2011 F2Q 2011 F3Q 2011 FRentals (HK$ / sq ft / Month)Capital Values (HK$ / sq ft)25,00020,00015,00010,00025.005,0000.000Vacancy RateCapital ValuesHong Kong• Thanks to the sustained inflow of capital and the low interest rate environment, salesprices remained buoyant and positive market sentiment continued to prevail in theprime office sector during 4Q2009.• Rental performance was mixed across the key sub-markets during 4Q2009. Overall, theaverage prime office rentals saw an increase of 3.0% QoQ to HK$42.48 per sq ft permonth during the quarter.• No major new development was completed during 4Q2009. Amid the gradual absorptionof new premises in Kowloon East, the overall vacancy in the market edged down from7.95% in 3Q2009 to 7.45% in 4Q2009.• It is expected that rents may increase 8% over the next 12 months. With expectationsof a sustained recovery in the finance industries and the ongoing trend of corporaterelocations, Central and Kowloon East will be the two major sub-markets experiencingstronger rental growth during the period.MAJOR TRANSACTIONSBuilding Lease (L) / Tenant / AreaSale (S) Purchaser (sq ft)Manulife Financial Centre L Insurance company 247,100Harbour City L Insurance company 95,900One Kowloon L Engineering company 58,100Pacifi c Place Two L Finance company 48,000Landmark East L Link REIT 40,000Warwick House L Insurance company 29,10016/F and 17/F, Low Block, S Gleeville Co Ltd 30,200Grand Millennium Plaza33/F Cosco Tower S Classic Wisdom Ltd 20,50028/F, 9 Queen’s Road Central S Sing Kee Co Ltd 13,80032/F Convention Plaza S Nan Hua Int’l Engineering Co Ltd 14,300TAIWAN35,000TAIPEI OFFICE SUPPLY, TAKE-UP & VACANCY RATE35.0%Taipei• Thanks to the overall economic recovery in the region, local GDP improved from adecline of 1.29% year-on-year (YoY) in 3Q2009 to an estimated growth of 6.89% YoYin 4Q2009.Ping30,00025,00020,00015,00010,0005,00030.0%25.0%20.0%15.0%10.0%5.0%Vacancy Rate• No new developments were completed in 4Q2009. With a slight increase in officedemand, the average vacancy rate fell from 12.76% in 3Q2009 to 12.36% in 4Q2009.As such, the average effective rentals increased to NT$2,463 per ping per month during4Q2009.0-5,0002007 2008 2009 2010 F 2011 FSupply Take up Vacancy RateTAIPEI OFFICE CAPITAL AND RENTAL VALUES0.0%-5.0%• Given the projection of a sustained economic recovery and the deepening economic cooperationbetween Taipei and the mainland, the overall office demand looks positive in2010. However, with growing new supply coming on stream, the vacancy rate is expectedto edge upward.3,0001,200,000Rentals2,5002,0001,5001,0005001,000,000800,000600,000400,000200,000Capital ValuesMAJOR TRANSACTIONSBuilding Lease (L) / Tenant / AreaSale (S) Purchaser (sq ft)Walsin Hsin Yi Building L Nomura International (Hong Kong) 24,400Ltd Taipei Branch01Q 20072Q 20073Q 20074Q 20071Q 20082Q 20083Q 20084Q 20081Q 20092Q 20093Q 20094Q 20091Q 2010 F2Q 2010 F3Q 2010 F4Q 2010 F1Q 2011 F2Q 2011 F3Q 2011 F0Rentals (NT$ / Ping / Month)Capital Values (NT$ / Ping)6COLLIERS INTERNATIONAL | REGIONAL RESEARCH