Leading the way - SMART PDF - An online viewer for PDF documents
Leading the way - SMART PDF - An online viewer for PDF documents
Leading the way - SMART PDF - An online viewer for PDF documents

Create successful ePaper yourself
Turn your PDF publications into a flip-book with our unique Google optimized e-Paper software.
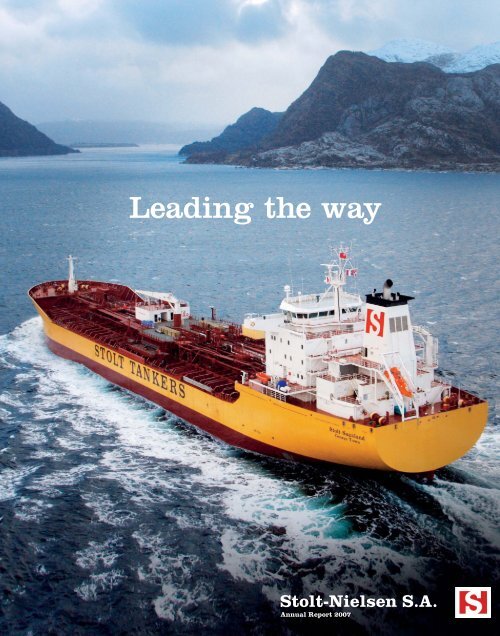
<strong>Leading</strong> <strong>the</strong> <strong>way</strong>Stolt-Nielsen S.A.<strong>An</strong>nual Report 2007
Financial Highlights (in millions, except per share data) 2007 2006 2005Operating revenue $1,759 $1,565 $1,624Operating income $193 $166 $175Net income $216 $200 $483Net income per shareBasic $3.63 $3.21 $7.45Diluted $3.60 $3.17 $7.29Weighted average number of common sharesand common share equivalents outstandingBasic 59.5 62.2 64.9Diluted 60.1 62.9 66.2Operating Revenue*U.S.$ Millions0506071,6241,5651,7592007 Operating Revenue by BusinessU.S.$ Millions1,190 Tankers103 Terminals391 Tank Containers69 Stolt Sea Farm6 Corporate and o<strong>the</strong>rAssetsU.S.$ Millions0506072,2192,5142,4762007 Assets by BusinessU.S.$ Millions1,659 Tankers432 Terminals224 Tank Containers69 Stolt Sea Farm92 Corporate and o<strong>the</strong>rOperating Income*U.S.$ Millions0506071661751932007 Operating Income by Business (a)U.S.$ Millions119 Tankers39 Terminals46 Tank Containers24 Stolt Sea Farma) Excluding Corporate and O<strong>the</strong>r (35)* In <strong>the</strong> 2007 Financial Statements <strong>the</strong> Tuna business has been reclassified as Discontinued Operations (Note 10)ContentsOur BusinessIFC Financial Highlights1 Chairman's Statement2 Group Overview4 Chief Executive Officer's Review8 Stolt Tankers & Terminals12 Stolt Tank Containers14 Stolt Sea Farm16 Stolt-Nielsen Gas, Stolt Bitumen Services18 Board of Directors20 Corporate Governance24 Financial ReviewFinancial Statements34 Independent Auditors’ Report35 Consolidated Statements of Operations37 Consolidated Balance Sheets38 Consolidated Statements of Shareholders’ Equity40 Consolidated Statements of Cash Flows42 Notes to Consolidated Financial StatementsShareholder In<strong>for</strong>mation76 Shareholder In<strong>for</strong>mationIBC Offices and Facilities
Where we operateOur BusinessOfficesTrading RoutesHighlightsOperating Income(Excluding $35 million loss in Corporate and O<strong>the</strong>r)Outlook> Over 70 deep-sea parcel tankers, totalling2.2 million dwt> More than 80 coastal and inland tankers> 28 parcel tanker newbuilding programme> 1.9 million cubic metres of storage capacity> More than 330 railroad tank carsStolt Tankers & Terminals69% Stolt Tankers & Terminals31% Rest of GroupAlthough <strong>the</strong> supply and demand remains inbalance, a significant newbuilding orderbook,coupled with concerns of economic slowdown,may cause oversupply. However, continuedgrowth in developing countries will provideunderlying support.> Over 21,000 tank containers, includingmore than 1,200 food-grade andbitumen containers> 11 tank cleaning and repair facilities> Integrated in<strong>for</strong>mation system <strong>for</strong>scheduling and tracking close to 88,000movements annually> Provides Flexibag services worldwideStolt Tank Containers20% Stolt Tank Containers80% Rest of GroupStrong global trade is a driver of STC’s resultsand will support our continued growth.Despite concerns about a U.S. recession, supplyand demand outlooks are favourable, drivenlargely by strong growth in China, North Asia,and <strong>the</strong> Middle East.<strong>An</strong>nual production:> 4,000 tonnes of turbot> 50 tonnes of sole> 250 tonnes of sturgeon> 10 tonnes of caviarStolt Sea Farm11% Stolt Sea Farm89% Rest of GroupWorldwide competition is expected to increaseas fish stocks at new farms reach maturity in2008. However, Stolt Sea Farm's position as <strong>the</strong>world's leading international producer givesSSF <strong>the</strong> scale to guarantee a consistent andreliable supply to our customers.Stolt-Nielsen <strong>An</strong>nual Report 20073
Chief Executive Officer’s ReviewNiels G. Stolt-Nielsen, Chief Executive OfficerAll divisions of <strong>the</strong> Company produced strong operationalresults in 2007.Solid per<strong>for</strong>mances in our parcel tanker, terminaland tank container operations reflected <strong>the</strong> continuedstrength of <strong>the</strong> worldwide market <strong>for</strong> bulk-liquidtransportation and storage services. Stolt Sea Farm(SSF) had a record year, and continues to lead <strong>the</strong>industry in <strong>the</strong> farming of turbot, sole and sturgeon.For <strong>the</strong> full year ended November 30, 2007, SNSAreported net income of $216.4 million, compared withnet income of $199.9 million a year ago. Earnings pershare were $3.60, compared with $3.17 in 2006.Results <strong>for</strong> 2007 included gains of $42.4 million and$21.8 million on <strong>the</strong> sale of SSF’s bluefin tunabusiness and SNSA’s 25% ownership of MarineHarvest, respectively.Growth in earnings <strong>for</strong> <strong>the</strong> year was held down,however, by rising operating costs, especially bunkerfuel and manning expenses. Costs related to litigationand <strong>the</strong> antitrust case in <strong>the</strong> U.S.—now successfullyconcluded—were $40.8 million <strong>for</strong> <strong>the</strong> year.2007 was an ambitious and productive year <strong>for</strong> SNSA.In July we announced changes in our organizationalstructure aimed at enhancing our efficiencycompany-wide. The changes, which took effect inDecember, included <strong>the</strong> separation of Stolt-NielsenTransportation Group (SNTG) into two businessunits: Stolt Tankers & Terminals (ST&T) and StoltTank Containers (STC). The new structure enablesST&T to focus on <strong>the</strong> increased strategic developmentof global operational synergies between <strong>the</strong> tankersand terminals businesses, while STC benefits fromgreater independence to pursue growth in keymarkets worldwide.The reorganization included <strong>the</strong> creation of a singleSNSA corporate shared-services structure thatcombines Human Resources, In<strong>for</strong>mation Technologyand Finance under <strong>the</strong> SNSA umbrella. This newstructure ensures <strong>the</strong> deployment of commonstandards and best practices throughout ouroperations worldwide.As part of our growth strategy, we announcedplans to explore opportunities in two new shippingmarkets. In August, we entered <strong>the</strong> Asian bitumenmarket by agreeing to acquire two 5,900 deadweightton (dwt) bitumen tanker newbuildings—withoptions <strong>for</strong> four more—from Xinshun Shipyardin China. Our investment in <strong>the</strong>se new, superiorper<strong>for</strong>mance tankers represents an importantexpansion of our business in a region where wehave long been a leader in <strong>the</strong> chemicaltransportation market.Also in August, SNSA established Stolt-NielsenGas AS to explore opportunities in <strong>the</strong> liquefiedpetroleum gas (LPG) logistics business.Though both markets are new to SNSA, we believeour substantial expertise and experience in chemicaltransportation, combined with our global customerbase, represent significant advantages that canbe effectively leveraged to penetrate each of <strong>the</strong>seattractive and complementary markets.During <strong>the</strong> year SNSA pressed <strong>for</strong>ward with <strong>the</strong>most ambitious newbuilding programme in itshistory. In April we announced an agreement toacquire four 43,000 dwt parcel tankers from SLSShipbuilding Co. Ltd. in South Korea. This brought<strong>the</strong> total number of deep-sea parcel tankers on orderto 18, representing 780,000 combined dwt from bothSLS Shipbuilding Co. Ltd. in South Korea and AkerYards Florø in Nor<strong>way</strong>. The first of <strong>the</strong> newbuildings—M/T Stolt Sagaland—was delivered in February2008 from Aker Yards Florø in Nor<strong>way</strong>. The lastof <strong>the</strong> 18 ships now on order is scheduled <strong>for</strong> deliveryin 2012. These newbuildings—14 of which aresophisticated part stainless/part coated sisterships—will give our deep-sea fleet advantages in termsof flexibility and interchangeability of equipment,parts, systems, crews and even <strong>the</strong> ships <strong>the</strong>mselves.Our current capital investment programme of $1.8billion underscores SNSA’s commitment to <strong>the</strong>ongoing enhancement of its global fleet and terminalnetwork, as well as <strong>the</strong> continued growth of <strong>the</strong>Company’s tank container business—already <strong>the</strong>world’s largest. We also continue to invest in <strong>the</strong>future of SSF and <strong>the</strong> developmentof exciting new and innovative technologyin aquaculture.Stolt Tankers, Stolthaven Terminals, Stolt Tank ContainersStolt Tankers reported operating income of $119.2million in 2007, compared with operating incomeof $130.0 million in 2006. While operating costsrose sharply, <strong>the</strong> market <strong>for</strong> tanker servicesremained robust in 2007. Results from <strong>the</strong>4 www.stolt-nielsen.com
Company’s regional fleets—particularly in Europeand Asia—were particularly strong. For <strong>the</strong> full year,renewals on Contracts of Affreightment <strong>for</strong> StoltTankers Joint Service (STJS) increased by an averageof 8.9% from last year.Demand <strong>for</strong> transportation services was drivenby <strong>the</strong> same major factors that we have identifiedin recent years: continued economic growth at <strong>the</strong>world level, China’s sustained expansion, <strong>the</strong>continued growth of <strong>the</strong> Middle East Gulf as a majorsource of commodity chemicals, and <strong>the</strong> ongoinggrowth of <strong>the</strong> o<strong>the</strong>r so-called BRIC nations—Brazil,Russia and India.As a result of <strong>the</strong> year-end 2007 surge in bunkerprices, fuel expenses have now surpassed debt serviceas <strong>the</strong> single highest cost per ship. In consequenceof this upward trend, Stolt Tankers initiated in 2005an energy management research project aimed atfinding <strong>way</strong>s to reduce fuel consumption. Resultsof <strong>the</strong> research have identified a number of bothinnovative and practical solutions that are currentlyei<strong>the</strong>r being tested or deployed to <strong>the</strong> fleet.Stolthaven Terminals reported operating incomeof $39.4 million in 2007, up from $30.0 millionin 2006. Stolthaven had a good year, with strongresults from its joint-venture terminals in Ulsan,South Korea, Westport, Malaysia and <strong>An</strong>twerp,Belgium. Stolthaven Houston, <strong>the</strong> Company’s largestwholly owned and most profitable terminal, reportedrecord results in 2007.During <strong>the</strong> year, Stolthaven focused on <strong>the</strong>development of its greenfield terminal projectsin Tianjin and Ningbo, China. At year end, morethan 30 tanks were under construction at Tianjinand discussions were under<strong>way</strong> to securecommitments from customers. At Ningbo, sitepreparation, including blasting and earthmovingwork, continues along with site planning andwill add substantially to our existing portfolioof service capabilities in Asia.Work continues on achieving competitive advantageby optimizing <strong>the</strong> ship-terminal interface. Our new50% interest in Oiltanking Stolthaven <strong>An</strong>twerp, amajor specialty chemical, clean petroleum productsand gas hub serving <strong>the</strong> <strong>An</strong>twerp-Rotterdam-Amsterdam region, is ano<strong>the</strong>r addition to ourterminal network, which will help us consolidate ourcustomers to fewer terminals, so that we reduce <strong>the</strong>amount of time our ships spend in port.Stolthaven Houston also serves as <strong>the</strong> Company’smain site <strong>for</strong> terminal innovations and trainingservices <strong>for</strong> personnel <strong>for</strong> <strong>the</strong> new Stolthaventerminals in emerging markets.Stolt Tank Containers (STC) reported operatingincome of $46.0 million in 2007, up from $43.1million in 2006. Despite higher fuel costs, <strong>the</strong> weakerdollar and increased operating expenses, STC alsohad a good year, underscoring <strong>the</strong> fundamentalstrength of its markets worldwide and its increasedpenetration of China, where STC now operates depotsOur BusinessOur MarketsThe global transportation markets served by SNSAcontinue to be redefined by fundamental structuralshifts in worldwide supply and demand. China hasemerged—in a remarkably short period of time—as bothone of <strong>the</strong> world’s leading producers and consumers ofchemicals. At <strong>the</strong> same time, production of commoditychemicals used as feedstock in chemical manufacturingprocesses is accelerating in <strong>the</strong> Middle East, asmanufacturers seek to capitalize on lower-cost rawmaterials in <strong>the</strong> region. The trends have made China and<strong>the</strong> Middle East natural trading partners. Overall activityin <strong>the</strong> region is fur<strong>the</strong>r fuelled by India’s continuedeconomic ascension.SNSA’s strategic planning ef<strong>for</strong>ts over <strong>the</strong> past decadehave focused intently on positioning <strong>the</strong> Company tocapitalize on <strong>the</strong>se trends.SNSA opened its first office in <strong>the</strong> Middle East in 1993,in order to begin <strong>the</strong> process of building <strong>the</strong> relationshipsthat are essential to conducting business successfully<strong>the</strong>re. Likewise, <strong>the</strong> Company established its first officein China in 1994.These long-term investments are now beginning topay dividends. Stolthaven’s two new state-of-<strong>the</strong>-artchemical terminals—now under construction in Tianjin andin Ningbo—will enable our customers to benefit from fastship turnaround times and access to key local markets.Our Stoltchem joint venture cabotage fleet in China willcomplement <strong>the</strong>se facilities by providing locally <strong>the</strong> samelevel of high quality service as our deep-sea fleet.STC has also aggressively invested in China, and nowoperates container depots in Nanhui, Shanghai and Tianjin.STC’s operations are complemented by Shanghai Stolt-Kingman Tank Containers, a joint venture providingdomestic bulk-liquid distribution services.The long-term outlook <strong>for</strong> SNSA’s most dynamic growthmarkets—and our positioning within those markets—remains positive.For more in<strong>for</strong>mation visitwww.stolt-nielsen.com/Investor-RelationsStolt-Nielsen <strong>An</strong>nual Report 20075
Chief Executive’sReview continuedin Shanghai, Tianjin and Nanhui. Results alsoreflected STC’s ongoing development of food-gradeoperations, and its entry into <strong>the</strong> Flexibag andbitumen markets.STC expanded its fleet in 2007 with <strong>the</strong> additionof 1,900 newbuildings. The division currentlyoperates and trades a fleet of more than 21,000tank containers.During 2007, STC was recertified under <strong>the</strong> ISOguidelines and obtained Safety and QualityAssessment Systems (SQAS) results <strong>for</strong> its Le Havreand Rotterdam offices as part of ChemicalDistribution Institute’s Marine Packed Cargoinitiative. STC is in <strong>the</strong> process of obtainingadditional scores <strong>for</strong> o<strong>the</strong>r offices in 2008.STC continues to work with both its customers andvendors on innovative new systems to streamlineand optimize processes, with a goal of supplying<strong>the</strong> lowest-cost service possible, while delivering<strong>the</strong> highest levels of customer service andsatisfaction in <strong>the</strong> marketplace.Stolt Sea FarmStolt Sea Farm reported full-year operatingrevenue of $69.5 million and operating incomeof $24.3 million, compared with operating revenue of$49.0 million and operating income of $13.5 milliona year ago.SSF’s excellent per<strong>for</strong>mance in 2007 reflected strongdemand and high market prices <strong>for</strong> Sea Farm’sturbot. The sturgeon and caviar business has alsoenjoyed a good year. Ef<strong>for</strong>ts are continuing to findnew locations to farm turbot and sole.SSF’s strategic focus on turbot, sole, sturgeon andcaviar production, all technologically challengingoperations, has proven to be a successful approachdue to <strong>the</strong> high barriers of entry.Dividend and Employee Incentive PlansSNSA voluntarily delisted its shares on Nasdaq andterminated its American Depositary Receipt programin 2007. SNSA’s primary listing will be on <strong>the</strong> OsloStock Exchange (OSE) after SEC deregistration,expected in May of 2008. The Board of Directorsmade <strong>the</strong> decision to delist after determining that<strong>the</strong> benefits of trading on Nasdaq—which accounted<strong>for</strong> less than 10% of SNSA’s worldwide trading volume—were outweighed by <strong>the</strong> costs and expenses ofmaintaining a dual listing, including U.S. Securitiesand Exchange Commission reporting requirements.On December 12, 2007, SNSA paid an interimdividend of $0.50 per Common Share to shareholdersof record as of November 28, 2007. The Board ofDirectors recommended a final payment <strong>for</strong> 2007of $0.50 per Common Share payable on June 4, 2008,to shareholders of record as of May 21, 2008.For 2007, <strong>the</strong> employee per<strong>for</strong>mance incentiveplans <strong>for</strong> SNSA, SNTG and SSF made paymentsof $1.6 million, $12.1 million and $0.7million, respectively.Challenges Going ForwardLooking ahead in 2008 and beyond, significantuncertainties loom regarding <strong>the</strong> outlook <strong>for</strong> <strong>the</strong>global economy. As a company whose livelihoodlargely depends on <strong>the</strong> vitality of world trade, this isa significant concern. In addition, we are confrontedby sharp increases in operating costs, particularly<strong>for</strong> fuel and ships’ crews. At <strong>the</strong> same time, ourmarkets continue to evolve and trade lanes continueto shift.To meet <strong>the</strong>se challenges, we shall do what we haveal<strong>way</strong>s done: innovate, manage well and delivergreater value to customers than anyone else. Withour people, our financial strength, our unrivalledglobal network and worldwide customer base, <strong>the</strong>reis no question that we have <strong>the</strong> talent, <strong>the</strong> dedication,<strong>the</strong> skill and <strong>the</strong> resources to achieve our goals. I amconfident in <strong>the</strong> future of SNSA.Niels G. Stolt-NielsenChief Executive OfficerStolt-Nielsen S.A.March 3, 20086 www.stolt-nielsen.com
Our Business<strong>Leading</strong> <strong>the</strong> <strong>way</strong>We have achieved a leadershipposition in our global markets, by:> Investing in a world-class fleet> Driving operational efficiencies> Maximizing growth opportunities> Focusing on high quality> Training and development
Business ReviewStolt Tankers & TerminalsThrough its global network of parcel tankers, terminals andregional fleets, Stolt Tankers & Terminals (ST&T) serves <strong>the</strong>transportation and storage needs of <strong>the</strong> world’s leading—andmost demanding—chemical companies. ST&T operates as anintegral part of our customers’ supply chains. Our ability tooptimize <strong>the</strong> interface of our tanker and terminal operationsreduces ship turnaround times, helping to lower costs bydecreasing time spent in port.Our global deep-sea fleet of sophisticated parceltankers is capable of safely and reliably transportingmultiple, fully segregated parcels of high qualitybulk liquids, including <strong>the</strong> most difficult-to-handlecargoes. ST&T’s deep-sea services are managed byStolt Tankers, which coordinates <strong>the</strong> marketing,operation and administration of more than 70 parceltankers. Our deep-sea fleet is complemented by anetwork of regional fleets and storage terminals,enabling us to offer our customers a completedoor-to-door global transportation solution.Hans FeringaPresident of Stolt Tankers & TerminalsLocationsWalter WattenberghManaging Director of Stolthaven TerminalsST&T’s Ship Management team manages each shipin our tanker fleet throughout its entire lifecycle,from initial design, through construction, operations,maintenance and repair, and, ultimately, recycling.Ensuring <strong>the</strong> quality of our customers’ products whilemaintaining <strong>the</strong> highest standards of safety <strong>for</strong> peopleand <strong>the</strong> environment are ST&T’s constant priorities.Stolt TankersStolt Tankers & Terminals provide worldwidetransportation, storage and distributionsolutions <strong>for</strong> bulk-liquid chemicals, edible oils,acids, biofuels and clean petroleum products.Opportunities <strong>for</strong> growth> Investments in storage infrastructure and breakbulkcapability in China> Develop well balanced and fully utilized trading patternsin <strong>the</strong> fast growing Middle East export marketPer<strong>for</strong>mance(U.S.$ Millions) 2007 2006 2005Operating revenue $1,293 $1,160 $1,049Operating income $158 $160 $176Operational StatisticsTankersVolume of cargo carried:24.1 million tonnesOperating days: 47,960TerminalsStorage capacity:1.9 million cbmAverage utilization: 98.25%Outlook> Although <strong>the</strong> supply and demand remain in balance, a significantnewbuilding orderbook, coupled with concerns of economicslowdown, may cause oversupply. However, continued growthin developing countries will provide underlying support.About TankersST&T operates one of <strong>the</strong> most technically advancedand sophisticated parcel tanker fleets in <strong>the</strong> world.Special capabilities include cargo heating andcooling systems, high-tech tank cleaning equipment,inert gas systems, and stainless steel or coatedtanks to handle a wide range of cargoes, includingpetrochemicals, oleochemicals, vegetable oils, acidsand lubricating oils.ST&T is currently engaged in a major fleet renewalprogramme, to ensure that we continue to have <strong>the</strong>high-quality assets necessary to meet <strong>the</strong> needs of ourcustomers worldwide. The first ship to be producedunder <strong>the</strong> programme—M/T Stolt Sagaland—wasdelivered from Nor<strong>way</strong> in February 2008. When <strong>the</strong>current newbuildings programme is completed in2012, ST&T will have taken delivery of a total of 28double-hulled parcel tankers of varying sizes <strong>for</strong>trading in all our fleets.Approximately 70% of ST&T’s parcel tankerrevenue in 2007 was earned under Contracts ofAffreightment (COA), which are agreements withour customers to transport volumes of productsat fixed rates, typically <strong>for</strong> a one to three yearperiod. This strong contract portfolio providesST&T with a relatively stable revenue base thatallows us to better manage our business <strong>for</strong>long-term growth.As mentioned by both <strong>the</strong> Chairman and <strong>the</strong> CEO,managing our rapidly rising operating costs hasbecome a major priority. ST&T has set a goal ofreducing its deep-sea fleet fuel consumption through<strong>the</strong> implementation of a number of technical andoperational innovations. In addition to reducing ourfuel costs, <strong>the</strong>se actions will benefit <strong>the</strong> environmentby lowering our ship emissions and our carbon8 www.stolt-nielsen.com
Investing in aworld-class fleetOur BusinessDelivery of M/T Stolt Sagaland, Nor<strong>way</strong>Delivery of M/T Stolt Sagaland<strong>Leading</strong> <strong>the</strong> <strong>way</strong> at Stolt Tankers & TerminalsJacob Stolt-Nielsen pioneered <strong>the</strong> modern parcel tanker. It provedto be <strong>the</strong> model that many o<strong>the</strong>rs followed, setting <strong>the</strong> standards <strong>for</strong>safety and quality in <strong>the</strong> bulk-liquid transportation industry. Indeed,<strong>the</strong> highly sophisticated D-37/F-37 series of ships, launched in <strong>the</strong>1990s, remains <strong>the</strong> standard against which all o<strong>the</strong>r parcel tankersare measured. ST&T’s commitment to <strong>the</strong> pursuit of technical andoperational innovations that deliver value to our customers remainsas vital as ever. Over <strong>the</strong> next five years we have committed wellover $1 billion in investments in ships and terminal infrastructurein support of our goals.
Business ReviewStolt Tankers & Terminalsfootprint. Maintenance and repair and manning costsalso grew rapidly over <strong>the</strong> last year, with continuedincreases expected in <strong>the</strong> years to come. However,by building, manning and efficiently operatingour ships over <strong>the</strong>ir entire service life, we expectto reduce <strong>the</strong> overall operating costs of our assets,while safely extending <strong>the</strong>ir trading lives.Tankers—Events of 2007In 2007, Stolt Tankers benefited from <strong>the</strong> fourthconsecutive year of strong market conditions,though it was not entirely smooth sailing. The yearbegan with adverse wea<strong>the</strong>r conditions in <strong>the</strong> U.S.Gulf, resulting in periods of severe port congestionand delays.As <strong>the</strong> year unfolded, bunker fuel prices began toescalate sharply, rising from approximately $280 permetric ton in December 2006 to $500 per metric tonby November 2007. Ship management costs alsoclimbed over <strong>the</strong> course of <strong>the</strong> year. The impact of<strong>the</strong>se factors resulted in a 8% decrease year-over-yearin operating income.On January 1st, 2007 <strong>the</strong> International MaritimeOrganization (IMO) enacted new MARPOL regulationsfollowing <strong>the</strong> reclassification of a number of products,most notably vegoils, to be carried in double-hulledships. ST&T, toge<strong>the</strong>r with its partners in STJS, waswell prepared <strong>for</strong> <strong>the</strong>se new regulations, with a parceltanker fleet that is 70% double-hulled, and webenefited from <strong>the</strong> subsequent rate hikes <strong>for</strong> vegoils.Special mention should go to <strong>the</strong> regional serviceswhich produced ano<strong>the</strong>r record year. The Stolt-NielsenInter Europe Service (SNIES) reported recordoperating income, driven by careful marketpositioning and streamlining of its contract portfolio,aided by favourable currency fluctuations. ST&T’sAsian services also had a good year, driven by strongvolumes and firm freight rates in <strong>the</strong> region, despiterising operating costs.Stolthaven TerminalsAbout TerminalsStolthaven’s global network of eight terminalsis an integral part of ST&T’s worldwide servicecapabilities. Stolthaven’s growing assets include atotal of 1.9 million cubic metres of storage capacity,plus more than 330 railroad tank cars servingcustomer needs in <strong>the</strong> U.S. Gulf. By mid-2009,Stolthaven, toge<strong>the</strong>r with its JV partners, will bring<strong>online</strong> an additional 1 million cubic metres of storagecapacity at its terminals globally.Our terminals support <strong>the</strong> fast turnaround of ourships, thus reducing operating costs <strong>for</strong> <strong>the</strong> fleet.The terminals are strategically located in majorports along <strong>the</strong> most active shipping routes.Stolthaven’s Houston terminal primarily serves <strong>the</strong>export trade of chemicals from <strong>the</strong> U.S. to Europe,Latin America, Africa and Asia Pacific. New Orleansis a significant terminal <strong>for</strong> imports of oleochemicals,and serves <strong>the</strong> regional chemical industry in <strong>the</strong>Mississippi River delta. Santos is <strong>the</strong> major ethanolexport point <strong>for</strong> Brazil.In Europe, our joint venture terminal in <strong>An</strong>twerpoffers a gate<strong>way</strong> to Europe via <strong>the</strong> Rhine, througha highly flexible combination of Stolt Tankers’regional short-sea fleet and <strong>the</strong> intra-European bargefleet. These regional capabilities add significantly to<strong>the</strong> ability of <strong>the</strong> STJS fleet to enable our Europeancustomers to efficiently and effectively reach marketsin both <strong>the</strong> Americas and <strong>the</strong> Far East.Stolthaven is implementing a similar model inAsia, where <strong>the</strong> expertise, knowledge and contactsof our local terminal partners add significant value.Stolthaven’s facilities in Ulsan, South Korea andWestport, Malaysia, along with Stoltchem’s coastalChina fleet and our short-sea Asia Pacific fleet,provide substantial efficiency advantages.Stolthaven’s joint-venture terminals in Ningbo andTianjin will play a key role in ST&T’s ability to meetgrowing customer demand <strong>for</strong> quality terminalservices in China.Terminals—Events of 2007Stolthaven posted record financial results in 2007,despite <strong>the</strong> costs of major capacity expansions and<strong>the</strong> ongoing construction of <strong>the</strong> two new Chineseterminals in Tianjin and Ningbo.Our joint venture terminal in <strong>An</strong>twerp saw <strong>the</strong>commissioning of 50,000 cubic metres of newcapacity <strong>for</strong> specialty chemicals and an additional399,000 cubic metres of double-skinned tanks dueto come <strong>online</strong> by <strong>the</strong> second quarter of 2009.We also completed in early 2007 <strong>the</strong> full restorationof <strong>the</strong> New Orleans terminal, after damage sustainedfrom Hurricane Katrina in 2005. During <strong>the</strong> year,<strong>the</strong> New Orleans and Houston terminals were jointlyawarded <strong>the</strong> Independent Liquid TerminalAssociation Safety Excellence Award.Houston is <strong>the</strong> most frequently called port <strong>for</strong> ourdeep-sea ships and our terminal <strong>the</strong>re is a highlyefficient destination <strong>for</strong> handling our ships.Construction has begun to increase Houston’scapacity by 12%, or 50,800 cubic metres, andcapacity at New Orleans is to be increased by 36%,or 81,800 cubic metres.Stolthaven’s terminal in Santos saw an increasein activity during 2007, primarily due to <strong>the</strong> boomin demand <strong>for</strong> biofuels, principally in <strong>the</strong> U.S. andEurope. Storage capacity at Santos is being expandedby 21.4%, or 22,000 cubic metres, to accommodate<strong>the</strong> increased activity.In South Korea, our joint venture terminal in Ulsanreported record earnings and demand, reaping<strong>the</strong> benefits of ongoing investments in capacityand efficiency.Our terminal at Westport, Malaysia also experiencedhigh levels of activity in 2007, and an agreement hasbeen reached with our joint venture partner to add4,500 cubic metres of capacity.10 www.stolt-nielsen.com
Our BusinessDrivingoperationalefficienciesStolthaven JV Terminal, <strong>An</strong>twerpStolthaven terminal<strong>Leading</strong> <strong>the</strong> <strong>way</strong> at Stolt Tankers & TerminalsThe ongoing expansion of Stolthaven’s network, with strongemphasis on <strong>the</strong> point of transfer from ship to shore, has led toopportunities <strong>for</strong> our customers to set up efficient logistics networksto all corners of <strong>the</strong> world, supporting mutual growth.In 2008 we celebrate our 20-year partnership with Chevron PhillipsChemical Company LLC and its affiliates. The relationship started inHouston and now extends to Stolthaven’s storage locations in NewOrleans, <strong>An</strong>twerp and Ulsan.
Business ReviewcontinuedStolt Tank ContainersMike KramerPresident of Stolt Tank ContainersLocationsStolt Tank Containers is <strong>the</strong> leading globalprovider of logistics and transportationservices <strong>for</strong> door-to-door shipments of bulkliquidchemicals and food-grade products.Opportunities <strong>for</strong> growth> Continued expansion in <strong>the</strong> Middle East, Indiansub-continent, Asia Pacific and China> Continued conversion of cargo from drums and parcel tankersinto tank containers> Expansion of <strong>the</strong> Mercosur and Caribbean trade> Fur<strong>the</strong>r expansion of STC’s food grade and Flexibag businessesPer<strong>for</strong>mance(U.S.$ Millions) 2007 2006 2005Operating revenue $391 $352 $334Operating income $46 $43 $30Operational StatisticsAverage Tank Container utilization <strong>for</strong> 2007 76.3%<strong>An</strong>nual Shipments 87,921Number of Tanks at end of 2007 21,010Outlook> Strong global trade is a driver of STC’s results and will supportour continued growth. Despite concerns about a U.S. recessionor slowdown, supply and demand outlooks are favourable,driven largely by strong growth in China, North Asia and<strong>the</strong> Middle East.Stolt Tank Containers (STC) is <strong>the</strong> world’s largest providerof door-to-door tank container services. Our fleet of morethan 21,000 units, combined with our commitment to <strong>the</strong>highest levels of service at <strong>the</strong> lowest possible cost, enablesSTC to deliver superior service to customers in all partsof <strong>the</strong> world.To ensure <strong>the</strong> efficient utilization and low-costoperation of our global fleet, STC has developedproprietary IT systems that optimize cargoprogrammes, routing and fleet-managementactivities, while minimizing <strong>the</strong> costsof repositioning empty containers.STC also offers its customers Flexibag, or Flexitank,services, an alternative to tank containers <strong>for</strong> nonhazardousproducts. Flexibags are large, disposablepolyethylene or rubber bags that fit inside a standard20-foot dry box container. Both tank containers andFlexibags provide a more safe and economicalalternative to conventional drums.STC’s global network of modern cleaning andrepair depots ensures consistently high quality,reliability and adherence to environmentalstandards and regulations.Stolt Tank Containers—Events of 20072007 was a record year <strong>for</strong> STC, driven by strongdemand <strong>for</strong> tank container services worldwide. STChandled close to 88,000 container movements, an 8%increase over 2006.Trade was strong in all regions, particularly NorthAmerica and most of Asia. Trade patterns in Europeand China experienced greater volatility dueto fluctuating currencies and changes in <strong>the</strong> taxtreatment of chemical exports from China. STCexperienced continued growth in <strong>the</strong> Middle East,India and South America.STC took delivery of approximately 1,900 new tankcontainers in 2007. We significantly enhanced ourremanufacturing and refurbishment programme,which extends <strong>the</strong> service lives of our tanks, whileensuring <strong>the</strong> highest standards of safety and quality.STC’s new state-of-<strong>the</strong>-art depot in Nanhui, Chinaopened in January 2007. Later in <strong>the</strong> year, weexpanded both <strong>the</strong> Singapore and Houston depotsto meet increasing demand.STC’s fundamental vision is to provide its customerswith <strong>the</strong> highest levels of service at <strong>the</strong> lowestpossible cost. During 2007, we continued to focuson system and process improvements aimed atachieving increased economies of scale and costefficiencies. New yield and <strong>for</strong>ecast optimizationtools enabled STC to fur<strong>the</strong>r enhance <strong>the</strong> efficientmanagement of its fleet. In addition, <strong>the</strong>implementation of Electronic Data Interchangeprograms with many of our customers and serviceproviders increasingly allows us to communicatewith unprecedented efficiency and reliability.12 www.stolt-nielsen.com
MaximizinggrowthopportunitiesOur BusinessStolt Tank Containers Depot, SingaporeStorage facility<strong>Leading</strong> <strong>the</strong> <strong>way</strong> at Stolt Tank ContainersWhen Stolt Tank Containers was founded in 1982—with just 400tanks—<strong>the</strong> industry was in its infancy. Over <strong>the</strong> next 25 years, STCasserted its leadership, setting <strong>the</strong> standards <strong>for</strong> customer service,operational per<strong>for</strong>mance, innovation and growth. Indeed, in <strong>the</strong>process of building its own business, STC in many <strong>way</strong>s built <strong>the</strong>industry. STC’s pioneering use of computer technology, its QualityLease Management concept, and <strong>the</strong> implementation of its WebHubworkflow tools and plat<strong>for</strong>m represent just a few of <strong>the</strong> innovationsthat drove STC’s competitive advantage. Today, by continuing toopen new markets, and by delivering <strong>the</strong> highest levels of service,STC aims to remain a leader in <strong>the</strong> global logistics industry.
Business ReviewcontinuedStolt Sea FarmPablo GarciaPresident of Stolt Sea FarmLocationsStolt Sea Farm is a leading producer of highquality turbot, sole, sturgeon and caviar. SSF isheadquartered in La Coruña, Spain.Opportunities <strong>for</strong> growth> First 300 tonnes/year sole plant will be completed in 2008> Growing expertise in recirculation technology allows flatfishfarming in new countries with lower operating costs> Projects being licensed <strong>for</strong> 4,000 tonnes/year of additionalproduction of flatfishPer<strong>for</strong>mance(U.S.$ Millions) 2007 2006 2005Operating revenue $69 $49 $232Operating income $24 $14 $7Operational StatisticsBiggest farmed turbot producer worldwideFirst industrial producer of farmed soleLargest caviar producer in <strong>the</strong> U.S.Outlook> Worldwide competition is expected to increase as fish stocksat new farms reach maturity in 2008. However, Stolt SeaFarm's position as <strong>the</strong> world's leading international producergives SSF <strong>the</strong> size and flexibility to guarantee a consistent andreliable supply to our customers.Stolt Sea Farm (SSF) is one of <strong>the</strong> world’s leading high-techaquaculture companies. We focus on <strong>the</strong> production ofpremium fish species whose complex biologies requiresophisticated know-how and technological expertise <strong>for</strong>successful cultivation.SSF specializes in <strong>the</strong> commercial productionof turbot, sole, sturgeon and caviar, with 13aquaculture facilities in Nor<strong>the</strong>rn Spain, Portugal,Sou<strong>the</strong>rn France, Nor<strong>way</strong> and Cali<strong>for</strong>nia. SSF hasmore than 24 years of experience in <strong>the</strong> sustainableproduction of premium species.SSF is <strong>the</strong> world’s leading turbot producer, marketedunder <strong>the</strong> Prodemar brand. Our hatcheries inGalicia, Spain initiate <strong>the</strong> first and most delicatelife phase of <strong>the</strong> Prodemar turbot. We are nowintroducing sole alongside turbot at <strong>the</strong>se farms,as a result of our research into more effectivehusbandry practices. SSF annually raises fourmillion turbot and sole juveniles, which producesapproximately 4,000 tonnes of mature two-year-oldfish. Prodemar turbot and sole are marketed indifferent sizes to fish wholesalers throughout Europe.SSF’s caviar and sturgeon production is based inCali<strong>for</strong>nia, where we have four facilities raising fishto reproductive maturity, which occurs at eight yearsof age. SSF is <strong>the</strong> largest sustainable sturgeon andcaviar producer in <strong>the</strong> world. Our sturgeon andcaviar are distributed to a specialist niche marketof exclusive restaurants.Stolt Sea Farm—Events of 2007SSF achieved record financial and operational resultsin 2007. While our overall production capacityremained unchanged, results improved in 2007 dueto <strong>the</strong> strong market prices, as a consequence of <strong>the</strong>reduced supply of turbot in <strong>the</strong> market as SSFcompetitors suffered heavy mortalities in <strong>the</strong> lasttwo years. On December 18, 2006, SSF completed <strong>the</strong>sale of its Sou<strong>the</strong>rn bluefin tuna business, based inPort Lincoln, Australia, to SAMS Holdings (SA) Pty.Ltd. <strong>for</strong> proceeds totalling AUS $90.0 million(approximately $70.2 million at prevailingexchange rates).On December 21, 2006, SSF acquired a 75% equitystake in <strong>the</strong> sturgeon and caviar business, SterlingCaviar LLC (“Sterling Caviar”) from Marine Harvest.On December 29, 2006, SSF completed <strong>the</strong> sale of its25% equity stake in Marine Harvest <strong>for</strong> proceedstotalling $353.5 million.OutlookA slowing Spanish economy may have a negativeimpact on demand <strong>for</strong> our flatfish in Spain in 2008.In addition, worldwide competition is expected toincrease as fish stocks at new farms reach maturityin 2008. However, SSF’s position as <strong>the</strong> world’sleading international producer gives SSF <strong>the</strong> sizeand flexibility to guarantee a consistent and reliablesupply to our customers.Building new production capacity is slowed by <strong>the</strong>lengthy process associated with obtaining regulatoryapprovals. Never<strong>the</strong>less, given SSF’s excellent trackrecord of profitable growth and world-leadingexpertise in our chosen species, we are optimisticabout <strong>the</strong> prospects <strong>for</strong> growth in an environmentwhere wild caught fish are increasingly scarce.14 www.stolt-nielsen.com
Focusingon high qualityOur BusinessTurbot production, SpainTurbot production<strong>Leading</strong> <strong>the</strong> <strong>way</strong> at Stolt Sea FarmStolt Sea Farm takes <strong>the</strong> environment and <strong>the</strong> welfare of fish andfood safety seriously and is proud of <strong>the</strong> pioneering role it hasplayed in <strong>the</strong> development of sustainable fish farming. SSF is one of<strong>the</strong> few fish farming companies to be ISO 14000 certified and wasrewarded <strong>for</strong> its environmental ef<strong>for</strong>ts in 2007, receiving <strong>the</strong> covetedFriends of <strong>the</strong> Sea approval <strong>for</strong> its products.
Business ReviewcontinuedStolt-Nielsen GasStolt Bitumen ServicesStolt-Nielsen Gas Ltd. (SNG) was<strong>for</strong>med by SNSA in August 2007to pursue growth opportunitiesin <strong>the</strong> expanding market <strong>for</strong> <strong>the</strong>transportation of liquefiedpetroleum gas (LPG).Stolt Bitumen Services (SBS) isa new division of SNSA that willoffer high quality, safe and efficientstorage and distribution services<strong>for</strong> bitumen, using modern bitumentankers, bitutainers (specializedtank containers) and terminals.SNSA announced in August 2007 plans to enter<strong>the</strong> market <strong>for</strong> <strong>the</strong> transportation of LPG.Stolt-Nielsen Gas Ltd. was <strong>for</strong>med to pursuethis growth opportunity.SNG is targeting <strong>the</strong> fully refrigerated segmentof <strong>the</strong> LPG transportation market, with an emphasison <strong>the</strong> very large gas carrier (VLGC) segment.VLGCs primarily carry LPG exports from <strong>the</strong> MiddleEast and West Africa to Japan and Korea. Exportsto both Europe and <strong>the</strong> U.S. are expected to increasein <strong>the</strong> future.Worldwide LPG exports are expected to grow fromapproximately 50 million tons annually in 2006 to75 million tons by 2011/2012. The global VLGC fleetconsisted of 114 ships at year-end 2007, with anorderbook of 54 VLGCs, or 47% of <strong>the</strong> existing fleet.The VLGC market is expected to face challengingtimes in <strong>the</strong> near-term. The long-term outlook,however, is positive and SNG intends to build itsposition in this attractive market over <strong>the</strong> nextseveral years.In August 2007, Stolt Bitumen Services placed firmorders <strong>for</strong> two new state-of-<strong>the</strong>-art bitumen tankersof 5,900 dwt. Deliveries are scheduled to begin inFebruary 2010. SBS holds options on an additionalfour tankers.SNSA’s investment in <strong>the</strong>se new bitumen tankersfollows <strong>the</strong> <strong>for</strong>mation of our Stolt-PTC Bitubulk Pte.Ltd. joint venture, in which we are building a globalfleet of bitutainers.Our goal is to become a world leader in bitumentransportation solutions by providing customerswith reliable, safe service using high-quality assets.SBS’s bitumen tankers will be based in <strong>the</strong> Asia-Pacific region, serving <strong>the</strong> intra and inter-regionaltransportation needs of our oil refiner and industrialcustomers <strong>the</strong>re.16 www.stolt-nielsen.com
Our BusinessTrainingand developmentOnboard training<strong>Leading</strong> <strong>the</strong> <strong>way</strong> at Training and DevelopmentSNSA’s commitment to safety and quality is underscored by intensive training anddevelopment programmes that methodically and repeatedly rein<strong>for</strong>ce <strong>the</strong> Company’scommitment to excellence:> Leadership and management course <strong>for</strong> all senior officers> Four senior officer conferences per year, focusing on safety, quality assurance,MARPOL requirements, vetting, bridge procedures, and fleet/operational practices> 12 junior officer conferences per year, six similar to <strong>the</strong> senior officerconferences and six with an emphasis on cargo handling quality and safety> Classroom instruction in Manila and Rotterdam <strong>for</strong> deck officers and commandassessment training <strong>for</strong> Chief Officers to be promoted to Master> Computer-based onboard training programs focused on safety andenvironmental-protection practices
Board of Directors1. Jacob Stolt-Nielsen 2. Niels G. Stolt-Nielsen 3. Roelof Hendriks4. James B. Hurlock 5. Håkan Larsson6. Christer Olsson7. Jacob B. Stolt-Nielsen 8. Christopher J. Wright18 www.stolt-nielsen.com
1. Jacob Stolt-NielsenChairmanMr. Jacob Stolt-Nielsen has served as ourChairman of <strong>the</strong> Board of Directors of SNSA sincehe founded <strong>the</strong> Company in 1959. He held <strong>the</strong>position of Chief Executive Officer of Stolt-NielsenS.A. from 1959 until 2000. He was trained as ashipbroker and worked in that capacity in Londonand New York prior to founding SNSA. He holdsa degree from Handelsgymnasium, Haugesund,Nor<strong>way</strong>. He is a Norwegian citizen.2. Niels G. Stolt-NielsenChief ExecutiveMr. Niels G. Stolt-Nielsen has served as a directorof SNSA since 1996 and as Chief Executive Officersince 2000. He served as Interim Chief ExecutiveOfficer of Stolt Offshore S.A. (SOSA) fromSeptember 2002 until March 2003. He held <strong>the</strong>position of Chief Executive Officer of SSF from1996 until September 2001. In 1994 he openedand organized our representative office in Shanghai.He joined us in 1990 in Greenwich, Connecticut,working first as a shipbroker and <strong>the</strong>n as a roundvoyage manager. He is also director of Fiducia Ltd.Mr. Stolt-Nielsen graduated from Hofstra Universityin 1990 with a BS degree in Business and Finance.Mr. Niels G. Stolt-Nielsen is a son of Mr. JacobStolt-Nielsen. He is a Norwegian citizen.3. Roelof HendriksDirectorMr. Hendriks has served as a director of SNSA since2004. He has been CEO of Aon Europe, Middle Eastand Africa since 2006. He served as Chief FinancialOfficer and a Member of <strong>the</strong> Board of Managementof CSM N.V. from 2000 to 2005. Prior to that,he was Vice Chairman of <strong>the</strong> Executive Board,Koninklijke Vopak N.V. He held various positionsat Koninklijke Vopak N.V. and its predecessor,Van Ommeren, from 1980 until 2000. Mr. Hendriksreceived a law degree from Vrije Universiteit,Amsterdam. He is a Dutch citizen.Our Business4. James B. HurlockDirectorMr. Hurlock has served as a director of SNSA since2004. Mr. Hurlock served as Interim Chief ExecutiveOfficer of SNTG from July 2003 to June 14, 2004.He also serves as a director of Acergy S.A. andChairman of Orient Express Hotels Ltd., and asChairman of <strong>the</strong> Parker School of Foreign andComparative Law. Mr. Hurlock is a retired partnerof <strong>the</strong> law firm of White & Case LLP and served asChairman of its Management Committee from 1980to 2000. He participated in <strong>the</strong> <strong>for</strong>mation andserved on <strong>the</strong> Board of Nor<strong>the</strong>rn Offshore Ltd.Mr. Hurlock holds an AB degree from PrincetonUniversity, a BA and an MA Jurisprudence fromOx<strong>for</strong>d University and a JD from Harvard LawSchool. He is a U.S. citizen.5. Håkan LarssonDirectorMr. Larsson has served as a director of SNSA sinceJune 2007. He has been <strong>the</strong> Chief ExecutiveOfficer of Rederi AB Transatlantic since 2003.He serves as Chairman of Nimbus Boats AB,Schenker AB, and deputy Chairman of BureEquity AB; a director of Ernströmgruppen AB,Walleniusrederierna AB, Swedish Ship’s MortgageBank, and Chalmers University of Technology.Mr. Larsson is a board member of Advisory Boardof School of Economics and Commercial Law,Go<strong>the</strong>nburg University. He is Chairman of TheSwedish Shipowners Employer’s Associationand Vice Chairman of The Swedish ShipownersAssociation. Mr. Larsson holds a Bachelorsof Economics degree from <strong>the</strong> Go<strong>the</strong>nburgSchool of Economics. He is a Swedish citizen.6. Christer OlssonDirectorMr. Olsson has served as a director of SNSA since1993. He is Vice Chairman of Wallenius Lines ABand Chairman of <strong>the</strong> Swedish Club. He is a directorof Transatlantic AB, Atlantic Container Line AB andSingapore Shipping Corporation. He received hisBLL degree from Stockholm University. He isa Swedish citizen.7. Jacob B. Stolt-NielsenDirectorMr. Jacob B. Stolt-Nielsen has served as a directorof SNSA since 1995. He served as an ExecutiveVice President of Stolt-Nielsen S.A. from 2003to 2004. In 2000, he founded and servedas Chief Executive Officer of SeaSupplier Ltd.until 2003. From 1992 until 2000 he held <strong>the</strong>position of President, Stolthaven Terminals, withresponsibility <strong>for</strong> our global tank storage business.He joined SNSA in 1987 and served in variouspositions in Oslo; Singapore; Greenwich,Connecticut; Houston, Texas; and London. Heis also director of Fiducia Ltd. Mr. Stolt-Nielsengraduated from Babson College in 1987 witha BS degree in Finance and Entrepreneurialstudies. Mr. Jacob B. Stolt-Nielsen is a son ofMr. Jacob Stolt-Nielsen. He is a Norwegian citizen.8. Christopher J. WrightDirectorMr. Wright has served as a director of SNSA sinceMay 2002. He served as our President and ChiefOperating Officer from 1986 to December 2001.He was employed by British Petroleum plc (“BP”)from 1958 until <strong>the</strong> time he joined us. He held avariety of positions at BP working in Scandinavia,Asia, <strong>the</strong> U.S. and London. Mr. Wright holdsa Masters degree in History from CambridgeUniversity. He is a British citizen.Stolt-Nielsen <strong>An</strong>nual Report 200719
Corporate GovernanceStolt-Nielsen S.A. (“SNSA”) maintains high standards ofCorporate Governance. Corporate Governance addresses <strong>the</strong>interaction between SNSA’s shareholders, <strong>the</strong> Board ofDirectors and management.Luxembourg Public Limited Companies Act of 1915governs <strong>the</strong> incorporation and management of SNSA.In addition, relevant Luxembourg and internationallaw also applies to <strong>the</strong> operation of <strong>the</strong> business ofSNSA. Norwegian securities law applies as a resultof SNSA being listed on <strong>the</strong> Oslo Børs. The Companydelisted its ADRs from Nasdaq on May 21, 2007 andterminated its ADR programme with Citibank N.A.on May 24, 2007. On May 11, 2007 <strong>the</strong> Companyfiled Form 25 with <strong>the</strong> U.S. Securities and ExchangeCommission (“SEC”) in respect of deregistrationfrom <strong>the</strong> SEC's requirements which, subject tocertain conditions, <strong>the</strong> Company expects to beeffective in May 2008.Being incorporated in Luxembourg and listed on <strong>the</strong>Oslo Børs, SNSA is subject to Corporate Governanceregulations under Luxembourg company law and<strong>the</strong> Norwegian Code of Practice <strong>for</strong> CorporateGovernance. Adherence to <strong>the</strong> Norwegian Codeof Practice is based on a “comply or explain” principle,whereby companies are expected to ei<strong>the</strong>r comply with<strong>the</strong> Norwegian Code of Practice or explain why <strong>the</strong>yhave chosen an alternative approach. Since SNSA issubject to various requirements, we explain <strong>the</strong> basicprinciples <strong>for</strong> SNSA Corporate Governance.Board size and structureThe business affairs of SNSA are managed under <strong>the</strong>direction of <strong>the</strong> SNSA Board of Directors. The Boardof Directors may delegate authority to <strong>the</strong> Chairman,specified committees of <strong>the</strong> Board of Directors,or to SNSA’s management.As provided in SNSA’s Articles of Incorporation,<strong>the</strong> Board of Directors shall be composed of at leastthree and not more than nine Directors. The Boardof Directors believes that <strong>the</strong> optimal size <strong>for</strong> <strong>the</strong>Board of Directors should be six to eight Directors.The Board of Directors’ size is flexible dependingon <strong>the</strong> circumstances and <strong>the</strong> qualificationsof proposed candidates.The composition of <strong>the</strong> Board of Directors shallensure that <strong>the</strong> SNSA Board of Directors can attendto <strong>the</strong> common interests of all shareholders andmeets <strong>the</strong> Company’s need <strong>for</strong> expertise, capacityand diversity.The Directors are elected at a General Meetingof Shareholders by a simple majority vote of <strong>the</strong>outstanding shares (Common and Founder’s)represented at <strong>the</strong> meeting <strong>for</strong> a period of one year.Directors may be removed with or without cause by<strong>the</strong> votes of <strong>the</strong> holders of more than 50% of sharespresent or represented at a General Meeting. In <strong>the</strong>event of a vacancy on <strong>the</strong> Board of Directors becauseof death, retirement, resignation or dismissal, <strong>the</strong>remaining members of <strong>the</strong> Board of Directors can fillsuch vacancy and appoint a member to act until <strong>the</strong>next General Meeting of shareholders at which <strong>the</strong>Directors so elected shall be confirmed. SNSA doesnot have a Nomination Committee.The composition of <strong>the</strong> Board of Directors shallensure that it can operate independently of anyspecial interests. Five of <strong>the</strong> current eight SNSADirectors, Roelof Hendriks, James B. Hurlock,Christer Olsson, Christopher J. Wright and HåkanLarsson are considered to be independent accordingto <strong>the</strong> Norwegian Code of Practice.The Chairman of <strong>the</strong> Board of Directors is electedby <strong>the</strong> <strong>An</strong>nual General Meeting of Shareholders.The Board of Directors may appoint a BoardSecretary who does not need to be member of <strong>the</strong>Board of Directors.Board committeesThe Board of Directors has established <strong>the</strong>Audit Committee, Compensation Committee,and Legal Committee.The Audit Committee is composed of at least threemembers; normally each of whom is independentpursuant to all applicable regulatory requirements.The Compensation Committee is composed of at leastthree members of which at least one is independentpursuant to all regulatory requirements applicableto SNSA. The Legal Committee is composed ofone member.Each Audit Committee member must meet a financialliteracy requirement, and at least one member musthave experience or background which resultsin being a financial expert.Each Committee has a Chair who reports <strong>the</strong>activities of such Committee at meetings of <strong>the</strong> fullBoard of Directors.The Board of Directors periodically reviews <strong>the</strong> size,structure and function of <strong>the</strong> Board Committees.The Audit Committee, Compensation Committee,and Legal Committee have written charters. Thesecharters are reviewed and reassessed by <strong>the</strong> Boardon an annual basis.Independence, equal treatment of shareholdersand takeoversThe Board of Directors reviews at least annually<strong>the</strong> financial and o<strong>the</strong>r relationships betweenDirectors and SNSA.SNSA conducts an appropriate review of all relatedparty transactions <strong>for</strong> potential conflict of interestsituations on an ongoing basis and all suchtransactions are approved by SNSA's AuditCommittee as well as publicly disclosed.The Board of Directors will publicly disclose anyserious offer <strong>for</strong> SNSA or a substantial portionof <strong>the</strong> assets of SNSA. The Board of Directors willalso obtain a fairness opinion or valuation from an20 www.stolt-nielsen.com
independent third party <strong>for</strong> any materialtransactions between SNSA and affiliates suchas: members of <strong>the</strong> Board of Directors, membersof <strong>the</strong> executive management or close associatesof any such parties; and between companies in <strong>the</strong>same group where any of <strong>the</strong> companies involvedhave minority shareholders.<strong>An</strong>y transactions SNSA carries out in its own sharesare carried out ei<strong>the</strong>r through <strong>the</strong> stock exchangeor at prevailing stock exchange prices if carriedout in any o<strong>the</strong>r <strong>way</strong>. Directors and <strong>the</strong> executivemanagement must notify <strong>the</strong> Board of Directors if<strong>the</strong>y have any material direct or indirect interest inany transaction entered into by SNSA. Directors withsuch a direct or indirect interest may not participatein voting <strong>for</strong> such transactions.The Board of Directors and <strong>the</strong> Board Committeesmay retain independent advisors, as <strong>the</strong>y deemappropriate and at <strong>the</strong>ir discretion. SNSA shall beresponsible <strong>for</strong> <strong>the</strong> expenses of any such advisor.SNSA has two classes of shares, Common shares andFounder's shares. Under Luxembourg company law,Founder's shares are not considered to be part of <strong>the</strong>Company’s share capital.Except <strong>for</strong> matters where applicable law requires <strong>the</strong>approval of both classes of shares voting as separateclasses, Common shares and Founder's shares vote asa single class on all matters submitted to a vote of <strong>the</strong>shareholders, with each share entitled to one vote.Under <strong>the</strong> Articles of Incorporation, holders ofCommon shares and Founder's shares participatein annual dividends, if any are declared by <strong>the</strong>Company, in <strong>the</strong> following order of priority: (i) $0.005per share to Founder's shares and Common sharesequally; and (ii) <strong>the</strong>reafter, all fur<strong>the</strong>r amounts arepayable to Common shares only. Fur<strong>the</strong>rmore, <strong>the</strong>Articles also set <strong>for</strong>th <strong>the</strong> priorities to be appliedto each of <strong>the</strong> Common and Founder's shares in<strong>the</strong> event of liquidation.Under <strong>the</strong> Articles, in <strong>the</strong> event of a liquidation, alldebts and obligations of SNSA must first be paid and<strong>the</strong>reafter all remaining assets of SNSA are paid to<strong>the</strong> holders of Common shares and Founder's sharesin <strong>the</strong> following order of priority: (i) Common sharesratably to <strong>the</strong> extent of <strong>the</strong> stated value <strong>the</strong>reof (i.e.$1.00 per share); (ii) Common shares and Founder'sshares participate equally up to $0.05 per share; and(iii) <strong>the</strong>reafter, Common shares are entitled to allremaining assets.While <strong>the</strong> Board of Directors is authorized to restrict,reduce, or prevent <strong>the</strong> ownership of shares if itappears to <strong>the</strong> Board of Directors that suchownership may threaten SNSA with grave andimminent harm, it is <strong>the</strong> intention <strong>for</strong> <strong>the</strong> Board ofDirectors to assess any takeover offer <strong>for</strong> SNSA or asubstantial portion of SNSA’s assets, make arecommendation on any such offer, and call <strong>for</strong> aGeneral Meeting of Shareholders to vote on <strong>the</strong>acceptance or rejection of such an offer.As of November 30, 2007, Fiducia Ltd., a companyowned by trusts established <strong>for</strong> <strong>the</strong> benefit of certainmembers of <strong>the</strong> Stolt-Nielsen family, toge<strong>the</strong>rwith certain members of <strong>the</strong> Stolt-Nielsen family,controlled 58.4% of <strong>the</strong> outstanding shares of SNSAentitled to vote generally on matters broughtto a vote of shareholders of SNSA. As a result,<strong>the</strong> Stolt-Nielsen family currently directly andindirectly exercises a controlling influence overSNSA’s operations and has sufficient voting powerto control <strong>the</strong> outcome of matters requiringshareholder approval including: <strong>the</strong> compositionof SNSA’s Board of Directors which has <strong>the</strong> authorityto direct SNSA’s business and to appoint and removeSNSA’s officers; approving or rejecting a merger,consolidation or o<strong>the</strong>r business combination; raisingfuture capital; and amending SNSA’s Articles ofIncorporation which govern <strong>the</strong> rights attached toSNSA’s Common shares. This control may also makeit difficult to take control of SNSA without <strong>the</strong>approval of <strong>the</strong> Stolt-Nielsen family. Additionally,<strong>the</strong> interests of <strong>the</strong> Stolt-Nielsen family may conflictwith <strong>the</strong> interests of SNSA’s o<strong>the</strong>r investors.Board meetingsThe Board of Directors holds at least four regularlyscheduled meetings a year. Meeting schedules areapproved by all members of <strong>the</strong> Board of Directors.Decisions of <strong>the</strong> Board of Directors shall be takenby a majority of <strong>the</strong> votes cast by <strong>the</strong> Directorspresent and represented at <strong>the</strong> meeting provideda quorum is present. The Board of Directors mayalso act by unanimous written consent.Board meetings—executive sessionsIndependent Directors meet at regularly scheduledexecutive sessions without <strong>the</strong> participation of <strong>the</strong>Directors who are not independent. Directors whoare not independent may participate in such sessionsto <strong>the</strong> extent <strong>the</strong> Board of Directors deems to beappropriate and is permitted by applicable law and<strong>the</strong> rules of <strong>the</strong> Oslo Børs.<strong>An</strong>nual and extraordinary general meetingsThe Board of Directors is responsible <strong>for</strong> callingboth <strong>An</strong>nual and Extraordinary General Meetingsof Shareholders. A specific quorum is not neededexcept in <strong>the</strong> case of certain extraordinary matters <strong>for</strong>which a quorum of 50% of voting shares is required.The Board of Directors is obligated to hold an <strong>An</strong>nualGeneral Meeting every year in Luxembourg, normallyat <strong>the</strong> registered office. Variation from such date as set<strong>for</strong>th in <strong>the</strong> Articles of Incorporation (third Thursdayin April) must be approved by shareholders.A shareholder or group of shareholders representingat least one-fifth of <strong>the</strong> outstanding voting sharesmay request a General Meeting in writing indicating<strong>the</strong> agenda <strong>the</strong>reof. The Board of Directors will beobligated to hold <strong>the</strong> meeting within 30 days afterreceipt of such request.Notices <strong>for</strong> both <strong>An</strong>nual and Extraordinary GeneralMeetings shall be sent by mail to all holders recordedin <strong>the</strong> Register no later than 20 days be<strong>for</strong>e <strong>the</strong> dateset <strong>for</strong> <strong>the</strong> General Meeting.Notices should provide sufficient in<strong>for</strong>mation onall matters to be considered at <strong>the</strong> General Meeting,voting instructions and opportunity to vote by proxy.Our BusinessStolt-Nielsen <strong>An</strong>nual Report 200721
CorporateGovernancecontinuedMatters at <strong>the</strong> General Meetings are restrictedto those set <strong>for</strong>th in <strong>the</strong> agenda.Director qualifications, candidates, responsibilities,orientation and continuing educationThe Chairman of <strong>the</strong> Board of Directors identifiesand evaluates proposed candidates <strong>for</strong> nominationto <strong>the</strong> Board of Directors. The Board of Directorsauthorizes invitations to candidates. Individuals areselected <strong>for</strong> nomination to <strong>the</strong> Board of Directorsbased on <strong>the</strong>ir business or professional experience,<strong>the</strong> diversity of <strong>the</strong>ir background, and <strong>the</strong>ir arrayof talents and perspectives.Management is available to discuss matters ofconcern to <strong>the</strong> Board of Directors and <strong>the</strong> Boardof Directors has regular access to senior management.The basic duties and responsibilities of <strong>the</strong> Directorsinclude attending Board of Directors’ meetings,preparing <strong>for</strong> meetings by advance review of anymeeting materials and actively participating in <strong>the</strong>Board of Directors’ discussions. Directors are alsoexpected to make <strong>the</strong>mselves available outsideof <strong>the</strong> Board of Directors’ meetings <strong>for</strong> adviceand consultation.The Board of Directors ensures that SNSA has goodinternal controls in accordance with <strong>the</strong> regulationsthat apply to its activities, including SNSA’s corporatevalues and ethical guidelines.SNSA has a Code of Business Conduct which appliesto all directors, officers and employees, which ispublicly available. <strong>An</strong>y waivers of <strong>the</strong> Code ofBusiness Conduct <strong>for</strong> directors or executive officersare approved by <strong>the</strong> Board and shall be disclosed in<strong>the</strong> <strong>An</strong>nual Report.Directors’ compensation and stock ownershipThe Board of Directors on an annual basis reviews<strong>the</strong> Directors’ compensation. The review includesa comparison of SNSA’s Director compensationpractices against <strong>the</strong> practices of comparable U.S.and European companies.Members of <strong>the</strong> Board of Directors and/or companieswith which <strong>the</strong>y are associated shall not in principletake on specific assignments <strong>for</strong> SNSA in additionto <strong>the</strong>ir appointment as a member of <strong>the</strong> Boardof Directors. If <strong>the</strong>y do none<strong>the</strong>less take on suchassignments this should be disclosed to <strong>the</strong> full Boardof Directors. The remuneration <strong>for</strong> such additionalduties should be approved by <strong>the</strong> Board of Directors.The remuneration including stock-basedcompensation awarded to SNSA's Board of Directors<strong>for</strong> <strong>the</strong>ir service as Directors is disclosed in aggregateat <strong>the</strong> <strong>An</strong>nual General Meetings and in <strong>the</strong> <strong>An</strong>nualReport. <strong>An</strong>y remuneration in addition to normaldirectors’ fees shall be specifically identified.Evaluation of <strong>the</strong> chief executive officer (“CEO”)and executive managementThe per<strong>for</strong>mance and compensation of <strong>the</strong> CEOis reviewed periodically by <strong>the</strong> CompensationCommittee and annually by <strong>the</strong> Board of Directorsin an executive session. Following <strong>the</strong> latter's reviewof per<strong>for</strong>mance and consultation with <strong>the</strong> Chairman(if he is not also CEO) <strong>the</strong> Committee will recommendany changes in compensation and/or benefits <strong>for</strong>decision by <strong>the</strong> Board of Directors in executive session.The Compensation Committee approves <strong>the</strong>principles <strong>for</strong> compensation policy in SNSA andfur<strong>the</strong>r approves <strong>the</strong> individual remunerationof <strong>the</strong> members of Executive Management.SNSA equity and dividendsThe authorized share capital of SNSA may onlybe increased or reduced by resolution of shareholdersas provided in <strong>the</strong> Articles of Incorporation and underLuxembourg company law. The Board of Directorsis authorized until <strong>the</strong> next <strong>An</strong>nual General Meetingof Shareholders to increase <strong>the</strong> issued share capitalwithin <strong>the</strong> limits of <strong>the</strong> SNSA authorized capital,or to purchase its own shares.The authorized share capital of SNSA is 65 millionCommon shares and 16.25 million Founder’s shares,no par value. As of November 30, 2007, 64,133,796Common shares and 16,033,449 Founder’s shareswere issued and 59,553,563 Common shares and14,888,391 Founder’s shares were outstanding. Theexcess of authorized shares compared to outstandingshares is intended to be available <strong>for</strong> <strong>the</strong> exerciseof stock options under SNSA 1997 stock option plan.Shareholder approval is required prior to <strong>the</strong>issuance of new shares which are more than<strong>the</strong> currently authorized share capital of SNSA.The suppression of pre-emptive rights, except <strong>for</strong>purposes of stock option issuance, is authorized until<strong>the</strong> next <strong>An</strong>nual General Meeting of Shareholders.SNSA’s share option plan has been approved at <strong>the</strong><strong>An</strong>nual General Meeting. The plan was establishedto create a long-term common interest among<strong>the</strong> directors, <strong>the</strong> employees, and SNSA’sshareholders. The Compensation Committeeadministers SNSA's share option programme. Thelast awards under <strong>the</strong> 1997 stock option plan weremade in January 2007. It has been replaced bya long-term incentive plan which pays awardsto management <strong>for</strong> meeting defined corporatefinancial objectives.Interim dividends can be declared and paid in anyfiscal year by approval of <strong>the</strong> Board of Directors.Final dividends may only be paid after approval by<strong>the</strong> shareholders at <strong>the</strong> <strong>An</strong>nual General Meetingof Shareholders.The Board of Directors has established a dividendpolicy that is available on <strong>the</strong> SNSA website.Article 36 of <strong>the</strong> Articles of Incorporation limitsindividual shareholdings to 20%, single U.S. personshareholdings to 9.9% and shareholders of any singlecountry in aggregate to 49.9%.Independent auditorsThe Audit Committee is responsible <strong>for</strong> <strong>the</strong>appointment and supervision of independentexternal auditors.The Audit Committee has established guidelines inrespect of <strong>the</strong> use of <strong>the</strong> Independent Auditors by <strong>the</strong>company’s executive management <strong>for</strong> services o<strong>the</strong>rthan <strong>the</strong> audit. The Audit Committee shall receive22 www.stolt-nielsen.com
annual written confirmation from <strong>the</strong> IndependentAuditors that such firm continues to satisfy <strong>the</strong>requirements <strong>for</strong> independence. In addition, <strong>the</strong>Independent Auditors shall provide <strong>the</strong> AuditCommittee with a summary of all services inaddition to audit work that have been undertaken<strong>for</strong> <strong>the</strong> company.The Independent Auditors shall submit <strong>the</strong> mainfeatures of <strong>the</strong> plan <strong>for</strong> <strong>the</strong> audit of SNSA to <strong>the</strong>Audit Committee annually.The Independent Auditors shall participate inmeetings of <strong>the</strong> Audit Committee that deal with <strong>the</strong>annual accounts. At <strong>the</strong>se meetings, <strong>the</strong> IndependentAuditors shall comment on any material changesin <strong>the</strong> company’s accounting principles, commenton material management estimates and judgements,and report all matters on which <strong>the</strong>re has beendisagreement between <strong>the</strong> firm and <strong>the</strong> executivemanagement of <strong>the</strong> company.The Independent Auditors shall at least once a yearpresent to <strong>the</strong> Audit Committee commentary on anysignificant internal control findings arising during<strong>the</strong> audit.The Audit Committee shall hold a meeting with <strong>the</strong>Independent Auditors at least once a year at whichnei<strong>the</strong>r <strong>the</strong> CEO nor any o<strong>the</strong>r member of <strong>the</strong>executive management is present.provides simultaneous and broad distribution, andfiles with or furnishes to <strong>the</strong> U.S. Securities andExchange Commission, material press releases onForm 6-K. The Company expects to deregister in May2008 at which point future filings will be only with<strong>the</strong> Oslo Børs.Copies of audited financial statements of SNSA shallbe distributed to shareholders prior to <strong>the</strong> <strong>An</strong>nualGeneral Meeting of Shareholders and shall be filedwith <strong>the</strong> Oslo Børs and <strong>the</strong> U.S. Securities andExchange Commission at <strong>the</strong> time it is distributedto shareholders.SNSA publishes an overview each year of <strong>the</strong> dates<strong>for</strong> major events such as its <strong>An</strong>nual General Meetingof Shareholders, publication of interim reports, publicpresentations, dividend payment date if appropriate,etc. The overview is available on SNSA’s website.After each quarterly earnings release, SNSA holdsa conference call to discuss <strong>the</strong> results and respondto investor and analyst questions. The conference callis open to all those who wish to participate. Twiceper year <strong>the</strong> conference call is held in person infront of a live audience. All conference calls havea telephone dial-in and are webcast with playbackoptions available.Our BusinessRisk management and internal controlThe Board of Directors is responsible <strong>for</strong> SNSA’ssystem of internal control, which covers financial,operational and compliance controls as well as<strong>the</strong> risk management processes. SNSA’s systemof internal control is designed to manage ra<strong>the</strong>rthan eliminate <strong>the</strong> risk of failure to achievebusiness objectives and provide reasonableassurance that SNSA is operating legally, ethicallyand within approved financial and operationalpolicies and procedures with sufficient safeguardsagainst material financial statement misstatementsor loss of assets.The Board of Directors, through <strong>the</strong> AuditCommittee, oversees <strong>the</strong> monitoring of compliancewith its internal control system. The AuditCommittee meets on a quarterly basis to reviewand discuss results of internal audits per<strong>for</strong>medby <strong>the</strong> Operational Audit Department. This alsoincludes matters of an ethical nature. All employees,customers, suppliers and o<strong>the</strong>r parties have directaccess to <strong>the</strong> Audit Committee to report any potentialillegal or unethical matters.The Board of Directors carries out an annual reviewof SNSA’s most significant areas of exposure to riskand its internal control system. SNSA’s businessheads are responsible <strong>for</strong> reporting <strong>the</strong>ir businessrisks to <strong>the</strong> Board of Directors.In<strong>for</strong>mation and communicationsAll in<strong>for</strong>mation distributed to SNSA’s shareholdersis published on SNSA’s website.SNSA promptly submits all material press releasesto Oslo Børs, disseminates such material pressreleases through an approved news wire service thatStolt-Nielsen <strong>An</strong>nual Report 200723
Financial ReviewJan Chr. Engelhardtsen, Chief Financial OfficerManagement’s Discussion ofOperating Per<strong>for</strong>manceThis section discusses matters we consider importantto understand our operating results and financialcondition <strong>for</strong> <strong>the</strong> years ended November 30, 2007 and2006. This discussion consists of:> Results of Operations;> Business Segment Per<strong>for</strong>mance;> Liquidity and Capital Resources;> International Financial ReportingStandards Implementation; and> Critical Accounting Estimates.Results of OperationsPresented below is a summary of our consolidatedfinancial data <strong>for</strong> fiscal years 2007 and 2006:For <strong>the</strong> years ended November 30, 2007 2006(in thousands)Operating Revenue $1,759,377 $1,565,227Operating expenses 1,380,006 1,214,843Gross Profit 379,371 350,384Gross margin 21.6% 22.4%Equity in net income of non-consolidated joint ventures and equity method investees 21,963 17,536Administrative and general expenses (213,166) (207,667)Restructuring charges (442) (1,761)Gain on disposal of assets, net 3,148 4,091O<strong>the</strong>r operating income, net 2,082 3,916Operating Income 192,956 166,499Operating margin 11.0% 10.6%Non-operating income (expense):Interest expense (29,237) (35,468)Interest income 5,937 7,816Foreign currency exchange (loss) gain, net (10,415) 3,491Loss on retirement of debt (1,011) —Income from Continuing Operations be<strong>for</strong>e Income Tax Provision,Minority Interest and Equity in Net Income of Marine Harvest 158,230 142,338Income tax provision (5,799) (5,025)Income from Continuing Operations be<strong>for</strong>e Minority Interestand Equity in Net Income of Marine Harvest 152,431 137,313Income from continuing operations margin 8.7% 8.8%Minority interest (303) (85)Equity in net income of Marine Harvest — 60,800Gain on disposal of Marine Harvest 21,792 —Income from Continuing Operations 173,920 198,028Income from discontinued operations — 1,887Gain on sale of investment in discontinued operations 42,443 —Net Income $216,363 $199,91524 www.stolt-nielsen.com
Net income was $216.4 million <strong>for</strong> 2007, an increaseof $16.4 million from 2006. During 2007, wecompleted <strong>the</strong> sale of our Australian bluefin tunabusiness <strong>for</strong> a gain of $42.4 million and finalized <strong>the</strong>sale of our 25% investment in Marine Harvest <strong>for</strong> again of $21.8 million.Income from continuing operations be<strong>for</strong>e minorityinterest and equity in net income of Marine Harvestwas $152.4 million, an increase of $15.1 millionor 11.0% compared to 2006. The significant factorsaffecting our per<strong>for</strong>mance in 2007 were:> 12.4% growth in overall revenues driven by strongermarkets in all our business activities and increasedrates, especially in tankers and terminals.> Gross margins declined by 3.7% due to increases inexternal short-term time charter hire expenses, bunkerfuel costs and higher ship management costs, particularlymanning. Higher container freight costs <strong>for</strong> tankcontainers caused gross margins to decrease.> Our operating margin was 11.0% as compared to 10.6%in 2006. The slight increase was due to administrativeand general expenses not increasing in <strong>the</strong> sameproportion as revenues.Operating RevenueOperating revenue <strong>for</strong> 2007 increased by $194.2 milliondue to <strong>the</strong> strong underlying revenue growth in all ourmarkets, particularly tankers and tank containers.The continued strong tanker market during mostof 2007 resulted in higher freight rates beingachieved on most of our Contracts of Affreightment(“COA”) renewals. In <strong>the</strong> case of tank containers,revenue increased based upon a strong demandworldwide. The increase in tank container capacitywas 10.9% <strong>for</strong> <strong>the</strong> year with container shipmentsup by 8.2%.Terminals increased <strong>the</strong>ir operating revenueby 10.3% in 2007 due to increased activity andcapacity, improved pricing and expanded terminaland rail services.The 41.8% growth in <strong>the</strong> revenues of Stolt Sea Farms(“SSF”) was due to increased demand and higherprices on turbot as well as <strong>the</strong> acquisition of SterlingCaviar, LLC (“Sterling Caviar”) in December 2006.Gross ProfitOur gross profit increased by $29.0 million or 8.3%compared to 2006 while gross margins declinedfrom 22.4% in 2006 to 21.6% in 2007, reflecting <strong>the</strong>underlying cost pressures in our various businesses.Margins were affected primarily by increased shorttermtime charter expenses, higher bunker fuel costs,higher manning and ship management costs and aweaker U.S. dollar affecting our costs denominated inEuros, British pounds and o<strong>the</strong>r currencies.Equity in Net Income of Non-consolidated Joint Venturesand Equity Method InvesteesOur joint ventures delivered strong per<strong>for</strong>mancesoverall and resulted in a $4.4 million or 25.2%increase in <strong>the</strong> net income of non-consolidatedjoint ventures and equity method investees.The increase was mainly due to recognizing a fullyear impact of our share of income from our jointventure with Oiltanking in <strong>An</strong>twerp, Belgium, whichwas <strong>for</strong>med in <strong>the</strong> third quarter of 2006. Revenuegrowth at our Ulsan, South Korean joint venturealso remained strong in 2007. Fur<strong>the</strong>r, we recordeda one-time gain of $1.9 million on our investmentin <strong>the</strong> Westport, Malaysian joint venture from <strong>the</strong>successful appeal to <strong>the</strong> local tax authorities to allow<strong>the</strong> carry<strong>for</strong>ward of certain tax losses.While <strong>the</strong> equity income <strong>for</strong> our Asian tanker jointventures fell due to fewer operating days, our tankerjoint venture in China was operational all year whichresulted in its equity income increasing by $1.3million in 2007 from 2006.Administrative and General ExpensesAdministrative and general expenses increased by2.6% or $5.5 million in 2007 compared to 2006.Administrative and general expenses in 2007 showeda slight decrease in antitrust-related legal advisorexpenses (from $42.0 million in 2006 to $40.8 millionin 2007) and lower Sarbanes-Oxley compliance costs.In addition, in 2006, <strong>the</strong>re was a charge of $6.1million to correct cumulative prior year errors inaccounting <strong>for</strong> stock-based compensation expense <strong>for</strong>options awarded in SNSA’s 1993 to 2004 fiscal years.Offsetting <strong>the</strong>se decreases were inflationary wageand benefit increases and a weaker U.S. dollar whichincreased our costs denominated in Euros, Britishpounds and o<strong>the</strong>r currencies.Restructuring ChargesOur restructuring programme started in June 2004which included <strong>the</strong> relocation of operational andadministrative functions from Houston, Texasand Greenwich, Connecticut (both in <strong>the</strong> U.S.) toRotterdam, The Ne<strong>the</strong>rlands and London, England.This restructuring programme is gradually comingto a close and, accordingly, our restructuring costshave lowered during 2007.Gain on Disposal of Assets, NetIn 2007, we had a net gain on <strong>the</strong> disposal of assetsof $3.1 million as compared to $4.1 million in 2006.In 2007, <strong>the</strong> gain primarily related to <strong>the</strong> sales offour ships <strong>for</strong> a gain of $2.3 million while, in 2006,we sold five ships <strong>for</strong> a $3.1 million gain along with<strong>the</strong> sale of land in Houston <strong>for</strong> a $1.1 million gain.O<strong>the</strong>r Operating Income, NetO<strong>the</strong>r operating income, net in 2007 was lower by $1.8million as <strong>the</strong> majority of o<strong>the</strong>r operating income in2006 related to <strong>the</strong> reversal of reserves that were nolonger required in SNSA corporate of $3.7 million.Interest ExpenseInterest expense was lower by $6.2 million or 17.6%.While <strong>the</strong> average level of outstanding debt washigher in 2007, <strong>the</strong> capitalization of interest increasedto $16.5 million in 2007 which was a $12.0 millionincrease from 2006 as a result of <strong>the</strong> tankernewbuilding programme.Interest IncomeInterest income was lower by $1.9 million during2007 due to lower average cash balances during <strong>the</strong>year compared to 2006 when we had received prepaidsales proceeds <strong>for</strong> our investment in Marine Harvestwhich resulted in higher than average cash balances.Our BusinessStolt-Nielsen <strong>An</strong>nual Report 200725
FinancialReviewcontinuedForeign Currency Exchange (Loss) Gain, NetIn 2007, we incurred a <strong>for</strong>eign exchange loss of$10.4 million compared to a gain of $3.5 million in2006. The current year losses related to <strong>the</strong> declinein <strong>the</strong> U.S. dollar, specifically revaluations of <strong>for</strong>eigncurrency loans between related companies withdifferent functional currencies, <strong>the</strong> revaluationof cash balances and <strong>the</strong> revaluation of externalaccounts receivable and payable balances.Loss on Early Retirement of DebtThe loss relates to <strong>the</strong> unamortized costs of <strong>the</strong>$150.0 million terminal loan facility on StolthavenHouston and New Orleans which was refinancedduring <strong>the</strong> third quarter of 2007.Income Tax ProvisionThe income tax provision <strong>for</strong> 2007 was $5.8 millionwhich was a slight increase from <strong>the</strong> prior yearprovision of $5.0 million. The effect on <strong>the</strong>provision <strong>for</strong> taxes on income subject to income taxincreased; however, this was partially offset bybeneficial adjustments to estimates relative to prioryears in 2007.Minority Interest$0.2 million of minority interest relates to <strong>the</strong> startuplosses on <strong>the</strong> Lingang Terminal joint venture.The balance relates to <strong>the</strong> minority interest fromSterling Caviar.Equity in Net Income of Marine Harvest, Gain on Disposalof Marine Harvest and Gain on Sale of Investmentin Discontinued OperationsDuring 2007, we recognized a gain of $42.4 million on<strong>the</strong> sale of our Australian bluefin tuna business and$21.8 million on <strong>the</strong> sale of our investment in MarineHarvest. This completes <strong>the</strong> restructuring of our keybusinesses and we do not expect to receive such incomein 2008. In 2006, we recognized income of $60.8million <strong>for</strong> our 25% share of Marine Harvest.Business Segment Per<strong>for</strong>manceThis section summarizes our operating per<strong>for</strong>mance<strong>for</strong> each of our principal business segments. The“Corporate and O<strong>the</strong>r” category includes corporaterelatedexpenses, and all o<strong>the</strong>r operations notreportable under <strong>the</strong> o<strong>the</strong>r segments.TankersOperating revenueOperating revenue increased by $123.8 millionor 11.6% from 2006 to 2007. This change reflectsincreased trading days and higher COA freightrates <strong>for</strong> <strong>the</strong> Stolt Tankers Joint Service (“STJS”)and <strong>the</strong> regional fleets as a result of <strong>the</strong>continued strong tanker market. O<strong>the</strong>r factorsinclude an $11.3 million decrease in customersettlements from 2006, a $4.8 million increasein bunker surcharge revenue as a result of <strong>the</strong>higher bunker prices and a $6.2 million increasein STJS demurrage revenue as a result ofincreased delays particularly in <strong>the</strong> U.S. Gulf.As of November 30, 2007, Tankers owned and/oroperated 158 ships, representing 2.57 milliondeadweight ton (“dwt”) (2006: 2.55 million dwt).Volumes carried in 2007 were 24.1 million comparedto 24.7 million tonnes in 2006 while total tradingdays in 2007 were 47,960 compared to 47,027 in2006. Trading days increased only slightly primarilydue to <strong>the</strong> timing of drydockings and increasedoffhire of certain time chartered ships.Freight rates during 2007 were on average higherboth in <strong>the</strong> spot market and in our COA. In <strong>the</strong>third and fourth quarter of 2007, <strong>the</strong> spot marketweakened but higher rates on 2006 and 2007 COArenewals and strong COA volumes driven in partby a weaker dollar, limited our exposure to spotmarket fluctuations.Business Segment Per<strong>for</strong>manceFor <strong>the</strong> years ended November 30, 2007 2006(in thousands)Operating Revenue:Tankers $1,189,940 $1,066,107Terminals 103,421 93,792Tank Containers 390,477 351,572Stolt Sea Farm 69,469 48,998Corporate and O<strong>the</strong>r 6,070 4,758Total $1,759,377 $1,565,227Gross Profit:Tankers $221,757 $211,725Terminals 41,388 38,289Tank Containers 82,757 81,010Stolt Sea Farm 30,243 19,741Corporate and O<strong>the</strong>r 3,226 (381)Total $379,371 $350,38426 www.stolt-nielsen.com
Tankers% of STJS netearnings <strong>for</strong><strong>the</strong> year endedNumber Millions November 30,of ships of dwt 2007Stolt Tankers Joint Service:Stolt-Nielsen S.A. (40 owned) 51 1.63 83.0NYK Stolt Tanker S.A 6 0.16 9.5Bibby Pool Partner Limited 1 0.01 2.5Unicorn Lines (Pty) Limited 4 0.10 4.3BW Chartering Limited 2 0.04 0.764 1.94 100.0Time chartered ships 10 0.24Total Stolt Tankers Joint Service 74 2.18Ships in regional services 84 0.39Total 158 2.57Our BusinessOur European regional services expanded <strong>the</strong>irfleets which, combined with increasing freight ratesand strong cargo volumes, delivered good revenueand profit growth. Total regional fleet revenueincreased 21.8% to $204.9 million.The Sailed-In Time-Charter Index is a measure of <strong>the</strong>daily sailed-in rate <strong>for</strong> <strong>the</strong> STJS indexed to <strong>the</strong> rate<strong>for</strong> our fleet during <strong>the</strong> first quarter of 1990. During<strong>the</strong> period of 1990 to 2007, <strong>the</strong> average annualSailed-In Time-Charter Index ranged from a high of1.35 in 1995 to a low of 0.93 in 1999 and averaged1.14 over this period. The average Sailed-In Time-Charter Index <strong>for</strong> 2007 was 1.35 compared to 1.31in 2006. The Sailed-In Time-Charter Index <strong>for</strong> <strong>the</strong>fourth quarter of 2007 was 1.25.We have actively engaged in discussions with anumber of our customers regarding <strong>the</strong> subjectmatter of <strong>the</strong> DOJ and EC anti-trust investigations.We have reached agreements or agreements inprinciple resolving <strong>the</strong> existing and potentialantitrust claims with a majority of our customers,with <strong>the</strong> condition that <strong>the</strong> customer relinquishesall claims arising out of <strong>the</strong> matters that are <strong>the</strong>subject of <strong>the</strong> antitrust investigations. Theseagreements typically affect <strong>the</strong> commercial termsof our contracts with <strong>the</strong> relevant customers. Incertain cases, we have agreed to make up-front cashpayments or guaranteed payments to customers,often in conjunction with rebates. We have madeprovisions against operating revenue totalling $10.6million in 2007 and $21.9 million in 2006, reflectingall such payment terms of settlement agreements,agreements in principle or offers made to customers.In o<strong>the</strong>r cases, we have agreed to future discounts,referred to as rebates, which are subject to amaximum cap and are tied to continuing or additionalbusiness with <strong>the</strong> customer. Potential future rebates,which we do not guarantee, are not charged againstoperating revenue unless <strong>the</strong>y are in consideration<strong>for</strong> settlement of existing or potential antitrust claimsor <strong>the</strong> rebate is earned. The aggregate amount ofpotential future rebates under existing settlementagreements, agreements in principle and offers madeand not recognized is approximately $0.8 million asof November 30, 2007. We expect to earn <strong>the</strong> majorityof <strong>the</strong> operating revenue subject to <strong>the</strong>se rebatesin 2008.Gross ProfitGross profit increased by $10.0 million while grossmargins declined from 19.9% in 2006 to 18.6% in2007. The gross margin decline resulted primarilyfrom higher bunker costs, higher time charter costsdue to higher time charter rates and greater use oftime chartered ships, increased ship managementcosts and <strong>the</strong> weakening of <strong>the</strong> U.S. dollar.Bunker expenses increased by $20.6 million in 2007.The average price of Intermediate Fuel Oil (“IFO”)bunker fuel increased from $300/MT in <strong>the</strong> firstquarter of 2006 to $433/MT in <strong>the</strong> fourth quarter of2007 while <strong>the</strong> average price of IFO bunker fuelpurchased by us during 2007 was approximately$352 per ton compared to $313 per ton in 2006. Theimpact of this price increase was limited throughhedging and bunker surcharge clauses. Bunkersurcharge clauses are included in approximately70% of our COA.Port delays had a significant impact on our resultsparticularly in <strong>the</strong> first half of 2007, causing us totime charter additional tonnage and sublet certaincargos to meet customer commitments. Time chartercosts increased by 18% and sublet expense increasedby 49%.Ship owning costs increased 17% in 2007. Theincrease was driven by increased manning cost dueto wage increases and additional crew trainingand increased maintenance and repair expenses,including drydocking amortization, due to <strong>the</strong>aging of <strong>the</strong> fleet.In addition, <strong>the</strong> weakening of <strong>the</strong> U.S. dollarnegatively impacted margins as almost all of ourtanker revenue is in U.S. dollars and a significantportion of costs, in particular certain crew costs,port expenses and drydocking charges are incurredin non-U.S. dollar currencies.TerminalsOperating RevenueTerminals increased <strong>the</strong>ir revenue by 10.3% in 2007due to increased capacity, improved price realizationand expanded terminal and rail services.Total terminal capacity increased to 4.62 millionbarrels (0.734 million cubic metres) in 2007 fromStolt-Nielsen <strong>An</strong>nual Report 200727
FinancialReviewcontinuedan average of 4.47 million barrels (0.709 millioncubic metres) at <strong>the</strong> end of 2006, an increase of3.4%, while utilization remained stable at anaverage of 98.25% in 2007 and 98.44% in 2006.Revenue increased from additional capacity addedto our Santos terminal in late 2006 which generatedrevenue <strong>for</strong> <strong>the</strong> full year of 2007. Additionally, newtanks were added in Houston and tanks damagedfrom Hurricane Katrina were fully operational <strong>for</strong>all of 2007 at our New Orleans facility.All three terminals were also able to escalate contractstorage rates in connection with contract renewals.In addition to storage revenue, <strong>the</strong> Houston terminalsincreased truck activity while revenue <strong>for</strong> railservices increased by $2.7 million due to increasedrates and utilization as well as to an increase in <strong>the</strong>subleasing business.Gross ProfitGross profit increased by $3.1 million, caused by <strong>the</strong>increase in revenue and partially offset by an increasein operating expenses, while gross margins decreasedto 40.0% from 40.8%. In total, operating expensesincreased by $6.5 million or 11.8% from 2006 to 2007caused by capacity expansions, an increase in tank carhire as a result of increased movements and ratesas well as inflationary salary and benefit increasesand higher property liability insurance expenses.In Santos, we recorded a $1.2 million provision <strong>for</strong>remediation of soil contamination. Offsetting <strong>the</strong>seincreases were reduced utility costs in Houston due tolower volume of steam and reduced rates <strong>for</strong> nitrogen.Tank ContainersOperating RevenueTank Containers’ revenues increased by 11.1%or $38.9 million in 2007 reflecting strong demand<strong>for</strong> tank containers, continued high utilization,additions to our overall capacity and increased rates.In 2007, we handled 87,921 (2006: 81,259) containermovements representing an 8.2% increase over 2006activities. This growth was on <strong>the</strong> back of strongU.S. and European export markets coupled withgrowth in developing markets.Utilization was 76% in 2007, consistent with <strong>the</strong>rate <strong>for</strong> 2006, even with a 10.9% increase in <strong>the</strong>fleet to 21,010 tank containers (2006: 18,944).This was due to strong global market conditionsresulting in increased shipments. Utilization wasenhanced by our focus on positioning tankcontainers <strong>for</strong> future expected shipments.Our rates in <strong>the</strong> North American export marketincreased as a result of strong market conditions andour ability to recover increases in operating expensessuch as bunker fuel surcharges. The average rate alsoincreased as a result of <strong>the</strong> increased activities comingfrom regions where rates are stronger such as <strong>the</strong>U.S. and Europe.Gross ProfitTank Container’s gross profit increased by $1.7million though gross margin fell to 21.2% in 2007from 23.0% in 2006. The gross margin reductionwas due to increased freight costs, mainly causedby increased supplier surcharges. These surcharges,consisting of currency adjustment factors, bunkeradjustment factors and overweight containersurcharges levied by shipping companies <strong>for</strong>trade between Europe and Asia, were passed on tocustomers whenever possible but without a markup.Fur<strong>the</strong>r causes of <strong>the</strong> lower gross margins were<strong>the</strong> weaker U.S. dollar which increased <strong>for</strong>eigndenominatedoperating costs and <strong>the</strong> costs relatedto <strong>the</strong> movement of empty tank containers. Thelatter resulted from changes in shipment volumesinto and out of certain regions resulting in anincrease in empty shipments.Stolt Sea FarmOperating RevenueOperating revenue in 2007 increased by 41.8%or $20.5 million compared to 2006. $6.7 millionof <strong>the</strong> increase was due to <strong>the</strong> acquisitionof Sterling Caviar in December 2006 with <strong>the</strong>remaining increase coming from <strong>the</strong> turbotoperations. The increase in <strong>the</strong> turbot revenuewas caused by higher mortalities of competitors’products, increasing demand of and price <strong>for</strong> ourturbot. The turbot operations which are pricedin Euros also benefited from <strong>the</strong> weak U.S. dollar.Gross ProfitSSF had a gross profit of $30.2 million in 2007while gross margins improved significantly from40.2% in 2006 to 43.5% in 2007. The improvementin <strong>the</strong> gross profit and gross margins of <strong>the</strong> turbotoperation during this period was primarily dueto prices 15% higher than in 2006 as a resultof improved market conditions. Volumes werecomparable with <strong>the</strong> 4,211 tonnes sold in 2007compared to 4,156 in 2006 as our capacity islimited to <strong>the</strong> existing farms, and <strong>the</strong> costs werewell under control with costs per kilo lower by 2%in 2007 compared to 2006 due to <strong>the</strong> better thannormal per<strong>for</strong>mance of our farms during <strong>the</strong>autumn of 2007.Liquidity and Capital ResourcesDuring 2007 we met our liquidity needs througha combination of cash generated from operations,borrowings from commercial banks and salesproceeds from our assets.We generally operate with negative workingcapital, which reflects <strong>the</strong> collection/payment cyclein <strong>the</strong> tanker business where invoicing usuallytakes place at or shortly after loading, whileexpenses are paid within normal business terms.For Tank Containers and Terminals, a normalbusiness operating cycle prevails, while in StoltSea Farms <strong>the</strong> production cycle <strong>for</strong> variousfarmed fish species transpires over several monthsto years; <strong>the</strong>re<strong>for</strong>e, Stolt Sea Farms requiresworking capital to finance inventory.Ships and tank containers can be an importantsource of liquidity as <strong>the</strong>se assets are used to securedebt or can be sold and if needed leased back. Werealized proceeds from <strong>the</strong> sales of ships and o<strong>the</strong>rassets of $12.4 million in 2007 (2006: $23.8 million).28 www.stolt-nielsen.com
Liquidity and Capital ResourcesFor <strong>the</strong> years ended November 30, 2007 2006(in millions)Summary Cash FlowsNet cash provided by operating activities:Income from continuing operations $173.9 $198.0Adjustments to reconcile net income to net cash from operating activities 79.5 29.6Changes in working capital assets and liabilities (47.4) 9.5Payments of drydocking costs (30.1) (18.1)O<strong>the</strong>r (9.6) (4.0)Continuing operations 166.3 215.0Discontinued operations (0.8) 3.0Net cash from operating activities 165.5 218.0Net cash (used in) provided by investing activities:Capital expenditures (234.0) (298.3)Investment in and advances to joint ventures and equity method investees (62.7) (58.0)Proceeds from sales of ships and o<strong>the</strong>r assets 12.4 23.8Proceeds from sale of Marine Harvest and cash contribution to Marine Harvest — 418.3O<strong>the</strong>r 8.0 6.5Continuing operations (276.3) 92.3Discontinued operations 70.2 (0.9)Net cash from investing activities (206.1) 91.4Net cash provided by (used in) financing activities:Increase (decrease) in short-term bank loans 123.4 (28.7)Repayment of long-term debt (55.3) (62.7)Proceeds from issuance of long-term debt 37.0 55.0Dividends paid (59.8) (125.8)Purchase of Treasury Common shares (11.0) (134.1)O<strong>the</strong>r 2.1 1.5Net cash from financing activities – Continuing operations 36.4 (294.8)Effect of exchange rate changes on cash 3.4 0.3Net (decrease) increase in cash and cash equivalents $(0.8) $14.9Our BusinessWe believe that our cash flow from operations andavailable credit facilities will continue to provide<strong>the</strong> cash necessary to satisfy our working capitalrequirements and capital expenditures, as well asto make scheduled debt repayments and satisfy ouro<strong>the</strong>r financial commitments <strong>for</strong> <strong>the</strong> fiscal year 2008.Net Cash Provided by Operating ActivitiesCash flows from operations are derived principallyfrom <strong>the</strong> collection of receivables due fromcustomers. Our cash collections are derived fromCOA and spot contracts <strong>for</strong> tankers, along with<strong>the</strong> collections from customers of tank containers,terminals and sea farms. In 2007, we generatednet cash from operating activities continuingoperations of $166.3 million. This compares with$215.0 million in 2006. The reduction between<strong>the</strong> years is due to an increase in working capitalrequirements due to <strong>the</strong> timing of cash receipts onreceivables and payments on accounts payables aswell as additional drydocking payments in 2007.Net Cash (Used in) Provided by Investing ActivitiesCash flows from net investing activities—continuingoperations used $276.3 million in 2007, comparedto providing $92.3 million in 2006.Significant investing activities during 2007 were(i) capital expenditures of $234.0 million, whichwas $64.3 million lower than 2006 and (ii)investments and advances to non-consolidated jointventures of $62.7 million (primarily investments inShanghai Sinochem—Stolt Shipping Ltd.,Stolthaven Ningbo Co Ltd. and Tianjin LingangStolthaven Jetty Company and advances toOiltanking Stolthaven <strong>An</strong>twerp N.V.), as comparedto $58.0 million in <strong>the</strong> prior year. Offsetting <strong>the</strong>uses of cash were (i) $12.4 million from <strong>the</strong> saleof ships and o<strong>the</strong>r assets and (ii) insuranceproceeds on <strong>the</strong> Hurricane Katrina claim <strong>for</strong>$10.7 million. The 2006 cash flows also benefitedsignificantly from $418.3 million of prepaidproceeds relating to <strong>the</strong> disposal of MarineHarvest in December 2006.Capital asset expenditures by business over <strong>the</strong> lasttwo years are summarized below:For <strong>the</strong> years ended November 30, 2007 2006(in millions)Tankers $139.6 $264.4Terminals 14.9 11.3Tank Containers 74.4 18.4SSF 2.4 2.7Corporate 2.7 1.5Sub-total 234.0 298.3Discontinued Operations — 0.4Total SNSA $234.0 $298.7Stolt-Nielsen <strong>An</strong>nual Report 200729
FinancialReviewcontinuedCapital expenditures <strong>for</strong> <strong>the</strong> year include (a)$93.3 million <strong>for</strong> deposits and progress paymentson seven newbuildings, (b) $14.9 million <strong>for</strong> <strong>the</strong>purchase of <strong>the</strong> M/T Stolt Razorbill, (c) capitalizedinterest of $16.5 million, (d) purchase of 2,300tank containers <strong>for</strong> $35.9 million and (e)repurchase of 2,632 tank containers which werepreviously being leased <strong>for</strong> $32.0 million.Net investing activities—discontinued operationsin 2007 was $70.2 million and represented <strong>the</strong> netproceeds from <strong>the</strong> disposal of <strong>the</strong> Sou<strong>the</strong>rn bluefintuna business.Net Cash Provided by (Used in) Financing ActivitiesNet cash provided by financing activities—continuingoperations totalled $36.4 million in 2007 comparedto net cash used of $294.8 million in 2006.The principal uses of cash <strong>for</strong> financing activitiesin 2007 were (i) $11.0 million <strong>for</strong> <strong>the</strong> purchase ofCommon shares, as compared to $134.1 million in2006, (ii) $59.8 million in dividend payments, ascompared to $125.8 million in 2006 and (iii) $55.3million in repayment of long-term debt, as comparedto $62.7 million in 2006. The significant cash sourcesfrom 2007 financial activities included net proceedsof $37.0 million from <strong>the</strong> refinancing of long-termdebt related to terminal mortgages, as compared toissuances of long-term debt of $55.0 million in 2006,and a $123.4 million increase in short-term loanspayable to banks, as compared to a decrease of shorttermloans payable of $28.7 million in 2006. Theincrease in short-term loans in <strong>the</strong> current year isdue to our use of working capital lines to pay <strong>for</strong>progress payments on our tanker newbuildings. Weexpect to secure long-term financing using <strong>the</strong>seships as collateral upon <strong>the</strong>ir completion which willreduce our short-term loans in <strong>the</strong> future.IndebtednessOur total consolidated debt was $740.4 million and$630.8 million as of November 30, 2007 and 2006,respectively, as set <strong>for</strong>th in <strong>the</strong> table below:2007 2006(in millions)Long-term debt (including current portion) $469.4 $486.2Short-term bank loans 271.0 144.6Total debt $740.4 $630.8As of November 30, 2007, we directly owned 67 shipsand barges having a total net book value of $1,052.9million. Of <strong>the</strong> 67 total ships, 18 ships with a totalnet book value of $139.7 million were unencumberedwhile 49 ships with a total net book value of $913.2million were collateralizing total credit facilities of$1,023.8 million of which $567.0 million was drawndown at year end. As of November 30, 2007, we alsoowned 12,176 unencumbered tank containers (out of21,010 tank containers operated), having a total netbook value of $153.5 million.Short-Term DebtShort-term debt consists of debt obligationsto banks under multi-year revolving creditagreements, uncommitted lines of credit and bankoverdraft facilities. Amounts borrowed pursuant to<strong>the</strong>se facilities bear interest at rates ranging from2.00% to 7.10% <strong>for</strong> 2007 and from 4.84% to 6.57%<strong>for</strong> 2006. The weighted average interest rate was5.8% and 5.4% <strong>for</strong> <strong>the</strong> years ended November 30,2007 and 2006, respectively. Some of <strong>the</strong>se linesare generally payable on demand and can bewithdrawn by <strong>the</strong> banks with short notice.Long-Term DebtLong-term debt consists of debt collateralized bymortgages on our ships and terminals. It doesnot include <strong>the</strong> off-balance sheet arrangementsdiscussed below. Our long-term debt was $469.4million and $486.2 million as of November 30,2007 and 2006, respectively, as set <strong>for</strong>th below:2007 2006(in millions)Long-term debt $469.4 $486.2Less: Current maturities (42.5) (67.3)$426.9 $418.9On July 31, 2007 we entered into a $200 millionseven-year secured term loan and revolving creditagreement with various lending institutionsincluding DnB as administrative and collateralagent. The initial draw down on this facility was$169 million. This amended and restated agreementeffectively refinanced a $150 million five-year facility,which was entered into on August 13, 2004 andamended in July 2005, and provided funding <strong>for</strong>capital expenditures <strong>for</strong> <strong>the</strong> terminals in 2007and 2008. The interest rates on this facilityrange from LIBOR plus 0.60% to LIBOR plus 1.20%depending on <strong>the</strong> level of consolidated indebtednessto consolidated earnings be<strong>for</strong>e interest, taxes,depreciation and amortization (“EBITDA”).As of November 30, 2007 $169 million wasoutstanding on this facility. The remainingavailable amount of $31 million is expectedto be drawn down during 2008 and early 2009.This facility matures on July 31, 2014 withrepayments scheduled to begin on October31, 2010.This facility contains affirmative and negativecovenants, including but not limited to financialcovenants requiring minimum levels of consolidatedtangible net worth, maintenance of a maximum ratioof consolidated debt to consolidated tangible networth of 2.0:1.0 and maintenance of a minimumratio of consolidated EBITDA to consolidated interestexpense of 2.0:1.0. The facility also sets <strong>for</strong>th amongo<strong>the</strong>r things limitations on additional liens on <strong>the</strong>assets of <strong>the</strong> mortgaged properties, limitations onmergers and sales of assets.30 www.stolt-nielsen.com
Contractual ObligationsLess thanMore thanTotal 1 yr. 2-3 yrs. 4-5 yrs. 5 yrs.(in millions)Contractual cash obligations:Long-term debt $469.4 $42.5 $91.9 $129.6 $205.4Operating leases 408.9 171.0 160.7 50.1 27.1Committed capital expenditures 1,438.9 688.7 425.0 325.2 —Customer antitrust related settlement payments 0.8 0.8 — — —Long-term fixed rate debt interest payments 123.2 25.1 43.0 31.1 24.0Long-term variable rate debt interest payments (1) 13.6 3.5 6.2 3.5 0.4Pension obligations (2) 9.1 9.1 — — —O<strong>the</strong>r post-retirement benefit obligations (3) 0.8 0.8 — — —Total contractual cash obligations: $2,464.7 $941.5 $726.8 $539.5 $256.9Our BusinessStolthaven Houston Inc. and Stolthaven New OrleansL.L.C. are <strong>the</strong> borrowers under this facility. SNSA,Stolt Tankers Holdings Ltd and Stolt Tankers B.V.are guarantors of <strong>the</strong> obligations of <strong>the</strong> borrowersunder <strong>the</strong> facility.Contractual ObligationsWe have various contractual obligations, some ofwhich are required to be recorded as liabilities in <strong>the</strong>Consolidated Financial Statements, including longtermdebt and customer antitrust related settlements.Our operating leases, committed capital expenditures,long-term debt interest payments and o<strong>the</strong>r executorycontracts, are not required to be recognized asliabilities on our consolidated balance sheets. As ofNovember 30, 2007, our o<strong>the</strong>r purchase obligationswere not material. The following summarizes oursignificant contractual obligations as of November 30,2007, including those reported in our consolidatedbalance sheet and o<strong>the</strong>rs that are not:(1) Long-term variable rate debt interest paymentsbased on an estimated LIBOR rate of 6.0%.(2) Pension contributions—We have included<strong>the</strong>se amounts based on current estimatesof contribution to <strong>the</strong> pension plans that maybe required. We have not disclosed possiblepayments beyond <strong>the</strong> next 12 months due to<strong>the</strong> significant difficulty in <strong>for</strong>ecasting <strong>the</strong>seamounts with any accuracy.(3) O<strong>the</strong>r post-retirement benefits—We accrue anannual cost <strong>for</strong> <strong>the</strong>se benefit obligations underplans covering current and future retirees inaccordance with generally accepted accountingprinciples. These amounts could differ significantlyfrom <strong>the</strong> estimates <strong>for</strong>ecasted because of changesin Medicare or o<strong>the</strong>r regulations and/or healthcarecosts. We believe it is impossible to make anaccurate prediction of cash requirements <strong>for</strong><strong>the</strong>se obligations beyond <strong>the</strong> next 12 months.We expect to meet our 2008 liquidity needs of $941.5million through a combination of cash generatedfrom operations, borrowings on our short-term bankloans and use of our newbuildings as collateral <strong>for</strong>long-term debt upon <strong>the</strong>ir completion.Off-Balance Sheet ArrangementsIn addition to <strong>the</strong> obligations recorded on ourconsolidated balance sheets, we have certaincommitments and contingencies that may result infuture cash requirements that are not recorded onour consolidated balance sheets. In addition to <strong>the</strong>long-term debt interest payments discussed above,<strong>the</strong>se off-balance sheet arrangements consist ofoperating leases, committed capital expenditures and<strong>the</strong> retained and contingent interests discussed below.Operating LeasesOur operating lease commitments were $408.9 millionas of <strong>the</strong> end of fiscal year 2007, as compared to$437.3 million as of <strong>the</strong> end of fiscal year 2006.As of November 30, 2007, we were obligated to makepayments under long-term operating lease agreements<strong>for</strong> tankers, land terminal facilities, tank containers,barges, computer and office equipment and offices.Certain of <strong>the</strong> leases contain clauses requiringpayments in excess of <strong>the</strong> base amounts to coveroperating expenses related to <strong>the</strong> leased assets.Sale/Leaseback of Three Parcel TankersIn <strong>the</strong> third quarter of fiscal year 2003, we soldthree chemical parcel tankers, with a net book valueof $51.1 million, <strong>for</strong> $50 million in cash proceeds toDr. Peters GmbH. Such tankers were also leasedback, and as of November 30, 2007, we wereobligated to make minimum lease payments under<strong>the</strong> charter hire agreements <strong>for</strong> <strong>the</strong> three tankers of$6.6 million, expiring in 2008.Time Charter of 12 ShipsTo replace ships that may be scrapped or reassignedinto less demanding trading activities because ofage, we have entered into agreements with variousJapanese ship owners <strong>for</strong> time charters <strong>for</strong> 12 shipswith stainless steel tanks. As of November 30, 2007,11 time charters have commenced with one remainingship to be delivered in 2008. The 12 time charters are<strong>for</strong> an initial period of 36 to 96 months and include<strong>the</strong> option <strong>for</strong> us to extend <strong>the</strong> agreements <strong>for</strong> up tonine additional years. We also have <strong>the</strong> option topurchase each ship at predetermined prices at anytime after three years from <strong>the</strong> delivery of <strong>the</strong> ship.The above contractual cash obligation scheduleStolt-Nielsen <strong>An</strong>nual Report 200731
FinancialReviewcontinuedincludes <strong>the</strong> leases as <strong>the</strong>se commitments occurredprior to November 30, 2007. These operating leaseshad commitments <strong>for</strong> <strong>the</strong> initial periods of $170million as of November 30, 2007 <strong>for</strong> <strong>the</strong> period 2008through 2016.Commitments Relating to Disposed TerminalsIn November 2001, we sold our tank storageterminals in Perth Amboy, New Jersey and Chicago,Illinois. The Chicago terminal property was leasedunder a long-term agreement with <strong>the</strong> IllinoisInternational Port District. As part of <strong>the</strong> sale of <strong>the</strong>terminal in Chicago, we assigned our rights under<strong>the</strong> lease to a third party. However, we remaincontingently liable to <strong>the</strong> Illinois International PortDistrict if <strong>the</strong> third party does not return <strong>the</strong> facilityin acceptable condition at <strong>the</strong> end of <strong>the</strong> subleaseperiod, on June 30, 2026. For additional in<strong>for</strong>mation,see Note 24 to <strong>the</strong> Consolidated Financial Statements.Directors’ RemunerationOur six non-executive directors received aggregatefees of $0.5 million plus expenses <strong>for</strong> serving on <strong>the</strong>Board of Directors and various committees during<strong>the</strong> fiscal year ended November 30, 2007. Our twoexecutive directors received compensation of $4.0million <strong>for</strong> <strong>the</strong> same period. Seven of our eightdirectors also received stock option awards inJanuary 2007 with an exercise price of $28.90. Theoptions vest in four years and expire in January2017. The compensation expense recorded <strong>for</strong> <strong>the</strong>stock options was $0.9 million. The Black-Scholes-Merton option pricing model was used to determine<strong>the</strong> fair value of stock options at <strong>the</strong> grant date.International Financial Reporting Standards(“IFRS”) ImplementationSNSA is a Luxembourg registered company and has itslisting on <strong>the</strong> Oslo Børs following its delisting andfuture deregistration from Nasdaq. In line with <strong>the</strong>European Union Directives and <strong>the</strong> requirements of<strong>the</strong> Oslo Børs, SNSA and its subsidiaries will transitionfrom U.S. generally accepted accounting standards(“U.S. GAAP”) to IFRS. The first set of audited IFRSfinancial statements will be issued <strong>for</strong> <strong>the</strong> year endingNovember 30, 2008 along with comparatives <strong>for</strong> 2007under IFRS. Accordingly, <strong>the</strong> financial statementsincluded in this annual report <strong>for</strong> <strong>the</strong> year endedNovember 30, 2007 will be our last set of financialstatements under U.S. GAAP.We have recently completed our IFRS transitionproject and prepared our Opening Balance Sheetunder IFRS on December 1, 2006. We did not identifyany significant adjustments, except <strong>for</strong> <strong>the</strong> following:> Recognition of our biological assets of SSF at fair value underIFRS which will increase <strong>the</strong> value of our biological assets.Currently, under U.S. GAAP, we record such assets at cost.> Recognition of actuarial gains and losses of our definedbenefit plans on our balance sheet and discontinuation of<strong>the</strong> “corridor” approach of amortizing such gains and losses.Critical Accounting EstimatesIn <strong>the</strong> preparation of our financial statements, <strong>the</strong>reare a number of areas where we use assumptionsabout <strong>the</strong> future, management judgements andestimates. Such areas could experience a significantlydifferent outcome should our assumption, judgementand estimates differ from actual results. The key areaswhere estimates and judgements make significantdifferences are:> Voyage revenues and costs in our tanker operations.> Depreciation and impairment of ships.> Tax contingencies.> Pension and post-retirement benefit plans.> Drydocking.> Investments in joint ventures and equity method investees.To obtain a better understanding of our detailedaccounting policies on <strong>the</strong>se areas, please seeNote 2 to <strong>the</strong> financial statements included inthis <strong>An</strong>nual Report.32 www.stolt-nielsen.com
Index to Consolidated Financial StatementsFinancial StatementsConsolidated Financial Statements of Stolt-Nielsen S.A.Independent Auditors’ Report 34Consolidated Statements of Operations <strong>for</strong> <strong>the</strong> years ended November 30, 2007, 2006 and 2005 35Consolidated Balance Sheets as of November 30, 2007, 2006 and 2005 37Consolidated Statements of Shareholders’ Equity <strong>for</strong> <strong>the</strong> years ended November 30, 2007, 2006 and 2005 38Consolidated Statements of Cash Flows <strong>for</strong> <strong>the</strong> years ended November 30, 2007, 2006 and 2005 40Notes to Consolidated Financial Statements 42Stolt-Nielsen <strong>An</strong>nual Report 200733
Independent Auditors’ ReportTo <strong>the</strong> Board of Directors and Stockholders of Stolt-Nielsen S.A.We have audited <strong>the</strong> accompanying consolidated balance sheets ofStolt-Nielsen S.A. and subsidiaries (<strong>the</strong> “Company”) as of November 30,2007 and 2006, and <strong>the</strong> related consolidated statements of operations,shareholders’ equity, and cash flows <strong>for</strong> each of <strong>the</strong> three years in <strong>the</strong>period ended November 30, 2007. These financial statements are <strong>the</strong>responsibility of <strong>the</strong> Company’s management. Our responsibility isto express an opinion on <strong>the</strong>se financial statements based on ouraudits. We did not audit <strong>the</strong> financial statements of Marine Harvest N.V.,<strong>the</strong> Company’s investment in which is accounted <strong>for</strong> by use of <strong>the</strong> equitymethod, <strong>for</strong> <strong>the</strong> year ended December 31, 2006. The Company’s equity of$322.8 million in Marine Harvest N.V.’s net assets at November 30, 2006,and $60.8 million in that company’s net income <strong>for</strong> <strong>the</strong> year <strong>the</strong>n ended areincluded in <strong>the</strong> accompanying financial statements. The financial statementsof Marine Harvest N.V. <strong>for</strong> <strong>the</strong> year ended December 31, 2006 were auditedby o<strong>the</strong>r auditors whose report has been furnished to us, and our opinion,insofar as it relates to <strong>the</strong> amounts included <strong>for</strong> Marine Harvest N.V. as ofand <strong>for</strong> <strong>the</strong> year ended November 30, 2006, is based solely on <strong>the</strong> reportof <strong>the</strong> o<strong>the</strong>r auditors.We conducted our audits in accordance with auditing standards generallyaccepted in <strong>the</strong> United States of America. Those standards require that weplan and per<strong>for</strong>m <strong>the</strong> audit to obtain reasonable assurance about whe<strong>the</strong>r<strong>the</strong> financial statements are free of material misstatement. <strong>An</strong> audit includesconsideration of internal control over financial reporting as a basis <strong>for</strong>designing audit procedures that are appropriate in <strong>the</strong> circumstances,but not <strong>for</strong> <strong>the</strong> purpose of expressing an opinion on <strong>the</strong> effectivenessof <strong>the</strong> Company’s internal control over financial reporting. Accordingly,we express no such opinion. <strong>An</strong> audit also includes examining, on a testbasis, evidence supporting <strong>the</strong> amounts and disclosures in <strong>the</strong> financialstatements, assessing <strong>the</strong> accounting principles used and significantestimates made by management, as well as evaluating <strong>the</strong> overallfinancial statement presentation. We believe that our audits and <strong>the</strong>report of o<strong>the</strong>r auditors provide a reasonable basis <strong>for</strong> our opinion.In our opinion, based on our audits and <strong>the</strong> report of o<strong>the</strong>r auditors asof and <strong>for</strong> <strong>the</strong> year ended November 30, 2006, such consolidated financialstatements present fairly, in all material respects, <strong>the</strong> financial position ofStolt-Nielsen S.A. and subsidiaries as of November 30, 2007 and 2006, and<strong>the</strong> results of <strong>the</strong>ir operations and cash flows <strong>for</strong> each of <strong>the</strong> three yearsin <strong>the</strong> period ended November 30, 2007 in con<strong>for</strong>mity with accountingprinciples generally accepted in <strong>the</strong> United States of America.As discussed in Note 18 to <strong>the</strong> consolidated financial statements, <strong>the</strong>Company changed its method of accounting <strong>for</strong> defined benefit plans toadopt Statement of Financial Accounting Standards No. 158, “Employers’Accounting <strong>for</strong> Defined Benefit Pension and O<strong>the</strong>r Post-retirement Plans –an amendment of FASB Statement No. 87, 88, 106 and 132(R)” wi<strong>the</strong>ffect from November 30, 2007.DELOITTE & TOUCHE LLPLondonFebruary 26, 200834 www.stolt-nielsen.com
Stolt-Nielsen S.A. Consolidated Statements of OperationsFinancial StatementsFor <strong>the</strong> years ended November 30, 2007 2006 2005(in thousands, except per share data)Operating Revenue:Tankers $ 1,189,940 $ 1,066,107 $ 966,155Tank Containers 390,477 351,572 334,286Terminals 103,421 93,792 83,251Stolt Sea Farm 69,469 48,998 231,555Corporate and o<strong>the</strong>r 6,070 4,758 8,7891,759,377 1,565,227 1,624,036Operating Expenses:Tankers 968,183 854,382 738,242Tank Containers 307,720 270,562 267,080Terminals 62,033 55,503 51,579Stolt Sea Farm 39,226 29,257 202,381Corporate and o<strong>the</strong>r 2,844 5,139 6,9181,380,006 1,214,843 1,266,200Gross Profit 379,371 350,384 357,836Equity in net income of non-consolidated joint ventures and equity method investees (Note 4) 21,963 17,536 14,950Administrative and general expenses (213,166) (207,667) (184,511)Restructuring charges (Note 12) (442) (1,761) (7,064)Gain (loss) on disposal of assets, net (Note 11) 3,148 4,091 (606)O<strong>the</strong>r operating income (expense), net 2,082 3,916 (6,003)Operating Income 192,956 166,499 174,602Non-Operating Income (Expense):Interest expense (29,237) (35,468) (47,594)Interest income 5,937 7,816 6,884Foreign currency exchange (loss) gain (10,415) 3,491 (1,443)Loss on early retirement of debt, net (Note 16) (1,011) — (15,110)Income from Continuing Operations be<strong>for</strong>e Income Tax Provision, Minority Interestand Equity in Net Income of Marine Harvest 158,230 142,338 117,339Income tax provision (Note 13) (5,799) (5,025) (7,006)Income from Continuing Operations be<strong>for</strong>e Minority Interest and Equity inNet Income of Marine Harvest 152,431 137,313 110,333Minority interest (303) (85) (55)Equity in net income of Marine Harvest (Note 8) — 60,800 11,300Gain on sale of equity investment in Marine Harvest (Note 8) 21,792 — —Income from Continuing Operations 173,920 198,028 121,578Income from discontinued operations (Note 10) — 1,887 5,559Gain on sale of investment in discontinued operations (Note 10) 42,443 — 355,882Net Income $ 216,363 $ 199,915 $ 483,019See notes to consolidated financial statements.Stolt-Nielsen <strong>An</strong>nual Report 200735
Stolt-Nielsen S.A.ConsolidatedStatements of OperationscontinuedFor <strong>the</strong> years ended November 30, 2007 2006 2005(in thousands, except per share data)Income per Common Share (Note 2):BasicIncome from continuing operations $ 2.92 $ 3.18 $ 1.87Income from discontinued operations — 0.03 0.09Gain on sale of investment in discontinued operations 0.71 — 5.49Net Income per Common share $ 3.63 $ 3.21 $ 7.45DilutedIncome from continuing operations $ 2.89 $ 3.15 $ 1.84Income from discontinued operations — 0.02 0.08Gain on sale of investment in discontinued operations 0.71 — 5.37Net Income per Common share $ 3.60 $ 3.17 $ 7.29Weighted Average Number of Common Shares and Common Share Equivalents Outstanding (Note 2):Basic 59,526 62,243 64,864Diluted 60,122 62,927 66,218See notes to consolidated financial statements.36 www.stolt-nielsen.com
Stolt-Nielsen S.A. Consolidated Balance SheetsFinancial StatementsAs of November 30, 2007 2006(in thousands, except <strong>for</strong> share data)ASSETSCurrent Assets:Cash and cash equivalents $ 43,722 $ 44,502Trade receivables (net of allowance <strong>for</strong> doubtful accounts of $9,982 in 2007 and $7,260 in 2006) 163,055 131,870Inventories (Note 14) 26,831 17,492Receivables from related parties (Note 7) 4,801 4,357Restricted cash deposits 5,370 —Prepaid expenses 46,478 56,805Assets held <strong>for</strong> sale 3,500 —O<strong>the</strong>r current assets 19,001 11,053Total Current Assets 312,758 266,079Fixed assets, at cost:Tankers 2,109,809 2,086,531Deposits <strong>for</strong> tankers under construction 286,298 193,165Tank containers 245,201 162,566Terminals 358,150 337,096Stolt Sea Farm 52,899 53,031Corporate and o<strong>the</strong>r 44,357 38,9783,096,714 2,871,367Less—accumulated depreciation (1,271,944) (1,199,108)Fixed assets, net 1,824,770 1,672,259Investments in and advances to non-consolidated joint ventures and equity method investees (Note 4) 246,719 147,564Investment in and loan to Marine Harvest (Note 8) — 322,823Deferred income tax assets, net of valuation allowances (Note 13) 6,720 3,720Goodwill and o<strong>the</strong>r intangible assets, net (Note 9) 851 24,101O<strong>the</strong>r assets 83,862 77,403Total Assets $ 2,475,680 $ 2,513,949LIABILITIES AND SHAREHOLDERS’ EQUITYCurrent Liabilities:Short-term bank loans (Note 15) $ 270,993 $ 144,600Current maturities of long-term debt and capital leases (Note 16) 42,495 67,301Accounts payable 64,496 50,638Accrued voyage expenses 75,655 64,205Accrued expenses 148,132 155,928Prepayment proceeds on sale of Marine Harvest (Note 8) — 353,450O<strong>the</strong>r current liabilities 17,734 28,166Total Current Liabilities 619,505 864,288Long-term debt and capital leases (Note 16) 426,942 418,875Deferred income tax liabilities (Note 13) 7,317 13,268O<strong>the</strong>r liabilities 56,506 44,672Minority interest 10,928 292Commitments and contingencies (Notes 24 and 25)Shareholders’ Equity (Note 19):Founder’s shares: no par value—16,250,000 shares authorized, (2006: 17,250,000), 16,033,449issued in 2007 and 16,520,364 issued in 2006, less 1,145,058 Treasury shares in 2007 and 1,696,310 in 2006 — —Common shares: stated $1—65,000,000 shares authorized, (2006: 69,000,000), 64,133,796 shares issuedin 2007, and 66,081,456 shares issued in 2006 64,134 66,081Paid-in surplus 341,209 356,906Retained earnings 1,053,995 936,553Accumulated o<strong>the</strong>r comprehensive income, net (Note 2) 28,806 10,9231,488,144 1,370,463Less—Treasury stock, at cost, 4,580,233 Common shares in 2007 and 6,785,240 in 2006 (133,662) (197,909)Total Shareholders’ Equity 1,354,482 1,172,554Total Liabilities and Shareholders’ Equity $ 2,475,680 $ 2,513,949See notes to consolidated financial statements.Stolt-Nielsen <strong>An</strong>nual Report 200737
Stolt-Nielsen S.A. Consolidated Statements of Shareholders’ EquityAccumulatedO<strong>the</strong>rComprehensive ComprehensiveCapital Paid-in Treasury Retained Income IncomeStock Surplus Stock Earnings (Loss), Net (Loss) Total(in thousands, except <strong>for</strong> share data)Balance, November 30, 2004 $ 63,377 $ 311,016 — $ 523,368 $ (14,468) — $ 883,293Exercise of stock options <strong>for</strong>2,362,804 Common shares 2,363 30,689 — — — — 33,052Issuance of 590,701 Founder’s shares — — — — — — —Purchase of Treasury Common shares—1,611,650 shares — — (54,835) — — — (54,835)Purchase of Treasury Founder’s shares—402,913 shares — — — — — — —Stock-based compensation — 1,227 — — — — 1,227Cash dividends paid—$2.00per Common share — — — (130,984) — — (130,984)Cash dividends paid—$0.005per Founder’s share — — — (82) — — (82)Net income — — — 483,019 — $ 483,019 483,019O<strong>the</strong>r comprehensive income(loss):Translation adjustments, net — — — — 7,182 7,182 7,182Minimum pension liability adjustments,net of tax benefit of $1,039 — — — — (2,969) (2,969) (2,969)Net losses on cash flow hedgesreclassified into earnings — — — — (5,841) (5,841) (5,841)O<strong>the</strong>r comprehensive loss, net (1,628)Comprehensive income $ 481,391Balance, November 30, 2005 $ 65,740 $ 342,932 $ (54,835) $ 875,321 $ (16,096) $ 1,213,062Cumulative effect adjustment <strong>for</strong>adoption of SAB 108, net of tax — — — (12,914) — — (12,914)Exercise of stock options <strong>for</strong>341,892 Common shares 341 3,629 — — — — 3,970Issuance of 85,473 Founder’s shares — — — — — — —Purchase of Treasury Common shares—5,173,590 shares — — (143,074) — — — (143,074)Purchase of Treasury Founder’s shares—1,293,397 shares — — — — — — —Stock-based compensation — 10,345 — — — — 10,345Cash dividends paid—$2.00per Common share (a) — — — (125,688) — — (125,688)Cash dividends paid—$0.005per Founder’s shares (b) — — — (81) — — (81)Net income — — — 199,915 — $ 199,915 199,915O<strong>the</strong>r comprehensive income(loss):Translation adjustments, net — — — — 17,928 17,928 17,928Minimum pension liability adjustments,net of tax benefit of $1,686 — — — — 4,413 4,413 4,413Net gains on cash flow hedgesreclassified into earnings — — — — 4,678 4,678 4,678O<strong>the</strong>r comprehensive income, net 27,019Comprehensive income $ 226,934Balance, November 30, 2006 $ 66,081 $ 356,906 $ (197,909) $ 936,553 $ 10,923 $ 1,172,55438 www.stolt-nielsen.com
Financial StatementsAccumulatedO<strong>the</strong>rComprehensive ComprehensiveCapital Paid-in Treasury Retained Income IncomeStock Surplus Stock Earnings (Loss), Net (Loss) TotalExercise of stock options<strong>for</strong> 52,340 Common shares 53 522 — — — — 575Exercise of stock options<strong>for</strong> 272,007 Treasury shares — (4,731) 7,938 — — — 3,207Cancellation of 2,000,000Common shares held in treasury (2,000) (18,500) 58,365 (37,865) — — —Stock-based compensation — 5,217 — — — — 5,217Disposal of Sou<strong>the</strong>rn bluefin tuna business — 1,795 — (1,272) — — 523Purchase of Treasury Common shares—67,000 shares — — (2,056) — — — (2,056)Cash dividends paid—$1.00per Common share (c) — — — (59,709) — — (59,709)Cash dividends paid—$0.005per Founder’s shares (d) — — — (75) — — (75)Net income — — — 216,363 — $ 216,363 216,363O<strong>the</strong>r comprehensive income(loss):Translation adjustments, net — — — — 30,743 30,743 30,743Minimum pension liability adjustments,net of tax benefit of $756 — — — — (4,339) (4,339) (4,339)FAS 158 translation adjustment,net of tax benefit of $3,578 — — — — (3,096) — (3,096)Net gains on cash flow hedgesreclassified into earnings — — — — (5,425) (5,425) (5,425)O<strong>the</strong>r comprehensive income, net 20,979Comprehensive income $ 237,342Balance, November 30, 2007 $ 64,134 $ 341,209 $ (133,662) $ 1,053,995 $ 28,806 $ 1,354,482(a) The $125.7 million is inclusive of <strong>the</strong> 2005 final dividend of $61.4 million and <strong>the</strong> 2005 interim dividend of $64.3 million.(b) The $0.1 million is <strong>the</strong> 2005 interim dividend.(c) The $59.7 million is inclusive of <strong>the</strong> 2006 final dividend of $29.8 million and <strong>the</strong> 2006 interim dividend of $29.9 million.(d) The $0.1 million is <strong>the</strong> 2006 interim dividend.Accumulated O<strong>the</strong>r Comprehensive Income, net as of November 30, 2007 and 2006 consisted of <strong>the</strong> following:2007 2006(in thousands)Cumulative translation adjustments, net $ 45,502 $ 14,759Defined benefit pension adjustments, net of tax of $4,334 (12,067) (4,632)Net unrealized (loss) gain on cash flow hedges (4,629) 796Total accumulated o<strong>the</strong>r comprehensive income, net of tax $ 28,806 $ 10,923See notes to consolidated financial statements.Stolt-Nielsen <strong>An</strong>nual Report 200739
Stolt-Nielsen S.A. Consolidated Statements of Cash FlowsFor <strong>the</strong> years ended November 30, 2007 2006 2005(in thousands)Cash Flows from Operating Activities:Net income $ 216,363 $ 199,915 $ 483,019Less—income related to discontinued operations (42,443) (1,887) (361,441)Income from continuing operations 173,920 198,028 121,578Adjustments to reconcile net income to net cash from operating activities:Depreciation of fixed assets 98,718 96,067 96,339Amortization of o<strong>the</strong>r intangible assets 30 25 3Amortization of debt issuance costs 1,334 1,194 1,280Loss on early retirement of debt—non cash 1,011 — 778Amortization of drydock costs 16,471 13,758 10,771Net periodic benefit costs of defined benefit pension plans 6,680 8,480 10,441Insurance claims recognized (1,448) (3,042) —Provisions <strong>for</strong> reserves and deferred taxes (8,068) (21,325) (10,227)Equity in net income of non-consolidated joint ventures and equity method investees (21,963) (17,536) (14,950)Equity in net income of Marine Harvest — (60,800) (11,300)Gain on sale of equity investment in Marine Harvest (21,792) — —Minority interest 303 85 55Foreign currency related losses 6,125 6,451 1,359(Gain) loss on disposal of assets, net (3,148) (4,090) 606Stock-based compensation expense 5,217 10,345 1,227Changes in assets and liabilities, net of effect of acquisitions and divestitures:(Increase) decrease in trade receivables (33,272) 1,956 (8,445)(Increase) decrease in inventories (496) 342 28,621Decrease (increase) in prepaid expenses and o<strong>the</strong>r current assets 3,430 (24,564) 7,557(Decrease) increase in accounts payable and o<strong>the</strong>r current liabilities (17,015) 31,780 33,778Payments of drydock costs (30,147) (18,079) (2,580)Contributions to defined benefit pension plans (10,258) (9,699) (24,923)Insurance proceeds from business interruption claims 622 1,100 —Dividends from non-consolidated joint ventures 1,483 3,279 5,853O<strong>the</strong>r, net (1,460) 1,208 4,584Net cash provided by operating activities—Continuing operations 166,277 214,963 252,405Net cash (used in) provided by operating activities—Discontinued operations (797) 3,071 (23,210)Net cash provided by operating activities 165,480 218,034 229,195Cash flows from investing activities, net of effect of acquisitions and investments:Capital expenditures (234,004) (298,338) (158,321)Proceeds from sales of ships and o<strong>the</strong>r assets 12,383 23,796 9,335Cash settlement of hedges — 2,478 —Investment in joint ventures and equity method investees (Note 4) (32,148) (58,736) (4,900)Advances (to) from joint ventures and equity method investees (Note 4) (30,504) 711 (2,522)Acquisition of Sterling Caviar, net of cash acquired (Note 6) (1,594) — —Proceeds from sale of Marine Harvest (Note 8) — 353,450 —Proceeds from shareholder loan to Marine Harvest (Note 8) — 64,877 —Cash contribution to Marine Harvest (Note 8) — — (19,314)(Increase) decrease in restricted cash deposits (1,554) 14 (271)(Increase) decrease in long-term loans and advances to employees and officers (Note 7) (100) — 4,758Insurance proceeds from loss of assets claims 10,655 1,942 —O<strong>the</strong>r, net 548 2,060 1,756Net cash (used in) provided by investing activities—Continuing operations (276,318) 92,254 (169,479)Net cash provided by (used in) investing activities—Discontinued operations 70,197 (892) 492,107Net cash (used in) provided by investing activities (206,121) 91,362 322,62840 www.stolt-nielsen.com
Financial StatementsFor <strong>the</strong> years ended November 30, 2007 2006 2005(in thousands)Cash flows from financing activities:Increase (decrease) in short-term bank loans, net (Note 15) 123,357 (28,749) (119,146)Repayment of long-term debt (Note 16) (55,316) (62,670) (418,023)Principal payments under capital lease obligations (370) — —Proceeds from issuance of long-term debt (Note 16) 37,000 55,000 100,000Debt issuance costs (1,206) (2,436) (2,945)Proceeds from exercise of stock options 3,782 3,970 33,052Purchase of Treasury Common shares (11,024) (134,106) (54,835)Dividends paid (59,784) (125,768) (131,066)Net cash provided by (used in) financing activities—Continuing operations 36,439 (294,759) (592,963)Effect of exchange rate changes on cash 3,422 278 (720)Net (decrease) increase in cash and cash equivalents (780) 14,915 (41,860)Cash and cash equivalents at beginning of year 44,502 29,587 71,447Cash and cash equivalents at end of year $ 43,722 $ 44,502 $ 29,587Cash paid <strong>for</strong> interest and income taxes was as follows:For <strong>the</strong> years ended November 30, 2007 2006 2005(in thousands)Interest, including amounts capitalized $ 46,036 $ 30,833 $ 47,034Income taxes $ 13,478 $ 10,269 $ 8,513The Company capitalized $16.5 million, $4.5 million and $1.3 million of interest <strong>for</strong> <strong>the</strong> years ended November 30, 2007, 2006 and 2005, respectively.See notes to consolidated financial statements.Stolt-Nielsen <strong>An</strong>nual Report 200741
Stolt-Nielsen S.A. Notes to Consolidated Financial Statements1. The CompanyStolt-Nielsen S.A. (“SNSA”), a Luxembourg company and its subsidiaries(collectively, <strong>the</strong> “Company”) is engaged in <strong>the</strong> transportation businesswhich includes <strong>the</strong> tankers, tank containers and terminals divisions whichcomprise <strong>the</strong> worldwide transportation, storage, and distribution of bulkliquidchemicals, edible oils, acids, and o<strong>the</strong>r specialty liquids.The Company is also engaged in <strong>the</strong> seafood business, which is carried outthrough Stolt Sea Farm Holdings (“SSF”), and produces, processes and marketsturbot, sturgeon, caviar and sole. In December 2006, <strong>the</strong> Company completed<strong>the</strong> sale of its 25% share of equity investment in Marine Harvest N.V.,(“Marine Harvest”). See Note 8 <strong>for</strong> fur<strong>the</strong>r details.The Company owned an offshore contracting business carried out throughStolt Offshore S.A. (“SOSA”), an offshore contractor to <strong>the</strong> oil and gasindustry, specializing in technologically sophisticated deepwater engineering,flowline and pipeline lay, construction, inspection and maintenance services.The Company sold its remaining ownership interest in SOSA in January 2005.See Note 10, “Discontinued Operations” <strong>for</strong> fur<strong>the</strong>r discussion.On December 18, 2006, SSF completed <strong>the</strong> sale of its Sou<strong>the</strong>rn bluefin tunabusiness, based in Port Lincoln, Australia, to SAMS Holdings (SA) Pty. Ltd.<strong>for</strong> proceeds totalling AUS $90.0 million (approximately $70.2 million atprevailing exchange rates). SSF recognized a gain of approximately$42.4 million on <strong>the</strong> transaction in <strong>the</strong> first quarter of 2007, see Note 10<strong>for</strong> fur<strong>the</strong>r discussion.The Company’s Common shares traded in <strong>the</strong> <strong>for</strong>m of American DepositaryShares (“ADS”) (each ADS representing one Common share) in <strong>the</strong> US onNasdaq. On April 19, 2007, <strong>the</strong> Company announced its intention tovoluntarily delist from <strong>the</strong> Nasdaq Global Select Market, to be effectiveas of <strong>the</strong> close of trading on May 21, 2007, and to terminate its AmericanDepositary Receipt programme.The Company also intends to file a Form 15F with <strong>the</strong> SEC to terminate itsregistration and reporting obligations under <strong>the</strong> Securities Exchange Act assoon as it becomes eligible to do so. The Company will maintain its listingin Nor<strong>way</strong> on <strong>the</strong> Oslo Børs.2. Significant Accounting PoliciesUse of EstimatesThe preparation of financial statements in con<strong>for</strong>mity with accountingprinciples generally accepted in <strong>the</strong> United States of America (“U.S. GAAP”)requires management to make estimates and assumptions that affect <strong>the</strong>reported amounts of assets and liabilities and disclosures of contingentassets and liabilities as of <strong>the</strong> dates of <strong>the</strong> financial statements and reportedamounts of revenues and expenses during <strong>the</strong> year. Management makescertain estimates and judgements, including those related to tanker voyageaccounting, container move cost estimates, future drydock dates, inventoriesand fish mortality, <strong>the</strong> carrying value of non-consolidated joint ventures, <strong>the</strong>selection of useful lives <strong>for</strong> tangible fixed and finite-lived intangible assets,expected future cash flows from long-lived assets to support impairmenttests, provisions necessary <strong>for</strong> trade receivables, income tax valuationallowances, provisions <strong>for</strong> legal disputes, restructuring costs, pensionbenefits, and contingencies. Management bases its estimates and judgementson historical experience and on various o<strong>the</strong>r factors that are believed to bereasonable under <strong>the</strong> circumstances, <strong>the</strong> results of which <strong>for</strong>m <strong>the</strong> basis <strong>for</strong>making judgements about <strong>the</strong> carrying values of assets and liabilities thatare not readily apparent from o<strong>the</strong>r sources. Actual results may materiallydiffer from <strong>the</strong>se estimates.Principles of ConsolidationThe consolidated financial statements include <strong>the</strong> accounts of <strong>the</strong> Companyand all o<strong>the</strong>r entities that are more than 50% owned by <strong>the</strong> Company, exceptwhere <strong>the</strong> Company’s control over <strong>the</strong> operations is limited by significantparticipating interests held by o<strong>the</strong>r parties. In addition, <strong>the</strong> Companyconsolidates variable interest entities (“VIEs”) <strong>for</strong> which <strong>the</strong> Company isdetermined to be a primary beneficiary, if any. See Note 5 <strong>for</strong> VIEs where<strong>the</strong> Company is not <strong>the</strong> primary beneficiary.A controlling financial interest in a VIE is present when an enterprise hasa variable interest that will absorb a majority of <strong>the</strong> VIE’s expected losses,receive a majority of <strong>the</strong> VIE’s expected residual returns, or both.The equity method of accounting is used when <strong>the</strong> Company has a 20%to 50% interest in o<strong>the</strong>r entities, including joint ventures (“equity methodinvestees”). Under <strong>the</strong> equity method, original investments are recorded atcost and adjusted by <strong>the</strong> Company’s share of undistributed earnings or lossesof <strong>the</strong>se entities determined in accordance with U.S. GAAP. The Companyaccrues losses in excess of its investment basis when <strong>the</strong> Company iscommitted to provide ongoing financial support to <strong>the</strong> equity investees.All material intercompany balances are eliminated on consolidation ofsubsidiaries and consolidated VIEs.Impairment of Investments in Non-consolidated Equity MethodInvestees and Joint VenturesThe Company reviews its investments in non-consolidated equity methodinvestees and joint ventures periodically to assess whe<strong>the</strong>r <strong>the</strong>re is an “o<strong>the</strong>rthan temporary” decline in <strong>the</strong> fair value of <strong>the</strong> investment in accordancewith Accounting Principles Board (“APB”) Opinion No. 18, The Equity Methodof Accounting <strong>for</strong> Investments (“APB Opinion No. 18”). If <strong>the</strong> decline is“o<strong>the</strong>r than temporary” an impairment charge is recognized. In making thisdetermination, <strong>the</strong> Company considers, among o<strong>the</strong>r things, its ability andintent to hold <strong>the</strong> investment <strong>for</strong> a period of time sufficient to allow <strong>for</strong> ananticipated recovery as well as <strong>the</strong> severity and duration of <strong>the</strong> decline invalue. If <strong>the</strong> loss in value is determined to be o<strong>the</strong>r than temporary, <strong>the</strong>amount of <strong>the</strong> impairment is measured as <strong>the</strong> difference between <strong>the</strong>carrying value and <strong>the</strong> fair value of <strong>the</strong> asset.Sale of Stock by SubsidiariesThe Company’s policy is to record gains and losses on sales of stock by itssubsidiaries in <strong>the</strong> consolidated statements of operations, net of <strong>the</strong> reductionin its economic interest in <strong>the</strong> subsidiary, unless realization of <strong>the</strong> gain isuncertain at <strong>the</strong> time of <strong>the</strong> sale.Revenue RecognitionThe Company reports its operating revenue on a gross basis with regard to anyrelated expenses in accordance with Emerging Issues Task Force (“EITF”) IssueNo. 99-19, “Reporting Revenue Gross as a Principal versus Net as an Agent”,<strong>for</strong> each of <strong>the</strong> businesses.Tankers: The operating results of voyages in progress at <strong>the</strong> end of eachreporting period are estimated and pro-rated on a per day basis <strong>for</strong> inclusionin <strong>the</strong> consolidated statements of operations. The consolidated balance sheetsreflect <strong>the</strong> deferred portion of revenues and expenses on voyages in progressat <strong>the</strong> end of each reporting period as applicable to <strong>the</strong> subsequent period.Deferred revenues are included in “Accrued Voyage Expenses” in <strong>the</strong>consolidated balance sheets.Tankers operates <strong>the</strong> Stolt Tankers Joint Service (<strong>the</strong> “Joint Service”), anarrangement in which it provides <strong>the</strong> coordinated marketing, operation, andadministration of deep-sea intercontinental parcel tankers owned or charteredby Tankers. Certain ships that are not owned by Tankers are time charteredunder operating leases by Tankers from participants in <strong>the</strong> Joint Service.42 www.stolt-nielsen.com
Financial StatementsThe time charter expense is calculated based upon <strong>the</strong> combined operatingrevenue of <strong>the</strong> ships which participate in <strong>the</strong> Joint Service less combinedvoyage expenses, overhead costs, and commissions to outside brokers andupon each ship’s cargo capacity, its number of operating days during <strong>the</strong>period, and its assigned earnings factor.Tank Containers: Revenues <strong>for</strong> Tank Containers relate primarily to short-termshipments, with <strong>the</strong> freight revenue and estimated expenses recognized when<strong>the</strong> tanks are shipped, based upon agreed rates. Additional miscellaneousrevenues earned from o<strong>the</strong>r sources are recognized after completion of<strong>the</strong> shipment.Terminals: Revenues <strong>for</strong> terminal operations primarily consist of rentalincome <strong>for</strong> <strong>the</strong> utilization of storage tanks by customers, with <strong>the</strong> majorityof rental income earned under long-term contracts. These contracts generallyprovide <strong>for</strong> fixed rates <strong>for</strong> <strong>the</strong> use of <strong>the</strong> storage tanks and/or <strong>the</strong> throughputof products through <strong>the</strong> terminal facility. Revenues are also earned undershort-term agreements contracted at spot rates. Revenue is recognized over<strong>the</strong> time period of usage, or upon completion of specific throughputmeasures, as specified in <strong>the</strong> contracts.SSF: SSF recognizes revenue based on <strong>the</strong> terms of sale. Where <strong>the</strong> termsof sale are free on board processing plant, revenue is recognized on dispatchof products to customers. Revenue is recognized on delivery of products tocustomers, where <strong>the</strong> terms of sale are cost, insurance and freight anddelivered duty paid. The amount recorded as revenue includes all amountsinvoiced according to <strong>the</strong> terms of sale, including shipping and handlingcosts billed to customers, and after deductions <strong>for</strong> claims or returns of goods,rebates and allowances against <strong>the</strong> price of goods, and doubtful debtprovisions and write-offs.Operating ExpensesTankers: Tankers operating expenses include costs directly associated with <strong>the</strong>operation and maintenance of <strong>the</strong> parcel tankers. These types of costs includetime charter costs, bunker fuel costs, port costs, manning costs (<strong>for</strong> example,ship personnel and benefits), depreciation expense, sublet costs, repairs andmaintenance of tankers, commission expenses, transshipments, drydockexpenses, insurance premiums and o<strong>the</strong>r operating expenses (<strong>for</strong> example,voyage costs, barging expenses, provisions, ship supplies, cleaning, cargosurvey costs and <strong>for</strong>eign exchange hedging costs).Tank Containers: Operating expenses of Tank Containers consist of costsdirectly associated with <strong>the</strong> operation and maintenance of <strong>the</strong> tankcontainers. These types of costs include ocean and inland freight charges,short-term tank rental expenses, cleaning and survey costs, additional costs(services purchased and charged through to customers), maintenance andrepair costs, storage costs, insurance premiums, depreciation expense ando<strong>the</strong>r operating expenses (<strong>for</strong> example, depot expenses, agency fees andrefurbishing costs).Terminals: Operating expenses of terminals consist of costs directlyassociated with <strong>the</strong> operation and maintenance of <strong>the</strong> terminals. These typesof costs include labour and benefit costs, depreciation expense, utilities, railcar hire expenses, real estate taxes <strong>for</strong> sites, maintenance and repair costs,regulatory expenses, disposal costs, storage costs and o<strong>the</strong>r operatingexpenses (<strong>for</strong> example, throughput charges, survey costs, cleaning, line haul,rail costs and tank car hire costs).SSF: SSF operating expenses include production cost of goods sold (“PCOGS”),which are costs incurred <strong>for</strong> <strong>the</strong> production of juvenile fish and <strong>the</strong>subsequent growing of juvenile fish into adult fish ready <strong>for</strong> market. ThesePCOGS include costs to produce eggs <strong>for</strong> fertilization, on-site labour/personnelcosts, feed costs, energy costs, contract grower fees, repairs and maintenancecosts, oxygen costs, and veterinary fees. O<strong>the</strong>r costs included withinoperating expenses are costs of fish purchased from third parties, freight coststo customers, all primary and secondary processing and packaging costs,distribution and handling costs, storage, import duties, inventory writedowns, lower of cost or market provisions and mortality losses.Recognition of Provisions <strong>for</strong> Legal Claims, Suits and ComplaintsThe Company, in <strong>the</strong> ordinary course of business, is subject to various claims,suits and complaints. Management, in consultation with internal and externallegal counsel, provides <strong>for</strong> a contingent loss in <strong>the</strong> consolidated financialstatements if <strong>the</strong> condition existed as of <strong>the</strong> date of <strong>the</strong> consolidatedfinancial statements and future events confirming <strong>the</strong> existence of <strong>the</strong>contingency are probable and can be reasonably estimated. In accordancewith Statement of Financial Accounting Standards (“SFAS”) No. 5, “Accounting<strong>for</strong> Contingencies”, as interpreted by <strong>the</strong> Financial Accounting StandardsBoard (“FASB”) Interpretation No. 14, “Reasonable Estimation of <strong>the</strong> Amountof a Loss”, if management has determined that <strong>the</strong> reasonable estimate of<strong>the</strong> loss is a range and that <strong>the</strong>re is no best estimate within that range,<strong>the</strong> Company will provide <strong>the</strong> lower amount of <strong>the</strong> range.Drydocking CostsGenerally, <strong>the</strong> Company’s tanker operations drydock <strong>the</strong>ir ships every five years.After a ship is 15 years old a shipping society classification intermediatesurvey is per<strong>for</strong>med between <strong>the</strong> second and third year of <strong>the</strong> five-yeardrydocking period. The Company capitalizes a substantial portion of <strong>the</strong> costsincurred during drydocking and <strong>for</strong> <strong>the</strong> survey and amortizes those costs on astraight-line basis from <strong>the</strong> time of completion of a drydocking or intermediatesurvey to <strong>the</strong> estimated completion of <strong>the</strong> next drydocking. The Companyexpenses costs related to routine repairs and maintenance incurred duringdrydocking that do not improve or extend <strong>the</strong> useful lives of <strong>the</strong> assets.When significant drydocking expenditures occur prior to <strong>the</strong> expiration of<strong>the</strong> original amortization period, <strong>the</strong> remaining unamortized balance of <strong>the</strong>original drydocking cost and any unamortized survey costs are expensedin <strong>the</strong> month of <strong>the</strong> subsequent drydocking. The unamortized portion was$45.1 million <strong>for</strong> 2007 (2006: $30.5 million) and is deferred in “O<strong>the</strong>r Assets”.<strong>An</strong> amount of $31.9 million has been capitalized during 2007. Maintenanceand repair costs, <strong>the</strong> amortization of <strong>the</strong> costs of ship surveys, drydock costsand renewals of tank coatings are included in “Operating Expenses”.DepreciationFixed assets are recorded at cost. Assets acquired pursuant to capital leasesare capitalized at <strong>the</strong> present value of <strong>the</strong> underlying lease obligations anddepreciated on <strong>the</strong> same basis as fixed assets described below unless <strong>the</strong>term of <strong>the</strong> lease is shorter.Depreciation of fixed assets is recorded on a straight-line basis over <strong>the</strong>useful lives of <strong>the</strong> assets as follows:YearsParcel tankers and barges 20 to 25Tank containers 20Terminal facilitiesTanks and structures 30 to 40O<strong>the</strong>r support equipment 5 to 35SSFTransportation equipment 5 to 10Operating equipment 4 to 10Buildings 20 to 40O<strong>the</strong>r assets 2 to 10Corporate buildings 30 to 50Stolt-Nielsen <strong>An</strong>nual Report 200743
Financial StatementsCosts are charged to operations as <strong>the</strong> fish are harvested and sold, basedon <strong>the</strong> accumulated costs capitalized into inventory at <strong>the</strong> start of <strong>the</strong>month of harvesting, and in proportion to <strong>the</strong> number of fish or biomass offish harvested as a proportion of <strong>the</strong> total at <strong>the</strong> start of that same month.Harvesting, processing, packaging and freight costs, which comprise mostof <strong>the</strong> remaining operating expenses, are expensed in <strong>the</strong> month in which<strong>the</strong>y are incurred.Tank Container inventory consists of parts <strong>for</strong> repairing and refurbishing tankcontainers and Flexibags. Flexibags are large, disposable polyethylene, rubberor <strong>the</strong>rmo-plastic bags that fit inside a standard 20-foot dry box container andcan be used to transport non-hazardous and food grade products.Inventories are measured at <strong>the</strong> lower of cost and market.Foreign Currency Translation and TransactionsSNSA, incorporated in Luxembourg, has U.S. dollar share capital and dividendsare expected to be paid in U.S. dollars. SNSA’s reporting currency is <strong>the</strong>U.S. dollar.The Company translates <strong>the</strong> financial statements of its non-U.S. subsidiariesinto U.S. dollars from <strong>the</strong>ir functional currencies (usually local currencies) inaccordance with <strong>the</strong> provisions of SFAS No. 52, “Foreign Currency Translation”(“SFAS No. 52”).Under SFAS No. 52, assets and liabilities denominated in <strong>for</strong>eign currenciesare translated at <strong>the</strong> exchange rates in effect at <strong>the</strong> balance sheet date.Revenues and expenses are translated at exchange rates which approximate<strong>the</strong> average rate prevailing during <strong>the</strong> year.The resulting translation adjustments are recorded in a separate component of“Accumulated o<strong>the</strong>r comprehensive income, net” as “Translation adjustments,net” in <strong>the</strong> consolidated statements of shareholders’ equity.Exchange gains and losses resulting from transactions denominated in acurrency o<strong>the</strong>r than <strong>the</strong> functional currency are included in “Foreign currencyexchange (loss) gain” in <strong>the</strong> consolidated statements of operations.Financial InstrumentsThe Company follows SFAS No. 133, “Accounting <strong>for</strong> Derivative Instrumentsand Hedging Activities”, (“SFAS No. 133”), and has identified and designatedall derivatives within <strong>the</strong> scope of SFAS No. 133, as amended. SFAS No. 133requires that every derivative instrument (including certain derivativeinstruments embedded in o<strong>the</strong>r contracts) be recorded in <strong>the</strong> balance sheetas ei<strong>the</strong>r an asset or liability measured at its fair value. SFAS No. 133 requiresthat changes in <strong>the</strong> derivative’s fair value be recognized currently in earningsunless specific hedge accounting criteria are met.A derivative may be embedded in ano<strong>the</strong>r financial instrument or any o<strong>the</strong>rcontract <strong>for</strong> products and services which is known as <strong>the</strong> host contract.Where <strong>the</strong> economic characteristics and risks of an embedded derivativeare not closely related to those of <strong>the</strong> host contract <strong>the</strong> embedded derivativeis separated from <strong>the</strong> host and held on <strong>the</strong> balance sheet at fair value.Movements in fair value are posted to <strong>the</strong> statement of operations, whilst<strong>the</strong> host contract is accounted <strong>for</strong> in accordance with <strong>the</strong> specific accountingguidance in relation to that asset or liability.Special accounting <strong>for</strong> qualifying hedges allows a derivative’s gains and lossesto offset related results on <strong>the</strong> hedged item in <strong>the</strong> statement of operations,and requires that a company <strong>for</strong>mally document, designate, and assess <strong>the</strong>effectiveness of transactions that receive hedge accounting.The Company enters primarily into <strong>for</strong>ward exchange contracts to hedge <strong>for</strong>eigncurrency transactions on a continuing basis <strong>for</strong> periods consistent with itscommitted and <strong>for</strong>ecasted exposures. This hedging minimizes <strong>the</strong> impact of<strong>for</strong>eign exchange rate movement on <strong>the</strong> Company’s U.S. dollar results.The Company’s <strong>for</strong>eign exchange contracts do not subject <strong>the</strong> Company’sresults of operations to risk due to exchange rate movements because gainsand losses on <strong>the</strong>se contracts offset gains and losses on <strong>the</strong> <strong>for</strong>ecastedtransactions being hedged. Generally, currency contracts designated ashedges of commercial commitments mature within two years.For each derivative contract, <strong>the</strong> relationship between <strong>the</strong> hedging instrumentand hedged item, as well as its risk-management objective and strategy <strong>for</strong>undertaking <strong>the</strong> hedge is <strong>for</strong>mally documented. This process includes linkingall derivatives that are designated as fair value, cash flow, or <strong>for</strong>eign currencyhedges to specific assets and liabilities on <strong>the</strong> balance sheet or to specificfirm commitments or <strong>for</strong>ecasted transactions. Contracts are typically held to<strong>the</strong>ir maturity date matching <strong>the</strong> hedge with <strong>the</strong> asset or liability hedged.The derivative instrument terms (currency, maturity and amount) are matchedagainst <strong>the</strong> underlying asset or liability resulting in hedge effectiveness.Hedges are never transacted <strong>for</strong> trading purposes or speculation. Unrealizedgains and losses on <strong>for</strong>eign exchange contracts designated as a cash flowhedge are recorded as an asset or liability in <strong>the</strong> consolidated balance sheet,with <strong>the</strong> effective portions recorded in “Accumulated o<strong>the</strong>r comprehensiveincome, net” and any ineffective portions recognized in <strong>the</strong> consolidatedstatement of operations. The hedge contract gains or losses withinaccumulated o<strong>the</strong>r comprehensive income, net are included on <strong>the</strong> same linein <strong>the</strong> statement of operations and in <strong>the</strong> same period as <strong>the</strong> underlyingtransaction. For hedge contracts designated as fair value hedges, all realizedand unrealized gains or losses are recorded in <strong>the</strong> consolidated statementsof operations.The Company operates in a large number of countries throughout <strong>the</strong> worldand, as a result, is exposed to currency fluctuations largely as a result ofincurring operating expenses in <strong>the</strong> normal course of business. The Companyhedges <strong>for</strong>ecasted future payments to suppliers that require payment in acurrency o<strong>the</strong>r than <strong>the</strong> functional currency of <strong>the</strong> operating company. TheCompany manages <strong>the</strong>se exposures by entering into derivative instrumentspursuant to <strong>the</strong> Company’s policies in areas such as counter party exposureand hedging practices.The Company also uses interest rate swaps to hedge certain underlying debtobligations. For qualifying hedges, <strong>the</strong> interest rate differential between <strong>the</strong>debt rate and <strong>the</strong> swap rate is reflected as an adjustment to interest expenseover <strong>the</strong> life of <strong>the</strong> swap in <strong>the</strong> consolidated statements of operations.The Company uses bunker fuel hedge contracts to lock in <strong>the</strong> price <strong>for</strong>a portion of future <strong>for</strong>ecasted bunker requirements. The hedge contractsare matched against <strong>the</strong> type of bunker fuel being purchased resulting ineffectiveness between <strong>the</strong> hedge contract and <strong>the</strong> bunker fuel purchases.Bunker fuel contracts are designated as cash flow hedges and all unrealizedgains or losses are recorded in “Accumulated o<strong>the</strong>r comprehensive income,net” and as an asset or liability on <strong>the</strong> consolidated balance sheets. Onmaturity, <strong>the</strong> hedge contract gains or losses are reclassified to earningsand <strong>the</strong>re<strong>for</strong>e included in <strong>the</strong> underlying cost of <strong>the</strong> bunker fuel costs in<strong>the</strong> consolidated statements of operations. This accounting treatment is alsoapplied to <strong>for</strong>eign currency hedges and interest rate swaps, except <strong>for</strong> <strong>for</strong>eigncurrency hedges relating to ship building contracts. Gains and losses on<strong>for</strong>eign currency hedges relating to ship building contracts are capitalizedand depreciated over <strong>the</strong> estimated useful life of <strong>the</strong> ships.Stolt-Nielsen <strong>An</strong>nual Report 200745
Stolt-Nielsen S.A.Notes to ConsolidatedFinancial Statementscontinued2. Significant Accounting Policies continuedPensions and O<strong>the</strong>r Post-retirement BenefitsCertain of <strong>the</strong> U.S. and non-U.S. subsidiaries of <strong>the</strong> Company have pension(defined contribution and defined benefit) plans and o<strong>the</strong>r post-retirementplans, which cover substantially all of <strong>the</strong> Company’s shore-based employeesand certain ship officers of <strong>the</strong> Company.The defined benefit plans are funded in con<strong>for</strong>mity with <strong>the</strong> fundingrequirements of applicable government regulations. Generally, benefits arebased on age, years of service, and <strong>the</strong> level of compensation during <strong>the</strong>final years of employment. Prior service costs <strong>for</strong> defined benefit plansare generally amortized over <strong>the</strong> estimated remaining service periods ofemployees participating in that plan. The Company’s contributions to <strong>the</strong>seplans are based on a percentage of employee compensation or employeecontributions. In addition to pension benefits, certain post-retirement medicalbenefits are provided, principally to most U.S. employees. Retirees in o<strong>the</strong>rcountries are generally covered by government-sponsored programmes.The Company uses <strong>the</strong> corridor approach in <strong>the</strong> valuation of defined benefitplans and o<strong>the</strong>r post-retirement benefits. The corridor approach defers allactuarial gains and losses resulting from variances between actual resultsand economic estimates or actuarial assumptions. For defined benefit pensionplans, <strong>the</strong>se unrecognized gains and losses are amortized when <strong>the</strong> net gainsand losses exceed 10% of <strong>the</strong> greater of <strong>the</strong> market-related value of planassets or <strong>the</strong> projected benefit obligation at <strong>the</strong> beginning of <strong>the</strong> year. Foro<strong>the</strong>r post-retirement benefits, amortization occurs when <strong>the</strong> net gains andlosses exceed 10% of <strong>the</strong> accumulated post-retirement benefit obligation at<strong>the</strong> beginning of <strong>the</strong> year. The amount in excess of <strong>the</strong> corridor is amortizedover <strong>the</strong> average remaining service period to retirement date of active planparticipants or, <strong>for</strong> retired participants, <strong>the</strong> average remaining life expectancyof such retirees.In September 2006, <strong>the</strong> FASB issued SFAS No. 158, “Employers’ Accounting<strong>for</strong> Defined Benefit Pension and O<strong>the</strong>r Post-retirement Plans” (“SFAS No. 158”),which amends SFAS No. 87, “Employers’ Accounting <strong>for</strong> Pensions”, SFASNo. 88, “Employers’ Accounting <strong>for</strong> Settlements and Curtailments of DefinedBenefit Pension Plans and <strong>for</strong> Termination Benefits”, SFAS No. 106,“Employers’ Accounting <strong>for</strong> Post-retirement Benefits O<strong>the</strong>r Than Pensions”and SFAS No. 132 (revised 2003), “Employers’ Disclosures about Pensionsand O<strong>the</strong>r Post-retirement Benefits”—an amendment ofFASB Statements No. 87, 88, and 106.SFAS No. 158 requires an employer to recognize <strong>the</strong> funded status ofa defined benefit plan, measured as <strong>the</strong> difference between plan assetsand <strong>the</strong> projected benefit obligation, in its consolidated balance sheet.Actuarial gains or losses and prior service cost or benefits that have notyet been recognized through earnings as net periodic benefit cost will berecognized as a component of accumulated o<strong>the</strong>r comprehensive income,net of tax, until <strong>the</strong>y are amortized as a component of net periodicbenefit cost. The Company adopted SFAS No. 158 <strong>for</strong> <strong>the</strong> year endedNovember 30, 2007.The adoption of SFAS No. 158 resulted in a credit to o<strong>the</strong>r assets of$2.2 million, a debit to deferred tax assets of $3.6 million and a credit too<strong>the</strong>r liabilities of $4.5 million, resulting in a decrease in SNSA’s accumulatedo<strong>the</strong>r comprehensive income of $3.1 million, net of tax. The measurementdate of some plans was changed to November 30.Stock-based CompensationIn accordance with SFAS No. 123(R), “Share-based Payment”, <strong>the</strong> Companyrecognizes stock-based compensation expense based on fair value at <strong>the</strong> grantdate. Related compensation expense is recognized over <strong>the</strong> vesting period<strong>for</strong> awards expected to ultimately vest. The Company uses <strong>the</strong> Black-Scholes-Merton option pricing model to determine <strong>the</strong> fair value of its stock-basedcompensation plans.Upon adoption of SFAS 123(R) on December 1, 2005, <strong>the</strong> Company used<strong>the</strong> modified prospective transition method, under which prior year financialstatements were not adjusted or restated. Under <strong>the</strong> modified prospectivetransition method, SFAS No. 123(R) was applied to:a) new awards granted after <strong>the</strong> adoption of SFAS No. 123(R); andb) any portion of awards that were granted after <strong>the</strong> first fiscal yearbeginning after December 15, 1994 and had not vested or were amendedbe<strong>for</strong>e December 1, 2005.Prior to December 1, 2005, <strong>the</strong> Company accounted <strong>for</strong> <strong>the</strong> plans under APBOpinion No. 25, “Accounting <strong>for</strong> Stock Issued to Employees”.Earnings Per Common ShareBasic Earnings Per Common Share (“EPS”) is computed by dividing netincome by <strong>the</strong> weighted average number of shares outstanding during <strong>the</strong>year. Diluted EPS is computed by adjusting <strong>the</strong> weighted average numberof shares outstanding during <strong>the</strong> year <strong>for</strong> all potentially dilutive shares andequivalents outstanding during <strong>the</strong> year using <strong>the</strong> Treasury stock method.As fur<strong>the</strong>r discussed in Note 19, “Capital Stock, Founder’s Shares andDividends Declared”, Founder’s shares, which provide <strong>the</strong> holder <strong>the</strong>reofwith certain control features, only participate in earnings to <strong>the</strong> extentof $0.005 per share <strong>for</strong> <strong>the</strong> years in which dividends are declared, and arelimited to $0.05 per share upon liquidation. For <strong>the</strong> purposes of computingEPS, dividends paid on Founder’s shares are deducted from earnings to arriveat net income attributable to Common shareholders. Founder’s shares are notincluded in <strong>the</strong> basic or diluted weighted average shares outstanding in <strong>the</strong>computation of income per Common share.The outstanding stock options under <strong>the</strong> 1987 Stock Option Plan and 1997Stock Option Plan are included in <strong>the</strong> diluted EPS calculation to <strong>the</strong> extent<strong>the</strong>y are dilutive.46 www.stolt-nielsen.com
Financial StatementsThe following is a reconciliation of <strong>the</strong> numerator and denominator of <strong>the</strong> basic and diluted EPS computations:For <strong>the</strong> years ended November 30, 2007 2006 2005(in thousands, except per share data)Net Income $ 216,363 $ 199,915 $ 483,019Less: dividends on Founder’s shares (75) (155) (82)Net income attributable to Common shareholders $ 216,288 $ 199,760 $ 482,937Basic weighted average shares outstanding 59,526 62,243 64,864Dilutive effect of stock options 596 684 1,354Diluted weighted average shares outstanding 60,122 62,927 66,218Basic income per share $ 3.63 $ 3.21 $ 7.45Diluted income per share 3.60 3.17 7.29Outstanding stock options to purchase 1,376,299 shares and 1,287,850 shares were not included in <strong>the</strong> computation of diluted EPS <strong>for</strong> <strong>the</strong> years endedNovember 30, 2007 and 2006, respectively, because <strong>the</strong> net effect of <strong>the</strong>se stock options would have been antidilutive.Impact of New Accounting PronouncementsSince <strong>the</strong> Company has decided to report under International Financial Reporting Standards (“IFRS”) from <strong>the</strong> year ending November 30, 2008, we havenot considered <strong>the</strong> effect of new accounting pronouncements under U.S. GAAP.3. SAB 108—Cumulative Effect Adjustment to Retained EarningsIn September 2006, <strong>the</strong> Securities and Exchange Commission (<strong>the</strong> “SEC”) issued Staff Accounting Bulletin No. 108 (Topic 1N) “Financial Statements—Considering <strong>the</strong> Effects of Prior Year Misstatements when Quantifying Misstatements in Current Year Financial Statements” (“SAB 108”). SAB 108 providesguidance on how to evaluate prior period financial statement misstatements <strong>for</strong> purposes of assessing <strong>the</strong>ir materiality in <strong>the</strong> current period.There are two widely recognized methods <strong>for</strong> quantifying <strong>the</strong> effects of financial statement misstatements: <strong>the</strong> “rollover” or income statement method and<strong>the</strong> “iron curtain” or balance sheet method. Historically, <strong>the</strong> Company used <strong>the</strong> “rollover” method. Under this method <strong>the</strong> Company quantified its financialstatement misstatements based on <strong>the</strong> amount of errors originating in <strong>the</strong> current-year income statement, and as a result did not consider <strong>the</strong> effects ofprior-year misstatements to be material to <strong>the</strong> Company’s financial statements. The iron curtain method quantifies a misstatement based on <strong>the</strong> effects ofcorrecting <strong>the</strong> misstatement existing in <strong>the</strong> balance sheet at <strong>the</strong> end of <strong>the</strong> current year, irrespective of <strong>the</strong> misstatement’s origination.SAB 108 now requires that <strong>the</strong> Company must consider both <strong>the</strong> rollover and iron curtain methods (“dual method”) when quantifying misstatements in<strong>the</strong> financial statements.Upon adoption, SAB 108 permits <strong>the</strong> Company to adjust <strong>for</strong> <strong>the</strong> cumulative effect of errors that were previously considered immaterial under <strong>the</strong> rollovermethod that are now considered material under <strong>the</strong> dual method.The Company adopted SAB 108 in September 2006 and recorded a cumulative effect adjustment of $12.9 million to correct certain errors that were identifiedin 2006 relating to its accounting <strong>for</strong> certain equity method investments which originated generally in periods prior to December 1, 2003. This adjustmentaffected <strong>the</strong> carrying amount of equity investments with an offsetting adjustment to <strong>the</strong> opening balance of retained earnings at December 1, 2005.The errors which resulted in this adjustment related principally to <strong>the</strong> Company’s investment in NYK Stolt Tankers S.A. (“NYK Stolt”) and arose as a consequenceof, amongst o<strong>the</strong>r things (i) errors in <strong>the</strong> conversion of NYK Stolt’s results from Japanese GAAP to U.S. GAAP, (ii) errors in <strong>the</strong> recording of transactionsbetween NYK Stolt and <strong>the</strong> Company and (iii) errors in <strong>the</strong> application of APB Opinion No. 18. This adjustment was not deemed to be material, individually andin <strong>the</strong> aggregate, both quantitatively and qualitatively, prior to <strong>the</strong> adoption of SAB 108, using <strong>the</strong> rollover method. There was no significant tax effect <strong>for</strong>this adjustment.Stolt-Nielsen <strong>An</strong>nual Report 200747
Stolt-Nielsen S.A.Notes to ConsolidatedFinancial Statementscontinued4. Investments in and Advances to Non-consolidated Joint Ventures and Equity Method InvesteesInvestments in and advances to non-consolidated joint ventures consisted of <strong>the</strong> following:2007Geographic OwnershipAs of November 30, Location % 2007 2006(in thousands)Tankers:NYK Stolt Tankers S.A. Japan 50 $ 42,807 $ 40,478Stolt NYK Asia Pacific Inc Singapore 50 18,517 12,564Shanghai Sinochem—Stolt Shipping Ltd China 49 32,299 9,985NYK Stolt Shipholding Inc Singapore 50 4,993 2,946SIA LAPA Ltd Latvia 49 1,078 1,059Stoltchem Ship Management (Shanghai) Ltd China 49 152 109Shanghai New Ying Yang Marine Services Co. Ltd China 40 83 6099,929 67,201Tank Containers:Hyop Woon Stolt Transportation Services Co. Ltd South Korea 50 719 657N.C. Stolt Transportation Services Co. Ltd Japan 50 527 605N.C. Stolt Chuyko Transportation Services Co. Ltd Japan 35 198 185Stolt PTC Bitubulk Pte Singapore 50 46 —1,490 1,447Terminals:Oiltanking Stolthaven <strong>An</strong>twerp, NV Belgium 50 105,035 56,489Jeong-IL Stolthaven Ulsan Co. Ltd South Korea 50 23,563 21,098Stolthaven (Westport) Sdn. Bhd. Malaysia 49 3,816 1,329Stolthaven Ningbo Co Ltd China 50 4,451 —Tianjin Lingang Stolthaven Jetty Company China 40 8,435 —145,300 78,916Total $ 246,719 $ 147,564On June 12, 2006, <strong>the</strong> Company entered into a joint venture agreement with Lingang Harbor Affairs company (“LHAC”) to establish <strong>the</strong> Tianjin LingangStolthaven Jetty Company which was established to own and operate a jetty and docks to be contributed by LHAC. LHAC contributed <strong>the</strong> jetty in December 2007.On December 21, 2006, <strong>the</strong> Company announced <strong>the</strong> signing of an agreement with CITIC Daxie Development Co. in Ningbo, China to establish a joint ventureto design, construct, own and operate a state-of-<strong>the</strong>-art chemical and oil products terminal on Daxie Island. Each party owns 50% of <strong>the</strong> newly <strong>for</strong>med jointventure company, Stolthaven Ningbo Co. Ltd (“Stolthaven Ningbo”).On July 21, 2006, <strong>the</strong> Company purchased 50% of <strong>the</strong> outstanding shares of Oiltanking Stolthaven <strong>An</strong>twerp N.V. (“Oiltanking <strong>An</strong>twerp”) from Oiltanking GhentN.V. The Company also entered into a Joint Venture Agreement (“JV Agreement”) with Oiltanking GmbH (“Oiltanking”). The purpose of <strong>the</strong> joint venture is toprovide independent tank terminal services and activities in <strong>the</strong> Port of <strong>An</strong>twerp <strong>for</strong> bulk-liquid products, animal and vegetable oils, gas products and o<strong>the</strong>rproducts. The purchase consideration could be adjusted in future <strong>for</strong> <strong>the</strong> following contingency relating to an acquisition made by Oiltanking in January 2001.As part of <strong>the</strong> purchase of Oiltanking <strong>An</strong>twerp certain indemnities were given to <strong>the</strong> Company. <strong>An</strong>y payments made or cash received as a consequence of <strong>the</strong>seindemnities will be recorded when <strong>the</strong> contingency is resolved and consideration is paid or becomes payable.48 www.stolt-nielsen.com
Financial StatementsOiltanking also has a contingent call option to repurchase all shares held by <strong>the</strong> Company in Oiltanking <strong>An</strong>twerp if certain revenue targets have not beenmet within <strong>the</strong> three years ending September 13, 2009. The Company has evaluated <strong>the</strong> value of <strong>the</strong> call option considering, amongst o<strong>the</strong>r things, estimatedrevenue targets. Based on this evaluation, management considers <strong>the</strong> likelihood of Oiltanking exercising this option to be remote and, accordingly, <strong>the</strong> valueof <strong>the</strong> call option is currently not significant. The Company will continue to monitor this position and if it appears probable that <strong>the</strong> revenue targets will notbe met, any liability that is expected to be created upon exercise of this call option will be recorded.The only significant intangible asset identified as a part of this acquisition was Oiltanking’s concession agreement with <strong>the</strong> Port Authority of <strong>An</strong>twerp whichwill expire in 2030. Based on market rates <strong>for</strong> similar concession agreements at <strong>the</strong> date of acquisition, <strong>the</strong> fair value of this concession was valued at$9.3 million which is reflected in <strong>the</strong> value of equity investment in non-consolidated joint ventures. This asset is being amortized on a straight-line basisover <strong>the</strong> remaining life of <strong>the</strong> concession agreement of 24 years.Goodwill represents <strong>the</strong> residual of <strong>the</strong> purchase consideration over <strong>the</strong> fair value of <strong>the</strong> assets and liabilities acquired. Based on <strong>the</strong> fair value of assetsand liabilities acquired as a part of this equity method investment, goodwill is $26.9 million.Summarized financial in<strong>for</strong>mation of <strong>the</strong> Company’s non-consolidated joint ventures and equity method investees representing 100% of <strong>the</strong> respective amountsincluded in <strong>the</strong> individual non-consolidated joint ventures’ financial statements is as follows:For <strong>the</strong> years ended November 30, 2007 2006 2005(in millions)Income statement dataOperating revenue $ 282.8 $ 196.2 $ 196.0Gross profit 92.0 71.2 63.0Net income 48.8 30.5 29.0As of November 30, 2007 2006(in millions)Balance sheet dataCurrent assets $ 125.2 $ 87.5Non-current assets 692.2 570.6Current liabilities 131.0 163.2Non-current liabilities 379.0 292.2The statement of operations <strong>for</strong> <strong>the</strong> non-consolidated joint ventures and equity method investees presented above includes <strong>the</strong> following items relatedto transactions with <strong>the</strong> Company:For <strong>the</strong> years ended November 30, 2007 2006 2005(in millions)Charter hire revenue $ 44.4 $ 47.2 $ 46.6Tank container cleaning station revenue 3.7 3.8 4.4O<strong>the</strong>r revenue 0.1 — —Charter hire expense 25.3 18.6 60.1Management and o<strong>the</strong>r expenses 4.7 4.7 4.1Freight and Joint Service commission expense 1.4 1.4 1.4Interest expense 6.4 2.3 1.1Profit sharing expense 0.6 0.6 —O<strong>the</strong>r expense 0.4 1.0 —The above charter hire revenues are amounts distributed to NYK Stolt, a non-consolidated joint venture of <strong>the</strong> Company.See Note 7 <strong>for</strong> amounts due from and to <strong>the</strong> Company from non-consolidated joint ventures and equity method investees.Stolt-Nielsen <strong>An</strong>nual Report 200749
Stolt-Nielsen S.A.Notes to ConsolidatedFinancial Statementscontinued5. Non-consolidated Variable Interest EntitiesNYK StoltOn August 31, 1987, Nippon Yusen Kaisha Ltd, (“NYK”) and <strong>the</strong> Companyentered into a shareholders’ agreement by which <strong>the</strong>y incorporated NYK Stolt,a company registered in <strong>the</strong> Republic of Panama. NYK Stolt’s purpose is toenter into bareboat or time charter agreements with outside ship-owners andto operate <strong>the</strong> ships in accordance with such charter agreements. In any of<strong>the</strong>se charter agreements, NYK Stolt may have <strong>the</strong> option to purchase a shipwhich it will exercise if agreed by <strong>the</strong> shareholders of NYK Stolt.The Company’s equity investment in NYK Stolt was $3.2 million and $1.0million at November 30, 2007 and 2006, respectively. Since its incorporation,both NYK and <strong>the</strong> Company have loaned money to NYK Stolt on severaloccasions, al<strong>way</strong>s in exactly equal amounts. Total loans and interest payableto <strong>the</strong> Company as of November 30, 2007 and 2006 were $39.6 million and$39.5 million, respectively. The loans have a variable interest rate of 6.39%at November 30, 2007 and 2006. The interest income on <strong>the</strong> loans is beingcapitalized by <strong>the</strong> Company. In 2007, a $2.5 million repayment has beenreceived by both shareholders. The latest due date of <strong>the</strong> debt afterrefinancing is in 2020.Management’s evaluation of NYK Stolt’s joint venture agreements hasidentified that <strong>the</strong> Company has variable interests due to <strong>the</strong> terms of <strong>the</strong>investment in <strong>the</strong> entity’s activities and <strong>the</strong> structure of <strong>the</strong> financial supportprovided to <strong>the</strong> entity. The terms of <strong>the</strong> joint venture agreement do notexpose <strong>the</strong> Company to <strong>the</strong> majority of expected cash flow variability and,<strong>the</strong>re<strong>for</strong>e, this entity is not consolidated.SNSA’s maximum exposure to loss is <strong>the</strong> cost of <strong>the</strong> investment and loanbalance which totalled $42.8 million and $40.5 million as of November 30,2007 and 2006, respectively.Stolthaven NingboStolthaven Ningbo was established on December 31, 2006 and is in <strong>the</strong> earlystage of construction of a bulk-liquid terminal <strong>for</strong> <strong>the</strong> storage of chemicalsand oil products. The Company contributed $4.5 million <strong>for</strong> its 50% share ofStolthaven Ningbo.Management’s evaluation of Stolthaven Ningbo has identified that <strong>the</strong>Company has variable interests due to <strong>the</strong> total equity investment at risknot being sufficient to permit <strong>the</strong> entity to finance its activities withoutadditional financial support provided by o<strong>the</strong>rs, including its equity holders.This is due to Stolthaven Ningbo being a development stage entity and nothaving obtained external financing. The terms of <strong>the</strong> joint venture agreementdo not expose <strong>the</strong> Company to <strong>the</strong> majority of expected cash flow variabilityand, <strong>the</strong>re<strong>for</strong>e, this entity is not consolidated.SNSA’s maximum exposure to loss is <strong>the</strong> cost of <strong>the</strong> investment which totalled$4.5 million and nil as of November 30, 2007 and 2006, respectively.6. AcquisitionsAcquisition of Sturgeon and Caviar businessOn December 21, 2006, <strong>the</strong> Company announced that through its wholly,owned subsidiary, Stolt Sea Farm (“SSF”) it acquired a 75% equity stakein <strong>the</strong> sturgeon and caviar business, Sterling Caviar LLC, (“Sterling Caviar”)from Marine Harvest.The total purchase consideration, which consisted of cash of $3.8 million and<strong>the</strong> assumption of loans of $1.6 million, represented <strong>the</strong> existing book valueof <strong>the</strong> operations. Sterling Caviar has been consolidated in <strong>the</strong> Company’sfinancial statements since <strong>the</strong> date of acquisition.The Company recorded <strong>the</strong> Sterling Caviar acquisition under <strong>the</strong> purchasemethod of accounting, with assets and liabilities of Sterling Caviar reflectedat <strong>the</strong>ir estimated fair values. The Company’s only material fair valueadjustment related to inventory and resulted in a $2.2 million increase in<strong>the</strong> balance. Adjustments to inventory were based upon <strong>the</strong> inventory marketvalues at <strong>the</strong> date of purchase. A deferred income tax liability of $0.9 millionwas recorded in relation to <strong>the</strong> fair value adjustment.In accordance with <strong>the</strong> purchase method of accounting, <strong>the</strong> excess of <strong>the</strong> fairvalue of net assets acquired over <strong>the</strong> purchase price (“negative goodwill”) of$1.3 million was allocated to Sterling Caviar’s long-term assets which at <strong>the</strong>purchase date consisted of fixed assets.7. Related Party TransactionsChairman TransactionsDuring <strong>the</strong> years ended November 30, 2007 and 2006, <strong>the</strong> Company’schairman Jacob Stolt-Nielsen contracted certain ship management and o<strong>the</strong>rservices from <strong>the</strong> Company totalling $0.4 million <strong>for</strong> 2007 and $0.7 million <strong>for</strong>2006. He repaid $0.5 million and $0.8 million in 2007 and 2006, respectively,leaving a balance payable to <strong>the</strong> Company of nil and $0.1 million as ofNovember 30, 2007 and 2006, respectively. The maximum amount outstandingfrom Mr. Jacob Stolt-Nielsen during <strong>the</strong> year was $0.2 million and $0.6 million<strong>for</strong> 2007 and 2006, respectively.Employee and Officer Loans and AdvancesIncluded in “O<strong>the</strong>r current assets” are loans and advances to employees andofficers of <strong>the</strong> Company of $1.2 million as of November 30, 2007 and 2006.In addition, included in “O<strong>the</strong>r assets” are loans and advances to employeesand officers of <strong>the</strong> Company of $0.3 million and $0.2 million as ofNovember 30, 2007 and 2006, respectively. Such loans and advances primarilyrepresent secured housing loans that have been provided to key employeesin connection with <strong>the</strong>ir relocation, along with advances <strong>for</strong> travel ando<strong>the</strong>r costs.Transactions with Non-consolidated Joint Ventures andEquity Method InvesteesThe balance sheet data <strong>for</strong> <strong>the</strong> non-consolidated joint ventures and equitymethod investees in Note 4 includes <strong>the</strong> following items related totransactions with <strong>the</strong> Company:As of November 30, 2007 2006(in millions)Amounts due from <strong>the</strong> Company $ 2.5 $ 7.8Amounts due to <strong>the</strong> Company 82.7 43.8Included within “Amounts due to <strong>the</strong> Company” is $4.8 million and $4.4 millionas of November 30, 2007 and 2006, respectively, <strong>for</strong> trade receivables from jointventures. These amounts are reflected in <strong>the</strong> consolidated balance sheets as“Receivables from related parties”. The remaining amounts due to <strong>the</strong> Companyare included in “Investments in and advances to non-consolidated jointventures and equity method investees”. Amounts due from <strong>the</strong> Company areincluded in “O<strong>the</strong>r current liabilities” in <strong>the</strong> consolidated balance sheets.50 www.stolt-nielsen.com
Financial Statements8. Investment in and Loan to Marine HarvestContribution of Net Assets to Marine HarvestOn April 29, 2005, <strong>the</strong> Company completed <strong>the</strong> merger of <strong>the</strong> salmonoperations of SSF and Nutreco Holding N.V.’s (“Nutreco”) worldwide fishfarming, processing, and marketing and sales operations into a new standalonebusiness entity, Marine Harvest. The Company retained <strong>the</strong> turbotand sole operations in Europe and <strong>the</strong> Sou<strong>the</strong>rn bluefin tuna operations inAustralia. The Sou<strong>the</strong>rn bluefin tuna operations were sold in December 2006,(see Note 10). The Company accounted <strong>for</strong> its 25% investment in MarineHarvest under <strong>the</strong> equity method of accounting beginning on April 29, 2005.The following table represents <strong>the</strong> balance sheet changes reflected in <strong>the</strong>contribution of net assets to Marine Harvest on <strong>the</strong> consolidated statementof cash flows <strong>for</strong> <strong>the</strong> year ended November 30, 2005. As of April 29, 2005,<strong>the</strong> date of <strong>the</strong> contribution of net assets to Marine Harvest, <strong>the</strong> SSF cashand cash equivalents balance was $19.3 million, and has been reflected in<strong>the</strong> consolidated statement of cash flows <strong>for</strong> <strong>the</strong> year ended November 30,2005 as a net reduction in cash flows from investing activities:(in thousands)Deferred income taxes $ (7,759)Minority interest (2,938)Trade receivables, net 42,859Inventories 173,230Prepaid expenses and o<strong>the</strong>r current assets 9,850Accounts payable and accrued expenses (48,940)Investments in and advances to non-consolidated joint ventures 3,488Fixed assets, net 83,577O<strong>the</strong>r assets 1,298Goodwill and o<strong>the</strong>r intangible assets, net 37,063Long-term debt, including current maturities (7,645)Investment in Marine Harvest (253,100)Loan to Marine Harvest (64,600)Change in cumulative translation adjustment 14,303$ (19,314)Sale of Marine HarvestOn March 6, 2006, <strong>the</strong> Company announced that it and Nutreco agreed tosell <strong>the</strong>ir entire ownership interests in Marine Harvest to Geveran TradingCo. Ltd. (“Geveran”) <strong>for</strong> total cash proceeds of €1.2 billion ($1.4 billion).On March 29, 2006, <strong>the</strong> Company received prepayment proceeds of$353.5 million, representing <strong>the</strong> prepayment proceeds from <strong>the</strong> sale ofits 25% ownership interest in Marine Harvest.The sale to Geveran was subject to obtaining approvals from variouscompetition and regulatory authorities. Accordingly, completion of <strong>the</strong> saleand <strong>the</strong> transfer of shares to Geveran was deferred until such approvals werereceived. Given <strong>the</strong> conditions, <strong>the</strong> Company continued to account <strong>for</strong> MarineHarvest under <strong>the</strong> equity method <strong>for</strong> <strong>the</strong> year ended November 30, 2006, anddeferred recognition of <strong>the</strong> gain on sale of Marine Harvest until all suchapprovals were received.On December 29, 2006, Geveran received <strong>the</strong> necessary approvals from<strong>the</strong> competition and regulatory authorities and <strong>the</strong> sale was subsequentlycompleted. The Company recorded a gain on sale of Marine Harvest of$21.8 million in <strong>the</strong> first quarter of 2007.Carrying Value of InvestmentThe Company’s investment in and loan to Marine Harvest as of November 30,2006, comprised:As of November 30, 2006(in millions)Cost of investment in Marine Harvest $ 253.1Equity in net income of Marine Harvest 72.1Trade receivable paid (2.4)Total $ 322.8On February 13, 2006, Marine Harvest closed a €350.0 million unsecuredrevolving credit facility. This facility was used to repay <strong>the</strong> Company’sshareholder loan of $64.9 million.Summarized Financial Data of Marine HarvestMarine Harvest follows a calendar year end and accordingly <strong>the</strong> financialin<strong>for</strong>mation presented below is <strong>for</strong> <strong>the</strong> year ended December 31, 2006 andeight months ended December 31, 2005. The Company used <strong>the</strong> results <strong>for</strong><strong>the</strong>se periods to calculate <strong>the</strong> equity in net income of Marine Harvest in2006 and 2005, respectively.Stolt-Nielsen <strong>An</strong>nual Report 200751
Stolt-Nielsen S.A.Notes to ConsolidatedFinancial Statementscontinued8. Investment in and Loan to Marine Harvest continuedThe following represents summarized financial data <strong>for</strong> Marine Harvest prepared under <strong>the</strong> EU-IFRS <strong>for</strong> <strong>the</strong> year ended December 31, 2006 and eight monthsended December 31, 2005:For <strong>the</strong>For <strong>the</strong>year endedeight months endedDecember 31, December 31,Income statement data 2006 2005(in millions)Operating revenue $ 1,393.0 $ 875.0Operating income 292.0 123.0Net income 251.0 95.0As ofDecember 31,Balance sheet data 2006(in millions)Current assets $ 1,282.0Non-current assets 427.0Current liabilities 301.0Non-current liabilities 314.0Shareholders’ equity 1,094.09. Goodwill and O<strong>the</strong>r Intangible AssetsIntangible assets are shown below, net of accumulated amortization:As of November 30, 2007 2006(in millions)Intangible assets $ 0.7 $ 25.5Accumulated amortization (0.1) (1.7)Net intangible assets 0.6 23.8Goodwill 0.3 0.3Total $ 0.9 $ 24.1Intangible assets not subject to amortization were nil and $23.3 million as of November 30, 2007 and 2006, respectively. At November 30, 2006, <strong>the</strong> assetsconsisted of <strong>the</strong> SSF Sou<strong>the</strong>rn bluefin tuna quota rights in Australia. The Company disposed of <strong>the</strong> Sou<strong>the</strong>rn bluefin tuna business on December 18, 2006. Theamortization expense <strong>for</strong> o<strong>the</strong>r intangible assets was nil, $0.1 million and $0.1 million in <strong>the</strong> years ended November 30, 2007, 2006 and 2005, respectively.The net carrying value of intangible assets subject to amortization was $0.6 million and $0.5 million as of November 30, 2007 and 2006, respectively, primarilyconsisting of <strong>the</strong> electrical cable rights <strong>for</strong> <strong>the</strong> Vilano turbot site at SSF. Finite-lived intangible assets are amortized over a weighted average useful life of25 years.Amortization expense of o<strong>the</strong>r intangible assets subject to amortization is expected to be less than $0.1 million in each of <strong>the</strong> next five years.Goodwill was $0.3 million and $0.3 million as of November 30, 2007 and 2006, respectively, all of which related to Tank Containers goodwill.52 www.stolt-nielsen.com
Financial Statements10. Discontinued OperationsOn December 18, 2006, <strong>the</strong> Company announced that SSF had completed <strong>the</strong> sale of its Sou<strong>the</strong>rn bluefin tuna business, based in Port Lincoln, Australia, toSAMS Holdings (SA) Pty. Ltd. <strong>for</strong> proceeds totalling AUS $90.0 million (approximately $70.2 million at <strong>the</strong> <strong>the</strong>n prevailing exchange rate). The sale is in linewith SSF’s strategy of developing species where biological know-how and technology expertise create a fundamental advantage. The Company reported a netgain of $42.4 million on <strong>the</strong> transaction.The following table summarizes <strong>the</strong> results of operations of <strong>the</strong> Sou<strong>the</strong>rn bluefin tuna business:For <strong>the</strong> years ended November 30, 2006 2005(in millions)Operating revenue $ 11.4 $ 14.0Operating expenses (8.4) (17.7)Gross profit (loss) 3.0 (3.7)Administrative and general expenses (0.6) (0.7)Gain on disposal of assets, net 0.1 12.2Operating income 2.5 7.8Foreign currency exchange gain (loss) 0.1 (0.7)Income be<strong>for</strong>e taxes 2.6 7.1Income tax provision (0.7) (2.6)Profit from discontinued operations $ 1.9 $ 4.5The results of operations <strong>for</strong> <strong>the</strong> Sou<strong>the</strong>rn bluefin tuna business <strong>for</strong> <strong>the</strong> year ended November 30, 2007, prior to disposal, were minimal.On January 13, 2005, <strong>the</strong> Company sold all of its shares in Stolt Offshore S.A. <strong>for</strong> an aggregate gross value of $504.3 million in a private placement. A gainon sale of <strong>the</strong> investment of $355.9 million was recognised. Income from discontinued operations <strong>for</strong> Stolt Offshore S.A. was $1.1 million <strong>for</strong> <strong>the</strong> year endedNovember 30, 2005.11. Gain on Disposal of Assets, NetGain on disposal of assets, net is comprised of <strong>the</strong> following:For <strong>the</strong> years ended November 30, 2007 2006 2005(in thousands)Gain (loss) on <strong>the</strong> sale of Tanker ships $ 2,285 $ 3,107 $ (1,802)Gain on miscellaneous sales of land/condominium — 1,256 1,671Loss on closure of office building — (4) (1,077)Gain on sale of investments in securities — — 567Gain (loss) on sale of o<strong>the</strong>r assets 192 (239) (46)Gain (loss) on sale of tank containers 671 (29) 81$ 3,148 $ 4,091 $ (606)During 2007, Tankers recorded gains of $2.3 million from <strong>the</strong> sales of <strong>the</strong> Stolt Hamburg, Stolt Avenir, Stolt Koeln and Stolt Emden. During 2006, sales of tankerships resulted in gains of $3.1 million associated with <strong>the</strong> sales of <strong>the</strong> Stolt Taurus, Stolt Titan, Stolt Avance, Stolt Roma and Stolt London.Stolt-Nielsen <strong>An</strong>nual Report 200753
Stolt-Nielsen S.A.Notes to ConsolidatedFinancial Statementscontinued12. Restructuring ChargesThe following tables summarize accrued restructuring charges <strong>for</strong> <strong>the</strong> years ended November 30, 2007, 2006 and 2005:Opening Expensed Paid in ClosingFor <strong>the</strong> year ended November 30, 2007 Balance in <strong>the</strong> Year <strong>the</strong> year Balance(in thousands)Personnel and severance costs $ 1,131 $ 289 $ (898) $ 522Professional fees — 5 (5) —Relocation costs — 174 (174) —O<strong>the</strong>r 189 (26) (11) 152Total $ 1,320 $ 442 $ (1,088) $ 674Opening Expensed Paid in ClosingFor <strong>the</strong> year ended November 30, 2006 Balance in <strong>the</strong> Year <strong>the</strong> year Balance(in thousands)Personnel and severance costs $ 2,685 $ 1,140 $ (2,694) $ 1,131Professional fees — 111 (111) —Relocation costs — 369 (369) —O<strong>the</strong>r 110 141 (62) 189Total $ 2,795 $ 1,761 $ (3,236) $ 1,320Opening Expensed Paid in ClosingFor <strong>the</strong> year ended November 30, 2005 Balance in <strong>the</strong> Year <strong>the</strong> year Balance(in thousands)Personnel and severance costs $ 1,859 $ 3,418 $ (2,592) $ 2,685Professional fees — 566 (566) —Relocation costs — 2,506 (2,506) —O<strong>the</strong>r 116 574 (580) 110Total $ 1,975 $ 7,064 $ (6,244) $ 2,795In June 2004, <strong>the</strong> Company announced a restructuring plan which included <strong>the</strong> relocation of key operational and administrative functions from Houston,Texas and Greenwich, Connecticut to Rotterdam, <strong>the</strong> Ne<strong>the</strong>rlands; London, United Kingdom; and Manila, <strong>the</strong> Philippines. The majority of <strong>the</strong> restructuringplan is expected to be complete in 2008.54 www.stolt-nielsen.com
Financial StatementsSummarized below are <strong>the</strong> restructuring costs incurred from June 2004 to November 30, 2007:Total AmountIncurred up to AmountDecember 1, Incurred2006 In 2007(in thousands)TankersPersonnel and severance costs $ 5,407 $ (76)Professional fees 691 5Relocation costs 2,818 174O<strong>the</strong>r 828 (26)Total $ 9,744 $ 77Tank ContainersPersonnel and severance costs $ 577 $ —Professional fees 74 —Relocation costs 301 —O<strong>the</strong>r 89 —Total $ 1,041 $ —TerminalsPersonnel and severance costs $ 292 $ —Professional fees 37 —Relocation costs 147 —O<strong>the</strong>r 45 —Total $ 521 $ —SNSA CorporatePersonnel and severance costs $ 84 $ 365Professional fees 18 —Relocation costs 81 —O<strong>the</strong>r 15 —Total $ 198 $ 365Grand totalPersonnel and severance costs $ 6,360 $ 289Professional fees 820 5Relocation costs 3,347 174O<strong>the</strong>r 977 (26)Total $ 11,504 $ 44213. Income TaxesThe following tables present <strong>the</strong> U.S. and non-U.S. components of <strong>the</strong> income tax provision <strong>for</strong> <strong>the</strong> years ended November 30, 2007, 2006 and 2005:For <strong>the</strong> years ended 2007 2006 2005(in thousands)Current:U.S. $ 964 $ 1,610 $ 381Non-U.S. 12,903 15,540 6,939Deferred:U.S. (6,081) (9,564) (4,898)Non-U.S. (1,987) (2,561) 4,584Income tax provision $ 5,799 $ 5,025 $ 7,006During 2007 various <strong>for</strong>eign currency tax provisions have been revalued and a <strong>for</strong>eign exchange loss of $1.5 million has been included in <strong>the</strong> non-U.S. currenttax charge.Stolt-Nielsen <strong>An</strong>nual Report 200755
Stolt-Nielsen S.A.Notes to ConsolidatedFinancial Statementscontinued13. Income Taxes continuedThe following presents <strong>the</strong> reconciliation of <strong>the</strong> provision <strong>for</strong> income taxes to United States federal income taxes computed at <strong>the</strong> statutory rate:2007 2006 2005(in thousands)Income from continuing operations be<strong>for</strong>e income tax provision,minority interest and equity in net income of Marine Harvest $ 158,230 $ 142,338 $ 117,339Tax at U.S. federal rate (35%) $ 55,381 $ 49,818 $ 41,069Differences between U.S. and non-U.S. tax rates (487) (3,812) (3,349)Income not subject to income tax (43,668) (39,451) (40,611)Losses not benefited and change in valuation allowance (303) (2,885) 7,844Write-off of deferred tax assets set up in prior years in companiescontributed to Marine Harvest — — 11,315Reversal of United Kingdom Controlled Foreign Company reserve — — (6,361)Adjustments to estimates relative to prior years (4,752) (1,614) (435)O<strong>the</strong>r, net (372) 2,969 (2,466)Income tax provision $ 5,799 $ 5,025 $ 7,006Substantially all of Tankers’ shipowning and ship operating subsidiaries are incorporated in countries which do not impose an income tax on <strong>the</strong> operating profitsof shipping operations.The components of <strong>the</strong> deferred tax assets and liabilities as of November 30, 2007 and 2006 are as follows:As of November 30, 2007 2006(in thousands)Deferred tax assets:Net operating loss carry<strong>for</strong>wards $ 36,113 $ 28,554Short-term provisions 4,684 2,946Employee benefits 3,996 —O<strong>the</strong>r temporary differences 11,059 8,032Gross deferred tax assets 55,852 39,532Valuation allowances (4,078) (4,611)Deferred tax assets 51,774 34,921Deferred tax liabilities:Differences between book and tax depreciation (39,465) (34,529)O<strong>the</strong>r temporary differences (8,222) (6,993)Deferred tax liabilities (47,687) (41,522)Net deferred tax asset (liability) $ 4,087 $ (6,601)Current deferred tax asset 4,684 2,946Non-current deferred tax asset 47,090 31,975Non-current deferred tax liability (47,687) (41,522)$ 4,087 $ (6,601)As of November 30, 2007 and 2006, <strong>the</strong> current deferred tax asset of $4.7 million and $2.9 million, respectively, is included within “O<strong>the</strong>r current assets”in <strong>the</strong> consolidated balance sheets.Withholding and remittance taxes are not recorded on <strong>the</strong> undistributed earnings of SNSA’s subsidiaries since under <strong>the</strong> current tax laws of Luxembourg and<strong>the</strong> countries in which substantially all of SNSA’s subsidiaries are incorporated, no material taxes would be assessed upon <strong>the</strong> payment or receipt of dividends.Earnings retained by subsidiaries incorporated in those countries which impose withholding or remittance taxes are considered by management to bepermanently reinvested in such subsidiaries. The undistributed earnings of <strong>the</strong>se subsidiaries as of November 30, 2007 and 2006 were not material.As of November 30, 2007 and 2006, <strong>the</strong> Company had $103.8 million and $82.2 million, respectively, of net operating loss carry<strong>for</strong>wards <strong>for</strong> income taxpurposes. Of <strong>the</strong>se, $84.7 million and $61.5 million respectively, were in <strong>the</strong> U.S. and expire in <strong>the</strong> range 16-20 years. The remainder has an indefinitecarry<strong>for</strong>ward period.The deferred tax assets are mainly comprised of net operating loss carry<strong>for</strong>wards. The Company has recorded a valuation allowance to reflect <strong>the</strong> estimatedamount of <strong>the</strong>se deferred tax assets that may not be realized.The valuation allowance decreased to $4.1 million, as of November 30, 2007 from $4.6 million as of November 30, 2006. The valuation allowance relates tonet operating loss carry<strong>for</strong>wards in Brazil.56 www.stolt-nielsen.com
Financial Statements14. InventoriesInventories as of November 30, 2007 and 2006 consisted of <strong>the</strong> following:2007 Tank Containers SSF Total(in thousands)Raw materials $ 191 $ 255 $ 446Consumables 656 — 656Seafood biomass — 25,729 25,729$ 847 $ 25,984 $ 26,8312006 Tank Containers SSF Total(in thousands)Raw materials $ 162 $ 99 $ 261Consumables 433 — 433Seafood biomass — 16,798 16,798$ 595 $ 16,897 $ 17,49215. Short-Term Bank Loans and Lines of CreditShort-term bank loans, which amounted to $271.0 million and $144.6 million as of November 30, 2007 and 2006, respectively, consist principally of drawdownsunder committed and uncommitted lines of credit and overdraft facilities.Amounts borrowed pursuant to <strong>the</strong>se facilities bear interest at rates ranging from 2.00% to 7.10% in 2007, and from 4.84% to 6.57% in 2006. The weightedaverage interest rate was 5.8%, 5.4% and 4.9% <strong>for</strong> <strong>the</strong> years ended November 30, 2007, 2006 and 2005, respectively.As of November 30, 2007, <strong>the</strong> Company had various credit lines, including committed lines totalling $774.0 million, of which $503.0 million was available<strong>for</strong> future use. Of <strong>the</strong> $774.0 million in total credit lines at November 30, 2007, $725.0 million is committed beyond one year and $49.0 million is periodicallysubject to renewal. These credit lines which are subject to renewal are payable on demand and can be withdrawn by <strong>the</strong> banks at short notice. Commitmentfees <strong>for</strong> unused lines of credit were $1.2 million, $1.6 million, and $1.3 million <strong>for</strong> <strong>the</strong> years ended November 30, 2007, 2006 and 2005, respectively.Several of <strong>the</strong> credit facilities contain various financial covenants, which, if not complied with, could result in <strong>the</strong> acceleration of repayment of amounts dueand limit <strong>the</strong> ability of <strong>the</strong> Company to draw funds from time to time.16. Long-Term Debt and Capital LeasesLong-term debt as of November 30, 2007 and 2006, consisted of <strong>the</strong> following:2007 2006(in thousands)Preferred ship fixed rate mortgages:Fixed interest rates ranging from 5.57% to 8.57%, maturities vary through 2016 $ 238,989 $ 273,113Preferred ship variable rate mortgages:Interest rates ranging from 5.62% to 5.73%, maturities vary through 2014 59,787 67,638Senior Secured Credit Facility (see below) 169,000 144,000Bank and notes payable and capital leases:Interest rates ranging from 0% to 11.0%, maturities vary through 2010 1,661 1,425469,437 486,176Less—current maturities (42,495) (67,301)$ 426,942 $ 418,875Long-term debt is denominated primarily in U.S. dollars, with $0.1 million and $1.4 million denominated in o<strong>the</strong>r currencies as of November 30, 2007and 2006, respectively.On July 31, 2007, we entered into a $200 million seven year secured term loan and revolving credit agreement with various lending institutions including DnBNor Bank ASA as administrative and collateral agent. This amended and restated agreement effectively refinanced a $150 million five year facility, which wasentered into on August 31, 2004 and amended in July 2005, and provided funding <strong>for</strong> capital expenditures <strong>for</strong> <strong>the</strong> terminals in 2007. The initial drawdown onthis facility was $169 million. The interest rates on this facility range from LIBOR plus 0.60% to LIBOR plus 1.20% depending on <strong>the</strong> level of consolidatedindebtedness to consolidated earnings be<strong>for</strong>e interest, tax, depreciation and amortization (“EBITDA”). The Company wrote off $1.0 million of unamortized debtissuance costs associated with <strong>the</strong> previous facility at <strong>the</strong> same date.Stolt-Nielsen <strong>An</strong>nual Report 200757
Stolt-Nielsen S.A.Notes to ConsolidatedFinancial Statementscontinued16. Long-Term Debt and Capital Leases continued<strong>An</strong>nual principal repayments of long-term debt and capital leases <strong>for</strong> <strong>the</strong> fiveyears subsequent to November 30, 2007, and <strong>the</strong>reafter, are as follows:(in thousands)2008 $ 42,4952009 42,2902010 49,5642011 61,8292012 67,828Thereafter 205,431$ 469,437Agreements executed in connection with certain debt obligations require that<strong>the</strong> Company maintains defined financial covenants, including but not limitedto, minimum consolidated tangible net worth, maximum consolidated debtto tangible net worth and minimum EBITDA to consolidated interest expense.Most of <strong>the</strong> debt agreements provide <strong>for</strong> a cross default in <strong>the</strong> event of adefault in ano<strong>the</strong>r agreement. In <strong>the</strong> event of a default that extends beyond<strong>the</strong> applicable remedy or cure period, lenders may accelerate repaymentof amounts due to <strong>the</strong>m. Substantially all of <strong>the</strong> debt is collateralized bymortgages on ships and terminals with a net carrying value of $1.1 billionas of November 30, 2007.As of November 30, 2007 and 2006, <strong>the</strong> Company was in compliance with<strong>the</strong> financial covenants under its debt agreements.On February 28, 2005, <strong>the</strong> Company exercised its right pursuant to <strong>the</strong> noteagreements governing certain Senior Notes to redeem all $295.4 millionaggregate outstanding principal balance. The Senior Notes were redeemedat <strong>the</strong> respective redemption prices set <strong>for</strong>th in each of <strong>the</strong> note agreements.In connection with <strong>the</strong> early retirement of its Senior Notes, <strong>the</strong> Companyrecognized additional costs on <strong>the</strong> redemption of $14.3 million, as a resultof having to pay a redemption premium in accordance with <strong>the</strong> terms of <strong>the</strong>Senior Note agreements.Additionally, in 2005, <strong>the</strong> Company wrote off $1.9 million of unamortizeddebt issuance costs in connection with <strong>the</strong> retirement of o<strong>the</strong>r debt. In 2005,<strong>the</strong> Company also recognized a gain on retirement of certain ship debt of$1.1 million.Amortization of debt issuance costs was $1.3 million, $1.4 million and$1.3 million <strong>for</strong> <strong>the</strong> years ended November 30, 2007, 2006 and 2005,respectively. Deferred debt issuance costs, net, of $5.1 million and$6.1 million as of November 30, 2007 and 2006, respectively, areincluded in “O<strong>the</strong>r assets” in <strong>the</strong> consolidated balance sheets.17. Operating LeasesAs of November 30, 2007, <strong>the</strong> Company was obligated to make paymentsunder long-term operating lease agreements <strong>for</strong> tankers, land, terminalfacilities, tank containers, barges, equipment and offices. Certain of <strong>the</strong> leasescontain clauses requiring payments in excess of <strong>the</strong> base amounts to coveroperating expenses related to <strong>the</strong> leased assets.During 2002 to 2006 <strong>the</strong> Company entered into agreements with variousJapanese shipowners <strong>for</strong> <strong>the</strong> time charter (operating lease) of 12 parceltankers with anticipated deliveries in 2003 through 2008. As of November 30,2007, 11 time charters have commenced with one remaining ship to bedelivered in 2008. The 12 time charters are <strong>for</strong> an initial period of 36 to 96months and include an option <strong>for</strong> <strong>the</strong> Company to extend <strong>the</strong> agreements <strong>for</strong>up to nine additional years. In addition, <strong>the</strong> Company also has <strong>the</strong> option topurchase each ship at predetermined prices at any time after three years from<strong>the</strong> delivery of <strong>the</strong> ship. These operating leases had commitments <strong>for</strong><strong>the</strong> initial periods of approximately $170 million as of November 30, 2007,<strong>for</strong> <strong>the</strong> period 2008 through 2016.Minimum annual lease commitments, under agreements which expire atvarious dates through 2047, are as follows:(in thousands)2008 $ 170,9652009 99,6492010 61,0972011 29,1592012 20,898Thereafter 27,086408,854Less—sub-lease income (957)$ 407,897Rental and charter hire expenses under operating lease agreements <strong>for</strong><strong>the</strong> years ended November 30, 2007, 2006 and 2005 were $187.2 million,$165.4 million and $138.1 million, respectively, net of sub-lease income of$9.3 million, $5.4 million and $0.4 million, respectively. In addition to <strong>the</strong>se,through <strong>the</strong> Joint Service, certain ships are time chartered under operatingleases from participants in <strong>the</strong> Joint Service. For <strong>the</strong> three years endedNovember 30, 2007, 2006 and 2005, charter hire expenses related to <strong>the</strong>seleases were $81.0 million, $78.7 million and $78.2 million, respectively.58 www.stolt-nielsen.com
Financial Statements18. Pension and O<strong>the</strong>r Post-retirement Benefit PlansCertain of <strong>the</strong> U.S. and non-U.S. subsidiaries of <strong>the</strong> Company have pension and o<strong>the</strong>r post-retirement benefit plans covering substantially all of <strong>the</strong>ir shorebasedemployees and certain ship officers of <strong>the</strong> Company. It is <strong>the</strong> Company’s policy to fund pension and o<strong>the</strong>r post-retirement costs as required by applicablelaws and regulations.On November 30, 2007, <strong>the</strong> Company adopted <strong>the</strong> recognition and disclosure provisions of SFAS 158. SFAS 158 required <strong>the</strong> Company to recognize <strong>the</strong> fundedstatus (i.e., <strong>the</strong> difference between <strong>the</strong> fair value of plan assets and <strong>the</strong> projected benefit obligations) of its benefit plans in <strong>the</strong> November 30, 2007Consolidated Balance Sheet, with a corresponding adjustment to accumulated o<strong>the</strong>r comprehensive income, net of tax. The net adjustment to accumulatedo<strong>the</strong>r comprehensive income at adoption of $6.7 million ($3.1 million net of tax) reflects <strong>the</strong> recognition on <strong>the</strong> balance sheet of previously unrecognizedcumulative actuarial losses and prior service costs. The effects of adopting <strong>the</strong> provisions of SFAS 158 on <strong>the</strong> Company’s Consolidated Balance Sheet atNovember 30, 2007, are given below.Be<strong>for</strong>eAfterApplicationApplicationof SFAS 158 Adjustments of SFAS 158(in thousands)Long-term Assets:O<strong>the</strong>r assets $ 86,068 $ (2,206) $ 83,862Deferred income tax asset 3,142 3,578 6,720Long-term Liabilities:O<strong>the</strong>r liabilities (52,038) (4,468) (56,506)Stockholders’ EquityAccumulated o<strong>the</strong>r comprehensive loss (31,902) 3,096 (28,806)Stockholders’ equity (1,357,578) 3,096 (1,354,482)Net periodic benefit costs <strong>for</strong> <strong>the</strong> Company’s defined benefit pension plans (including a retirement arrangement <strong>for</strong> one of <strong>the</strong> Company’s directors) and o<strong>the</strong>r U.S.post-retirement benefit plans <strong>for</strong> <strong>the</strong> years ended November 30, 2007, 2006 and 2005, consist of <strong>the</strong> following:Pension BenefitsO<strong>the</strong>r U.S. Post-retirement BenefitsFor <strong>the</strong> years ended November 30, 2007 2006 2005 2007 2006 2005(in thousands)Components of Net Periodic Benefit Cost:Service cost $ 5,005 $ 4,539 $ 5,775 $ 364 $ 339 $ 288Interest cost 9,514 8,622 8,326 766 664 694Expected return on plan assets (10,304) (8,306) (6,496) — — —Amortization of unrecognized transition obligation 11 12 16 110 110 110Amortization of unrecognized prior service cost 2,454 (248) 202 (207) (207) —Amortization of unrecognized net actuarial loss — 3,948 2,674 143 111 —Gain recognized due to curtailment — — (56) — — —Settlement gain recognized — (211) — — — —Special termination benefit cost — 124 — — — —Net periodic benefit cost $ 6,680 $ 8,480 $ 10,441 $ 1,176 $ 1,017 $ 1,092U.S. based employees retiring from <strong>the</strong> Company after attaining <strong>the</strong> age of 55 with at least ten years of service with <strong>the</strong> Company are eligible to receive postretiremen<strong>the</strong>alth care coverage <strong>for</strong> <strong>the</strong>mselves and <strong>the</strong>ir eligible dependents. These benefits are subject to deductibles, co-payment provisions, and o<strong>the</strong>rlimitations. The Company reserves <strong>the</strong> right to change or terminate <strong>the</strong> benefits at any time.The following tables set <strong>for</strong>th <strong>the</strong> change in benefit obligations <strong>for</strong> <strong>the</strong> Company’s defined benefit pension plans and o<strong>the</strong>r U.S. post-retirement plans and <strong>the</strong>change in plan assets <strong>for</strong> <strong>the</strong> defined benefit pension plans. There are no plan assets associated with <strong>the</strong> o<strong>the</strong>r U.S. post-retirement plans.Stolt-Nielsen <strong>An</strong>nual Report 200759
Stolt-Nielsen S.A.Notes to ConsolidatedFinancial Statementscontinued18. Pension and O<strong>the</strong>r Post-retirement Benefit Plans continuedPension BenefitsO<strong>the</strong>r U.S.Post-retirement BenefitsFor <strong>the</strong> years ended November 30, 2007 2006 2007 2006(in thousands)Change in Benefit Obligation:Benefit obligations at beginning of year $ 175,282 $ 170,018 $ 12,662 $ 13,831Service cost 5,005 4,539 364 339Interest cost 9,514 8,622 766 664Benefits paid (3,336) (5,302) (443) (603)Plan participant contributions 314 315 — —Foreign exchange rate changes 4,111 6,327 — —Plan amendments 1,377 (4,752) — (1,974)Expenses paid (182) — — —Plan settlements (2,321) (203) — —Actuarial (gains) losses (4,299) (4,407) 9 405Special termination benefits — 125 — —Benefits obligation at end of year $ 185,465 $ 175,282 $ 13,358 $ 12,662Pension BenefitsFor <strong>the</strong> years ended November 30, 2007 2006(in thousands)Change in Plan Assets:Fair value of plan assets at beginning of year $ 151,679 $ 126,909Actual return on plan assets 17,112 16,042Company contributions 10,258 9,699Plan participant contributions 314 315Foreign exchange rate changes 3,641 4,134Benefits paid (3,336) (5,302)Expenses paid (182) —Plan settlements (2,321) (203)Acquisitions/divestures — 85Fair value of plan assets at end of year $ 177,165 $ 151,679Pension BenefitsO<strong>the</strong>r U.S.Post-retirement BenefitsAs of November 30, 2007 2006 2007 2006(in thousands)Funded status at measurement date $ (8,300) $ (23,604) $ (13,358) $ (12,662)Unrecognized net actuarial loss — 30,389 — 2,337Unrecognized prior service (benefit)/cost — (2,781) — (1,767)Unrecognized net transition liability — 49 — 655Measurement date to year-end changes 54 1,056 47 36Net prepaid/(accrued) benefit/(cost) $ (8,246) $ 5,109 $ (13,311) $ (11,401)60 www.stolt-nielsen.com
Financial StatementsThe amounts recognized at November 30, consisted of <strong>the</strong> following:Pension BenefitsO<strong>the</strong>r U.S.Post-retirement BenefitsAs of November 30, 2007 2006 2007 2006(in thousands)Amounts recognized in balance sheet:Prepaid benefit cost $ 32,306 $ —Accrued benefit liability (33,940) (11,401)Intangible asset 1,609 —O<strong>the</strong>r liabilities — —Accumulated o<strong>the</strong>r comprehensive loss 5,134 —Net amount recognized $ 5,109 $ (11,401)Non current assets $ 26,962 $ —Current liabilities (811) (783)Non current liabilities (34,397) (12,528)Total $ (8,246) $ (13,311)Amounts recognized in accumulated o<strong>the</strong>r comprehensive income:Net loss $ 19,526 $ 2,203Prior service credit (4,354) (1,560)Transition obligation 41 545Accumulated o<strong>the</strong>r comprehensive loss $ 15,213 $ 1,188The amounts in accumulated o<strong>the</strong>r comprehensive income are expected to be amortized as net expense (income) during 2008 as follows:O<strong>the</strong>rU.S. Post-Pension retirementBenefits Benefits(in thousands)Net loss $ (668) $ (110)Prior service credit 313 207Transition obligation (12) (65)Total $ (367) $ 32In May 2004, <strong>the</strong> FASB issued FASB Staff Position (“FSP”) No. 106-2, “Accounting and Disclosure Requirements Related to <strong>the</strong> Medicare Prescription Drug,Improvement and Modernization Act of 2003” (“FSP No. 106-2”) which provides specific guidance on accounting <strong>for</strong> <strong>the</strong> effects of this Act <strong>for</strong> employerssponsoring post-retirement health care plans that provide certain prescription drug benefits. Additionally, this guidance allows companies who elected to follow<strong>the</strong> deferral provisions of FSP No. 106-1, and whose prescription drug benefit plans are actuarially equivalent to <strong>the</strong> benefit to be provided under MedicarePart D, to ei<strong>the</strong>r reflect <strong>the</strong> effects of <strong>the</strong> federal subsidy to be provided by <strong>the</strong> Act in <strong>the</strong>ir financial statements on a prospective basis or a retroactive basis.The Company determined that <strong>the</strong> prescription drug benefit provided by <strong>the</strong> Company’s post-retirement benefit plan as of <strong>the</strong> date of <strong>the</strong> Act’s enactment was atleast actuarially equivalent to those of Medicare Part D and, accordingly, <strong>the</strong> Company is entitled to <strong>the</strong> federal subsidy. The Company adopted <strong>the</strong> provisions ofFSP No. 106-2, and applied <strong>the</strong>se provisions <strong>for</strong> <strong>the</strong> year ended November 30, 2005. Effective December 1, 2005, <strong>the</strong> Company amended <strong>the</strong> post-retirementmedical plan to integrate with Medicare ra<strong>the</strong>r than apply <strong>for</strong> <strong>the</strong> Federal subsidy.Stolt-Nielsen <strong>An</strong>nual Report 200761
Stolt-Nielsen S.A.Notes to ConsolidatedFinancial Statementscontinued18. Pension and O<strong>the</strong>r Post-retirement Benefit Plans continuedFASB guidance states that a plan that provides prescription drug benefits that previously were deemed actuarially equivalent under <strong>the</strong> Act may be subsequentlyamended to reduce its prescription drug coverage and that reduced coverage may cease to be considered actuarially equivalent. In that circumstance, anyactuarial experience gain related to <strong>the</strong> subsidy previously recognized is unaffected. However, <strong>the</strong> combined net effect of <strong>the</strong> benefit obligation of (a) <strong>the</strong>subsequent plan amendment that reduces benefits under <strong>the</strong> plan and thus disqualifies <strong>the</strong> benefits as actuarially equivalent and (b) <strong>the</strong> elimination of <strong>the</strong>subsidy should be accounted <strong>for</strong> as of <strong>the</strong> date <strong>the</strong> amendment is adopted as a prior service cost. The amendment reduced <strong>the</strong> benefit obligation by$2.0 million. The negative prior service cost is amortized over expected future service to full eligibility (9.55 years).The Company’s U.S. pension and post-retirement medical obligations are measured as of September 30. The Company’s non-U.S. pension obligations aremeasured as of November 30.The following are <strong>the</strong> assumptions used in <strong>the</strong> measurement of <strong>the</strong> projected benefit obligation and net periodic pension expense <strong>for</strong> pension benefits, and <strong>the</strong>accumulated projected benefit obligation and retiree medical expense <strong>for</strong> o<strong>the</strong>r U.S. post-retirement benefits:Pension BenefitsO<strong>the</strong>r U.S. Post-retirement BenefitsAs of November 30, 2007 2006 2005 2007 2006 2005Weighted-Average AssumptionsDiscount rate 5.48% 5.48% 5.22% 5.80% 5.80% 5.40%Expected long-term rate of return on assets 7.08% 7.10% 7.22% — — —Rate of increase in compensation levels 3.87% 3.87% 3.31% — — 4.00%The aggregate benefit obligation <strong>for</strong> plans with projected benefit obligationsin excess of plan assets was $83.1 million at November 30, 2007 and$76.8 million as of November 30, 2006. The aggregate fair value of planassets <strong>for</strong> such plans was $47.9 million at November 30, 2007, and$39.3 million as of November 30, 2006.The aggregate pension accumulated benefit obligations (“ABO”) <strong>for</strong> pensionplans with ABO in excess of plan assets was $79.0 million as of November 30,2007, and $51.4 million as of November 30, 2006.Health care cost trends assume a 9.5% annual rate of increase in <strong>the</strong> percapita cost of covered health care benefits <strong>for</strong> 2007, reducing gradually eachyear, reaching an ultimate rate of 5.0% in 2015 and remaining at that level<strong>the</strong>reafter. The effect of a 1% change in <strong>the</strong>se assumed cost trends on <strong>the</strong>accumulated post-retirement benefit obligation at <strong>the</strong> end of 2007 would bean approximate $0.4 million increase or an approximate $0.5 million decreaseand <strong>the</strong> effect on <strong>the</strong> aggregate of <strong>the</strong> service cost and interest cost of <strong>the</strong>net periodic benefit cost <strong>for</strong> 2007 would be an approximate $0.1 millionincrease or decrease.The Company’s defined benefit pension plans’ weighted-average assetallocation as of November 30, 2007 and 2006, by category, was as follows:2007 2006Equity Securities 58% 57%Debt Securities 29% 29%Real Estate 11% 12%O<strong>the</strong>r 2% 2%Total 100% 100%It is <strong>the</strong> Company’s policy to invest pension plan assets <strong>for</strong> its defined benefitplans to ensure that <strong>the</strong>re is an adequate level of assets to support benefitobligations to participants and retirees over <strong>the</strong> life of <strong>the</strong> plans, maintainliquidity in plan assets sufficient to cover current benefit obligations and earn<strong>the</strong> maximum investment return consistent with a prudent level of investmentand actuarial risk.Investment return is <strong>the</strong> total compounded annual return, calculatedrecognizing interest and dividend income, realized and unrealized capitalgains and losses, employer contributions, expenses, and benefit payments.The Company expects to contribute $9.1 million to certain of its definedbenefit pension plans in 2008.The following estimated future benefit payments, which reflect expectedfuture service, are expected to be paid by <strong>the</strong> pension plans in <strong>the</strong> followingyears, as indicated:O<strong>the</strong>rU.S. Post-Pension retirementBenefits Benefits(in millions)2008 $ 7.6 $ 0.82009 9.8 0.92010 10.7 0.92011 9.9 0.92012 10.3 0.92013-2017 58.4 5.1The weighted-average assumptions <strong>for</strong> 2008 pension benefits and o<strong>the</strong>rpost-retirement benefits are as follows:O<strong>the</strong>rU.S. Post-Pension retirementBenefits BenefitsDiscount rate 6.11% 5.80%Expected long-term rate of return on assets 7.08% —Rate of increase in compensation levels 3.89% —The Company also provides defined contribution plans to certain of itsqualifying employees. Company contributions charged to expense <strong>for</strong> <strong>the</strong>seplans were $1.5 million, $1.2 million and $1.5 million <strong>for</strong> <strong>the</strong> years endedNovember 30, 2007, 2006 and 2005, respectively.62 www.stolt-nielsen.com
Financial Statements19. Capital Stock, Founder’s Shares andDividends DeclaredThe Company’s authorized share capital consists of 65,000,000 Commonshares, no par value, and 16,250,000 Founder’s shares, no par value. While<strong>the</strong> Common shares do not have a par value, <strong>the</strong>y have been assigned a statedvalue of $1 per Common share. Under <strong>the</strong> Luxembourg company law, Founder’sshares are not considered as representing capital of <strong>the</strong> Company.In addition to <strong>the</strong> authorized Common shares and Founder’s shares of <strong>the</strong>Company, an additional 1,500,000 Class B shares, no par value, have beenauthorized <strong>for</strong> <strong>the</strong> sole purpose of <strong>the</strong> issuance of options granted under <strong>the</strong>Company’s existing stock option plans, and may not be used <strong>for</strong> any o<strong>the</strong>rpurpose. The rights, preferences and priorities of such Class B shares are set<strong>for</strong>th in <strong>the</strong> Articles of Incorporation.All such Class B shares convert to Common shares immediately upon issuance.Such authorized and unissued Class B shares and all of <strong>the</strong> rights relating<strong>the</strong>reto expire, without fur<strong>the</strong>r action, on December 31, 2009. Except <strong>for</strong>matters where applicable law requires <strong>the</strong> approval of both classes of sharesvoting as separate classes, Common shares and Founder’s shares vote as asingle class on all matters submitted to a vote of <strong>the</strong> shareholders, with eachshare entitled to one vote.Under <strong>the</strong> Articles of Incorporation, holders of Common shares and Founder’sshares participate in annual dividends, if any are declared by <strong>the</strong> Company, in<strong>the</strong> following order of priority: (i) $0.005 per share to Founder’s shares andCommon shares equally; and (ii) <strong>the</strong>reafter, all fur<strong>the</strong>r amounts are payable toCommon shares only. Fur<strong>the</strong>rmore, <strong>the</strong> Articles also set <strong>for</strong>th <strong>the</strong> priorities tobe applied to each of <strong>the</strong> Common shares and Founder’s shares in <strong>the</strong> eventof a liquidation.Under <strong>the</strong> Articles, in <strong>the</strong> event of a liquidation, all debts and obligationsof <strong>the</strong> Company must first be paid and <strong>the</strong>reafter all remaining assets of <strong>the</strong>Company are paid to <strong>the</strong> holders of Common shares and Founder’s shares in<strong>the</strong> following order of priority: (i) Common shares ratably to <strong>the</strong> extent of<strong>the</strong> stated value <strong>the</strong>reof (<strong>for</strong> example $1.00 per share); (ii) Common sharesand Founder’s shares participate equally up to $0.05 per share; and(iii) <strong>the</strong>reafter, Common shares are entitled to all remaining assets.The Common shares are listed in Nor<strong>way</strong> on <strong>the</strong> Oslo Børs. The Company’sCommon shares previously traded in <strong>the</strong> <strong>for</strong>m of American Depositary Shares(“ADS”) (each ADS representing one Common share) in <strong>the</strong> U.S. on Nasdaq.On April 19, 2007, <strong>the</strong> Company announced its intention to voluntarily delistfrom <strong>the</strong> Nasdaq Global Select Market, to be effective as of <strong>the</strong> close of tradingon May 21, 2007, and to terminate its American Depositary Receipt programme.The Company expects to file a Form 15F with <strong>the</strong> SEC to terminate itsregistration and reporting obligations under <strong>the</strong> Securities Exchange Act by endof May 2008. The Company will maintain its listing in Nor<strong>way</strong> on <strong>the</strong> Oslo Børs.On July 25, 2007, <strong>the</strong> Company announced <strong>the</strong> cancellation of Common andFounder’s shares and <strong>the</strong> reduction of <strong>the</strong> issued capital, as approved atSNSA’s <strong>An</strong>nual General Meeting on June 14, 2007. The recorded issued capitalaccount of SNSA has been reduced by $2 million to $64,133,796 by <strong>the</strong>cancellation of two million Common shares of no par value, held in treasury.Following <strong>the</strong> cancellation, $2 million has been transferred from Commonshares, $18.5 million from paid-in surplus and $37.9 million from retainedearnings into treasury stock of SNSA. The number of issued Founder’s shareshas also been adjusted accordingly, reducing <strong>the</strong> number of Founder’s sharesfrom 16,533,449 to 16,033,449.In November 2007, <strong>the</strong> Company’s Board of Directors approved an interimdividend of $0.50 per Common share which was paid on December 12, 2007to all shareholders of record as of November 28, 2007. The dividend resultedin a cash payment to holders of Common shares and Founder’s shares of$29.8 million.On February 8, 2007, <strong>the</strong> Company’s Board of Directors recommended afinal 2006 dividend of $0.50 per Common share, payable on July 5, 2007to shareholders of record as of June 20, 2007. The dividend resulted in anaggregate cash payment to holders of Common shares of $30 million.In November 2006, <strong>the</strong> Company’s Board of Directors approved an interimdividend of $0.50 per Common share and $0.005 per Founder’s sharewhich was paid on December 6, 2006 to all shareholders of record as ofNovember 20, 2006. The dividend resulted in an aggregate cash paymentto holders of Common shares and Founder’s shares of $30.3 million.As of November 30, 2007 and 2006, 14,888,391 and 14,824,054, respectively,of Founder’s shares had been issued to Fiducia Ltd, net of Treasury shares.Additional Founder’s shares are issuable to holders of outstanding Founder’sshares without consideration, in quantities sufficient to maintain a ratioof Common shares to Founder’s shares of 4 to 1. No stated values <strong>for</strong> <strong>the</strong>Founder’s shares are included in <strong>the</strong> consolidated balance sheets, as <strong>the</strong>seshares exist solely <strong>for</strong> voting purposes.SNSA announced on December 1, 2006, that it had completed <strong>the</strong> repurchaseprogramme first announced on August 25, 2005, authorizing <strong>the</strong> Company topurchase up to $200 million worth of its Common shares or related AmericanDepository Shares. The total amount of shares repurchased under thisprogramme was 6,852,240 <strong>for</strong> $200 million. The Company also acquired1.7 million Founder’s shares.The legal reserve (see Note 20) may be satisfied by allocation of <strong>the</strong> requiredamount at <strong>the</strong> issuance of shares or by a transfer from paid-in surplus.The legal reserve is not available <strong>for</strong> dividends. The legal reserve <strong>for</strong> alloutstanding Common shares has been satisfied and appropriate allocationsare made to <strong>the</strong> legal reserve account at <strong>the</strong> time of each issuance ofnew shares.20. Restrictions on Payment of DividendsOn an annual basis, Luxembourg law requires an appropriation of anamount equal to at least 5% of SNSA’s unconsolidated net profits, if any,to a “legal reserve” within shareholders’ equity, until such reserve equals10% of <strong>the</strong> issued share capital of SNSA. This reserve is not available <strong>for</strong>dividend distribution. At November 30, 2007, this legal reserve amountedto $6.6 million based on Common shares issued as of that date.Under Luxembourg law, advance or interim dividends can be declared, upto three times in any fiscal year by <strong>the</strong> Board of Directors; however, <strong>the</strong>ycan only be paid after <strong>the</strong> prior year’s consolidated financial statementshave been approved by SNSA’s shareholders. There is also a determinationas to <strong>the</strong> adequacy of amounts available to pay such dividends by itsindependent statutory auditors in Luxembourg.Final dividends are approved by <strong>the</strong> shareholders once per year at <strong>the</strong> annualgeneral meeting; both advance and final dividends can be paid out of anySNSA earnings, retained or current, as well as paid-in surplus, subject toshareholder approval.Luxembourg law also limits <strong>the</strong> payment of stock dividends to <strong>the</strong> extent thatsufficient surplus exists to provide <strong>for</strong> <strong>the</strong> related increase in stated capital.Stolt-Nielsen <strong>An</strong>nual Report 200763
Stolt-Nielsen S.A.Notes to ConsolidatedFinancial Statementscontinued21. Stock-Based CompensationThe Company has a 1987 Stock Option Plan (<strong>the</strong> “1987 Plan”) covering2,660,000 Common shares and a 1997 Stock Option Plan (<strong>the</strong> “1997 Plan”)covering 5,180,000 Common shares. No fur<strong>the</strong>r grants will be issued under<strong>the</strong> 1987 or <strong>the</strong> 1997 Plans; <strong>the</strong> 1997 Plan expired in 2007 and is beingreplaced with a cash-settled non-equity based per<strong>for</strong>mance incentive plan.The 1987 Plan and <strong>the</strong> 1997 Plan are administered by a CompensationCommittee appointed by <strong>the</strong> Board of Directors. The Compensation Committeeawards options based on <strong>the</strong> grantee’s position in <strong>the</strong> Company, degreeof responsibility, seniority, contribution to <strong>the</strong> Company and such o<strong>the</strong>rfactors as it deems relevant under <strong>the</strong> circumstances.Stock options are issued at <strong>the</strong> current market price of SNSA stock on <strong>the</strong>date of <strong>the</strong> grant. The grant date is <strong>the</strong> date on which <strong>the</strong> CompensationCommittee approves <strong>the</strong> grant.All Class B shares issued in connection with <strong>the</strong> exercise of options willimmediately convert to Common shares upon issuance.Options granted under both Plans may be exercisable <strong>for</strong> periods of up to tenyears at an exercise price not less than <strong>the</strong> fair market value per share at <strong>the</strong>grant date. Options vest 25% on <strong>the</strong> first anniversary of <strong>the</strong> grant date, withan additional 25% vesting on each subsequent anniversary.Stock-based compensation expense was $5.2 million and $10.3 millionin 2007 and 2006, respectively. Stock-based compensation expense in 2006includes $6.1 million to account <strong>for</strong> certain stock options, issued between1993 and 2004, in accordance with APB No. 25.Effective December 1, 2005, <strong>the</strong> Company adopted SFAS No. 123(R) using <strong>the</strong>modified prospective method. See Note 2 <strong>for</strong> a description of <strong>the</strong> adoption ofSFAS No. 123(R). The Company uses <strong>the</strong> Black-Scholes-Merton option pricingmodel to determine <strong>the</strong> fair value of stock options at <strong>the</strong> grant date.The determination of <strong>the</strong> fair value of stock-based payment awards on <strong>the</strong>date of grant using an option-pricing model is affected by <strong>the</strong> stock price aswell as assumptions regarding a number of complex and subjective variables.These variables include expected stock price volatility over <strong>the</strong> term of <strong>the</strong>awards, actual and projected employee stock option exercise behaviours,risk-free interest rate and expected dividends.The Company estimates <strong>the</strong> expected term of options granted based on <strong>the</strong>average term of <strong>the</strong> option and its vesting period. As permitted by SEC StaffAccounting Bulletin No. 107, “Share-Based Payment” (“SAB 107”), <strong>the</strong>volatility of Common stock has been estimated using <strong>the</strong> historical volatilityof <strong>the</strong> SNSA share price on <strong>the</strong> Nasdaq. The Company is unable to determineimplicit volatility of stock options in <strong>the</strong> absence of traded share optionsof SNSA.The risk-free interest rate used in <strong>the</strong> option valuation model is <strong>the</strong> yield onU.S. Treasury zero-coupon bonds at <strong>the</strong> date of <strong>the</strong> grant with remaining termsimilar to <strong>the</strong> expected term on <strong>the</strong> options. The dividend yield assumptionis based on <strong>the</strong> dividends paid in <strong>the</strong> last five years.Management estimates <strong>for</strong>feitures at <strong>the</strong> date of grant and revises thoseestimates in subsequent periods if actual <strong>for</strong>feitures differ from thoseestimates. Management has reviewed historical data to estimate pre-vestingoption <strong>for</strong>feitures and record stock-based compensation expense only <strong>for</strong>those awards that are expected to vest. The impact of <strong>for</strong>feitures is notsignificant. All stock-based payment awards are amortized on a straight-linebasis over <strong>the</strong> requisite service periods of <strong>the</strong> awards which are generally <strong>the</strong>vesting periods.The assumptions used to fair value option grants are as follows:For <strong>the</strong> years endedNovember 30, 2007 2006 2005Expected volatility 53.2% 52.4% 47.3%Dividend yield 3.0% 2.6% 2.9%Risk-free rate 4.7% 4.3% 3.7%Expected lives (in years) 6.3 6.3 6.5Prior to <strong>the</strong> adoption of SFAS No. 123(R), <strong>the</strong> Company applied APB OpinionNo. 25 to account <strong>for</strong> its stock-based compensation. The following tableillustrates <strong>the</strong> effect on net income and earnings per share if <strong>the</strong> Companyhad applied <strong>the</strong> fair value recognition provisions of SFAS No. 123(R) tooptions granted under <strong>the</strong> Company’s stock option plans in all periodspresented prior to <strong>the</strong> adoption of SFAS No. 123(R). For purposes of thispro <strong>for</strong>ma disclosure, <strong>the</strong> value of <strong>the</strong> options is estimated using <strong>the</strong>Black-Scholes-Merton option-pricing model and amortized over <strong>the</strong> options’vesting periods.For <strong>the</strong> year ended November 30, 2005(in thousands, except <strong>for</strong> per share data)Net income as reported $ 483,019Stock-based compensation included in reported net income 1,227Total stock-based employee compensation cost determinedunder <strong>the</strong> fair value method of accounting (2,951)Net income pro <strong>for</strong>ma $ 481,295Basic net income per share:As reported 7.45Pro <strong>for</strong>ma 7.42Diluted net income per share:As reported 7.29Pro <strong>for</strong>ma 7.27The above pro <strong>for</strong>ma disclosures are provided <strong>for</strong> 2005 only because employeestock options were not accounted <strong>for</strong> using <strong>the</strong> fair-value method duringthose periods since SFAS No. 123(R) was adopted in 2006.64 www.stolt-nielsen.com
Financial StatementsThe following table reflects activity under <strong>the</strong> Plans <strong>for</strong> <strong>the</strong> years ended November 30, 2007, 2006 and 2005:2007 2006 2005Weighted Weighted WeightedAverage Average AverageExercise Exercise ExerciseFor <strong>the</strong> years ended November 30, Shares Price Shares Price Shares PriceCommon share optionsOutstanding at beginning of year 1,655,601 $ 20.64 1,461,639 $ 14.58 2,319,489 $ 11.66Granted 515,100 28.90 495,400 32.96 489,900 26.41Exercised (282,297) 11.08 (288,404) 10.99 (1,323,587) 13.60Forfeited* (76,500) 29.87 (10,634) 24.22 (18,563) 13.88Expired (1,500) 17.13 (2,400) 19.08 (5,600) 13.17Outstanding at end of year 1,810,404 $ 24.09 1,655,601 $ 20.64 1,461,639 $ 14.58Exercisable at end of year 726,923 $ 17.47 604,574 $ 12.43 811,553 $ 12.03Weighted average fair value of options granted $ 13.80 $ 14.40 $ 10.202007 2006 2005Weighted Weighted WeightedAverage Average AverageExercise Exercise ExerciseFor <strong>the</strong> years ended November 30, Shares Price Shares Price Shares PriceClass B optionsOutstanding at beginning of year 132,908 $ 14.03 187,696 $ 14.34 1,235,638 $ 14.49Exercised (36,450) 13.53 (53,488) 14.98 (1,039,217) 14.36Forfeited — — — — (5,925) 13.82Expired (1,500) 17.50 (1,300) 19.08 (2,800) 13.17Outstanding at end of year 94,958 $ 14.17 132,908 $ 14.03 187,696 $ 14.34Exercisable at end of year 94,958 $ 14.17 132,908 $ 14.03 187,696 $ 14.34* In <strong>the</strong> current year <strong>the</strong>re were higher than normal <strong>for</strong>feitures due to certain management resignations. This is not expected to recur and <strong>the</strong> Company believes that <strong>the</strong> expected rate of future<strong>for</strong>feitures will be negligible.The following table summarizes in<strong>for</strong>mation about stock options outstanding as of November 30, 2007:Options OutstandingRemainingNumber Contractual NumberExercise prices Outstanding Life (years) ExercisableCommon share options:$5.90 122,068 5.04 122,068$7.33 239,732 6.02 179,799$13.10 83,594 4.02 83,594$20.13 30,900 0.06 30,900$26.41 394,035 7.03 197,018$28.90 485,900 9.11 —$32.96 454,175 8.13 113,5441,810,404 7.34 726,923Class B options:$9.88 14,400 1.06 14,400$14.63 23,875 2.00 23,875$14.75 53,033 3.05 53,033$17.50 1,050 — 1,050$20.50 2,600 2.84 2,60094,958 2.44 94,958At November 30, 2007, <strong>the</strong>re was $9.0 million of total unrecognized compensation cost relating to non-vested stock-based compensation arrangements grantedunder <strong>the</strong> 1997 plan; that cost is expected to be recognized over a period of 3.1 years.Cash received from option exercise under all stock-based arrangements <strong>for</strong> <strong>the</strong> years ended November 30, 2007, 2006 and 2005 was $3.8 million, $3.9 millionand $33.1 million respectively.Stolt-Nielsen <strong>An</strong>nual Report 200765
Stolt-Nielsen S.A.Notes to ConsolidatedFinancial Statementscontinued21. Stock-Based Compensation continuedA summary of <strong>the</strong> status of <strong>the</strong> Company’s non-vested shares as of November 30, 2007, and changes during <strong>the</strong> year ended November 30, 2007, is presented below:WeightedAverageGrant-DateNon-vested Shares Shares Fair ValueCommon shares options:Non-vested as of December 1, 2006 1,051,027 $ 25.35Granted 515,100 28.90Vested (421,371) 20.80Forfeited (61,275) 30.30Non-vested as of November 30, 2007 1,083,481 $ 28.5322. Financial InstrumentsAll of <strong>the</strong> Company’s derivative activities are over-<strong>the</strong>-counter instruments entered into with major financial institutions <strong>for</strong> hedging <strong>the</strong> Company’s committedexposures or firm commitments with major financial credit institutions and shipbuilders. The Company holds <strong>for</strong>eign exchange <strong>for</strong>ward contracts, and commoditycontracts and interest rate swaps, which subject <strong>the</strong> Company to a minimum level of counterparty risk. The Company does not believe that it has a materialexposure to credit risk from third parties failing to per<strong>for</strong>m according to <strong>the</strong> terms of hedge instruments.The following <strong>for</strong>eign exchange contracts, maturing through November 2008, were outstanding as of November 30, 2007:Purchase(in local currency, thousands)Norwegian Kroner 51,000Euro 44,829Singapore Dollar 39,447The U.S. dollar equivalent of <strong>the</strong> currencies which <strong>the</strong> Company had contracted to purchase was $102.4 million as of November 30, 2007.The Company utilizes <strong>for</strong>eign currency derivatives to hedge committed and <strong>for</strong>ecasted cash flow exposures. Substantially all of <strong>the</strong>se contracts have beendesignated as cash flow hedges.The Company has elected non-hedge accounting treatment <strong>for</strong> <strong>the</strong> remaining contracts, which are immaterial. Hedges are periodically evaluated <strong>for</strong> effectiveness.Forecasted cash flow hedge gains and losses are not recognized in income until maturity of <strong>the</strong> contract. Gains and losses on hedges of committed commercialtransactions are recorded as a <strong>for</strong>eign exchange gain or loss.The Company utilized <strong>for</strong>eign currency swap contracts to hedge <strong>for</strong>eign currency debt into U.S. dollars. The Company also entered into an interest rate swapagreement to reduce some of <strong>the</strong> risk associated with variable rate debt by swapping to fixed rate debt.In addition, <strong>the</strong> Company entered into futures contracts to hedge a portion of its future bunker purchases. These derivatives have been designated as cashflow hedges.In 2008, $3.3 million of net unrealized gain included in accumulated o<strong>the</strong>r comprehensive income, net will be reclassified in earnings.The following estimated fair value amounts of financial instruments have been determined by <strong>the</strong> Company, using appropriate market in<strong>for</strong>mation and valuationmethodologies. Considerable judgement is required to develop <strong>the</strong>se estimates of fair value, thus <strong>the</strong> estimates provided herein are not necessarily indicative of<strong>the</strong> amounts that could be realized in a current market exchange:2007 2007 2006 2006Carrying Fair Carrying FairAs of November 30, Amount Value Amount Value(in millions)Financial Assets:Cash and cash equivalents $ 43.7 $ 43.7 $ 44.5 $ 44.5Financial Liabilities:Short-term bank loans 271.0 271.0 144.6 144.6Long-term debt including current maturitiesand related currency and interest rate swap 469.4 430.2 486.2 477.5Financial Instruments:Foreign exchange <strong>for</strong>ward contracts 4.8 4.8 3.6 3.6Interest rate swap (9.1) (9.1) (0.4) (0.4)Bunker hedge contracts — — (1.9) (1.9)66 www.stolt-nielsen.com
Financial StatementsThe carrying amount of cash and cash equivalents and short-term bank loans are a reasonable estimate of <strong>the</strong>ir fair value, due to <strong>the</strong> short maturity <strong>the</strong>reof.The estimated value of <strong>the</strong> Company’s long-term debt is based on interest rates as of November 30, 2007 and 2006, using debt instruments of similar riskand maturities. The fair values of <strong>the</strong> Company’s <strong>for</strong>eign exchange and bunker contracts are based on <strong>the</strong>ir estimated market values as of November 30,2007 and 2006.Market value of interest rate swaps was estimated based on <strong>the</strong> amount <strong>the</strong> Company would receive or pay to terminate its agreements as of November 30,2007 and 2006. Also, <strong>the</strong> Company’s trade receivables and accounts payable as reported in <strong>the</strong> consolidated balance sheets approximate <strong>the</strong>ir fair value.Concentration of Credit RiskTrade receivables are from customers across all lines of its business. The Company extends credit to its customers in <strong>the</strong> normal course of business.The Company regularly reviews its accounts receivable and establishes an allowance <strong>for</strong> uncollectible amounts.The amount of <strong>the</strong> allowance is based on <strong>the</strong> age of unpaid balances, in<strong>for</strong>mation about <strong>the</strong> current financial condition of customers, and o<strong>the</strong>r relevantin<strong>for</strong>mation. Management does not believe significant risk exists in connection with concentration of credit as of November 30, 2007.23. Business and Geographic Segment In<strong>for</strong>mationThe Company has four principal operating and reportable segments, which are Tankers, Tank Containers, Terminals and Sea Farm. The nature of <strong>the</strong>se segmentsis described in Note 1. These operating segments were determined based on <strong>the</strong> nature of <strong>the</strong> products and services offered. Operating segments are definedas components of an enterprise about which separate financial in<strong>for</strong>mation is available that is evaluated regularly by <strong>the</strong> chief operating decision-maker indeciding how to allocate resources and in assessing per<strong>for</strong>mance. The Company’s Chief Executive Officer has been identified as <strong>the</strong> chief operating decisionmaker.The Company’s chief operating decision-maker directs <strong>the</strong> allocation of resources to operating segments based on <strong>the</strong> operating income (loss) and cashflows of each respective segment.The “Corporate and O<strong>the</strong>r” category includes corporate-related items, and <strong>the</strong> results of o<strong>the</strong>r insignificant operations not reportable under o<strong>the</strong>r segments.The basis of measurement and accounting policies of <strong>the</strong> reportable segments are <strong>the</strong> same as those described in Note 2. Inter-segment sales and transfers arenot significant and have been eliminated and not included in <strong>the</strong> following table. Indirect costs and assets have been apportioned between <strong>the</strong> segments of<strong>the</strong> Company on <strong>the</strong> basis of corresponding direct costs and assets. Interest and income taxes are not allocated.The following tables show <strong>the</strong> summarized financial in<strong>for</strong>mation, in U.S. dollars in millions, <strong>for</strong> each reportable and operating segment:Tank Stolt CorporateFor <strong>the</strong> year ended November 30, 2007 Tankers Terminals Containers Sea Farm and O<strong>the</strong>r TotalOperating revenue $ 1,190 $ 103 $ 391 $ 69 $ 6 $ 1,759Depreciation and amortization including drydocking (86) (12) (12) (3) (2) (115)Equity in net income of non-consolidated joint ventures 12 10 — — – 22Operating income (loss) 119 39 46 24 (35) 193Interest expense (29)Interest income 6Income from continuing operations be<strong>for</strong>eincome tax provision and minority interest 158Income tax provision (6)Net income 216Balance SheetCapital expenditures 139 15 74 3 3 234Investments in and advances tonon-consolidated joint ventures 99 147 1 — — 247O<strong>the</strong>r intangible assets, net — — — 1 — 1Segment assets 1,659 432 224 69 92 2,476Stolt-Nielsen <strong>An</strong>nual Report 200767
Stolt-Nielsen S.A.Notes to ConsolidatedFinancial Statementscontinued23. Business and Geographic Segment In<strong>for</strong>mation continuedTank Stolt CorporateFor <strong>the</strong> year ended November 30, 2006 Tankers Terminals Containers Sea Farm and O<strong>the</strong>r TotalOperating revenue $ 1,066 $ 94 $ 352 $ 49 $ 4 $ 1,565Depreciation and amortization including drydocking (81) (12) (8) (4) (4) (109)Equity in net income of non-consolidated joint ventures 16 2 — — — 18Restructuring charges — — — — (2) (2)Operating income (loss) 130 30 43 14 (51) 166Interest expense (35)Interest income 8Income from continuing operations be<strong>for</strong>e incometax provision, minority interest and equity in netincome of Marine Harvest 142Income tax provision (5)Equity in net income of Marine Harvest 61Net income 200Balance SheetCapital expenditures 264 12 18 2 2 298Investments in and advances tonon-consolidated joint ventures 67 79 1 — — 147Goodwill — — 1 — — 1O<strong>the</strong>r intangible assets, net — — — 24 — 24Segment assets 1,535 372 147 389 71 2,514Tank Stolt CorporateFor <strong>the</strong> year ended November 30, 2005 Tankers Terminals Containers Sea Farm and O<strong>the</strong>r TotalOperating revenue $ 966 $ 83 $ 334 $ 232 $ 9 $ 1,624Depreciation and amortization including drydocking (76) (11) (7) (8) (5) (107)Equity in net income of non-consolidated joint ventures 12 3 — — — 15Restructuring charges — — — — (7) (7)Operating income (loss) 153 23 30 7 (38) 175Interest expense (48)Interest income 7Income from continuing operations be<strong>for</strong>e incometax provision, minority interest and equity in netincome of Marine Harvest 117Income tax provision (7)Equity in net income of Marine Harvest 11Net income 483Balance SheetCapital expenditures 93 21 35 — 10 159Investments in and advances tonon-consolidated joint ventures 59 26 1 — — 86Investment in Marine Harvest — — — 329 — 329Goodwill — — 1 — — 1O<strong>the</strong>r intangible assets, net — — — 23 1 24Segment assets 1,321 302 124 408 64 2,219The following table sets out operating revenue by country <strong>for</strong> <strong>the</strong> reportable segments. Tankers, Tank Containers and Terminals operating revenue is allocatedon <strong>the</strong> basis of <strong>the</strong> country in which <strong>the</strong> cargo is loaded. Tankers and Tank Containers operate in a significant number of countries. Revenues from specific<strong>for</strong>eign countries which contribute over 10% of total operating revenue are disclosed separately. SSF operating revenue is allocated on <strong>the</strong> basis of <strong>the</strong> countryin which <strong>the</strong> sale is generated.68 www.stolt-nielsen.com
Financial StatementsFor <strong>the</strong> years endedNovember 30, 2007 2006 2005(in millions)Operating Revenue:Tankers:U.S. $ 418 $ 347 $ 301South America 102 93 93Ne<strong>the</strong>rlands 85 77 80O<strong>the</strong>r Europe 213 175 170Malaysia 104 104 87O<strong>the</strong>r Asia 141 144 95Middle East 66 62 64Africa 58 64 71O<strong>the</strong>r 3 — 5$ 1,190 $ 1,066 $ 966Tank Containers:U.S. $ 117 $ 105 $ 93South America 13 11 11France 41 37 36O<strong>the</strong>r Europe 88 83 81Japan 17 17 18O<strong>the</strong>r Asia 58 52 52China 39 31 28O<strong>the</strong>r 18 16 15$ 391 $ 352 $ 334Terminals:U.S. $ 87 $ 79 $ 71Brazil 16 15 12$ 103 $ 94 $ 83Stolt Sea Farm:U.S. $ 6 $ — $ 49Canada — — 9Chile — — 7United Kingdom 2 2 10Nor<strong>way</strong> 1 1 13Spain 38 29 22France 6 5 5Belgium — 1 7Italy 11 9 4O<strong>the</strong>r Europe 5 2 26Japan — — 29Singapore — — 25O<strong>the</strong>r Asia — — 22O<strong>the</strong>r — — 4$ 69 $ 49 $ 232There were no customers of Tankers, Tank Containers, Terminals or SSFsegments that accounted <strong>for</strong> more than 10% of <strong>the</strong> consolidated operatingrevenue <strong>for</strong> <strong>the</strong> years ended November 30, 2007, 2006 and 2005.The following table sets out long-lived assets by country <strong>for</strong> <strong>the</strong> reportablesegments. Long-lived assets by country are only reportable <strong>for</strong> <strong>the</strong> Terminalsand Sea Farm operations. Tanker and Tank Containers operations operate ona worldwide basis and are not restricted to specific locations.Accordingly, it is not possible to allocate <strong>the</strong> assets of <strong>the</strong>se operations tospecific countries. The total net book value of long-lived assets <strong>for</strong> Tankersamounted to $1,430 million and $1,374 million, and <strong>for</strong> Tank Containersamounted to $167 million and $94 million as of November 30, 2007 and2006, respectively.As of November 30, 2007 2006(in millions)Long-Lived Assets:Terminals:U.S. $ 186 $ 186Brazil 47 46Korea 24 24Europe 67 54China 25 —O<strong>the</strong>r 3 —$ 352 $ 310Stolt Sea Farm:Australia $ — $ 2U.S. 2 —Nor<strong>way</strong> 1 1Portugal 1 1Spain 22 19O<strong>the</strong>r — 1$ 26 $ 24Long-lived assets include fixed assets, investments in non-consolidated jointventures and certain o<strong>the</strong>r non-current assets, mainly <strong>the</strong> unamortized portionof capitalized drydock costs within Tankers, Tank Containers and Terminals. The“Investment in Marine Harvest” amounted to $322.8 million as of November 30,2006, and is included in <strong>the</strong> “Stolt Sea Farm” segment. Long-lived assetsexclude long-term restricted cash deposits, long-term deferred income taxassets, long-term pension assets, goodwill, and o<strong>the</strong>r intangible assets.Stolt-Nielsen <strong>An</strong>nual Report 200769
Stolt-Nielsen S.A.Notes to ConsolidatedFinancial Statementscontinued24. Commitments and ContingenciesAs of November 30, 2007, <strong>the</strong> Company had total capital expenditurepurchase commitments outstanding of approximately $1,438.9 million,including <strong>the</strong> shipbuilding agreements discussed below.Shipbuilding ContractsOn April 10, 2007, <strong>the</strong> Company announced that an agreement had beenreached with SLS Shipbuilding Co. Ltd. (“SLS”) <strong>for</strong> four 43,000 deadweightton (“dwt”) parcel tankers. The aggregate price <strong>for</strong> <strong>the</strong> four ships is expectedto be approximately $361.5 million, with deliveries scheduled to take placebetween mid 2011 and early 2012. The SLS new ships will have a combinationof 24 stainless tanks and 15 coated tanks. The main dimensions of <strong>the</strong> shipswill follow <strong>the</strong> same design of <strong>the</strong> four parcel tankers that <strong>the</strong> Companyordered in October 2006.On October 2, 2006, <strong>the</strong> Company announced that an agreement had beenreached with SLS <strong>for</strong> four 43,000 dwt parcel tankers. The aggregate price <strong>for</strong><strong>the</strong> four ships is expected to be approximately $361.5 million, with deliveriesscheduled to take place between mid 2010 and early 2011. The SLS newbuildships will have a combination of 24 stainless steel tanks and 15 coated tanks.The main dimensions of <strong>the</strong> ships will follow <strong>the</strong> design of <strong>the</strong> four parceltankers that <strong>the</strong> Company announced that it had ordered in June 2005 fromShinA Shipbuilding Co. Ltd. of South Korea, which was acquired by SLS in2006. On June 9, 2005, <strong>the</strong> Company announced that an agreement wasreached with ShinA Shipbuilding Co. Ltd. of South Korea <strong>for</strong> four additional44,000 dwt parcel tankers, with delivery scheduled to begin <strong>the</strong> secondquarter of 2008. The aggregate price <strong>for</strong> <strong>the</strong> four ships is expected to beapproximately $242.5 million. The Company also entered into a separateoption agreement with <strong>the</strong> ShinA Shipbuilding Co. Ltd. to order twoadditional 44,000 dwt parcel tankers <strong>for</strong> delivery in 2009.On October 5, 2006, <strong>the</strong> Company announced that an agreement had beenreached with Aker Yards ASA (“Aker Yards”) to build four 43,000 dwt parceltankers. Kleven Florø and Kleven Design became part of Aker Yards inAugust 2006 (<strong>the</strong> Company placed an order with Kleven Florø <strong>for</strong> two 43,000dwt parcel tankers on March 31, 2005). The new ships will be equipped with24 stainless steel tanks and 15 coated tanks. The aggregate price <strong>for</strong> <strong>the</strong>above-mentioned six ships is expected to be approximately $548.8 million,with deliveries scheduled to take place between first quarter 2008 and <strong>the</strong>end of 2009.The Company has provided guarantees to <strong>the</strong> Usuki Shipyards Co. Ltd(“Usuki”) <strong>for</strong> 50% of <strong>the</strong> cost <strong>for</strong> four 12,500 dwt ships to be constructedby Usuki <strong>for</strong> NYK Stolt Shipholding Inc., <strong>the</strong> Company’s 50% owned jointventure. At November 30, 2007, <strong>the</strong> guarantee is <strong>for</strong> <strong>the</strong> Company’s share ofexpenditure of $45.2 million and extends until June 2011. The Company hasrecorded a liability of $0.6 million at November 30, 2007 in relation to <strong>the</strong>fair value of this guarantee.EnvironmentalThe Company’s operations involve <strong>the</strong> carriage, use, storage and disposalof chemicals and o<strong>the</strong>r hazardous materials and wastes. The Company issubject to applicable international and national health, safety andenvironmental laws relating to <strong>the</strong> protection of <strong>the</strong> environment, includingthose governing discharges of pollutants to air and water, <strong>the</strong> generation,management and disposal of hazardous materials and wastes and <strong>the</strong> cleanupof contaminated sites.The Comprehensive Environmental Response, Compensation, and Liability Act(“CERCLA”), commonly known as Superfund, was enacted by <strong>the</strong> U.S. Congresson December 11, 1980. This law created a tax on <strong>the</strong> chemical and petroleumindustries and provided broad Federal authority to respond directly to releasesor threatened releases of hazardous substances that may endanger publichealth or <strong>the</strong> environment. This law and similar state environment statutesand common laws can impose liability <strong>for</strong> <strong>the</strong> entire cleanup of contaminatedsites or <strong>for</strong> third-party claims <strong>for</strong> property damage and personal injury,regardless of whe<strong>the</strong>r <strong>the</strong> current owner or operator owned or operated <strong>the</strong>site at <strong>the</strong> time of <strong>the</strong> release of contaminants or <strong>the</strong> legality of <strong>the</strong> originaldisposal activities.During 2001, <strong>the</strong> Company sold <strong>the</strong>ir tank storage terminals in Perth Amboy,New Jersey and Chicago, Illinois. Under <strong>the</strong> terms of <strong>the</strong> sale agreement <strong>for</strong>Perth Amboy, New Jersey, <strong>the</strong> Company had retained responsibility <strong>for</strong> certainenvironmental contingencies, should <strong>the</strong>y arise during <strong>the</strong> covered periodwhich ended two years after <strong>the</strong> closing date, in connection with <strong>the</strong>se twosites. As of November 30, 2007, <strong>the</strong> Company has not been notified of anysuch contingencies having been incurred and nei<strong>the</strong>r does it anticipate anysuch contingencies being incurred in <strong>the</strong> future. The Chicago, Illinois terminalproperty has been leased under a long-term agreement with <strong>the</strong> IllinoisInternational Port District. In addition, as part of <strong>the</strong> Chicago, Illinois sale,<strong>the</strong> Company assigned its rights to <strong>the</strong> terminal property to a third party. TheCompany is contingently liable if <strong>the</strong> third party does not return <strong>the</strong> facility inacceptable condition at <strong>the</strong> end of <strong>the</strong> sublease period, on June 30, 2026.25. Legal ProceedingsIn 2007, <strong>the</strong> Company was involved in significant legal proceedings,primarily certain antitrust matters described below. To address <strong>the</strong>seissues, <strong>the</strong> Company incurred significant legal costs of $40.8 million in2007, $42.0 million in 2006 and $30.2 million in 2005, which are includedin “Administrative and general expenses” in <strong>the</strong> consolidated statementsof operations.The Company has also made significant provisions <strong>for</strong> cash or guaranteedpayment terms of agreements or agreements reached in principle or offersmade to customers to resolve or avoid antitrust litigation. The Companyexpects that it will continue to incur additional legal costs until <strong>the</strong>sematters are resolved.The Company also suffered significant distraction of management time andattention related to <strong>the</strong>se legal proceedings and expects that it will continueto suffer this distraction until <strong>the</strong>se proceedings are resolved. The Companyis presently addressing several governmental investigations and could suffersubstantial and material fines or penalties or civil penalties, includingsignificant monetary damages or settlement costs as a result of <strong>the</strong>se matters.It is not possible <strong>for</strong> <strong>the</strong> Company to determine whe<strong>the</strong>r or not an adverseoutcome is probable or, if so, what <strong>the</strong> range of possible losses would be.U.S. Department of Justice’s <strong>An</strong>titrust Investigation into<strong>the</strong> Company’s Parcel Tanker BusinessIn 2002, <strong>the</strong> Company became aware of in<strong>for</strong>mation that caused it toundertake an internal investigation regarding potential improper collusivebehaviour in its parcel tanker and intra-Europe inland barge operations.As a consequence of <strong>the</strong> internal investigation, <strong>the</strong> Company determined tovoluntarily report certain conduct to <strong>the</strong> <strong>An</strong>titrust Division (<strong>the</strong> “<strong>An</strong>titrustDivision”) of <strong>the</strong> U.S. Department of Justice (<strong>the</strong> “DOJ”) and <strong>the</strong> CompetitionDirectorate of <strong>the</strong> European Commission (<strong>the</strong> “EC”).As a result of <strong>the</strong> Company’s voluntary report to <strong>the</strong> DOJ concerning certainconduct in <strong>the</strong> parcel tanker industry, <strong>the</strong> Company entered into an AmnestyAgreement dated January 15, 2003 (<strong>the</strong> “Amnesty Agreement”) with <strong>the</strong><strong>An</strong>titrust Division, which provided that <strong>the</strong> <strong>An</strong>titrust Division agreed “not tobring any criminal prosecution” <strong>for</strong> any act or offence <strong>the</strong> Company may havecommitted prior to January 15, 2003 in <strong>the</strong> parcel tanker industry to or from<strong>the</strong> United States, subject to <strong>the</strong> terms and conditions of <strong>the</strong> AmnestyAgreement including continued cooperation. The Amnesty Agreement covers<strong>the</strong> Company and its directors, officers and employees. On February 25, 2003,<strong>the</strong> Company announced that Stolt-Nielsen Transportation Group ltd (“SNTG”)70 www.stolt-nielsen.com
Financial Statementshad been conditionally accepted into <strong>the</strong> DOJ’s Corporate Leniency Programwith respect to possible collusion in <strong>the</strong> parcel tanker industry.On April 8, 2003, <strong>the</strong> <strong>An</strong>titrust Division’s Philadelphia field office staffin<strong>for</strong>med <strong>the</strong> Company that it was suspending <strong>the</strong> Company’s obligation tocooperate under Section 2 of <strong>the</strong> Amnesty Agreement because <strong>the</strong> staff of<strong>the</strong> <strong>An</strong>titrust Division was considering whe<strong>the</strong>r or not to remove <strong>the</strong> Companyfrom <strong>the</strong> DOJ’s Corporate Leniency Program. The stated basis <strong>for</strong> thisreconsideration by <strong>the</strong> staff was that <strong>the</strong> <strong>An</strong>titrust Division had recentlyreceived evidence that <strong>the</strong> Company had not met <strong>the</strong> condition that it “tookprompt and effective action to terminate its part in <strong>the</strong> anticompetitiveactivity being reported upon discovery of <strong>the</strong> activity”.In late June 2003 <strong>the</strong> DOJ took <strong>the</strong> position that one Company executive,Mr. Richard B. Wingfield, did not comply with <strong>the</strong> cooperation requirementsof <strong>the</strong> Company’s conditional immunity agreement. On June 24, 2003, <strong>the</strong>DOJ arrested Mr. Wingfield and filed a criminal complaint charging himwith violating <strong>the</strong> Sherman <strong>An</strong>titrust Act, 15 U.S.C. § 1.In February 2004, <strong>the</strong> Company filed a civil action in <strong>the</strong> United StatesDistrict Court <strong>for</strong> <strong>the</strong> Eastern District of Pennsylvania against <strong>the</strong> DOJ toen<strong>for</strong>ce <strong>the</strong> Amnesty Agreement and to seek specific per<strong>for</strong>mance and/or apermanent injunction in order to en<strong>for</strong>ce <strong>the</strong> Amnesty Agreement’s bar oncriminal prosecution <strong>for</strong> certain activity relating to <strong>the</strong> parcel tanker industryhaving occurred prior to January 15, 2003. On March 2, 2004, <strong>the</strong> DOJnotified <strong>the</strong> Company that it was unilaterally voiding <strong>the</strong> Amnesty Agreementand revoking <strong>the</strong> Company’s Amnesty. On January 14, 2005, <strong>the</strong> district courtentered a judgement in favour of <strong>the</strong> Company and Mr. Wingfield, en<strong>for</strong>cing<strong>the</strong> January 15, 2003 Amnesty Agreement. Stolt-Nielsen S.A. v. United States,352 F. Supp. 2d 553 (E.D. Pa. 2005).Specifically, <strong>the</strong> court found that <strong>the</strong> Company had substantially per<strong>for</strong>med itsobligations under <strong>the</strong> Amnesty Agreement and permanently enjoined <strong>the</strong> DOJfrom indicting or prosecuting <strong>the</strong> Company and Mr. Wingfield <strong>for</strong> any violationof <strong>the</strong> Sherman <strong>An</strong>titrust Act prior to January 15, 2003, in <strong>the</strong> parcel tankerindustry involving transportation to and from <strong>the</strong> United States. Through thisorder, <strong>the</strong> court en<strong>for</strong>ced <strong>the</strong> Amnesty Agreement.The DOJ subsequently appealed <strong>the</strong> January 14, 2005 order. On March 23,2006, a two-judge panel of <strong>the</strong> United States Court of Appeals <strong>for</strong> <strong>the</strong> ThirdCircuit reversed and remanded <strong>the</strong> court’s ruling <strong>for</strong> fur<strong>the</strong>r proceedings.Stolt-Nielsen S.A. v. United States, No. 05-1480, 442 F.3d 177 (3d Cir. 2006).The panel’s decision did not address <strong>the</strong> merits of <strong>the</strong> Company’s argumentsregarding <strong>the</strong> effect of <strong>the</strong> Amnesty Agreement. Instead, <strong>the</strong> panel’s decisionwas based on <strong>the</strong> determination that <strong>the</strong> district court did not have <strong>the</strong>authority to issue a pre-indictment injunction.On August 23, 2006, <strong>the</strong> district court lifted <strong>the</strong> injunction against <strong>the</strong>Company’s prosecution. On September 6, 2006, <strong>the</strong> DOJ obtained <strong>the</strong>indictment of <strong>the</strong> Company, Richard B. Wingfield, and ano<strong>the</strong>r Companyexecutive, Samuel A. Cooperman.The September 6, 2006 single-count indictment (“<strong>the</strong> Indictment”) alleged aviolation of Section 1 of <strong>the</strong> Sherman Act, arising from an alleged conspiracyin <strong>the</strong> parcel tanker industry beginning in August 1998 and ending as late asNovember 2002. The <strong>An</strong>titrust Division’s criminal prosecution of <strong>the</strong> Company,Mr. Wingfield, and Mr. Cooperman, proceeded in <strong>the</strong> U.S. District Court in <strong>the</strong>Eastern District of Pennsylvania be<strong>for</strong>e U.S. District Judge Bruce W. Kauffman.The Company filed a Motion to Dismiss <strong>the</strong> Indictment in which it denied <strong>the</strong>criminal activity alleged to have occurred between March to November 2002and argued that, in any event, such activity fell within <strong>the</strong> grant of amnesty.In its opposition, <strong>the</strong> <strong>An</strong>titrust Division argued that <strong>the</strong> Amnesty Agreementwas of no effect due to <strong>the</strong> alleged failure of <strong>the</strong> Company to take “prompt andeffective action” in <strong>the</strong> period from March to November 2002 to terminate <strong>the</strong>anticompetitive activity being reported. <strong>An</strong> extensive evidentiary hearing washeld in May and June 2007 in federal district court in Philadelphia.On November 30, 2007, based on <strong>the</strong> evidentiary hearing, Judge Kauffmandismissed <strong>the</strong> <strong>An</strong>titrust Division’s indictment against <strong>the</strong> Company and its twoexecutives, Richard Wingfield and Samuel Cooperman. Judge Kauffman ruledthat <strong>the</strong> Company had not breached <strong>the</strong> Amnesty Agreement and that <strong>the</strong>Division’s conduct in prosecuting <strong>the</strong> Company was not only inconsistentwith <strong>the</strong> Amnesty Agreement, but was “fundamentally unfair”.Judge Kauffman’s ruling ended <strong>the</strong> parcel tanker criminal prosecution at <strong>the</strong>district court level. On December 21, 2007, <strong>the</strong> DOJ issued a press releasereporting that it would not appeal Judge Kauffman’s ruling. In January 2008,<strong>the</strong> DOJ confirmed in writing that it has <strong>for</strong>mally closed its antitrustinvestigation of <strong>the</strong> parcel tanker industry.European Commission <strong>An</strong>titrust Investigation into <strong>the</strong>Company’s Parcel Tanker BusinessOn February 25, 2003, SNSA announced that <strong>the</strong> EC had admitted <strong>the</strong>Company into its Immunity Program with respect to deep-sea parcel tankerand intra-Europe inland barge operations. In August 2004, <strong>the</strong> EC in<strong>for</strong>med<strong>the</strong> Company that it had closed its investigation into possible collusivebehaviour in <strong>the</strong> intra-Europe inland barge industry. In April 2007, <strong>the</strong>Company received <strong>the</strong> EC’s Statement of Objections regarding allegations ofillegal antitrust activity in <strong>the</strong> deep-sea parcel tanker industry from August24, 1998 to April 8, 2002. The Company continues to cooperate with <strong>the</strong>EC in this matter. The Company understands that it remains in <strong>the</strong> EC’sImmunity Program.The Company’s immunity depends on its having met its obligation tocooperate and o<strong>the</strong>rwise comply with <strong>the</strong> conditions of <strong>the</strong> ImmunityProgram. It is al<strong>way</strong>s possible that <strong>the</strong> EC could assert that <strong>the</strong> Company hasnot complied, or is not fully complying, with <strong>the</strong> terms and conditions of <strong>the</strong>EC Immunity Program. If this were to happen, <strong>the</strong> Company would first haveto be given notice and an opportunity to be heard. Thereafter, <strong>the</strong> Companycould be partly or fully removed from <strong>the</strong> Immunity Program and subject tosubstantial fines and penalties. There are currently no proceedings under<strong>way</strong> to take a<strong>way</strong> <strong>the</strong> Company’s provisional immunity and <strong>the</strong> Companyunderstands that it still enjoys its provisional grant of immunity.Additionally, it is possible that <strong>the</strong> EC could ultimately determine that itlacks jurisdiction over <strong>the</strong> deep-sea parcel tanker industry <strong>for</strong> <strong>the</strong> allegedconduct during <strong>the</strong> relevant time. Such a decision declining jurisdictionmight undermine <strong>the</strong> EC’s authority to grant immunity to <strong>the</strong> Company <strong>for</strong><strong>the</strong> relevant conduct in <strong>the</strong> deep-sea parcel tanker industry.Because of <strong>the</strong> pendency of <strong>the</strong> EC proceedings, <strong>the</strong> fact-intensive natureof <strong>the</strong> issues involved, and <strong>the</strong> inherent unpredictability of <strong>the</strong> outcome ofsuch proceedings, <strong>the</strong> Company has made no provisions <strong>for</strong> any fines relatedto <strong>the</strong> EC antitrust investigation in <strong>the</strong> accompanying consolidated financialstatements. It is possible that <strong>the</strong> outcome of this investigation, if negative,could result in substantial and material fines and penalties. Consequently,<strong>the</strong> outcome of <strong>the</strong> EC investigation could have a material adverse effecton <strong>the</strong> Company’s financial condition, cash flows and results of operations.Stolt-Nielsen <strong>An</strong>nual Report 200771
Stolt-Nielsen S.A.Notes to ConsolidatedFinancial Statementscontinued25. Legal Proceedings continuedParcel Tanker Investigations by O<strong>the</strong>r Competition AgenciesIn February 2004, <strong>the</strong> Canadian Competition Bureau (“CCB”) notified <strong>the</strong>Company that <strong>the</strong> CCB was engaged in antitrust investigations of <strong>the</strong> parceltanker shipping industry and <strong>the</strong> Company. It is <strong>the</strong> contention of <strong>the</strong> CCBthat <strong>the</strong> Company does not have amnesty in <strong>the</strong> CCB investigation of <strong>the</strong>parcel tanker industry. The Company understands that <strong>the</strong> CCB is investigatingviolations of Canadian bid rigging and price-fixing laws. Additionally, in 2007<strong>the</strong> CCB sought court-ordered discovery against third parties as part of anintensification of its investigation into potential competition violations in <strong>the</strong>parcel tanker industry. The CCB also contends that <strong>for</strong> certain of <strong>the</strong> allegedactions <strong>the</strong>re is no statute of limitations.The Company has cooperated to date in <strong>the</strong> CCB investigation, includingproviding <strong>the</strong> CCB with access to certain of its business records. The CCB hasconfirmed that its investigation is ongoing.Because of <strong>the</strong> continuing nature of <strong>the</strong> CCB investigation, <strong>the</strong> fact-intensivenature of <strong>the</strong> issues involved, and <strong>the</strong> inherent unpredictability of <strong>the</strong>outcome of such proceedings, <strong>the</strong> Company has made no provisions <strong>for</strong> anyfines related to <strong>the</strong> Canadian antitrust investigation in <strong>the</strong> accompanyingconsolidated financial statements. It is possible that <strong>the</strong> outcome of thisinvestigation could result in criminal prosecutions and if SNTG is found guilty,substantial and material fines and penalties. Consequently, <strong>the</strong> outcome of<strong>the</strong> CCB investigation could have a material adverse effect on <strong>the</strong> Company’sfinancial condition, cash flows and results of operations.U.S. Department of Justice Investigation into <strong>the</strong>Company’s Tank Container BusinessOn June 28, 2004, <strong>the</strong> Company received a grand jury subpoena from <strong>the</strong>DOJ <strong>An</strong>titrust Division calling <strong>for</strong> <strong>the</strong> production of <strong>documents</strong> relating to <strong>the</strong>Company’s tank container business, organized as a separate line of businessfrom <strong>the</strong> Company’s parcel tanker business. The Company cooperated with <strong>the</strong>DOJ in this matter.In February 2008, <strong>the</strong> DOJ confirmed in writing that it <strong>for</strong>mally closed itsantitrust investigation of <strong>the</strong> tank container industry.Possibility of Undisclosed Governmental InvestigationsThe <strong>for</strong>egoing are <strong>the</strong> government antitrust investigations of which <strong>the</strong>Company has received <strong>for</strong>mal notification.Because of <strong>the</strong> trend towards global coordination of competition agenciesand <strong>the</strong> confidentiality of certain investigations that <strong>the</strong>y conduct, it ispossible that <strong>the</strong>re are or may be additional investigations by o<strong>the</strong>r nationalauthorities of <strong>the</strong> parcel tanker industry, <strong>the</strong> tank container industry or o<strong>the</strong>rbusinesses in which <strong>the</strong> Company participates.It is also possible that <strong>the</strong> consequences of such investigations could have amaterial adverse effect on <strong>the</strong> Company’s financial condition, cash flows andresults of operations.U.S. Securities and Exchange Commission Formal InvestigationOn July 30, 2007, SNSA received a Formal Order of Private Investigationissued by <strong>the</strong> U.S. Securities and Exchange Commission (<strong>the</strong> “SEC”) relatedto, among o<strong>the</strong>r things, SNSA’s past stock options practices and procedures.Previously, SNSA had been <strong>the</strong> subject of an in<strong>for</strong>mal inquiry by <strong>the</strong> SEC.On September 4, 2007, SNSA received a subpoena from <strong>the</strong> SEC staff <strong>for</strong>certain Company records, including <strong>documents</strong> from January 1, 2001 to <strong>the</strong>date of <strong>the</strong> subpoena, (1) relating to compensation expenses associated with<strong>the</strong> Company’s stock option grants, (2) evaluating, considering or discussinga restatement of <strong>the</strong> Company’s financial results <strong>for</strong> <strong>the</strong> a<strong>for</strong>ementionedperiod, (3) reflecting <strong>the</strong> methodology used by <strong>the</strong> Company to determinemateriality in its financial statements and (4) supporting certaincompensation charges taken in 2005 and 2006 and o<strong>the</strong>r financial in<strong>for</strong>mationregarding stock option practices.SNSA is cooperating with <strong>the</strong> SEC and continues to provide responsive<strong>documents</strong>. The SEC’s investigation is ongoing. Because of <strong>the</strong> inherentunpredictability of <strong>the</strong> outcome of SEC investigations, <strong>the</strong> outcome of whichcould result in substantial and material fines and penalties, SNSA is unable todetermine whe<strong>the</strong>r or not an unfavourable outcome is probable, is unable toestimate a range of possible losses and has <strong>the</strong>re<strong>for</strong>e made no provision inrespect of this matter in <strong>the</strong> accompanying consolidated financial statements.The outcome of <strong>the</strong> SEC’s inquiry could have a material adverse effect on <strong>the</strong>Company’s financial condition, cash flows and results of operations.<strong>An</strong>titrust Civil Class Action Litigations and ArbitrationsDuring 2007, <strong>the</strong>re were five putative private antitrust class action lawsuitsoutstanding against <strong>the</strong> Company in U.S. federal and state courts <strong>for</strong> allegedviolations of antitrust laws, two of which were resolved in 2007. The threeremaining actions set <strong>for</strong>th almost identical claims of collusion and bidrigging that track in<strong>for</strong>mation in media reports regarding <strong>the</strong> DOJ andEC investigations.The suits seek treble damages in unspecified amounts and allege violations of<strong>the</strong> Sherman <strong>An</strong>titrust Act and various state antitrust and unfair trade practicesacts. The actions typically name as defendants SNSA and SNTG, along withseveral of SNTG’s competitors, such as Odfjell, Jo Tankers and Tokyo Marine.Of <strong>the</strong> two putative class action claims resolved in 2007, <strong>the</strong> claim involvingKP Chemicals had previously been voluntarily dismissed by <strong>the</strong> plaintiffsagainst all of <strong>the</strong> defendants. On November 21, 2006, however, KP Chemicalattempted to reinstate its claims against SNTG in its individual capacity(ra<strong>the</strong>r than as a class representative). SNTG and KP subsequently settledKP’s claims and on January 15, 2008, KP dismissed its claims. At that time,KP filed a revised notice of voluntary dismissal in <strong>the</strong> court action, withprejudice, bringing <strong>the</strong> matter to a complete close.The second putative class action, Fleurchem, was consolidated into <strong>the</strong> MDLproceedings described below, under <strong>the</strong> below caption:> Fleurchem, Inc., on behalf of itself and all o<strong>the</strong>rs similarly situated v.Stolt-Nielsen S.A., Stolt-Nielsen Transportation Group Ltd., Odfjell ASA, OdfjellUSA Inc., Jo Tankers BV, Jo Tankers USA, Inc., and Tokyo Marine Co. Ltd,H-03-3385 (S.D. Tex.) (“Fleurchem”).On December 9, 2005, SNTG filed a motion to compel arbitration ofFleurchem’s claims. On February 6, 2006, <strong>the</strong> court ordered one-<strong>way</strong> discoveryagainst Fleurchem on <strong>the</strong> issue of its obligation to arbitrate. On January 3,2008, plaintiff’s counsel in <strong>the</strong> Fleurchem matter filed a voluntary Notice ofDismissal with prejudice with <strong>the</strong> court, <strong>the</strong>reby fully resolving <strong>the</strong> matterbetween <strong>the</strong> parties.As a result of <strong>the</strong> above settlement, only <strong>the</strong> following three putativeantitrust class action lawsuits remain outstanding in U.S. federal and statecourts, or in arbitration proceedings:1. Karen Brock, on behalf of herself and all o<strong>the</strong>rs similarly situated, v.Stolt-Nielsen S.A., Stolt-Nielsen Transportation Group Ltd., Odfjell ASA,Odfjell USA, Inc., Jo Tankers BV, Jo Tankers USA, Inc., Tokyo Marine Co. Ltdand Does 1 through 100 inclusive, No. CGC 04429758 (Superior Court of Cal.,County of San Francisco) (“Brock”);2. Scott Sutton, on behalf of himself and all o<strong>the</strong>rs similarly situated in <strong>the</strong>State of Tennessee v. Stolt-Nielsen S.A., Stolt-Nielsen Transportation GroupLtd., Odfjell ASA, and Odfjell Seachem AS, Odfjell USA Inc., Jo Tankers BV,Jo Tankers USA, Inc., and Tokyo Marine Co. Ltd., No. 28,713-II (Cir. Ct.Cocke County, Tenn.) (“Sutton”); and72 www.stolt-nielsen.com
Financial Statements3. <strong>An</strong>imalFeeds International Corp., Inversiones Pesqueras S.A., CentralPacific Protein Corp, and Atlantic Shippers of Texas, Inc., individually andon behalf of all o<strong>the</strong>rs similarly situated v. Stolt-Nielsen S.A., Stolt-NielsenTransportation Group Ltd., Odfjell ASA; Odfjell USA Inc., Jo Tankers BV, JoTankers USA, Inc., and Tokyo Marine Co. Ltd, 2:03-CV-5002 (E.D. Pa.)(“<strong>An</strong>imalFeeds”).State Court Indirect Purchaser <strong>An</strong>titrust Actions: Brock and Sutton.In Brock and Sutton, indirect purchasers claim in state court actions thatalleged collusion resulted in higher prices being passed on to <strong>the</strong>m. The Brockaction has been stayed by agreement of <strong>the</strong> parties.The Company has filed a motion to dismiss <strong>the</strong> Sutton complaint in its entirety.Briefing is complete, and oral arguments are scheduled <strong>for</strong> March 7, 2008.Multidistrict Litigation (MDL) in <strong>the</strong> U.S. District Court <strong>for</strong> <strong>the</strong> Districtof Connecticut. In <strong>An</strong>imalFeeds, customers claim that, as a result ofdefendants’ alleged collusive conduct, <strong>the</strong>y paid higher prices under <strong>the</strong>ircontracts with <strong>the</strong> defendants. <strong>An</strong>imalFeeds had been consolidated into asingle multidistrict litigation (“MDL”) proceeding in <strong>the</strong> U.S. District Court <strong>for</strong><strong>the</strong> District of Connecticut (<strong>the</strong> “MDL Court”) captioned “In re Parcel TankerShipping Services <strong>An</strong>titrust Litigation”. The MDL court, <strong>the</strong> U.S. District Court<strong>for</strong> <strong>the</strong> District of Connecticut, required <strong>An</strong>imalFeeds, as a direct purchaser,to proceed in arbitration ra<strong>the</strong>r than in federal district court. The Companyproceeded to arbitrate with <strong>An</strong>imalFeeds be<strong>for</strong>e a five-member tribunal(“New York Arbitral Tribunal”).The parties agreed to divide <strong>the</strong> proceedings into three phases: (1) clauseconstruction (to determine if class arbitration is permitted under <strong>the</strong>arbitration clause); (2) class certification; and (3) merits/liability. Afteran initial unfavourable ruling from <strong>the</strong> New York Arbitral Tribunal, <strong>the</strong> U.S.District Court <strong>for</strong> <strong>the</strong> Sou<strong>the</strong>rn District of New York ruled that class arbitrationis not permitted under <strong>the</strong> parties’ arbitration clauses. Accordingly, <strong>the</strong> cour<strong>the</strong>ld <strong>An</strong>imalFeeds may only arbitrate its individual claims.<strong>An</strong>imalFeeds has appealed this decision to <strong>the</strong> U.S. Court of Appeals <strong>for</strong> <strong>the</strong>Second Circuit. In light of <strong>the</strong> ongoing Second Circuit appeal, <strong>the</strong> New YorkArbitral Tribunal has stayed proceedings in <strong>the</strong> arbitration.In light of <strong>the</strong> early stages of <strong>the</strong>se litigations and arbitrations, <strong>the</strong>fact-intensive nature of <strong>the</strong> issues involved, <strong>the</strong> unsettled law and <strong>the</strong>inherent uncertainty of litigation and arbitration, <strong>the</strong> Company is not able todetermine whe<strong>the</strong>r or not a negative outcome in any of <strong>the</strong>se ongoing actionsis probable, or a reasonable range <strong>for</strong> any such outcome, and <strong>the</strong> Companyhas not made any provision <strong>for</strong> any of <strong>the</strong>se claims in <strong>the</strong> accompanyingconsolidated financial statements. It is possible that <strong>the</strong> outcomes of anyor all of <strong>the</strong>se proceedings could have a material adverse effect on <strong>the</strong>Company’s financial condition, cash flows and results of operations.Direct Purchaser Opt-Out ArbitrationIn addition to <strong>the</strong> three remaining putative class actions described above,numerous o<strong>the</strong>r parcel tanker customers of SNTG have come <strong>for</strong>ward in <strong>the</strong>past five years and presented <strong>for</strong>mal arbitration demands. As previouslydisclosed, SNTG has resolved many such claims in confidential commercialagreements. During 2007, SNTG concluded six such commercial agreements,<strong>the</strong>reby resolving all outstanding <strong>for</strong>mal arbitration demands. Certain o<strong>the</strong>rcustomers of SNTG have broached potential issues arising out of <strong>the</strong> parceltanker industry in discussions with SNTG, but to date have not <strong>for</strong>mally servedarbitration demands or o<strong>the</strong>r <strong>for</strong>mal claims.In light of <strong>the</strong> early stage of <strong>the</strong>se potential claims, <strong>the</strong> fact intensive natureof <strong>the</strong> issues involved, <strong>the</strong> inherent uncertainty of litigation and arbitration,<strong>the</strong> unsettled law and <strong>the</strong> potential offsetting effect of counterclaims assertedagainst <strong>the</strong> claimants, <strong>the</strong> Company is not able to determine whe<strong>the</strong>r or not anegative outcome in any of <strong>the</strong>se actions is probable, or a reasonable range<strong>for</strong> any such outcome, and has made no provision <strong>for</strong> <strong>the</strong> claims raised in<strong>the</strong>se proceedings in <strong>the</strong> accompanying consolidated financial statements.Given <strong>the</strong> volume of commerce involved in <strong>the</strong> Company’s parcel tankerbusiness, an adverse ruling in one or more of <strong>the</strong>se civil antitrust proceedingscould subject <strong>the</strong> Company to substantial civil damages in light of <strong>the</strong> trebledamages provisions of <strong>the</strong> Sherman <strong>An</strong>titrust Act.The Company has noted that <strong>the</strong> civil damages in major civil antitrustproceedings in <strong>the</strong> last decade have ranged as high as hundreds of millionsof dollars, including where companies have entered into <strong>the</strong> DOJ’s CorporateLeniency Program.This range involving o<strong>the</strong>r companies and o<strong>the</strong>r circumstances is notnecessarily indicative of <strong>the</strong> range of exposure that <strong>the</strong> Company would facein <strong>the</strong> event of an adverse outcome, although it is possible that <strong>the</strong> outcomesof any or all of <strong>the</strong>se proceedings could have a material adverse effect on <strong>the</strong>Company’s financial condition, cash flows and results of operations.Customer SettlementsThe Company has actively engaged in discussions with a number of customers,including many of those described above, regarding <strong>the</strong> subject matter of <strong>the</strong>DOJ and EC antitrust investigations.To date, <strong>the</strong> Company has reached agreements or agreements in principleresolving existing and potential antitrust claims with a significant numberof its major customers, with <strong>the</strong> condition that <strong>the</strong> customer relinquishesall claims arising out of <strong>the</strong> matters that are <strong>the</strong> subject of <strong>the</strong>antitrust investigations.These agreements include <strong>the</strong> settlements specifically described above, andadditional settlements of potential claims that were never made in anylawsuit or arbitration. These agreements typically affect <strong>the</strong> commercial termsof <strong>the</strong> Company’s contracts with <strong>the</strong> relevant customers. In some cases, <strong>the</strong>Company has also agreed to future discounts, referred to as rebates, which aresubject to a maximum cap and are tied to continuing or additional businesswith <strong>the</strong> customer.The potential future rebates which are not guaranteed by <strong>the</strong> Company, arenot charged against operating revenue unless <strong>the</strong>y are in consideration <strong>for</strong>settlement of existing or potential antitrust claims or <strong>the</strong> rebate is earned.The aggregate amount of such future non-guaranteed rebates <strong>for</strong> which <strong>the</strong>Company could be responsible under agreements, agreements in principle andoffers made and unrecognized as of November 30, 2007, is approximately$0.8 million. The Company expects that most of <strong>the</strong> operating revenue thatwould be subject to <strong>the</strong>se rebates will occur within <strong>the</strong> 12 months subsequentto November 30, 2007. In certain cases, SNTG has also agreed to make upfrontcash payments or guaranteed payments to customers, often inconjunction with rebates.The Company has made provisions against operating revenue totalling$10.6 million and $21.9 million in 2007, and 2006 respectively, reflectingsuch payment terms of settlement agreements or agreements in principle oroffers made to customers.The Company continues to engage in business negotiations with o<strong>the</strong>rcustomers. There can be no certainty regarding <strong>the</strong> results of <strong>the</strong>se ongoingnegotiations, each is highly individualized and involves numerous commercialand litigation factors.Stolt-Nielsen <strong>An</strong>nual Report 200773
Stolt-Nielsen S.A.Notes to ConsolidatedFinancial Statementscontinued25. Legal Proceedings continued<strong>An</strong>titrust Civil Action by Former CompetitorOn June 23, 2004, <strong>the</strong> bankruptcy trustee <strong>for</strong> O.N.E. Shipping, Inc. (“O.N.E.”),a <strong>for</strong>mer competitor of SNTG, filed an antitrust lawsuit against SNTG in <strong>the</strong>U.S. District Court <strong>for</strong> <strong>the</strong> Eastern District of Louisiana alleging claims understate and federal laws.The claims generally track <strong>the</strong> factual allegations in <strong>the</strong> putative classaction lawsuits and direct opt-out lawsuits described above, except that<strong>the</strong> complaint alleges that SNTG conspired with o<strong>the</strong>r parcel tanker firms tocharge predatory prices, that is, prices that were below a competitive level,<strong>the</strong>reby driving O.N.E. out of business.This lawsuit seeks treble damages in <strong>the</strong> tens of millions of dollars related toalleged suppression and elimination of competition. It has been consolidatedin <strong>the</strong> MDL litigation. On May 9, 2007, <strong>the</strong> court partially granted SNTG’smotion to dismiss by dismissing <strong>the</strong> state law claims as time-barred, <strong>the</strong>claims against Odfjell Terminals and Stolthaven <strong>for</strong> failure to state a claim,and any claims under federal law relating to a conspiracy to raise prices. Theruling allowed O.N.E. to proceed on its claims <strong>for</strong> predatory pricing underfederal law against defendants.On June 5, 2007, SNTG filed a motion <strong>for</strong> reconsideration based on new SupremeCourt authority. This motion has been fully briefed and <strong>the</strong> parties await a ruling.In light of <strong>the</strong> early stage of this lawsuit and <strong>the</strong> inherent uncertainty oflitigation, <strong>the</strong> Company is not able to determine whe<strong>the</strong>r or not a negativeoutcome in this action is probable, or a reasonable range <strong>for</strong> any suchoutcome, and has made no provision <strong>for</strong> <strong>the</strong> claims raised in this lawsuit in<strong>the</strong> accompanying consolidated financial statements. It is possible that <strong>the</strong>outcome of this action could have a material adverse effect on <strong>the</strong> Company’sfinancial condition, cash flows and results of operations.Securities LitigationIn March 2003, an individual claiming to have purchased SNSA’s AmericanDepositary Receipts, Joel Menkes, filed a purported civil securities classaction in <strong>the</strong> U.S. District Court <strong>for</strong> <strong>the</strong> District of Connecticut againstSNSA and certain officers and directors. Plaintiffs’ counsel have since replacedMr. Menkes with Irene and Gustav Rucker. The current complaint appears tobe based significantly on media reports about <strong>the</strong> O’Brien action (describedbelow) and <strong>the</strong> DOJ and EC investigations (described above). Pursuant to<strong>the</strong> Private Securities Litigation Re<strong>for</strong>m Act, <strong>the</strong> court allowed <strong>for</strong> <strong>the</strong>consolidation of any o<strong>the</strong>r class actions with this one. No o<strong>the</strong>r classactions were brought during <strong>the</strong> time allowed.On September 8, 2003, <strong>the</strong> plaintiffs filed <strong>the</strong>ir Consolidated AmendedClass Action Complaint against <strong>the</strong> same defendants.The consolidated complaint was brought on behalf of “all purchasers ofStolt’s American Depository Receipts (“ADR’s”) from May 31, 2000, throughFebruary 20, 2003… and all U.S. located purchasers of Stolt securities tradedon <strong>the</strong> Oslo Exchange to recover damages caused by defendants’ violationsof <strong>the</strong> Securities Exchange Act of 1934”.The complaint claims that SNSA “concealed that a material portion of SNSA’sand SNTG’s revenues and earnings from 2001 through February 2003 camefrom an illegal pact between SNTG and Odfjell ASA... to rig bids <strong>for</strong>international shipping contracts...”.The consolidated complaint asserted that SNSA’s failure to disclose suchalleged behaviour, coupled with allegedly “false and misleading” statements,caused plaintiffs to pay inflated prices <strong>for</strong> SNSA’s securities by making itappear that <strong>the</strong> Company was “immune to an economic downturn that wasafflicting <strong>the</strong> rest of <strong>the</strong> shipping industry” and “misleading <strong>the</strong>m to believethat <strong>the</strong> Companies’ earnings came from legitimate transactions”.SNSA has sought to dismiss <strong>the</strong> complaint. By order issued September 12,2006, <strong>the</strong> district court dismissed with prejudice plaintiffs’ scheme liabilityclaims against all defendants in <strong>the</strong> case but <strong>the</strong> o<strong>the</strong>r claims have not beendismissed. On December 4, 2006, <strong>the</strong> court granted <strong>the</strong> SNSA’s motion to staydiscovery due to <strong>the</strong> <strong>the</strong>n-pending parcel tanker criminal proceeding, andrequired SNSA to file intermittent status reports with <strong>the</strong> court concerning<strong>the</strong> continued need <strong>for</strong> a stay order. The last status report was submitted to<strong>the</strong> court on February 15, 2008, and <strong>the</strong> parties are in discussions as to <strong>the</strong>conduct of discovery.The Company is vigorously defending itself against this lawsuit. The Companyis not able to determine whe<strong>the</strong>r or not a negative outcome in this actionis probable, or a reasonable range <strong>for</strong> any such outcome, and <strong>the</strong> Companyhas not made any provisions <strong>for</strong> any liability related to <strong>the</strong> action in <strong>the</strong>accompanying consolidated financial statements. It is possible that <strong>the</strong>outcome of this litigation could have a material adverse effect on <strong>the</strong>Company’s financial condition, cash flows and results of operations.Employment LitigationIn an action filed in <strong>the</strong> Superior Court in Connecticut, <strong>the</strong> Company andits <strong>for</strong>mer chairman have been sued by a <strong>for</strong>mer employee, Paul E. O’Brien,who resigned in early 2002.The plaintiff in <strong>the</strong> O’Brien action, a <strong>for</strong>mer in-house counsel, seeks damages<strong>for</strong> constructive discharge and alleges that <strong>the</strong> Company was engagingin ongoing “illegal antitrust activities that violated United States andinternational law against price fixing and o<strong>the</strong>r illegal collusive conduct”.The O’Brien action also seeks an order allowing <strong>the</strong> plaintiff to discloseclient confidences and secrets regarding <strong>the</strong>se allegations and protecting<strong>the</strong> plaintiff from civil or disciplinary proceedings after such revelation.The complaint, as amended, does not specify <strong>the</strong> damages sought o<strong>the</strong>rthan to state <strong>the</strong>y are in excess of <strong>the</strong> $15,000 jurisdictional minimum.SNTG filed motions <strong>for</strong> summary judgement on <strong>the</strong> entire complaintbased, among o<strong>the</strong>r things, on <strong>the</strong> grounds that: 1) a New York lawyercannot maintain an action against his client where it will necessarily requiredisclosure of privileged in<strong>for</strong>mation or client confidences; and 2) O’Brienfailed pursuant to New York (and Connecticut) law to report his concerns“up <strong>the</strong> corporate ladder” in March 2002. By agreement of <strong>the</strong> parties, inSeptember 2004, <strong>the</strong> Superior Court heard arguments on only <strong>the</strong> first ground<strong>for</strong> summary judgement. In October 2004, <strong>the</strong> Superior Court denied thatbranch of <strong>the</strong> summary judgement motion.SNTG immediately took an interlocutory appeal, and SNTG’s petition <strong>for</strong>review by <strong>the</strong> Connecticut state Supreme Court was denied in April 2005.A September 2008 date has been set <strong>for</strong> trial. The parties are still conductingcertain limited discovery in preparation <strong>for</strong> trial. The Company intendsto continue to vigorously defend itself against this lawsuit. AlthoughMr. O’Brien’s complaint is based on his allegations that <strong>the</strong>re was ongoingillegal conduct as of March 2002, Judge Kaufman’s decision dismissing <strong>the</strong>criminal antitrust indictment against <strong>the</strong> Company found that <strong>the</strong> Companyhad taken prompt and effective action in early 2002 to stop ongoing illegalantitrust activity. The Company is not able to determine whe<strong>the</strong>r or not anegative outcome in this action is probable, or a reasonable range <strong>for</strong> anysuch outcome, and has not made any provision <strong>for</strong> any liability related to<strong>the</strong> action in <strong>the</strong> accompanying consolidated financial statements.It is possible that <strong>the</strong> outcome of this litigation could have a material adverseeffect on <strong>the</strong> Company’s financial condition, cash flows and results of operations.74 www.stolt-nielsen.com
Financial StatementsGeneralThe Company is a party to various o<strong>the</strong>r legal proceedings arising in <strong>the</strong>ordinary course of business. The Company believes that none of those matterswill have a material adverse effect on its business or financial condition.The ultimate outcome of governmental and third-party legal proceedings isinherently difficult to predict. It is reasonably possible that actual expensesand liabilities could be incurred in connection with both asserted andunasserted claims in a range of amounts that cannot reasonably be estimated.It is possible that such expenses and liabilities could have a material adverseeffect on <strong>the</strong> Company’s financial condition, cash flows and results ofoperations. The Company’s operations are affected by U.S. and <strong>for</strong>eignenvironmental protection laws and regulations. Compliance with such lawsand regulations entails considerable expense, including ship modificationsand changes in operating procedure.Due to <strong>the</strong> uncertainty over <strong>the</strong> resolution of <strong>the</strong> matters described above,as of November 30, 2007, <strong>the</strong> Company had not established any reserves <strong>for</strong>legal fees and costs related to <strong>the</strong>se proceedings.26. Subsequent EventsFinal 2007 DividendOn February 7, 2008, <strong>the</strong> Company’s Board of Directors recommendeda final 2007 dividend of $0.50 per Common share, payable June 4, 2008to shareholders of record on May 21, 2008. The dividend, which is subjectto shareholder approval, will be voted on at <strong>the</strong> Company’s <strong>An</strong>nual GeneralMeeting of Shareholders scheduled <strong>for</strong> May 15, 2008 in Luxembourg.If approved <strong>the</strong> dividend will result in an aggregate cash payment toshareholders of Common shares of $30 million. SNSA paid an interimdividend of $0.50 per Common share and $0.005 per Founder’s share onDecember 12, 2007 to shareholders on record as of November 28, 2007.U.S. DOJ <strong>An</strong>titrust Investigation into <strong>the</strong> Company’s Parcel Tanker Businessand Tank Container BusinessIn <strong>the</strong> first quarter of 2008, <strong>the</strong> DOJ confirmed in writing that it <strong>for</strong>mallyclosed its antitrust investigations of <strong>the</strong> parcel tanker and tankcontainer industries.Danish Ship Finance A/S $150 million Secured Term Loan FacilityOn February 8, 2008 <strong>the</strong> Company accepted an offer made by Danish ShipFinance A/S <strong>for</strong> a $150 million secured term loan facility to be secured byeight currently owned ships. The loan is expected to be drawn down in threetranches starting during <strong>the</strong> second quarter of 2008 with <strong>the</strong> final tranchebeing drawn in June 2009. Each tranche has a maturity of ten years after <strong>the</strong>drawdown date.NOK 825.6 Million Facility AgreementOn February 15, 2008, <strong>the</strong> Company entered into a NOK 825.6 million facilityagreement with Eksportfinancs and DnB Nor Bank ASA. It is <strong>the</strong> Company’sintent to make <strong>the</strong> first drawdown on <strong>the</strong> 12-year secured term loan in earlyMarch 2008. The loan is secured by a mortgage on <strong>the</strong> first two ships to bedelivered from Aker Yards Florø in Nor<strong>way</strong>. The second drawdown will takeplace on <strong>the</strong> delivery of hull number 150 from Aker Yards Florø, Nor<strong>way</strong>. Thetwo tranches combined are <strong>for</strong> NOK 825.6 million, with each trancheconverted into U.S. dollars at <strong>the</strong> draw down date.Stolt-Nielsen <strong>An</strong>nual Report 200775
Shareholder In<strong>for</strong>mationStock ListingCommon Shares—On Oslo Børs under symbol SNIShares Outstanding(as of November 30, 2007)Common Shares—59,553,563Country of IncorporationLuxembourg<strong>An</strong>nual General MeetingMay 15, 2008 at 2:00 p.m.Service Généraux de Gestion S.A.23, avenue MontereyL-2086 LuxembourgRegistrarCommon Shares—VPSDnB NOR Bank ASAStranden 21N-0250 Oslo 2 Nor<strong>way</strong>Tel: +47 22 48 35 20Fax: +47 22 94 90 20Email: Irene.johansen@dnbnor.noAuditorsDeloitte & Touche LLPHill House1 Little New StreetLondon, EC4A 3TR U.K.Financial In<strong>for</strong>mationCopies of press releases, quarterlyearnings releases, annual report, and2006 Form 20-F are available on <strong>the</strong>internet at www.stolt-nielsen.com or bycontacting:Valerie LyonStolt-Nielsen Ltd.65 Kings<strong>way</strong>London WC2B 6TD U.K.Tel: +44 20 7611 8904Fax: +44 20 7611 8965Email: v.lyon@stolt.comInvestor Relations and Press InquiriesShareholder, securities analysts, portfoliomanagers, representatives of financialinstitutions, and <strong>the</strong> press may contact:Jan Chr. EngelhardtsenStolt-Nielsen Ltd.65 Kings<strong>way</strong>London WC2B 6TD U.K.Tel: +44 20 7611 8972Fax: +44 20 7611 8966Email: j.engelhardtsen@stolt.comJens F. Grüner-HeggeStolt-Nielsen Ltd.65 Kings<strong>way</strong>London WC2B 6TD U.K.Tel: +44 20 7611 8985Fax: +44 20 7611 8966Email: j.gruner-hegge@stolt.comInternet Addresswww.stolt-nielsen.com76 www.stolt-nielsen.com
Stolt-Nielsen Offices and FacilitiesArgentinaStolt-Nielsen Argentina S.A.Buenos AiresTel: +54 11 4345 5001Fax: +54 11 4345 5004AustraliaStolt-Nielsen Australia Pty Ltd.MelbourneTel: +61 3 9820 3288Fax: +61 3 9820 9755BermudaStolt-Nielsen Ltd.HamiltonTel: +1 441 292 7337Fax: +1 441 295 5655BrazilStolthaven Santos Ltda.SantosTel: +55 13 3295 9000Fax: +55 13 3295 9002Stolt-Nielsen Brasil Ltda.São PauloTel: +55 11 3897 4999Fax: +55 11 3897 4950ChinaStolt-Nielsen China Ltd.ShanghaiTel: +86 21 58 779779Fax: +86 21 58 779778TianjinTel: +86 22 28 372278Fax: +88 22 28 372279FranceStolt Tank Containers France S.A.SLe HavreTel: +33 2 32 79 63 00Fax: +33 2 35 30 03 56IndiaStolt-Nielsen Ltd. India Liaison OfficeMumbaiTel: +91 22 269 2602Fax: +91 22 269 3665ItalyStolt Tank Containers Italy S.r.l.Vado LigureTel: +39 019 216 0190Fax: +39 019 216 2061JapanStolt-Nielsen Japan Co Ltd.TokyoTel: +81 3 6841 7001Fax: +81 3 6841 7059MexicoStolt-Nielsen Mexico, S.A. de C.V.Mexico CityTel: +52 559 000 0086Fax: +52 559 000 0091Ne<strong>the</strong>rlandsStolt Tankers B.V.RotterdamTel: +31 10 299 66 66Fax: +31 10 264 44 00Stolthaven Terminals B.V.RotterdamTel: +31 10 299 66 66Fax: +31 10 264 44 00Stolt Tank Containers B.V.RotterdamTel: +31 10 281 88 88Fax: +31 10 281 88 89Nor<strong>way</strong>Stolt-Nielsen Nor<strong>way</strong> ASOsloTel: +47 22 80 75 80Fax: +47 22 80 75 81Stolt-Nielsen Gas ASOsloTel: +47 22 00 48 00Fax: +47 22 80 75 81PhilippinesStolt-Nielsen Philippines, Inc.ManilaTel: +63 2 830 7900+63 2 815 9821Fax: +63 2 815 8462SingaporeStolt-Nielsen Singapore Pte. Ltd.Tel: +65 6273 4844Fax: +65 6273 7750South AfricaStolt-Nielsen Africa Ltd.Cape TownTel: +27 21 425 5425Fax: +27 21 425 5435SpainStolt Sea Farm S.A.La CoruñaTel: +34 981 837501Fax: +34 981 761031SwitzerlandStolt-Nielsen Switzerland AGZugTel: +41 41 726 1039Fax: +41 41 710 2666TaiwanStolt-Nielsen Taiwan Co., Ltd.TaipeiTel: +886 2 2518 5078Fax: +886 2 2509 2679United Arab EmiratesStolt-Nielsen Indian Ocean& Middle East Service Ltd.DubaiTel: +971 4 3328 444Fax: +971 4 3328 555United KingdomStolt-Nielsen Ltd.London, EnglandTel: +44 20 7611 8960Fax: +44 20 7611 8965Stolt Tank Containers UK Ltd.Rom<strong>for</strong>d, EnglandTel: +44 1708 74 60 70Fax: +44 1708 73 30 34United StatesStolt-Nielsen USA Inc.Norwalk, CTTel: +1 203 838 7100Fax: +1 203 299 0067Stolt-Nielsen USA Inc.Houston, TXTel: +1 281 860 6800Fax: +1 281 860 6860Stolt-Nielsen USA Inc.New Orleans, LATel: +1 985 781 4494Fax: +1 203 299 3931Sterling Caviar LLCElverta, CATel: +1 916 991 4420Fax: +1 916 991 4334Cert no. TT-COC-002238The Forest Stewardship Council (FSC) is an international networkwhich promotes responsible management of <strong>the</strong> world’s<strong>for</strong>ests. Forest certification is combined with a system ofproduct labelling that allows consumers to readily identifytimber-based products from certified <strong>for</strong>ests.Designed and produced by Black Sun Plc. Printed in England by Granite.
Stolt-Nielsen S.A.c/o Stolt-Nielsen Ltd.65 Kings<strong>way</strong>London WC2B 6TD U.K.Tel: +44 20 7611 8960Fax: +44 20 7611 8965www.stolt-nielsen.comM/T Stolt Sagaland is <strong>the</strong> firstof a series of six ships orderedfrom Aker Yards, Florø in Nor<strong>way</strong>.Delivered on February 28, 2008,she is 44,044 metric tons deadweighton summer draftof 11.85 metres, with lengthoverall of 182.72 metres anda beam of 32.2 metres. She has44,500 cubic metres capacityin her 39 cargo tanks (24 stainlesssteel and 15 coated tanks).