

Do Teenagers Respond to HIV Risk Information? Evidence from a ...
Do Teenagers Respond to HIV Risk Information? Evidence from a ...
Do Teenagers Respond to HIV Risk Information? Evidence from a ...

You also want an ePaper? Increase the reach of your titles
YUMPU automatically turns print PDFs into web optimized ePapers that Google loves.
American Economic Journal: Applied Economics 3 (January 2011): 1–34http://www.aeaweb.org/articles.php?doi=10.1257/app.3.1.1<strong>Do</strong> <strong>Teenagers</strong> <strong>Respond</strong> <strong>to</strong> <strong>HIV</strong> <strong>Risk</strong> <strong>Information</strong>?<strong>Evidence</strong> <strong>from</strong> a Field Experiment in Kenya †By Pascaline Dupas*We use a randomized experiment <strong>to</strong> test whether and what informationchanges teenagers’ sexual behavior in Kenya. Providing informationon the relative risk of <strong>HIV</strong> infection by partner’s age led <strong>to</strong>a 28 percent decrease in teen pregnancy, an objective proxy for theincidence of unprotected sex. Self-reported sexual behavior datasuggests substitution away <strong>from</strong> older (riskier) partners and <strong>to</strong>wardsame-age partners. In contrast, the official abstinence-only <strong>HIV</strong> curriculumhad no impact on teen pregnancy. These results suggest thatteenagers are responsive <strong>to</strong> risk information, but their sexual behavioris more elastic on the intensive than on the extensive margin.(JEL D83, I12, J13, O12)Nearly 2 million people become infected with <strong>HIV</strong>/AIDS every year in sub-Saharan Africa, the great majority of them through sex, and a quarter of thembefore the age of 25. 1 AIDS is incurable and no successful <strong>HIV</strong> vaccine has beendeveloped yet. Thus, ensuring the adoption of safer sexual behavior among youthsremains critical <strong>to</strong> combating the disease.Now that the great majority of children in Africa acquire at least some primaryeducation, some have argued that primary schools offer a unique opportunity <strong>to</strong>deliver <strong>HIV</strong> prevention education <strong>to</strong> youths before they become sexually active(World Bank 2002). There is, however, considerable debate over whether scalableschool-based <strong>HIV</strong>/AIDS education programs can be effective in limitingthe spread of <strong>HIV</strong>/AIDS among youths, and over what should be the conten<strong>to</strong>f these programs. Many sub-Saharan African countries have incorporated <strong>HIV</strong>/AIDS education in their school curriculum, but the great majority of those curriculaare limited <strong>to</strong> risk avoidance information; they aim at completely eliminating* Department of Economics, University of California-Los Angeles, 8283 Bunche Hall, Los Angeles, CA 90095.(e-mail: pdupas@econ.ucla.edu). Previous version circulated as “Relative <strong>Risk</strong> and the Market For Sex: <strong>Teenagers</strong>,Sugar Daddies and <strong>HIV</strong> in Kenya.” I thank anonymous referees for useful suggestions. I wish <strong>to</strong> thank Sandy Black,Moshe Buchinsky, David Evans, Michael Kremer, David Lee, James Habyarimana, Seema Jayachandran, AdrianaLleras-Muney, Rohini Pande, Debraj Ray, Jonathan Robinson, Kudzai Takavarasha, and Chris Udry, as well asnumerous seminar participants for very helpful comments and discussions. Special thanks <strong>to</strong> International ChildSupport (ICS) Africa and the Kenya Ministry of Education for their collaboration. This project would have beenimpossible without the dedication of Grace Makana, Susan Nduku, Carolyne Nekesa, and the field and data entryteams in Busia, Kenya. This project was supported by a grant <strong>from</strong> the World Bank. All views expressed are mineand do not necessarily reflect the opinions of the World Bank. All errors are my own.†To comment on this article in the online discussion forum, or <strong>to</strong> view additional materials, visit the article pageat http://www.aeaweb.org/articles.php?doi=10.1257/app.3.1.1.1UNAIDS (2008) Report on the Global AIDS Epidemic.1
2 American Economic Journal: applied economics january 2011pre-marital sex by promoting abstinence until marriage. They omit <strong>to</strong> providerisk reduction information, for example that condom use reduces the risk of <strong>HIV</strong>transmission.Voluntarily limiting information so that youths are unaware of the “low risk”option (e.g., condom-protected sex) and only face the choice set {high risk; no risk}might be socially optimal since individuals do not internalize the epidemiologicalexternalities of their own behavior, and therefore what might be optimal at the individuallevel (a low but nonzero risk level) might be suboptimal <strong>from</strong> a public healthperspective. However, if sexual behavior is more elastic on what we could call theintensive margin (what type of sex <strong>to</strong> have and with whom) than on the extensivemargin (whether <strong>to</strong> have sex or not), <strong>HIV</strong> education programs that focus only onabstinence may be ignoring an important margin along which youths could reducetheir risk of infection.This paper uses data <strong>from</strong> a field experiment <strong>to</strong> measure the responsiveness ofteenagers <strong>to</strong> <strong>HIV</strong> information and compares their responses along both the riskavoidance and the risk reduction margins. The risk reduction margin we focus onis partner selection. Partner selection is an important risk reduction margin forteenagers in sub-Saharan Africa, where the prevalence of <strong>HIV</strong> is at least threetimes higher among teenage girls than among teenage boys. 2 Multiple studieshave suggested that this discrepancy is due, in part, <strong>to</strong> the high incidence ofunsafe cross-generational sexual relationships. That is, unprotected sex betweenteenage girls and adult men more than five years their senior. 3, 4 Men involved inthese relationships, often called “sugar daddies,” are more likely <strong>to</strong> be infectedwith <strong>HIV</strong> than teenage boys since they have been sexually active for longer.Thus, compared <strong>to</strong> relationships with teenage boys, cross-generational relationshipspose a higher risk of <strong>HIV</strong> infection for teenage girls. On the other hand,older men, who typically have more income, are usually better able <strong>to</strong> providefor the teenage girl and the baby if the sexual relationship leads <strong>to</strong> pregnancy.Since the distribution of income is more readily observable by teenage girls thanthe distribution of <strong>HIV</strong> infection, adult men may have an advantage over teenageboys in negotiating unprotected sex. Most <strong>HIV</strong> prevention campaigns may notreduce this advantage, since they only provide information on the average <strong>HIV</strong>risk (the overall prevalence) and their key message is that “Anyone can give you<strong>HIV</strong>.” Though true in essence, this message obscures the fact that in sub-SaharanAfrica, 25-year-old men are much more likely <strong>to</strong> have <strong>HIV</strong> than 16-year-oldboys.In this context, providing teenage girls with full information on <strong>HIV</strong> prevalencedisaggregated by gender and age groups may reduce the incidence of unprotected2For example, random tests administered by J. R. Glynn et al. (2001) showed that prevalence in the 15–19 agegroup was 22 percent among women, but only 4 percent among men in Kisumu (Kenya); the same statistic was 21percent for women and 3 percent for men in Ndola (Zambia). For Kenya as a whole, prevalence rates are lower (seeFigure 1), but the ratio between teenage girls and teenage boys is about the same.3Marie Laga et al. (2001), Nancy Luke and Kathleen M. Kurz (2002), Simon Gregson et al. (2002), R. J. Kellyet al. (2003), and Shelley Clark (2004).4The prevalence gap between young women and young men is also due <strong>to</strong> the fact that risk of male-<strong>to</strong>-female<strong>HIV</strong> transmission is greater than the risk of female-<strong>to</strong>-male transmission (Thomas A. Peterman et al. 1988), but thisbiological fac<strong>to</strong>r accounts for only a third of the gap observed (Gregson et al. 2002).
Vol. 3 No. 1 dupas: do teenagers respond <strong>to</strong> hiv risk information?3cross-generational partnerships, and along with it new <strong>HIV</strong> infections of youngwomen by older partners. The <strong>to</strong>tal amount of sexual activity might increase,however, if teenage girls who learn that sex with teenage boys is relatively safeincrease their sexual activity with teenage boys. This might have negative publichealth consequences, both in terms of teen pregnancies and in terms of lifetime <strong>HIV</strong>risk and its epidemiological implications (Jeremy Magruder 2007). A rigorous tes<strong>to</strong>f the impact of risk reduction information and how it compares with the impact ofrisk avoidance information is thus needed.Using data <strong>from</strong> a randomized field experiment involving 328 primary schools,this paper compares the effects of providing abstinence-only versus detailed <strong>HIV</strong>risk information on teenage sexual behavior. Half of the schools, randomly selected,received teacher training on the national <strong>HIV</strong>/AIDS curriculum, which focuses onaverage risk and encourages abstinence until marriage, but does not discuss riskreduction strategies (such as condom use or selection of safer partners). In 71schools, randomly selected after stratifying by teacher training status, an informationcampaign provided teenagers with information on the prevalence of <strong>HIV</strong> disaggregatedby age and gender group (the “Relative <strong>Risk</strong> <strong>Information</strong> Campaign,”henceforth RR). The randomized design ensured that there would be, in expectation,no systematic difference in the prior information held by the students across groupsat the onset of the programs. This ensures rigorous identification of the impact ofeach of the two types of risk information, by comparing behaviors and outcomesacross groups over time.The results suggest that the teacher training on the national <strong>HIV</strong>/AIDS curriculumhad no effect on the likelihood that teenage girls started childbearingwithin a year, suggesting no reduction in risky behavior. In contrast, the relativerisk information led <strong>to</strong> a 28 percent decrease in the likelihood that girls startedchildbearing within a year, suggesting an important decrease in the incidence ofunprotected sex among those girls. Furthermore, we find that the pregnanciesaverted by the relative risk information provision would have been with partnersmore than five years older, suggesting that the reduction in the incidenceof unsafe sex corresponds <strong>to</strong> a reduction in unsafe sex with older partners. Therelative risk information also led <strong>to</strong> an increase in self-reported sexual activityamong teenage boys, suggesting that girls substituted away <strong>from</strong> older partnersand <strong>to</strong>ward their agemates. But there was no increase in pregnancies amongteenage couples, consistent with the fact that teenage girls report higher rates ofcondom use, presumably in order <strong>to</strong> avoid pregnancy with resource-constrainedteenage boys.Taken <strong>to</strong>gether, these results suggest that the behavioral choices of teenagersare not responsive <strong>to</strong> risk avoidance messages, but are responsive <strong>to</strong> informationon the relative riskiness of potential partners. Overall, the relative risk informationled <strong>to</strong> an increase in reported sexual activity, but <strong>to</strong> a decrease in unsafe sex. Thissuggests that teenage sexual behavior is more elastic on the margin of what typeof sex <strong>to</strong> engage in—the choice of partner and the choice of protection level—thanon the margin of whether <strong>to</strong> engage in sex or not. These results suggest that, inthe fight against <strong>HIV</strong>, risk reduction messages might be more effective than riskavoidance messages.
4 American Economic Journal: applied economics january 2011Prior evidence on the effectiveness of sexual health education in Africa is almostnonexistent. 5 Melanie Gallant and Eleanor Maticka-Tyndale (2004) review 11studies of <strong>HIV</strong> education programs conducted in sub-Saharan Africa, and show thatthe mixed results generated by those studies are questionable, either because theydo not have a convincing identification strategy, or because they rely solely on selfreportedmeasures of risk-taking, which are likely <strong>to</strong> suffer <strong>from</strong> social desirabilitybiases. The only prior randomized controlled experiment in Africa that studied biologicaloutcomes lacked statistical power <strong>to</strong> detect small or moderate effects, andthus can only reject very large effects (R. J. Hayes et al. 2005). This paper overcomesthese shortcomings by using a randomized experiment that involved a largesample of primary schools in Kenya, combined with data on teenage pregnancy,arguably an objective measure of the incidence of unprotected sex.Our finding that teenagers are responsive <strong>to</strong> risk information is in line with studiesof youth behavior in other contexts, which have found that youths are responsive <strong>to</strong>information on the returns <strong>to</strong> education (Robert Jensen 2010), responsive <strong>to</strong> prices(Jonathan Gruber and Jonathan Zinman 2001; Rosalie Liccardo Pacula et al. 2001),and responsive <strong>to</strong> regula<strong>to</strong>ry incentives (Thomas S. Dee and William N. Evans 2001;Steven D. Levitt and Lance Lochner 2001). Our results also relate <strong>to</strong> the literatureon health information provision and behavior. While a relatively large US-basedliterature suggests that information alone is often ineffective at changing behavior(among recent studies, see for examples Julie S. <strong>Do</strong>wns, George Loewenstein, andJessica Wisdom 2009 for negative results on food choices, and Kevin C. Davis et al.2009 for mixed results on smoking behavior), the evidence for developing countriesis much scanter. Using a randomized prospective design in India, Jyotsna Jalan andE. Somanathan (2008) show that informing households that their drinking wateris contaminated increases the probability that they start purifying their water. InBangladesh, using data <strong>from</strong> a controlled experiment, Malgosia Madajewicz et al.(2007) find that informing households that their well water has an unsafe concentrationof arsenic raises the probability that they switch <strong>to</strong> another well. Our papercontributes <strong>to</strong> this nascent literature on how and when risk information affects healthbehavior in a less developed context.The remainder of the paper is organized as follows. Section I describes the Kenyancontext and the experimental design. Section II presents the theoretical motivationbehind the experimental design. Section III presents the data and outlines the evaluationstrategy. Section IV presents the results, and Section V concludes.I. Background and Experimental DesignThe experiment <strong>to</strong>ok place in two rural districts of Western Kenya, and involved a<strong>to</strong>tal of 328 primary schools. Among them, 163 were randomly chosen for Treatment1, the Teacher Training on the national <strong>HIV</strong>/AIDS curriculum for primary school,5Studies in the United States have yielded mixed evidence. <strong>Do</strong>uglas B. Kirby (2008) reviews 56 US-basedstudies and finds that most abstinence programs do not delay initiation of sex, while two thirds of the more comprehensiveprograms (that include both abstinence and risk reduction information) seem <strong>to</strong> have an impact on bothmargins (delay of initiation and increased condom use).
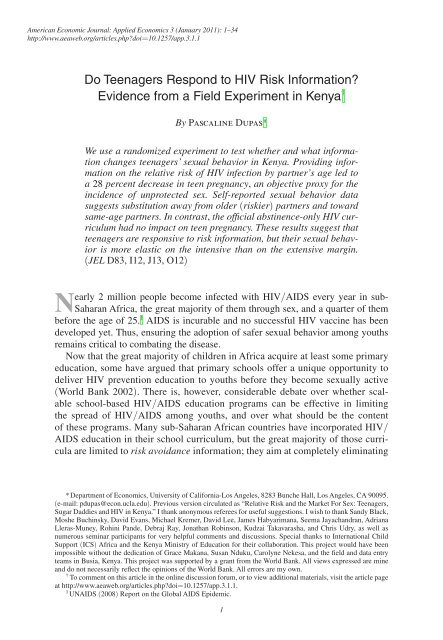
Vol. 3 No. 1 dupas: do teenagers respond <strong>to</strong> hiv risk information?51412.91211.7 11.8Percent <strong>HIV</strong> Positive108642392.47.36.68.4Female Male9.58.85.23.900.415–19 20–24 25–29 30–34 35–39 40–44 45–49Age GroupFigure 1. <strong>HIV</strong> Prevalence by Gender and Age Groups, KenyaSource: Kenya Demographic and Health Survey, 2003which focuses on abstinence-only messages. In addition, 71 schools were sampled<strong>to</strong> receive Treatment 2, the RR, that provided students in eighth grade with informationon <strong>HIV</strong> prevalence by sex and age. Before describing these two treatments indetail, we present some background summary statistics on <strong>HIV</strong> and sexual behavioramong youths in Kenya.A. Background on <strong>HIV</strong>, <strong>Teenagers</strong>, and <strong>HIV</strong> Education in Kenya<strong>HIV</strong> Prevalence.—The principal mode of transmission of <strong>HIV</strong> in Kenya is heterosexualcontact (Republic of Kenya Ministry of Health 2001). The 2003 KenyaDemographic and Health Survey estimated that 7 percent of Kenyan adults areinfected with <strong>HIV</strong> (Kenya Central Bureau of Statistics, Kenya Ministry of Health,and ORC Macro 2004). The breakdown by age and gender group is presented inFigure 1. The highest infection level is for women in the 25–29 age group (12.9percent). Levels of infection among young women rise quickly (3 percent in the15–19 age group and 9 percent in the 20–24 age group). In contrast, prevalencerises gradually with age among men, starting at 0.4 percent in the 15–19 age group,rising <strong>to</strong> 2.4 percent in the 20–24 age group, and reaching its peak (8.8 percent) inthe 40–44 age group.<strong>HIV</strong>-Related Knowledge and Sexual Behavior among <strong>Teenagers</strong>.—Table 1, panelA presents summary statistics on <strong>HIV</strong>-related knowledge and behavior collected atbaseline among a subset of students sampled for the experiment. At the time theycompleted the survey, the students were enrolled in the eighth grade (the last gradeof primary school). Due <strong>to</strong> high levels of repetition through primary school, studentsin the eighth grade are relatively old, 15 years old on average.
6 American Economic Journal: applied economics january 2011Table 1—Summary Statistics on Knowledge and Behavior among Adolescents in Study AreaGirls(1)Boys(2)Panel A. Baseline knowledge, attitudes and practice (self-reported) among eighth gradersAverage age 15.10 15.52(1.2) (1.5)Share reporting having had sex 0.21 0.48Share thinking condoms can prevent <strong>HIV</strong> infection 0.45 0.66Share thinking condoms can prevent pregnancy 0.46 0.71Share thinking men above 25 have a higher <strong>HIV</strong> infection rate than teenage boys 0.29 0.25Share reporting that some girls in the class have a partner who is not a student 0.61 0.57Observations 1,176 1,246SamplemeanPanel B. Partnership Survey (girls who started childbearing* within a year of startingeighth grade)Share reporting that the pregnancy was wanted 0.13Share reporting age difference with male partner > 5 years 0.49Share reporting age difference with male partner > 10 years 0.16Share reporting that the partnership was consensual 0.99Share reporting that the male partner made regular cash payments <strong>to</strong> the teenage girl0.70prior <strong>to</strong> the pregnancyShare reporting that the male partner is currently providing financial support <strong>to</strong> the teenage girl 0.79Share married if age difference < 5 years 0.45Share married if 5 years < age difference < 10 years 0.77Share married if age difference > 10 years 0.82Observations 184Notes: Standard deviations are presented in parentheses. Panel A: Self-reported data collected among teenagersenrolled in grade 8 in 2004, prior <strong>to</strong> RR information campaign. The survey was self-administered. Panel B:Childbearing data collected in August 2005 for teenage girls enrolled in a RR comparison school at baseline (2004),and who had begun childbearing by July 2005. In 55 percent of cases, the teenage girl was interviewed herself.In the rest of cases, she was not at home on the day of the enumera<strong>to</strong>r’s visit and a relative (typically her mother)answered questions on her behalf.* A girl is considered <strong>to</strong> have “started childbearing” if she has ever given birth or ever been pregnant.Overall, 21 percent of girls and 48 percent of boys sampled for the survey reportedthey had ever had sex. Knowledge of risk reduction strategies among these studentswas relatively limited, however. While 46 percent of girls and 71 percent of boysthought that condoms could protect <strong>from</strong> <strong>HIV</strong> infection, only 29 percent of girls and25 percent of boys knew that older men were more likely <strong>to</strong> be <strong>HIV</strong> positive thanteenage boys.Panel B of Table 1 presents data collected at the end of the study among girls in thecontrol group who had started childbearing within a year. The data suggests that thegreat majority (87 percent) of teen pregnancies we observed were unplanned. Overall,49 percent of teenage pregnancies observed in the control group were with partnersmore than 5 years older, and 16 percent with partners more than 10 years older. 66In a study conducted in western Kenya, Luke (2003) finds evidence that a larger age difference between partnersis associated with both a lower probability of condom use and higher transfers <strong>from</strong> the male <strong>to</strong> the femalepartner.
Vol. 3 No. 1 dupas: do teenagers respond <strong>to</strong> hiv risk information?7In 70 percent of teen pregnancies, the partnership involves regular cash transfers<strong>from</strong> the male <strong>to</strong> the female partner prior <strong>to</strong> the pregnancy. However, the older themale partner, the more likely pregnancy triggers marriage. While the rate of marriageis 45 percent if the teenage girl gets pregnant with a partner less than 5 yearsolder, it rises <strong>to</strong> 77 percent if the age difference between partners is 5 <strong>to</strong> 10 years,and <strong>to</strong> 82 percent if the age difference is greater than 10 years.National Policy on <strong>HIV</strong> Education.—The Kenya Ministry of Education, Science,and Technology (MoEST) integrated <strong>HIV</strong>/AIDS education in<strong>to</strong> the primary schoolcurriculum in 2001. The national <strong>HIV</strong>/AIDS curriculum includes information onthe biology of <strong>HIV</strong>/AIDS, how it is transmitted, how <strong>to</strong> care for people living withAIDS, and the consequences of the <strong>HIV</strong>/AIDS epidemic on families, schools, andthe country of Kenya more generally (with estimates of the prevalence as of 1999,the year in which the textbooks were printed). The <strong>HIV</strong> curriculum also includesa prevention section which emphasizes moral values, refusal skills, and abstinenceuntil marriage. The curriculum does not mention condoms and provides only limitedscope for teachers <strong>to</strong> discuss protected sex in response <strong>to</strong> students’ questions. Itdoes not cover partner selection, and although they cover love relationships betweensame-age boys and girls, the official textbooks do not mention cross-generationalrelationships (and their associated risk). The proposed strategies <strong>to</strong> avoid infectionare <strong>to</strong> “Avoid Sex” and <strong>to</strong> “Say NO <strong>to</strong> sex before marriage.” 7 All sexual activityoutside of marriage, irrespective of the age of the partner, is thus considered equallyrisky.While the <strong>HIV</strong>/AIDS curriculum was introduced in 2001, <strong>HIV</strong>/AIDS educationwas in effect largely absent <strong>from</strong> Kenyan primary schools by early 2003. Only afew schools had included <strong>HIV</strong>/AIDS in their timetable, and when asked why theydid not teach the mandated curriculum, schools and their teachers would often saythey were not familiar with its content or did not know how <strong>to</strong> teach the <strong>to</strong>pic. Inresponse, the Kenya Institute of Education (KIE) and the MoEST trained a numberof trainers <strong>to</strong> provide in-service training for teachers on <strong>HIV</strong>/AIDS education methodology.The training was being phased in over a large period of time (starting in2003), which allowed randomization.B. Experimental DesignTreatment 1: The Teacher Training Program (TT ).—In 2003, 328 primaryschools in the Bungoma and Butere/Mumias districts of Kenya’s Western Provincewere sampled for a randomized evaluation designed <strong>to</strong> test the effectiveness ofthe national <strong>HIV</strong> prevention curriculum for primary schools. 8 After stratifying the328 schools by location, test scores, and student sex ratio, half of the schools wererandomly chosen <strong>to</strong> receive Teacher Training (henceforth TT) on the <strong>HIV</strong>/AIDS7These are quotes <strong>from</strong> the official textbook Let Us Talk About AIDS, a book for Class 6, 7 and 8 (KenyaInstitute of Education 1999, 19, 26).8A <strong>to</strong>tal of seven divisions were sampled <strong>from</strong> those two districts. All public primary schools in those sevendivisions were sampled for the study. At the mean, each school in the sample has two other primary schools withina two kilometer radius. None of these schools had participated in any randomized experiment prior <strong>to</strong> this one.
8 American Economic Journal: applied economics january 2011curriculum in 2003. The training was conducted jointly by one facilita<strong>to</strong>r <strong>from</strong> theAIDS Control Unit of the Ministry of Education, two facilita<strong>to</strong>rs <strong>from</strong> the KenyaInstitute of Education, and one trained staff member <strong>from</strong> the non-governmentalorganization ICS. Three teachers per primary school (typically, the math, English,and physical education teachers, rotating across upper primary classes) were trainedduring multiple week-long in-service training sessions.During the training, teachers discussed the material in the official <strong>HIV</strong>/AIDScurriculum and learned how <strong>to</strong> discuss <strong>HIV</strong>/AIDS issues in class. Teachers werealso trained on how <strong>to</strong> set up a health club in their school, <strong>to</strong> encourage <strong>HIV</strong> avoidancethrough active learning activities such as role plays. Finally, they were giventhe latest estimates of <strong>HIV</strong>/AIDS prevalence in the region of study. 9Overall, the TT program had a large impact on the extent <strong>to</strong> which <strong>HIV</strong> educationwas provided in schools. Teachers were 50 percent more likely <strong>to</strong> have mentioned<strong>HIV</strong>/AIDS in the last week in schools sampled for the training, compared <strong>to</strong> controlschools. In addition, a year after the training, 86 percent of the schools whoseteachers had been trained had established health clubs (Esther Duflo et al. 2006).As a result, in a survey administered in 2005 (two years after the training), studentsin schools where teachers had been trained scored higher on knowledge questionsabout <strong>HIV</strong>/AIDS, such as how <strong>HIV</strong>/AIDS is transmitted, what <strong>HIV</strong> stands for, etc.(Duflo et al. 2006). This suggests that the TT program had a first stage effect on thequantity of <strong>HIV</strong> education provided <strong>to</strong> students.Treatment 2: The Relative <strong>Risk</strong> <strong>Information</strong> Campaign (RR).—<strong>Information</strong> onthe distribution of <strong>HIV</strong> infections by age and gender is typically not given <strong>to</strong> adolescentsby their teachers, even in schools sampled for the TT program, becauseit is not included in the official curriculum. To test the effect of this informationon teenage behavior, the RR was conducted in 2004 in 71 schools selected amongthe 328 schools involved in the TT experiment. The RR campaign was conductedby the non-governmental organization ICS. A trained project officer visited eachof those 71 schools and, with the authorization of the teachers, spoke <strong>to</strong> grade 8students for a 40-minute period. At the start of the period, the students were asked<strong>to</strong> complete an anonymous, self-administered survey <strong>to</strong> determine how much theyknew about the distribution of <strong>HIV</strong> in the Kenyan population. 10 After the survey,students were shown a 10-minute educational video on “sugar daddies.” 11 The videoscreening was followed by an open discussion about cross-generational sex. Duringthe discussion, the project officer shared the results of studies conducted in Kenya9The training was done prior <strong>to</strong> the round of <strong>HIV</strong> tests performed on the general population as part of the KenyaDemographic and Health Survey of 2003. Thus the prevalence estimates available at the time were based on antenatalsurveillance sites. Prevalence in the study area was estimated at 12 percent.10The results of this survey were discussed in Section IA and are presented in Table 1, panel A.11The animated movie, “Sara: The Trap,” was produced by ACE Communications, 2000, for UNICEF. Thesynopsis of the movie, as provided by the distribu<strong>to</strong>r, is the following: This episode addresses the issue of sexualexploitation of young girls by older men popularly known as “sugar daddies.” Sara is approached by Mbutu, a localshop keeper, who tries <strong>to</strong> trap her in<strong>to</strong> a sexual liaison. Mbutu offers <strong>to</strong> pay for Sara’s schooling and <strong>to</strong> give herother gifts. At school, Sara tells her friends what has happened, and girls in the school yard show off gifts that theyhave received <strong>from</strong>”sugar daddies.” Later Sara goes <strong>to</strong> the market <strong>to</strong> run errands. Mbutu gives her money for herUncle and a necklace. He bribes Sara <strong>to</strong> meet him that night. With the help of her friends and pet monkey, Sara isable <strong>to</strong> sabotage Mbutu’s plan <strong>to</strong> rape her and expose him <strong>to</strong> their fellow villagers.
Vol. 3 No. 1 dupas: do teenagers respond <strong>to</strong> hiv risk information?9and Zambia (Glynn et al. 2001) and Zimbabwe (Gregson et al. 2002) on the role ofcross-generational sex in the spread of <strong>HIV</strong>. In particular, the project officer wroteon the blackboard the detailed prevalence rates of <strong>HIV</strong>, disaggregated by genderand age group, in the nearby city of Kisumu, a city well-known <strong>to</strong> the students. 12The prevalence rates shared with students had been published by the World HealthOrganization (WHO) in 1997 and were reported in the Kenyan Government’s brochureAIDS in Kenya of 2001 (Republic of Kenya Ministry of Health 2001). 13 Inaccordance with the Kenyan government policy, the project officers conducting theRR program did not volunteer information on condoms nor demonstrate how <strong>to</strong> usecondoms, but scientifically answered students’ questions about condoms.The 71 schools chosen for the RR program were selected randomly after stratifyingby participation in the TT program of 2003. Thus, the RR program was implementedboth in schools where teachers had been trained and in schools whereteachers had not been trained. This design thus generated four groups of schools:schools with both the TT and RR programs, schools with TT only, schools with RRonly, and schools with neither of the two programs.II. Theoretical MotivationThis section provides a simple conceptual framework that incorporates the keyfacts observed in Section IA, and highlights the theoretical ambiguity in the overallsign of the effects of the two information sets (TT and RR).Consider that a teenage girl’s utility depends on her consumption of purchasedgoods as well as her health level, the number of sexual partnerships she is in, andwhether she has a child. Utility might be non-mono<strong>to</strong>nic in the number of sexualpartners, and having a child could be either desirable or undesirable.Engaging in a sexual partnership entails both a risk of <strong>HIV</strong> infection and a risk ofpregnancy. The health level that enters the utility is therefore a function of the girl’s<strong>HIV</strong> infection status, which itself depends on whether she engages in sexual partnerships,and on the characteristics of the partners she chooses. Whether a teenage girlgets pregnant and has a child depends on whether she engages in unprotected sexualpartnerships.Raising a child is costly. In other words, consumption of purchased goods is constrainedby a budget constraint of the form: pC + f F = W + Transf, where C is theconsumption of purchased goods and p is their price; f is the cost of rearing a childand F is a dummy equal <strong>to</strong> 1 if a girl has a child; W is the girl’s initial cash endowment;and Transf is the net amount she gets in transfers <strong>from</strong> her sexual partner(s),itself the outcome of bargaining between the teenage girl and her partner(s). Finally,we consider that the consumption of purchased goods is subject <strong>to</strong> a survival constraint:C ≥ C _.12The city of Kisumu is the capital of Nyanza Province. While prevalence in Kisumu is higher than in the rest ofKenya, the ratios between male and female by age groups and the ratios between age groups by gender are similar.13The <strong>HIV</strong> prevalence rates provided <strong>to</strong> the students were as follows:Age 15–19 20–24 25–29 30–39Female 22 percent 36 percent 35 percent 32 percentMale 4 percent 13 percent 28 percent 32 percent.
10 American Economic Journal: applied economics january 2011Teenage girls maximize their expected utility based on their beliefs about therisks of <strong>HIV</strong> infection and pregnancy occurring, and how those risks vary with condomuse and partners’ characteristics.A subcase of this model is the one in which girls derive no utility <strong>from</strong> being in asexual partnership and no utility <strong>from</strong> children. In such a case, the only reason whyteenage girls might want <strong>to</strong> engage in a sexual partnership is if the expected cos<strong>to</strong>f children is lower than the expected transfers <strong>from</strong> partners. This subcase of themodel can be called the “poverty-driven prostitution” case. 14A. Comparative Static 1: Impact of the Official <strong>HIV</strong> Prevention CurriculumThe framework above generates the following predictions regarding the impact ofintroducing general information about <strong>HIV</strong> (through the Teacher Training program)on teenage girls’ demand for sexual partnerships:• The program will have no effect on girls who already know about <strong>HIV</strong> at thetime the information is provided.• For girls who overestimate the risk of <strong>HIV</strong> at baseline and update their beliefsabout the <strong>HIV</strong> risk downward when exposed <strong>to</strong> the TT program, the programwill generate an increase in the demand for unprotected sexual partnerships.• For girls who are unaware or underestimate the risk of <strong>HIV</strong> at baseline andupdate upward their beliefs about the <strong>HIV</strong> risk when exposed <strong>to</strong> the TT program,the impact will be ambiguous.– Girls’ reservation transfer will go up, and therefore their demand for sexualpartnerships, holding the level of partners’ transfers constant, will decrease.– But men may have the resources <strong>to</strong> increase the amount they transfer. If theycan match girls’ new reservation transfer, the demand for sexual partnershipsamong teenage girls will remain unchanged. The average age of the malepartner will increase if older men have a higher willingness or ability <strong>to</strong> paythan teenage boys.B. Comparative Static 2: Impact of Providing Relative <strong>Risk</strong> <strong>Information</strong>The predictions regarding the impact of introducing relative risk information arethe following:• If all men have the same reservation price for sex with teenage girls (Transf is independen<strong>to</strong>f the male partner’s age), information on the distribution of prevalenceamong men unambiguously leads teenage girls <strong>to</strong> move <strong>to</strong>ward lower-risk partners(teenage boys) and thus reduce the rate of cross-generational transmission of <strong>HIV</strong>.• However, in a setting where teenage boys have a lower reservation price (eitherbecause they are poorer than older men, or because they have a lower taste for14This subcase seems <strong>to</strong> be what most aid agencies and practitioners in Africa have in mind. A number of callshave been made for programs offering young women “economic alternatives <strong>to</strong> trading their bodies for material andfinancial gain” (Population Services International 2005).
Vol. 3 No. 1 dupas: do teenagers respond <strong>to</strong> hiv risk information?11unprotected sex), the impact of the RR information on the transmission rate isambiguous, for two reasons:– First, the adjustment might occur on the transfer size margin rather than onthe partner selection margin. Older men could simply compensate girls forthe greater <strong>HIV</strong> risk they pose by transferring more resources <strong>to</strong> them (e.g.,marrying them).– Second, even if the adjustment happens on the partner type rather than on thetransfer size margin, girls who face a binding survival constraint might need<strong>to</strong> increase the number of men they engage in a partnership with. If youngermen can or are willing <strong>to</strong> transfer only half of what older men can transfer,teenage girls in the “poverty-driven prostitution” case may need <strong>to</strong> have twosimultaneous teenage boyfriends in order <strong>to</strong> meet their survival constraint.This would increase the incidence of unprotected sex between teenage girlsand teenage boys.• Finally, if information about the average prevalence of <strong>HIV</strong> in the area is alreadyknown at the time teenagers receive the RR information, providing RR informationmay trigger entry in<strong>to</strong> sexual activity by previously abstaining teenagegirls. They learn that the infection rate among teenage boys is below theaverage infection rate, and thus revise downward their beliefs about the risk ofengaging in sex with teenage boys, which can affect the decision <strong>to</strong> enter sexualactivity for girls at the margin.Given these potential positive effects of the RR information on the amount ofwithin-cohort sexual activity, providing RR information might thus have negativepublic health consequences, even if it reduces cross-generational sex. While individualsconsider the full cost of getting infected with <strong>HIV</strong> themselves, they maynot internalize the fact that they might transmit the disease <strong>to</strong> others once they getinfected; this means that while it might be privately optimal for individuals <strong>to</strong> choosea nonzero risk level, this level of risk will be higher than the socially optimal level.Overall, the theoretical predictions of both programs are thus unclear. The TTprogram could either increase, leave unchanged, or decrease the level of unprotectedsexual activity. The RR information could either have no impact at all, or reducecross-generational relationships with a one-for-one substitution <strong>to</strong>ward same-agerelationships, or reduce cross-generational relationships with a more than one-foroneincrease in same-age relationships. An empirical test is thus needed.III. Data and Estimation StrategyA. Timeline and SampleThe study timeline is presented in Figure 2. The TT program was phased in<strong>to</strong> 164schools over 4 months, <strong>from</strong> February 2003 <strong>to</strong> May 2003. The RR campaign wasphased in<strong>to</strong> 71 schools over 4 months, <strong>from</strong> July 2004 <strong>to</strong> Oc<strong>to</strong>ber 2004. 1515The school year in Kenya starts in January and ends in early December. Every November, students in grade 8take the Kenya Certificate of Primary Education (KCPE) exam, the gateway exam <strong>to</strong> secondary school. Students who
12 American Economic Journal: applied economics january 20112003 Feb. – May• PROGRAM 1 – Rollout of TT Program in 164 primary schools(all grades affected).2004 July – Oct.December• BASELINE DATA – Anonymous “Priors” Survey conducted in 71 primary schools(grade 8 students only).• PROGRAM 2 – Rollout of RR Program in same 71 primary schools(grade 8 students only).• School year ends. Most grade 8 students graduate <strong>from</strong> primary school.2005 JanuaryMarchMay – July• School year starts. Former grade 8 students enroll in secondary school if theyqualify (academically) and can pay tuition fees.• FOLLOW-UP DATA – Schooling, marital and childbearing status update viavisits at all 328 primary schools of origin.• FOLLOW-UP DATA – Anonymous follow-up survey administered at SecondarySchools in study area. Students filling-in survey asked <strong>to</strong> record primary school oforigin so that their “treatment” status can be identified.JulyAug. – Sep.• FOLLOW-UP DATA – Schooling, marital and childbearing status update viavisits at all 328 primary schools of origin.• FOLLOW-UP DATA – Follow-up survey conducted through home visits for girlsreported as having started childbearing.Figure 2. Study TimelineThe TT program affected all students in a school, whereas the RR programaffected only students in grade 8, the last grade of primary school. All studentsenrolled in grade 8 at the time of the RR campaign (2004) were sampled for thestudy and are hereafter referred <strong>to</strong> as the “study cohort.”No comprehensive baseline survey was administered <strong>to</strong> the study cohort.However, as described in Section IB, students in RR schools were asked <strong>to</strong> fill ashort, anonymous “priors” survey just before the RR information was provided<strong>to</strong> them. Summary statistics issued <strong>from</strong> this survey are presented in Table 1,panel A.By 2005, most of the students in the study cohort had left primary school.<strong>Information</strong> on their whereabouts could still be collected at their primary school oforigin, however. Appendix Table A1 presents summary statistics on their schoolingstatus as of July 2005, averaged by school and broken down by gender and treatmentstatus. Attrition is relatively low, below 2 percent, and cannot be distinguishedacross groups.B. OutcomesWe focus on two key outcomes: the incidence of unprotected sex between teenagegirls and male partners five or more years older; and the incidence of unprotectedperform well on the exam and whose family can afford the tuition fees begin secondary school the following January.
Vol. 3 No. 1 dupas: do teenagers respond <strong>to</strong> hiv risk information?13sex between teenage girls and teenage boys. Our main measure of the incidence ofunprotected sex is the incidence of childbearing. To complement the childbearingdata, we report evidence <strong>from</strong> self-reported sexual behavior data. 16Childbearing Data.—Childbearing data was collected in two steps. First, informationon schooling status, marital status, and childbearing status was obtained duringtwo primary school visits conducted in March and July 2005. At each visit, thelist of all students on the grade 8 registers of 2004 was read aloud <strong>to</strong> an assemblyof pupils in grades 6, 7, and 8 (often the siblings, neighbors, or friends of studentson the list). For each of the students on the list, the following questions were asked:Is X still in school? If yes, in what grade? In what school? <strong>Do</strong>es she still live in thearea? Is she married? <strong>Do</strong>es she have any children? If so, how many? How old is herfirst born? Is she pregnant? 17Second, enumera<strong>to</strong>rs conducted a home follow-up visit with girls who had beenreported <strong>to</strong> have started childbearing by July 2005. This follow-up <strong>to</strong>ok place inAugust/September 2005, and included a question on the age of the child’s father,in order <strong>to</strong> identify pregnancies that resulted <strong>from</strong> a cross-generational relationship.When the teenage girl herself could not be found (for example, because she hadmoved with her husband <strong>to</strong> another district), a relative (typically, the mother) wasinterviewed. Appendix Table A2 shows that the results are unchanged when we splitthe sample according <strong>to</strong> whether the girl was interviewed herself or not. 18Childbearing is not a perfect proxy for the incidence of risky sex, for variousreasons. First, adolescent girls who are in a long-term relationship with one partnerare more likely <strong>to</strong> get pregnant than those who have several short-term relationships.19 Second, since pregnancy by a teenage boy is unlikely <strong>to</strong> result in marriageor child support (see Section IA), teenage girls who get pregnant might be morelikely <strong>to</strong> abort if the father of the child is a teenager. Furthermore, teenage girlsmight be more likely <strong>to</strong> engage in nonvaginal sex with teenage partners, as a means16Data on the incidence of <strong>HIV</strong> and other sexually transmitted infections is not available. A pilot biomarkerfollow-up conducted in 2007 indicates that the incidence of <strong>HIV</strong> and other sexually transmitted infections in thisage group is not high enough for this study <strong>to</strong> have statistical power <strong>to</strong> detect significant differences in <strong>HIV</strong> prevalencebetween the treatment and the control groups.17This technique of collecting childbearing and marital outcomes generates accurate data. Among a subsampleof 282 teenage girls that were tracked at their home and interviewed, 88 percent of those who were reported ashaving started childbearing by their former schoolmates had indeed started childbearing, and 92 percent of thosewho were reported as not having started childbearing had indeed not started. The accuracy rates were similar acrossgroups.18In the presence of concurrent partnerships, it is possible that a girl might not know who the true biologicalfather of her child is. However, as long as a childbearing girl is married or supported by an older partner, it is safe<strong>to</strong> assume that, even if she had a concomittant teenage partner, she must have had unprotected sex with that olderpartner, in order <strong>to</strong> be able <strong>to</strong> convince him that he is the father. In addition, given that older partners are typicallywealthier, we can expect that in the presence of ambiguity about the biological father, the teenage girl (and her relatives)would choose <strong>to</strong> “blame” the pregnancy on the older (wealthier) partner.19In particular, partners willing <strong>to</strong> have a child might decide <strong>to</strong> undergo <strong>HIV</strong> testing <strong>to</strong> ensure they are bothnegative before having unprotected sex. This is unlikely for the age group in this sample since 87 percent of pregnanciesby teenage girls in the area of study are declared unplanned, as shown in Table 1, panel B. In addition, voluntary<strong>HIV</strong> counseling and testing services are not offered <strong>to</strong> minors in Kenya, unless they are considered “mature.”The definition of “mature” is unclear, but informal discussions with Voluntary <strong>HIV</strong> Counselling and Testing (VCT)counselors <strong>from</strong> the Kenya Ministry of Health suggest that adolescents below 18 rarely get tested. VCT is widelyavailable in the study area for adults, however. We do not have data on the impact of the information campaigns onthe demand for <strong>HIV</strong> testing among adults in the study area.
14 American Economic Journal: applied economics january 2011of avoiding pregnancy. Anal sex is of particular concern since it is highly risky interms of <strong>HIV</strong> transmission. All in all, the RR information could have increased theincidence of unprotected sex with teenage partners in the treatment group, but alsoincreased the incidence of abortion and/or the incidence of anal intercourse, thereforegenerating no increase in pregnancy rates among same-age partners. Giventhis, comparing the incidence of childbearing with same-age partners across groupscould underestimate the impact of the RR information on the incidence of risky sex.It is difficult <strong>to</strong> estimate the importance of these effects, since neither data onanal sex nor data on abortion is available. However, as a rough test of differentialincidence of abortions across groups, we can compare mortality rates among girls.Because abortion is illegal in Kenya, those that do happen tend <strong>to</strong> be unsafe andoften result in maternal death. 20 The results are shown in Appendix Table A1, row6. The mortality rate among girls between July 2004 and July 2005 was low (lessthan 0.2 percent) and similar across groups, providing some suggestive evidencethat the incidence of abortion was not greater in the RR treatment group than in theRR comparison group. This is obviously an extremely coarse test, but it suggeststhat, overall, the incidence of childbearing in the sample seems a reasonable, thoughimperfect, proxy for the incidence of unprotected sex.Self-Reported Sexual Behavior.—Since childbearing data is not a perfect proxyfor unprotected sex, it can be insightful <strong>to</strong> complement it with self-reported sexualbehavior data.As most students in the study sample left primary school shortly after the RRinformation program was implemented, conducting a follow-up survey with everyonewas not feasible. Instead, a follow-up survey was administered <strong>to</strong> studentsenrolled in a secondary school in the study area between May and July 2005, aboutseven <strong>to</strong> nine months after the RR program. The survey included questions on sexualactivity, characteristics of sexual partners, condom use, and primary school of origin,<strong>to</strong> identify the treatment status of each student. Overall, 55 percent of the secondaryschool students who completed the follow-up survey came <strong>from</strong> one of the328 primary schools that participated in the study.As shown in Appendix Table A1, the likelihood that students in the study samplehad enrolled in secondary school by 2005 is balanced across RR treatment and RRcontrol schools, suggesting that the students who filled the follow-up behavioralsurvey were not differentially selected across RR treatment and RR control groups.This is not the case for the TT program, as a higher fraction of students in the TTcontrol group enrolled in secondary school than in the TT treatment group. Thisselection issue should be kept in mind while analyzing the results of the behavioralsurvey.Another important caveat <strong>to</strong> the behavioral survey is that it includes only teenagerswho joined secondary school, and those are clearly not representative of allteenagers. In Kenya, only students with sufficient financial resources and with high20Unsafe abortion is a leading cause of maternal deaths in developing countries (David A. Grimes 2003). Up <strong>to</strong>50 percent of maternal deaths in sub-Saharan Africa are due <strong>to</strong> induced abortion (K. O. Rogo 1993). Statistics onthe risk of death conditional on getting an illegal abortion are not, <strong>to</strong> the best of our knowledge, available.
Vol. 3 No. 1 dupas: do teenagers respond <strong>to</strong> hiv risk information?15enough scores at the primary school exit exam can go <strong>to</strong> secondary school. Thismeans that the behavioral data at hand includes only the richer and arguably smarterstudents in the sample. 21Finally, self-reported data on sexual behavior may suffer <strong>from</strong> reporting biases, andhas been found <strong>to</strong> be often inconsistent with biological outcomes (Mark Gersovitz etal. 1998). For example, in a study conducted in Western Kenya, Glynn et al. (2001)found that 12 percent of women who reported being virgins were <strong>HIV</strong>-positive, andmost of them had other sexually transmitted infections, making it unlikely that theyacquired <strong>HIV</strong> nonsexually. Likewise, self-reported sexual data are typically impossible<strong>to</strong> reconcile at the population level (e.g., heterosexual men typically reportmuch more sexual activity than heterosexual women do).While overall the self-reported data in this paper seems consistent with thebiological (childbearing) data, it is important <strong>to</strong> keep in mind that the estimatesobtained with that data could suffer <strong>from</strong> reporting biases. In particular, it is possiblethat students who received the RR information recognized that the NGO conductingthe survey in secondary schools was the same NGO that had talked <strong>to</strong> them aboutsexual partnerships the year before, and they might have been less wary of truthfullyreporting their sexual activity than students who were less familiar with the NGO.Control Cohorts.—In order <strong>to</strong> compute difference-in-differences estimates of theRR program effects, data was collected on control cohorts, when possible. Recallthat the study cohort is made of students enrolled in grade 8 in 2004. We use twocontrol cohorts: the older cohort (grade 8 of 2003) and the younger cohort (grade 7of 2004). For the older cohort, we could collect data on childbearing incidence usingthe same method as that described in Section IIIB. We do not have data on partner’sage for that cohort, however. For the younger cohort, we collected data on partner’sage by conducting follow-up surveys at the homes of girls who had started childbearingby July 2005.C. Estimation StrategyEconometric Specifications.—The randomized design provides a straightforwardsource of identification. For both the TT and the RR programs, random assignmen<strong>to</strong>f schools <strong>to</strong> the treatment and comparison groups ensures that, in expectation, theschools in either group are similar in all other respects except in that treatmentschools were exposed <strong>to</strong> the program. Table 2 shows the baseline school averagesfor a series of school and pupils outcomes, by treatment groups. Except for classsize, which is lower on average in RR treatment schools, all other differences inpre-treatment school characteristics are small and insignificant. The sample is less21The fact that girls in the RR treatment group were not more likely <strong>to</strong> enroll in secondary school than girlsin the RR control group, despite the decrease in pregnancy in the RR treatment group that we document below, isinteresting in itself. It suggests that girls who know that they can go <strong>to</strong> secondary school (because their parents canafford the fees and because they are performing well enough in grade 8) are not the marginal girls whose pregnancyrate was affected by the RR information program (although their partner choice might have been affected). Thisis not surprising, since the opportunity cost of pregnancy for girls who can attend secondary school is very high(pregnancy is de fac<strong>to</strong> incompatible with schooling in Kenya).
16 American Economic Journal: applied economics january 2011Table 2—Verifying Balance between Groups in Terms of School Characteristics and Outcomes forPre-Program CohortRR informationTT on <strong>HIV</strong>/AIDS curriculumComparison Treatment Difference Comparison Treatment Differencegroup (C) group (T) T–C group (C) group (T) T–C(1) (2) (3) (4) (5) (6)Panel A. School characteristics at baselineClass size 38.2 34.4 −3.8 37.4 37.3 −0.06[15.9] [17.4] (1.540)** [16.9] [15.7] (1.281)Pupils’ sex ratio (girls/boys) 1.07 1.12 0.049 1.06 1.10 0.040[0.489] [0.668] (0.072) [0.476] [0.586] (0.059)Teacher-pupil ratio 0.026 0.026 0.000 0.025 0.027 0.003[0.026] [0.022] (0.003) [0.021] [0.028] (0.003)Teachers’ sex ratio (females/ 1.033 0.921 −0.112 1.003 1.014 0.011males) [0.914] [0.777] (0.119) [0.92] [0.852] (0.099)KCPE results (2003) 251.0 249.4 −1.6 252.2 249.0 −3.2[29.0] [27.4] (3.9) [28.6] [28.5] (3.2)Sampled for TT on <strong>HIV</strong>/AIDS 0.50 0.49 −0.003 0.00 1.00curriculum (0.067)Sampled for RR information 0.00 1.00 0.22 0.22 −0.002(0.046)Panel B. Girls enrolled in eighth grade in 2003 (control cohort for RR): outcomes at the end of 2004Percent repeating class 8 0.246 0.209 −0.04 0.236 0.238 0.002(0.021)* (0.018)Percent in secondary school 0.449 0.458 0.008 0.472 0.430 −0.043(0.026) (0.021)**Percent in professional training 0.037 0.036 −0.001 0.037 0.036 −0.001(0.008) (0.007)Percent out of school 0.259 0.289 0.029 0.246 0.286 0.040(0.022) (0.018)**Percent married 0.077 0.083 0.006 0.071 0.085 0.014(0.012) (0.010)Percent who had begun 0.144 0.139 −0.004 0.134 0.152 0.018childbearing (0.018) (0.015)Observations 4,783 1,212 5,995 3,016 2,979 5,995Panel C. Boys enrolled in eighth grade in 2003 (control cohort for RR): outcomes at the end of 2004Percent repeating class 8 0.226 0.220 −0.006 0.227 0.223 −0.004(0.022) (0.018)Percent in secondary school 0.521 0.509 −0.012 0.528 0.508 −0.020(0.027) (0.023)Percent in professional training 0.015 0.009 −0.006 0.017 0.010 −0.007(0.004) (0.004)*Percent out of school 0.229 0.254 0.025 0.217 0.252 0.036(0.023) (0.019)*Percent married 0.009 0.007 −0.002 0.010 0.007 −0.003(0.005) (0.004)Observations 4,845 1,229 6,074 3,079 2,995 6,074Number of schools 252 71 323 163 160 323Notes: These are school averages. Panel A: school characteristics collected through school visits in 2004. PanelsB and C: students’ outcomes collected in 2004 for the cohort of students enrolled in grade 8 in 2003, which is thecohort just one year older than the cohort involved in the RR experiment. Data collected by asking whereaboutsof students at their 2003 primary school. Standard deviations in brackets. Columns 3 and 6: standard errors arein parenthesis. Five schools did not have an eighth grade class in 2003 and therefore are excluded <strong>from</strong> the table.*** Significant at the 1 percent level.** Significant at the 5 percent level.* Significant at the 10 percent level.
Vol. 3 No. 1 dupas: do teenagers respond <strong>to</strong> hiv risk information?17balanced when it comes <strong>to</strong> the long-term schooling status of teenagers. Schools inthe RR treatment group are significantly less likely <strong>to</strong> allow their students <strong>to</strong> repeatgrade 8 compared <strong>to</strong> schools in the RR control group. What’s more, schools in theTT treatment group are significantly less likely <strong>to</strong> see their students go on <strong>to</strong> secondaryschool than schools in the TT comparison group. 22To estimate the impact of the intervention, we use simple reduced form regressionspecifications. Denote Y isc the outcome of individual i formerly enrolled in primaryschool s in cohort c. RR s is the RR treatment status of school s, and StudyCohort c isthe dummy for being in the study cohort (grade 8 in 2004). TT s is a dummy equal <strong>to</strong>1 if school s received the teacher training on the <strong>HIV</strong> curriculum.First, we estimate the simple difference (SD) in means by ordinary least squareswith clustering at the school level. The model is a linear probability model,y is1 = α 1 + β 1 × RR s + χ 1 × TT s + I i ′γ 1 + ε is ,where I i is a vec<strong>to</strong>r of controls for individual characteristics. The average effec<strong>to</strong>f coming <strong>from</strong> a RR treatment school (RR s = 1) versus a RR comparison school(RR s = 0) is captured by β 1 . Since RR s = 1 was randomly assigned, we shouldexpect E(ε is | RR s ) = 0 so that the estima<strong>to</strong>r of β 1 is unbiased. The average effect ofcoming <strong>from</strong> a school that received the teacher training can be captured by χ 1. SinceTT s = 1 was also randomly assigned, we should expect E(ε is | TT s ) = 0 so that theordinary least squares estima<strong>to</strong>r of χ 1 is also unbiased. By comparing β 1 and χ 1 , wecan thus compare the impact of the two information sets. 23 To increase the precisionof the estima<strong>to</strong>rs, we control for the observable characteristics of the primaryschool of origin (for the childbearing data) and for the characteristics of the currentsecondary school (for the behavioral survey). Finally, when the outcome is binary,we also estimate the effect of the program on the probability that the outcome occursusing a Probit model.Second, we estimate the difference-in-differences (DD) when data on a controlcohort is available:Y isc = α 2 + β 2 × RR s × StudyCohort c + δ × RR s + θ × RR s + χ 2 × TT s + I i ′γ 2 + ω isc .Comparing the single-difference <strong>to</strong> the difference-in-differences estimates is usefulfor two reasons. First, if the randomization of the RR program assignment was notperfect, the difference-in-differences will adjust for potential pre-existing randomdifferences in means between RR treatment and RR comparison schools. Second,22Overall, these pre-existing differences will bias us against finding an effect, since the opportunity cost of gettingpregnant is lower for out-of-school girls than it is for in-school girls, who will not be allowed <strong>to</strong> stay in schoolwhile pregnant.23The limited sample size makes it difficult <strong>to</strong> estimate the interaction between the two programs. Specificationsthat estimate the impact of the two programs alone and combined are presented in Appendix Table A3. The standarderrors are large, but for none of the outcomes considered can we reject the equality between the effect of the RRinformation alone and the effect of the RR information combined with the teacher training.
18 American Economic Journal: applied economics january 2011the difference-in-differences allows the inclusion of school fixed effects, whichallows <strong>to</strong> control for unobservable school characteristics that enter the equation inan additive way. However, the double-difference estimates could be biased in thepresence of treatment spillovers across cohorts. We will come back <strong>to</strong> this issuewhen we discuss the results.Dealing with Selection.—While the childbearing outcome was measured forevery girl in the sample, information on partner’s age was measured conditionalon the girl having either started childbearing (in which case a follow-up surveywas administered at home) or joined secondary school (in which case a follow-upsurvey was administered at school). To see the extent <strong>to</strong> which this is an issue forestimating the treatment effect on partner selection, let’s think of the sample of girlsas composed of three groups:(A) girls who went on <strong>to</strong> secondary school;(B) girls who did not go <strong>to</strong> secondary school and are not engaging in risky sex;and(C) girls who did not go <strong>to</strong> secondary school and are engaging in risky sex.We have data on all girls in group A. We have no data on girls in group B, but <strong>to</strong>the extent that they are not engaging in risky sex, the age of their partner is not acritical parameter. The main selection problem comes <strong>from</strong> the fact that, for groupC, we only observe partner’s age for the subset of girls who got pregnant. In otherwords, we face the following censored selection model:y ∗ = RRβ + ϵz ∗ = RRγ + uy = y ∗ if z ∗ ≥ 0,where RR is the relative risk information treatment dummy, y ∗ is the age differencebetween the girl and her sex partner, and z ∗ is the propensity of getting pregnant. y isthe observed age difference. We observe it only for those who got pregnant.The coefficient of interest is β, the estimate of the RR program effect on unprotectedpartners’ age. OLS on the selected sample will yield a consistent estimate ofβ only if ϵ is uncorrelated with u. In other words, we need <strong>to</strong> assume that the propensity<strong>to</strong> get pregnant (when engaging in unprotected sex) is independent of the age ofthe partner. There are a number of reasons why this assumption may not hold. First,the semen of older partners may be less fertile. This is not so much of a concern inour context, however, since the oldest male partners reported by girls in our sampleare still relatively young (below 40), and most likely as fertile as teenage boys.Second, the frequency or timing of intercourse might vary with the partner’s age. Tothe extent that older men are more experienced, they might be better able <strong>to</strong> avoid
Vol. 3 No. 1 dupas: do teenagers respond <strong>to</strong> hiv risk information?19Table 3—Probability That Girls Have Started ChildbearingHas started childbearingHas startedchildbearing,unmarriedHas startedchildbearing,marriedSpecification modelSDOLS(1)SDPROBIT(ME)(2)DDOLS(3)DD-FEOLS(4)SDOLS(5)DDOLS(6)SDOLS(7)DDOLS(8)RR information −0.015 −0.013 0.006 −0.009 0.015 −0.005 0.011(0.008)* (0.008)* (0.013) (0.004)** (0.010) (0.006) (0.012)RR information × 2004 cohort −0.024 −0.020 −0.027 −0.017(0.016) (0.016) (0.011)** (0.013)TT on <strong>HIV</strong>/AIDS curriculum 0.006 0.007 0.008 0.006 0.006 0.000 0.002(0.007) (0.006) (0.006) (0.004) (0.004) (0.005) (0.005)SampleControl cohort includedYes Yes Yes Yes(2003 cohort)ControlsIndividual characteristics Yes Yes Yes Yes Yes Yes Yes YesPrimary school characteristics Yes Yes Yes Yes Yes Yes YesPrimary school fixed effectsYesObservations 5,988 5,988 10,968 10,968 5,988 10,968 5,988 10,968Mean of dependent variable(2004 cohort, RR = 0)0.054 0.054 0.054 0.054 0.021 0.021 0.033 0.033Notes: Data collected by asking whereabouts of students at their 2004 primary school. Specifications: SD = simpledifference; DD = difference-in-difference; FE = school fixed effects. Only the 2004 cohort was affected by the RRinformation program. The dependent variables are individual-level dummies. Robust standard errors in parentheses,clustered at the school level. Columns 2, 6, and 10 report mean marginal effects. “2004 Cohort” = Cohort ofstudents enrolled in grade 8 in 2004. “2003 Cohort” = Cohort of students enrolled in grade 8 in 2003. Individualcontrols include: age, whether student is repeating grade 8 at baseline, and cohort when applicable. School controlsinclude: gender ratio among pupils, teacher-pupil ratio, average school performance on the national KCPE exam,location, and timing of school visit. School visits were conducted between July and December 2005 for the 2004cohort, and between July and December 2004 for the 2003 cohort. The timing of visits was balanced across groups.*** Significant at the 1 percent level.** Significant at the 5 percent level.* Significant at the 10 percent level.pregnancy. This would lead us <strong>to</strong> underestimate β. But the bias could go the otherway. As discussed earlier, anal sex or abortion might be more common with teenageboys, with whom pregnancy is particularly unattractive. Given that our identifyingassumption may not hold, comparing the effects estimated for the sample of girlswho started childbearing with those estimated for the sample of girls who joinedsecondary school will be important <strong>to</strong> ascertain the robustness of the results.IV. ResultsA. Impact on Incidence of Teen ChildbearingTable 3, columns 1–4 show the estimates of the effects of each program on theincidence of childbearing with four different regression specifications: the simpledifference with a linear probability model (OLS); the simple difference with a probitmodel (reporting marginal effects); the OLS estimate of the difference-in-differences;and the OLS estimate of the difference-in-differences with school fixedeffects. The RR information reduced the incidence of childbearing by 1.5 percentagepoints among treated girls relative <strong>to</strong> girls in the comparison group (Table 3,
20 American Economic Journal: applied economics january 2011column 1). The childbearing rate in the comparison group is 5.4 percent, and thusthe RR treatment effect corresponds <strong>to</strong> a 28 percent decrease in the incidence ofchildbearing. The magnitude of the RR effect is robust <strong>to</strong> all specifications. In thedifference-in-differences without school fixed effects, the estimate of the coefficientfor “RR <strong>Information</strong>” is close <strong>to</strong> zero, confirming the absence of ex-ante differencebetween treatment and comparison schools (column 3, row 1). The estimate of theRR effect on the study cohort is slightly larger than the OLS, but the standard erroris also large.In contrast, the TT program had no impact on the incidence of childbearing(row 3). This, despite the fact that the training had a large impact on the amount of<strong>HIV</strong> education delivered in schools and increased scores of pupils on <strong>HIV</strong> knowledgetests (Duflo et al. 2006). This result may reflect the fact that the curriculumpromotes abstinence until marriage as the only way <strong>to</strong> avoid <strong>HIV</strong> infection, and sowould not deter teenagers <strong>from</strong> marrying and having children at a young age.Columns 5–8 in Table 3 show estimates of the treatments on childbearing brokendown by marital status. The bulk of the decrease in the incidence of childbearingin the RR treatment group corresponds <strong>to</strong> a decrease in childbearing outsideof marriage, while the incidence of childbearing within marriage decreased onlyslightly and not significantly. This means that, among girls who started childbearing,the proportion of girls who are married is significantly larger in the treatmentgroup than in the comparison group. Since women typically receive greaterfinancial support <strong>from</strong> their partner when they are married than when they are not,these findings imply that, relative <strong>to</strong> girls in the comparison groups, girls whoreceived RR information were more likely <strong>to</strong> refuse <strong>to</strong> enter in<strong>to</strong> an unprotectedsexual relationship with an adult man, unless they were guaranteed compensationcommensurate with the higher risk involved. In other words, in the absence of theRR information program, girls at the margin (just above the threshold of engagingwith an older partner) would have engaged in unprotected sex with an olderpartner who had relatively limited resources and who would have turned out <strong>to</strong> notmarry in case of a pregnancy.Since 29 percent of girls in the sample already knew that older men are riskierthan teenage boys (as seen in Table 1), it would be interesting <strong>to</strong> check that theRR treatment effect occurred primarily among those who did not know this fact atbaseline. Unfortunately, the baseline survey was anonymous, and therefore it is notpossible <strong>to</strong> merge the childbearing data with the survey data <strong>to</strong> test for heterogeneityin the treatment effect.B. Age of Childbearing PartnerTo determine the extent <strong>to</strong> which the observed decrease in the incidence of childbearingin the RR treatment group corresponds <strong>to</strong> a decrease in the incidence ofunprotected sex with older men, we look at the age differential between girls whohave started childbearing and their partners. The data is available for two cohorts:the study cohort (grade 8 of 2004) and one control cohort (grade 7 of 2004).Obviously, since the RR information reduced the incidence of childbearing inthe RR treatment group, the data is available for differentially selected subsamples
Vol. 3 No. 1 dupas: do teenagers respond <strong>to</strong> hiv risk information?21Table 4—Age Gap between Girls Who Have Started Childbearing and Their PartnerSpecification modelAge difference betweenteenage girl and herpartner Age gap > 5 years Age gap > 10 yearsSDOLS(1)DDOLS(2)SDOLS(3)SDPROBIT(ME)(4)DDOLS(5)SDOLS(6)SDPROBIT(ME)(7)DDOLS(8)RR information −1.685 1.07 −0.224 −0.226 0.157 −0.064 −0.081 0.166(0.609)*** (0.817) (0.116)* (0.097)** (0.121) (0.061) (0.052) (0.084)**RR information × 2004 cohort −2.576 −0.351 −0.229(1.048)** (0.190)* (0.109)**TT on <strong>HIV</strong>/AIDS curriculum −0.708 −0.331 0.074 0.101 0.026 −0.076 −0.066 −0.03(0.720) (0.451) (0.081) (0.074) (0.060) (0.058) (0.055) (0.037)SampleControl cohort includedYes Yes Yes(2005 cohort)ControlsIndividual characteristics Yes Yes Yes Yes Yes Yes Yes YesPrimary school characteristics Yes Yes Yes Yes Yes Yes Yes YesObservations 120 250 134 134 278 134 134 278Mean of dependent variable 5.91 5.91 0.49 0.49 0.49 0.16 0.16 0.16(RR = 0)Standard deviation (4.16) (4.16)Notes: Data source: follow-up survey conducted through home visits for subsample of girls who had started childbearingby July 2005. Specifications: SD = simple difference; DD = difference-in-difference. Data collectedthrough home visits. Only the 2004 cohort was affected by the RR <strong>Information</strong> program. The dependent variablesare at the individual level. Robust standard errors in parentheses, clustered at the primary school level. Columns 4and 7 report mean marginal effects. Individual controls include: age, and cohort when applicable. School controlsinclude: gender ratio among pupils, average school performance at national KCPE exam, location.*** Significant at the 1 percent level.** Significant at the 5 percent level.* Significant at the 10 percent level.of each group. The analysis in this section will therefore not tell us anything abouthow the RR information affected girls’ partner selection overall. But it will informus on how the RR information affected girls’ selection of partners with whom <strong>to</strong>have unprotected relationships. As discussed in Section IIIC, as long as the RR treatmentdid not affect the likelihood of getting pregnant conditional on having unprotectedsex differentially across relationships’ types (cross- or intra-generational),we should expect the ratio of cross-generational <strong>to</strong> intra-generational pregnancies <strong>to</strong>be the same across subsamples, unless the RR treatment had an impact on the agedifferentials between girls and the partners with whom they had unprotected sex.The dependent variable in Table 4, columns 1 and 2, is the age difference betweenthe respondent and her baby’s father. The RR treatment effect is negative and significant:among girls who had begun childbearing, the average age gap with the baby’sfather is 1.7 years smaller for RR treated girls than for girls who did not receive theRR treatment (column 1). This difference is significant at 1 percent. In columns 3–5,the dependent variable is a dummy indicating whether the baby’s father is more than5 years older than the teenage girl. The coefficient of the treatment effect is negativeand large (−22 percentage points off of a mean of 49 percent in the control group)and significant at 5 percent (column 3). In contrast, the TT program seems <strong>to</strong> have,
22 American Economic Journal: applied economics january 2011Table 5—Overall Treatment Effects on Incidence of Childbearing by Male Partner’s AgeComparisongroup RR treatment group RR treatment effectBase = 100PointestimateStd.error90% CIPointestimate (%)90% CIPanel A. Effect of relative risks information# Teen pregnancies (A) 100.0 72.3 14.8 [47.5 97.0] −27.7 [−52.5 −3.0]Share of pregnancies by men 47.6 25.2 11.6 [5.8 44.6] −47.1 [−87.8 −6.4]> 5 years older (B)# Pregnancies by men > 5 47.6 18.2 9.3 [3.66 33.8] −61.7 [−92.3 −29.0]years older (C = A × B)# Pregnancies by men ≤ 5years older (D = A − C)52.4 54.1 13.9 [30.9 76.2] 3.2 [−41.0 45.4]Base = 100PointestimateTT treatment groupStd.error90% CIPointestimate (%)TT treatment effect90% CIPanel B. Effect of teacher training on <strong>HIV</strong> curriculum# Teen pregnancies 100.0 111.1 13.0 [89.4 132.7] 11.1 [−10.6 32.7]Share of pregnancies by men 47.6 55 8.1 [41.5 68.5] 15.5 [−12.9 44.0]> 5 years older# Pregnancies by men > 5 47.6 61.1 12.9 [44.3 82.6] 28.4 [−6.9 73.5]years older# Pregnancies by men ≤ 5years older52.4 50.0 11.9 [30.1 65.3] −4.6 [−42.6 24.6]Notes: In each panel, the first row shows the effect on number of teen pregnancies reported <strong>from</strong> Table 3, column 1.The second row shows the effect on share of pregnancies by older men reported <strong>from</strong> Table 4, column 3.if anything, increased the likelihood that teenage girls start childbearing with olderpartners, though none of the coefficients are significant (row 4).The difference-in-difference estimates of the effect of the RR program on the RRcohort are greater in magnitude than the simple difference results. This seems drivenby the fact that the coefficients for being in an RR information school (but not inthe RR cohort) are large and positive (row 1, columns 2, 5, and 9). This suggeststhat the RR program might have had negative spillovers on<strong>to</strong> nontreated students inthe RR treatment schools. Indeed, the control cohort available is a younger cohort(the seventh graders of 2004). This cohort could have been indirectly and negativelyaffected by the RR information program if the “sugar daddies” newly turned downby informed eighth graders decided <strong>to</strong> try their luck with seventh graders instead.Alternatively, the seventh graders could have benefitted <strong>from</strong> positive informationspillovers if the eighth graders shared the information with their younger schoolmates.Note that there would be no room for such spillover effects if the RR informationwas included in the official curriculum and provided <strong>to</strong> everyone. 2424It is possible that similar spillover effects could have been at play across primary schools. On one hand, informationon relative risks could have spread <strong>to</strong> comparison primary schools that are near treatment schools, and girlsin those comparison schools may also have avoided unprotected sex with adult partners. This would mean that thetreatment effect on childbearing estimated above is an underestimation of the overall effect of the RR informationcampaign. On the other hand, if adult men responded <strong>to</strong> the change in the price charged by treated teenage girls bymoving away <strong>from</strong> treatment schools and <strong>to</strong>ward the surroundings of comparison schools when looking for sexualpartners, the information campaign may have generated an increase in childbearing by adult men in the comparisonschools, and consequently the comparison between treatment and comparison schools would be overestimating the
Vol. 3 No. 1 dupas: do teenagers respond <strong>to</strong> hiv risk information?23C. Overall Impact of RR <strong>Information</strong> on Pregnancies by Partner’s TypeTable 5 combines the results of Tables 3 and 4 <strong>to</strong> compute the treatment effectsof the RR and TT programs on the incidence of pregnancies with older partners andthe incidence of pregnancies with teenage partners. We consider a normalized casein which 100 pregnancies occur in the RR comparison group. Of these, 47.6 are bymen more than 5 years older (hereafter labelled “older men”). In the RR treatmentgroup, we would observe 72.3 pregnancies, 18.2 of which are by older men. Thus,the RR program averts 29.4 pregnancies by older partners in the treatment group.This means that the incidence of cross-generational pregnancies declined by 61.7percent in the RR treatment group relative <strong>to</strong> the comparison group, while intra-generationalpregnancies remained stable. The confidence interval is large ([−92.3 percent;−29.0 percent]), but we can reject the hypothesis that the RR program reducedcross-generational sex by less than 29 percent.These results suggest that providing teenagers with information on relative riskled <strong>to</strong> a large decrease in the incidence of unprotected sex between teenage girlsand older men, but did not lead <strong>to</strong> an increase in the incidence of unprotected sexbetween teenage girls and teenage boys. This suggests that the RR program mighthave reduced teenagers’ exposure <strong>to</strong> the risk of <strong>HIV</strong> infection.In contrast, the TT program had, if anything, a positive impact on the incidenceof childbearing by older partners, although the effects cannot be distinguished <strong>from</strong>zero (none of the coefficient estimates for the TT program in Tables 3 and 4 arestatistically significant).D. Mechanisms? Suggestive <strong>Evidence</strong> <strong>from</strong> Self-Reported Sexual BehaviorDid the decrease in the incidence of childbearing by older partners in the RRtreatment group come <strong>from</strong> an increase in condom use within cross-generationalpartnerships or <strong>from</strong> a decrease in the number of cross-generational partnerships?If teenage girls in the treatment group did not engage in partnerships with oldermen, did they substitute <strong>to</strong>ward teenage boys (low-risk option) or <strong>to</strong>ward abstinence(zero-risk option)? The general case of the model predicts a one-for-one substitution<strong>to</strong>ward teenage partners, but the “poverty-driven prostitution” subcase (whenthe survival constraint is binding) implies that the substitution <strong>to</strong>ward teenage boysshould be more than one for one (since teenage boys have less resources than oldermen), and thus would predict an increase in the number of partners reported byteenage girls.To shed light on these issues, Table 6 presents self-reported data collected amongteenagers who joined a secondary school in the study area. This subgroup is notrepresentative of all teenagers in the sample. 25 Nevertheless, studying the impact ofthe RR program on the self-reported sexual behavior of secondary school students istreatment effect. However, since the treatment group is more than four times smaller than the comparison group, itis unlikely that this price effect could explain more than a fourth of the treatment effect found.25Girls enrolled in secondary school have a higher incentive <strong>to</strong> avoid childbearing than girls who are out ofschool, since in Kenya childbearing is incompatible with schooling. As such, the sexual behavior of secondaryschool girls may differ substantially <strong>from</strong> that of out-of-school girls. Similarly, out-of-school boys are more likely
24 American Economic Journal: applied economics january 2011Table 6—Self-Reported Sexual Behavior for Students Who Joined Secondary SchoolHas had sexwith multiplepartners(1)Currently hasa regularpartner a(2)Partner> 5 yearsolder b(3)Ever receivedmoney <strong>from</strong>current partner(4)Everhad sex(5)Ever had sexbut neverused a condom(6)Used acondom atlast sexualintercourse(7)Panel A. GirlsRR information 0.007 0.096 −0.069 0.055 0.101 0.034 0.118(0.015) (0.025)*** (0.038)* (0.089) (0.031)*** (0.027) (0.073)TT on <strong>HIV</strong>/AIDS curriculum −0.010 0.009 0.004 0.092 −0.028 −0.021 0.012(0.011) (0.023) (0.035) (0.075) (0.023) (0.016) (0.067)Observations 2,170 2,157 260 246 2,173 2,173 307Mean of dependent variable 0.033 0.122 0.074 0.684 0.191 0.107 0.360(RR = 0)ControlsIndividual characteristics Yes Yes Yes Yes Yes Yes YesSecondary schoolcharacteristicsYes Yes Yes Yes Yes Yes YesPanel B. BoysRR information 0.106 0.027 −0.041 0.228 0.125 0.052 0.024(0.032)*** (0.027) (0.015)*** (0.102)** (0.036)*** (0.039) (0.042)TT on <strong>HIV</strong>/AIDS curriculum −0.011 0.002 0.017 −0.036 −0.025 0.005 −0.012(0.023) (0.021) (0.018) (0.070) (0.026) (0.023) (0.029)Observations 2,668 2,641 312 350 2,678 2,678 1,116Mean of dependent variable 0.217 0.138 0.036 0.453 0.521 0.333 0.296(RR = 0)ControlsIndividual characteristics Yes Yes Yes Yes Yes Yes YesSecondary schoolcharacteristicsYes Yes Yes Yes Yes Yes YesNotes: Data source: anonymous follow-up survey conducted among secondary school students. All columns correspond<strong>to</strong> Linear Probability Model regressions (probit estimates are shown in Appendix Table A3). The dependentvariables are individual-level dummies. Robust standard errors in parentheses, clustered at the secondary schoollevel. Individual controls include: age and a dummy indica<strong>to</strong>r for students not coming <strong>from</strong> a study primary school.Controls at the secondary school level include: location and gender ratio among pupils. Results are robust <strong>to</strong> theaddition of all other available school controls (school size, average performance, school type (day or boarding),tuition costs). Columns 3 and 4: sample restricted <strong>to</strong> those who declare having a regular partner. Column 7: samplerestricted <strong>to</strong> those who declare ever having had sex.a75 girls and 25 boys gave inconsistent answers: they declared never having had sex, but declared having aregular partner. In this table, we assume that those who declared having a regular partner lied on the “everhad sex” question, and we recoded “ever had sex = 1” for all those who report having a regular partner.(Appendix Table A3 presents the results when we ignore the regular partner information and assume that thestudents with such inconsistent reports never had sex.)bAmong those who report having a regular partner, 4 percent of girls and 11 percent of boys did not reportany information on the age gap with their current partner and 7 percent of girls and 5 percent of boys did notreport if they had received/given money <strong>from</strong>/<strong>to</strong> their current partner.*** Significant at the 1 percent level.** Significant at the 5 percent level.* Significant at the 10 percent level.interesting in itself and can help shed light on the mechanisms behind the observeddecrease in childbearing with older partners.For a small share of students in the sample, responses <strong>to</strong> the self-administeredsexual behavior questions were inconsistent. Seventy-five girls and 25 boys<strong>to</strong> be working, and thus may have more income than secondary school boys, which may raise their ability <strong>to</strong> maketransfers <strong>to</strong> girls in return for sex.
Vol. 3 No. 1 dupas: do teenagers respond <strong>to</strong> hiv risk information?25reported never having had sex, but when asked if they currently had a regularpartner with whom they have sex, they responded that they did. We propose twoways <strong>to</strong> deal with these inconsistencies. First, in Table 6, we assume that the partnerinformation is correct, and code “ever had sex” as 1 if the student reported havinga regular partner, even if the student declared never having had sex. Second,in Appendix Table A4, we consider the first answer given as the correct one (i.e.,the answer <strong>to</strong> “did you ever have sex?” ) and ignore the partner information if itis inconsistent with the “ever had sex” information. The number of observationswith partner characteristics and condom use information is smaller in this case,but the results are virtually unchanged, and below we describe only the results inTable 6.For each outcome, Table 6 shows the results of the OLS estimates of the simpledifference between treatment and control group. Panel A shows the coefficientestimates for girls and panel B shows the estimates for boys. The probit estimatesare very similar <strong>to</strong> the OLS estimates, therefore we not show them given spaceconstraints.The first column of Table 6 shows that girls in the RR treatment group werenot more likely <strong>to</strong> have had multiple partners than other girls. However, they weremuch more likely <strong>to</strong> declare having a regular partner (column 2). 26 The likelihoodthat their partner is more than 5 years their senior is significantly lower, however,and virtually reduced <strong>to</strong> zero (compared <strong>to</strong> 7.4 percent in the RR control group,column 3). In contrast, girls in the TT treatment group are not more likely <strong>to</strong> have aregular partner, and the TT program had no effect on the likelihood that girls choosean older partner. Column 4 documents the effect of the RR information on whethergirls report having ever received money <strong>from</strong> their current partner. The point estimatesare positive, suggesting that girls in the RR treatment group are 6 percentagepoints (less than 10 percent) more likely <strong>to</strong> have received money. This effect is notsignificant, however, and lower than that of the TT treatment, also insignificant.Unfortunately, we do not have data on transfer size.The results for boys are quite different. Boys in the RR treatment group are10 percentage points more likely <strong>to</strong> report having had sex with multiple partners.This represents a 48 percent increase compared <strong>to</strong> the base rate of 22 percent inthe control group. However, boys are not more likely <strong>to</strong> report having a regularpartner. Those with a regular partner are less likely <strong>to</strong> report an age gap greaterthan 5 years, suggesting that the RR information reduced “sugar mammies” relationshipsjust as it did with “sugar daddies” relationships. We also find that boys inthe RR group are much more likely <strong>to</strong> report having given money <strong>to</strong> their currentpartner. This change on the extensive margin is consistent with the hypothesis thatteenage girls in the RR group substituted away <strong>from</strong> older partners and <strong>to</strong>wardtheir classmates.Last but not least, the RR program led <strong>to</strong> an increase in the likelihood that teenagersreport ever having had sex (column 5). For girls, the difference between RR26Note that this effect is not just due <strong>to</strong> the fact that girls in the RR group are more likely <strong>to</strong> be sexually active.Even conditional on being sexually active, girls in the RR treatment group are 50 percent more likely <strong>to</strong> report havinga regular partner (data not shown).
26 American Economic Journal: applied economics january 2011treatment and control is 10 percentage points, significant at 1 percent. For boys, thedifference is 12.5 percentage points, also significant at 1 percent. In contrast, the TTprogram decreased the likelihood that teenagers report being sexually active, but theeffect is small and not significant. These results are consistent with the predictionthat, as RR information decreases the perceived riskiness of teenage boys, girls whowould abstain in the absence of RR information decide <strong>to</strong> enter the market for sexwith teenage boys when RR information is available. 27The increase in sexual activity for both boys and girls in the RR treatment groupdoes not seem <strong>to</strong> correspond <strong>to</strong> an increase in unsafe sexual activity. The share ofteenagers who ever had sex but never used a condom did not increase significantly(column 6). The share of girls who report having used a condom at their last sexualintercourse is 36 percent in the RR control group, and this increases by 11 percentagepoints (a 32 percent difference) among girls in the RR treatment group (column7). However, there is no significant (statistically or economically) change incondom use at last intercourse for boys in the RR treatment group compared <strong>to</strong> thecontrol.Overall, the self-reported sexual behavior data at hand, while imperfect, confirmsthe childbearing results, and suggests that, in response <strong>to</strong> the RR information, teenagegirls substituted away <strong>from</strong> older partners and <strong>to</strong>ward protected sex with teenagepartners, but not more than one-for-one. In addition, the self-reported data suggeststhat the RR information triggered some teenage girls <strong>to</strong> enter sexual activity earlier,but with condoms, presumably <strong>to</strong> avoid pregnancy with a resource-constraint teenageboy. Finally, the self-reported data also confirms the childbearing data in showingthat the TT program had virtually no effect on sexual behavior. These resultsare unchanged when we change the coding of inconsistent responses (see AppendixTable A4).An important question in interpreting these results is the following: is it reallythe relative risk information that made a difference in the behavior of girls in theRR group? Or is it just that the RR program was more successful than the TT programat convincing students <strong>to</strong> protect themselves against <strong>HIV</strong>? This is a legitimatequestion for two reasons. First, the RR message was delivered by an NGO worker,while the TT program relied on teachers. Second, the RR message included detailedprevalence data for an area of Kenya whose average prevalence is higher than forKenya as a whole, therefore higher than the average risk level conveyed by the TTprogram. For both these reasons, the RR program may have increased perceived<strong>HIV</strong> risk more than the TT program. Could this be the driving force for the observedeffects? Likely not. While a simple shift upward in perceived risk could have triggeredthe observed decrease in unprotected sex (as proxied by teenage childbearing)in the RR group, it is not enough <strong>to</strong> explain the observed change in partner selection.The substitution away <strong>from</strong> older partners and <strong>to</strong>ward younger partners observedamong girls in the RR information group can only come <strong>from</strong> a change in perceivedrelative risks.27Alternatively, this result could be a pure reporting artifact as discussed in Section IIIB.
Vol. 3 No. 1 dupas: do teenagers respond <strong>to</strong> hiv risk information?27Table 7—Cost-Effectiveness of the RR <strong>Information</strong> CampaignUS$Actual Cost per cross-generational pregnancy averted $98Scenario 1# of Primary <strong>HIV</strong> infections averted among teenage girls 4.88Cost per Primary <strong>HIV</strong> infection averted among teenage girls $392Scenario 2# of Primary <strong>HIV</strong> infections averted among teenage girls 2.93Cost per Primary <strong>HIV</strong> infection averted among teenage girls $653Scenario 3# of Primary <strong>HIV</strong> infections averted among teenage girls 0.98Cost per Primary <strong>HIV</strong> infection averted among teenage girls $1,960Notes: Assumption in Scenario 1: 25 cases of <strong>HIV</strong> infection per 100 cross-generational pregnancies.Assumption in Scenario 2: 15 cases of <strong>HIV</strong> infection per 100 cross-generationalpregnancies. Assumption in Scenario 3: 5 cases of <strong>HIV</strong> infection per 100 cross-generationalpregnancies.E. Cost-Effectiveness of the RR <strong>Information</strong> CampaignThis section provides a rough calculation of the cost-effectiveness of providingRR information <strong>to</strong> teenagers through schools, and compares it <strong>to</strong> other <strong>HIV</strong>prevention programs that have been shown successful. We assume that this informationwould be provided in itself, outside of existing information programs.This is a very conservative assumption. In most cases, it would be easy for existingprograms <strong>to</strong> add this relative risk information component <strong>to</strong> their existingcurriculum. 28The RR information did not change the number of intra-generational pregnancies,but reduced the number of cross-generational pregnancies. Dividing the <strong>to</strong>tal cos<strong>to</strong>f the program by the number of pregnancies averted gives an estimate of the costper cross-generational pregnancy averted just under US$100. To calculate the costper <strong>HIV</strong> infection averted, we need an estimate of the ratio of the risk of <strong>HIV</strong> infection<strong>to</strong> the risk of cross-generational pregnancy, a ratio which is not available in theliterature. 29 Instead, we can compute cost-effectiveness estimates using three possibleratios: 5/100, 15/100, and 25/100. 30 Table 7 shows the cost per <strong>HIV</strong> infection28A few education programs specifically addressing the risks associated with “sugar daddy relationships” werestarted after the onset of this study. See for example Population Services International (2005).29What makes this ratio particularly complicated <strong>to</strong> estimate is the fact that infectiousness of a person with <strong>HIV</strong>varies with her viral load, and the viral load follows a U-shape; it is very high during the first weeks or months afterinfection, then decreases substantially and peaks again (in the absence of antiretroviral (ARV) treatment) when thepatient develops AIDS eight or nine years later (Magruder 2007).30The choice of these three possible ratios was motivated by the following calculation: (a) In a meta-study,Marie-Claude Boily et al. (2009) estimate that the male-<strong>to</strong>-female <strong>HIV</strong> transmission rate in low-income countriesis 0.30 percent per unprotected vaginal sex act. Taking the average prevalence rate among men older than 20 <strong>to</strong> bearound 5 percent in Kenya, this implies that the risk of <strong>HIV</strong> infection may be around 0.05 × 0.003 = 0.00015 or0.015 percent per act between a teenage girl and an older partner; (b) Using probabilities of conception by cycledays presented in Allen J. Wilcox, Clarice R. Weinberg, and <strong>Do</strong>nna D. Baird (1995), I estimate that the risk ofconception is 0.046 percent per unprotected vaginal sex act for healthy women in their mid-20s. The ratio of theestimates in (a) and (b) is 0.015/0.046 = 32/100, which is greater than the most conservative estimate used here
28 American Economic Journal: applied economics january 2011using these ratios. For a ratio of 15/100, US$98 per cross-generational pregnancyaverted corresponds <strong>to</strong> a cost of US$653 per primary <strong>HIV</strong> infection averted amongteenage girls (Scenario 2). It is important <strong>to</strong> note, however, that these estimatesconsider only primary cases of <strong>HIV</strong> transmission, and thus do not include avertedsecondary <strong>HIV</strong> infections (i.e., transmission <strong>to</strong> subsequent sex partners).These rough cost-effectiveness estimates compare favorably with other <strong>HIV</strong> preventionprograms, such as treating sexually transmitted infections other than <strong>HIV</strong>(estimated at US$213 per <strong>HIV</strong> infection averted by Lucy Gilson et al. 1997); malecircumcision (estimated at US$1,269–3,911 per infection averted by Ronald H.Gray et al. 2007); or voluntary <strong>HIV</strong> testing (estimated at US$537 per additional<strong>HIV</strong> positive person tested by Rebecca L. Thorn<strong>to</strong>n 2008).While our findings suggest that providing RR information could be a cost-effectiveway <strong>to</strong> reduce teenage pregnancy and <strong>HIV</strong> infection among young women, wedo not have enough data <strong>to</strong> gauge what the impact would be on the overall spread ofthe disease in the population. To fully assess the epidemiological consequences ofproviding information on <strong>HIV</strong> risk by group, it would be necessary <strong>to</strong> look at generalequilibrium effects that are outside the scope of this paper, whose focus is onteenagers’ responsiveness <strong>to</strong> risk information. In particular, one should address thequestion of what becomes of the older men who are turned down by informed teenagegirls. On one hand, they might reduce their sexual activity. On the other hand,they might engage in unprotected sex with commercial sex workers, which couldhave negative epidemiological consequences. We cannot address these issues, norcan we do a meaningful calibration exercise, as we do not have data on the behaviorof older men in the study area.Estimating the long-term impact of the RR information on the welfare of the teenagegirls in the sample is also difficult. The program reduced the incidence of teenagechildbearing, which often has negative long-term outcomes for both mother andchild, especially since teenage births tend <strong>to</strong> be unwanted (Thomas K. LeGrand andCheikh S. M. Mbacké 1993; Saul D. Hoffman 1998; Cristian Pop-Eleches 2006).While the program did not increase the number of births <strong>to</strong> teenage fathers in theshort run, in the longer run the program might still lead women <strong>to</strong> have children withrelatively younger men than they would have otherwise. To the extent that youngerfathers have fewer resources than older fathers, and that early childhood investmentsare important, the overall welfare impact of the RR program on women and theirfuture children is unclear.V. ConclusionThis paper uses a randomized field experiment <strong>to</strong> study changes in the sexualbehavior of Kenyan teenagers in response <strong>to</strong> information on <strong>HIV</strong> risk. Using theincidence of pregnancy as an objective proxy for the incidence of unprotectedsex, we provide evidence that in 71 primary schools of Western Kenya the provisionof information on the relative risk of <strong>HIV</strong> infection by type of partner led <strong>to</strong>(25/100). Therefore, the cost-effectiveness estimates provided can be seen as “conservative” estimates of the costeffectivenessof the program.
Vol. 3 No. 1 dupas: do teenagers respond <strong>to</strong> hiv risk information?29a 61 percent (CI: 29 percent–92 percent) decrease in the incidence of pregnancieswith older (riskier) partners among teenage girls, without increasing pregnancieswith same-age partners. In contrast, the official <strong>HIV</strong>/AIDS curriculumfor primary schools, which provided general information about the risk of <strong>HIV</strong>but did not inform teenagers of the risk distribution in the population, had noimpact on the incidence of unprotected sex, as measured by pregnancy rates. Selfreportedsexual behaviors are consistent with the pregnancy results, and suggestthat teenage girls who received information on the relative riskiness of older partnerssubstituted away <strong>from</strong> older partners and <strong>to</strong>ward condom-protected sex withsame-age partners.One shortcoming of the data used in the paper is that given the anonymity ofthe survey data, it is not possible <strong>to</strong> test whether the treatment effect varied withprior beliefs. As a result, one could wonder whether the treatment effect was trulydue <strong>to</strong> the information on the age profile of risk, and not due solely <strong>to</strong> the 10-minutevideo used <strong>to</strong> trigger the discussion on “sugar daddies” with the students. Thevideo did not mention <strong>HIV</strong>, but portrayed “sugar daddies” as preda<strong>to</strong>rs. It is possible,though unlikely, that the video alone would have had a similar effect as tha<strong>to</strong>bserved.Another concern in terms of external validity is that the RR was conductedby an independent nonprofit organization. It is possible that the same information,if included in the official <strong>HIV</strong>/AIDS curriculum for primary schools and deliveredby teachers, would not be as effective. In particular, the information was deliveredby young women, who might have been perceived as role models by the school girlsenrolled in the study.Nevertheless, the findings of this paper suggest that the sexual behavior of teenagersis responsive <strong>to</strong> information, and it appears more elastic on the intensive thanon the extensive margin. This result suggests that <strong>HIV</strong> education campaigns mayachieve a wider health impact if they include both risk reduction and risk avoidanceinformation.More generally, these results speak <strong>to</strong> the importance of considering both theintensive and extensive margins of behavior when designing prevention programs.Public health interventions often focus their efforts on the extensive margin of arisky behavior: they aim at the complete elimination of the behavior and urge completeabstinence <strong>from</strong> the activity. Accordingly, they rarely provide information onthe relative riskiness of different varieties of a risky activity—information thatwould enable people <strong>to</strong> reduce the intensity of their exposure <strong>to</strong> risk while remainingactive. For example, it is virtually impossible <strong>to</strong> find any information on howdangerous smoking 2 cigarettes per day is, compared <strong>to</strong> smoking 0 or smoking 20.Likewise, clean syringe access programs were illegal in many US states for manyyears after the onset of the <strong>HIV</strong> crisis. However, the amount of information or thetype of services that a prevention campaign may need <strong>to</strong> provide in order <strong>to</strong> maximizeits health impact depends on the relative elasticity of behavior at two margins: atthe intensive margin (the choice between high- and low-risk varieties of an activity)and at the extensive margin (the choice between some activity and no activityat all). The empirical evidence presented in this paper suggests that, in the caseof sexual behavior, people are much more elastic on the intensive margin than onthe extensive one.
30 American Economic Journal: applied economics january 2011AppendixTable A1—Status of Study Sample at Follow-up, by Treatment GroupComparisongroup (C)(1)RR informationTreatmentgroup (T)(2)DifferenceT−C(3)TT on <strong>HIV</strong>/AIDS curriculumComparisongroup (C)(4)Treatmentgroup (T)(5)DifferenceT−C(6)Panel A. GirlsStatus unknown (attrited) 0.021 0.013 −0.008 0.018 0.020 0.001(0.008) (0.007)Percent repeating class 8 0.235 0.212 −0.023 0.223 0.237 0.014(0.022) (0.018)Percent in secondary school 0.461 0.450 −0.010 0.479 0.438 −0.041(0.026) (0.021)*Percent in professional training 0.045 0.052 0.007 0.047 0.046 −0.001(0.009) (0.008)Percent out of school 0.267 0.295 0.028 0.262 0.285 0.022(0.025) (0.020)Percent dead 0.0014 0.0016 0.0002 0.0008 0.0021 0.0014(0.0016) (0.0013)Observations 5,007 1,189 6,196 3,229 2,967 6,196Number of schools 254 71 325 164 161 325Panel B. BoysStatus unknown (attrited) 0.014 0.013 0.021 0.013 0.015 −0.002(0.022) (0.019)Percent repeating class 8 0.219 0.189 0.000 0.210 0.214 0.001(0.002) (0.001)Percent in secondary school 0.487 0.499 −0.030 0.491 0.488 0.004(0.019) (0.016)Percent in professional training 0.039 0.034 0.012 0.036 0.039 −0.003(0.025) (0.021)Percent out of school 0.263 0.284 −0.005 0.268 0.266 0.004(0.008) (0.007)Percent dead 0.0006 0.0004 −0.0002 0.0011 0.0000 −0.0011(0.0007) (0.00061)*Observations 5,485 1,335 6,820 3,454 3,366 6,820Notes: Data collected by asking whereabouts of students at their 2004 primary school. Status as of July 2005. Studysample composed of students enrolled in eighth grade in 2004. The table presents school averages. Standard errorsin parenthesis. Three schools did not have an eighth grade class in 2004 and therefore are excluded <strong>from</strong> the table.*** Significant at the 1 percent level. ** Significant at the 5 percent level. * Significant at the 10 percent level.SampleTable A2—Robustness of Table 4 Results <strong>to</strong> Source of Data on Partner’s Age(Dependent variable: Age gap > 5 years)All those <strong>to</strong> whom the HomeSurvey was administered(1)Home Surveyadministered <strong>to</strong> self(2)Home Surveyadministered <strong>to</strong> relative(3)RR information −0.224 −0.223 −0.197(0.116)* (0.210) (0.154)TT on <strong>HIV</strong>/AIDS curriculum 0.074 0.092 0.232(0.081) (0.119) (0.117)*Observations 134 79 55R 2 0.25 0.35 0.39Mean of dependent variable 0.431 0.427 0.441Notes: Robust standard errors are in parentheses, clustered at the school level. Column 1 reproduces column 3 of Table 4.*** Significant at the 1 percent level. ** Significant at the 5 percent level. * Significant at the 10 percent level.Source: Follow-up survey conducted at the girl’s home.
Vol. 3 No. 1 dupas: do teenagers respond <strong>to</strong> hiv risk information?31Table A3—Testing for an Interaction Effect betweenRR and TT <strong>Information</strong> SetsSample All Girls who started childbearing Secondary school girlsCorresponding specificationin main tables: Table 3, col. 1 Table 4, col. 1 Table 4, col. 3 Table 6, col. 5 Table 6, col. 9Has startedchildbearing(1)Age differencebetween teenage girland her partner(2)Age gap>5 years(3)Age gap>5 years(4)Everhad sex(5)α RR only −0.007 −2.33 −0.158 −0.061 0.109(0.010) (1.183)* (0.131) (0.061) (0.045)**TT only 0.009 -0.904 0.093 0.008 −0.025(0.007) (0.855) (0.092) (0.044) (0.025)γ Both RR and TT −0.016 −2.251 −0.166 −0.068 0.069(0.014) (0.960)** (0.161) (0.038)* (0.039)*Observations 5,988 120 134 260 2,173p-value, test (α = γ) 0.55 0.94 0.96 0.874 0.442Note: Robust standard errors are in parentheses*** Significant at the 1 percent level.** Significant at the 5 percent level.* Significant at the 10 percent level.Table A4—Self-Reported Sexual Behavior for Students Who Joined Secondary School:Alternative Coding of Inconsistent ReportsHas had sexwith multiplepartners(1)Currentlyhas a regularpartner a(2)Partner >5years older b(3)Ever receivedmoney <strong>from</strong>currentpartner(4)Everhadsex(5)Ever had sex Used abut never condom atused a last sexualcondom intercourse(6) (7)Panel A. Girls Model OLS OLS OLS OLS OLS OLS OLSRR information 0.007 0.071 −0.080 0.071 0.079 0.015 0.154(0.015) (0.021)*** (0.040)* (0.090) (0.028)*** (0.025) (0.081)*TT on <strong>HIV</strong>/AIDS −0.010 0.019 0.014 0.059 −0.017 −0.016 −0.034curriculum (0.011) (0.020) (0.029) (0.084) (0.022) (0.015) (0.073)Observations 2,170 2,206 196 193 2,170 2,170 267Mean of dependentvariable (RR = 0)0.033 0.090 0.078 0.710 0.159 0.088 0.354ControlsIndividualcharacteristicsSecondary schoolcharacteristicsYes Yes Yes Yes Yes Yes YesYes Yes Yes Yes Yes Yes Yes(Continued)
32 American Economic Journal: applied economics january 2011Table A4—Self-Reported Sexual Behavior for Students Who Joined Secondary School:Alternative Coding of Inconsistent Reports (Continued)Has had sex Currentlywith multiple has a regularpartners partnerPartner >5yearsolderEver gavemoney <strong>to</strong>currentpartnerEverhadsexEver hadsex butnever used acondomUsed acondom atlast sexualintercoursePanel B. Boys model OLS OLS OLS OLS OLS OLS OLSRR information 0.106 0.035 −0.049 0.169 0.127 0.06 0.029(0.032)*** (0.027) (0.019)** (0.113) (0.036)*** (0.039) (0.041)TT on <strong>HIV</strong>/AIDS −0.011 0.003 0.021 −0.063 −0.024 0.005 −0.017curriculum (0.023) (0.019) (0.021) (0.073) (0.025) (0.023) (0.030)Observations 2,668 2,713 288 325 2,668 2,668 1,090Mean of dependent 0.217 0.125 0.036 0.458 0.511 0.328 0.291variable (RR = 0)ControlsIndividualYes Yes Yes Yes Yes Yes YescharacteristicsSecondary schoolcharacteristicsYes Yes Yes Yes Yes Yes YesNote: See Table 6 notes.a75 girls and 25 boys gave inconsistent answers: they declared never having had sex, but declared having aregular partner. In this table, we ignore the regular partner information and assume that those students never hadsex. (Table 6 presents the results when we assume that those who declared having a regular partner lied on the“ever had sex” question).bAmong those who report ever having had sex and having a regular partner, 7 percent of girls and 13 percen<strong>to</strong>f boys did not report any information on the age gap with their current partner, and 10 percent of girls and 6percent of boys did not report if they had received/given money <strong>from</strong>/<strong>to</strong> their current partner.REFERENCESBoily, Marie-Claude, Rebecca F. Baggaley, Lei Wang, Benoit Masses, Richard G. White, Richard J.Hayes, and Michel Alary. 2009. “Heterosexual <strong>Risk</strong> of <strong>HIV</strong>-1 Infection per Sexual Act: SystematicReview and Meta-Analysis of Observational Studies.” Lancet Infectious Diseases, 9(2): 118–29.Clark, Shelley. 2004. “Early Marriage and <strong>HIV</strong> <strong>Risk</strong>s in Sub-Saharan Africa.” Studies in Family Planning,35(3): 149–60.Davis, Kevin C., Matthew C. Farrelly, Peter Messeri, and Jennifer Duke. 2009. “The Impact ofNational Smoking Prevention Campaigns on Tobacco-Related Beliefs, Intentions <strong>to</strong> Smoke andSmoking Initiation: Results <strong>from</strong> a Longitudinal Survey of Youth in the United States.” InternationalJournal of Environmental Research and Public Health, 6(2): 722–40.Dee, Thomas S., and William N. Evans. 2001. “Teens and Traffic Safety.” In <strong>Risk</strong>y Behavior amongYouths: An Economic Analysis, ed. Jonathan Gruber, 121–65. Chicago: University of Chicago Press.<strong>Do</strong>wns, Julie S., George Loewenstein, and Jessica Wisdom. 2009. “Strategies for Promoting HealthierFood Choices.” American Economic Review, 99(2): 159–64.Duflo, Esther, Pascaline Dupas, Michael Kremer, and Samuel Sinei. 2006. “Education and <strong>HIV</strong>/AIDSPrevention: <strong>Evidence</strong> <strong>from</strong> a Randomized Evaluation in Western Kenya.” World Bank PolicyResearch Working Paper 4024.Gallant, Melanie, and Eleanor Maticka-Tyndale. 2004. “School-Based <strong>HIV</strong> Prevention Programmesfor African Youth.” Social Science and Medicine, 58(7): 1337–51.Gersovitz, Mark, Hanan G. Jacoby, F. Seri Dedy, and A Gozé Tapé. 1998. “The Balance of Self-Reported Heterosexual Activity in KAP Surveys and the AIDS Epidemic in Africa.” Journal of theAmerican Statistical Association, 93(443): 875–83.Gilson, Lucy, Rashid Mkanje, Heiner Grosskurth, Frank Mosha, John Picard, Awena Gavyole, JamesTodd, et al. 1997. “Cost-Effectiveness of Improved Treatment Services for Sexually Transmitted Diseasesin Preventing <strong>HIV</strong>-1 Infection in Mwanza Region, Tanzania.” Lancet, 350(9094): 1805–09.
Vol. 3 No. 1 dupas: do teenagers respond <strong>to</strong> hiv risk information?33Glynn, J. R., M. Caraël, B. Auvert, M. Kahindo, J. Chege, R. Musonda, F. Kaona, and A. Buvé. 2001.“Why <strong>Do</strong> Young Women Have a Much Higher Prevalence of <strong>HIV</strong> than Young Men? A Study inKisumu, Kenya and Ndola, Zambia.” AIDS, 15(S4): S51–60.Gray, Ronald H., Xianbin Li, Godfrey Kigozi, David Serwadda, Fred Nalugoda, Stephen Watya,Steen J. Reynolds, and M. Wawer. 2007. “The Impact of Male Circumcision on <strong>HIV</strong> Incidenceand Cost per Infection Prevented: A S<strong>to</strong>chastic Simulation Model <strong>from</strong> Rakai, Uganda.” AIDS,21(7): 845–50.Gregson, Simon, Constance A. Nyamukapa, Geoffrey P. Garnett, Peter R. Mason, Tom Zhuwau,Michel Caraël, Stephen K. Chandiwana, and Roy M. Anderson. 2002. “Sexual Mixing Patterns andSex-Differentials in Teenage Exposure <strong>to</strong> <strong>HIV</strong> Infection in Rural Zimbabwe.” Lancet, 359(9321):1896–1903.Grimes, David A. 2003. “Unsafe Abortion: The Silent Scourge.” British Medical Bulletin, 67(1): 99–113.Gruber, Jonathan, and Jonathan Zinman. 2001. “Youth Smoking in the United States: <strong>Evidence</strong>and Implications.” In <strong>Risk</strong>y Behavior among Youths: An Economic Analysis, ed. Jonathan Gruber,69–120. Chicago: University of Chicago Press.Hayes, R. J., J. Changalucha, D. A. Ross, A. Gavyole, J. Todd, A. I. Obasi, D. Wright, and H. Grosskurth.2005. “The MEMA kwa Vijana Project: Design of a Community Randomised Trial of an InnovativeAdolescent Sexual Health Intervention in Rural Tanzania.” Contemporary Clinical Trials, 26(4):430–42.Hoffman, Saul D. 1998. “Teenage Childbearing Is Not So Bad After All…Or Is It? A Review of theNew Literature.” Family Planning Perspectives, 30(5): 236–39, 243.Jalan, Jyotsna, and E. Somanathan. 2008. “The Importance of Being Informed: Experimental <strong>Evidence</strong>on Demand for Environmental Quality.” Journal of Development Economics, 87(1): 14–28.Jensen, Robert. 2010. “The (Perceived) Returns <strong>to</strong> Education and the Demand for Schooling.” QuarterlyJournal of Economics, 125(2): 515–48.Kelly, R. J., R. H. Gray, N. K. Sewankambo, D. Serwadda, F. Wabwire-Mangen, T. Lutalo, and M. J.Wawer. 2003. “Age Differences in Sexual Partners and <strong>Risk</strong> of <strong>HIV</strong>-1 Infection in Rural Uganda.”Journal of Acquired Immune Deficiency Syndrome, 32(4): 446–51.Kenya Central Bureau of Statistics, Kenya Ministry of Health, and ORC Macro. 2004. Kenya Demographicand Health Survey 2003. Calver<strong>to</strong>n, MD: ORC Macro. http://www.measuredhs.com/pubs/pdf/FR151/FR151.pdf.Kenya Institute of Education. 1999. Let Us Talk about AIDS: A Book for Class 6, 7, and 8. Nairobi,Kenya: Kenya Institute of Education.Kirby, <strong>Do</strong>uglas B. 2008. “The Impact of Abstinence and Comprehensive Sex and STD/<strong>HIV</strong> EducationPrograms on Adolescent Sexual Behavior.” Sexuality Research and Social Policy, 5(3): 18–27.Laga, Marie, Bernhard Schwärtlander, Elizabeth Pisani, Papa Salif Sow, and Michel Caraël. 2001.“To Stem <strong>HIV</strong> in Africa, Prevent Transmission <strong>to</strong> Young Women.” AIDS, 15(7): 931–34.LeGrand, Thomas K., and Cheikh S. M. Mbacké. 1993. “Teenage Pregnancy and Child Health in theUrban Sahel.” Studies in Family Planning, 24(3): 137–49.Levitt, Steven D., and Lance Lochner. 2001. “The Determinants of Juvenile Crime.” In <strong>Risk</strong>y Behavioramong Youths: An Economic Analysis, ed. Jonathan Gruber, 327–74. Chicago: University of ChicagoPress.Luke, Nancy. 2003. “Age and Economic Asymmetries in the Sexual Relationships of Adolescent Girlsin Sub-Saharan Africa.” Studies in Family Planning, 34(2): 67–86.Luke, Nancy, and Kathleen M. Kurz. 2002. Cross-generational and Transactional Sexual Relations inSub-Saharan Africa: Prevalence of Behavior and Implications for Negotiating Safer Sexual Practices.Washing<strong>to</strong>n, DC: International Center for Research on Women.Madajewicz, Malgosia, Alexander Pfaff, Alexander van Geen, Joseph Graziano, Iftikhar Hussein,Hasina Momotaj, Roksana Sylvi, and Habibul Ahsan. 2007. “Can <strong>Information</strong> Alone ChangeBehavior? Response <strong>to</strong> Arsenic Contamination of Groundwater in Bangladesh.” Journal of DevelopmentEconomics, 84(2): 731–54.Magruder, Jeremy. 2007. “Marital Shopping and Epidemic AIDS.” Unpublished.Pacula, Rosalie Liccardo, Michael Grossman, Frank J. Chaloupka, Patrick M. O’Malley, Lloyd D.Johns<strong>to</strong>n, and Matthew C. Farrelly. 2001. “Marijuana and Youth.” In <strong>Risk</strong>y Behavior among Youths:An Economic Analysis, ed. Jonathan Gruber, 271–326. Chicago: University of Chicago Press.Peterman, Thomas A., Rand L. S<strong>to</strong>neburner, James R. Allen, Harold W. Jaffe, and James W. Curran.1988. “<strong>Risk</strong> of Human Immunodeficiency Virus Transmission <strong>from</strong> Heterosexual Adults withTransfusion-Associated Infections.” Journal of the American Medical Association, 259(1): 55–58.Pop-Eleches, Cristian. 2006. “The Impact of an Abortion Ban on Socioeconomic Outcomes of Children:<strong>Evidence</strong> <strong>from</strong> Romania.” Journal of Political Economy, 114(4): 744–73.
34 American Economic Journal: applied economics january 2011Population Services International. 2005. “The Sugar Daddy Syndrome: African Campaigns BattleIngrained Phenomenon.” http://www.psi.org/sites/default/files/publication_files/cross-gen.pdf.Republic of Kenya Ministry of Health. 2001. “Figure 5. Prevalence of <strong>HIV</strong> in Kisumu, 1997 (WHO1997).” In AIDS in Kenya: Background, Projections, Impact, Interventions, Policy, 6th ed. Nairobi,Kenya: National AIDS Control Council Office of the President (NASCOP). http://www.policyproject.com/pubs/countryreports/AIDS_in_Kenya.pdf.Rogo, K. O. 1993. “Induced Abortion in Sub-Saharan Africa.” East African Medical Journal, 70(6):386–95.Thorn<strong>to</strong>n, Rebecca L. 2008. “The Demand for, and Impact of, Learning <strong>HIV</strong> Status.” American EconomicReview, 98(5): 1829–63.UNAIDS. 2008. 2008 Report on the Global AIDS Epidemic. Geneva, Switzerland: UNAIDS.Wilcox, Allen J., Clarice R. Weinberg, and <strong>Do</strong>nna D. Baird. 1995. “Timing of Sexual Intercourse inRelation <strong>to</strong> Ovulation—Effects on the Probability of Conception, Survival of Pregnancy, and Sexof the Baby.” New England Journal of Medicine, 333(23): 1517–21.World Bank. 2002. Education and <strong>HIV</strong>/AIDS: A Window of Hope. Washing<strong>to</strong>n, DC: World Bank.
This article has been cited by:1. Lori Bennear, Alessandro Tarozzi, Alexander Pfaff, Soumya Balasubramanya, Kazi Matin Ahmed,Alexander van Geen. 2012. Impact of a randomized controlled trial in arsenic risk communicationon household water-source choices in Bangladesh. Journal of Environmental Economics andManagement . [CrossRef]2. Robert Jensen, Adriana Lleras-Muney. 2012. <strong>Do</strong>es staying in school (and not working) preventteen smoking and drinking?. Journal of Health Economics 31:4, 644-657. [CrossRef]3. Sylvain Chassang,, Gerard Padró i Miquel,, Erik Snowberg. 2012. Selective Trials: A Principal-Agent Approach <strong>to</strong> Randomized Controlled Experiments. American Economic Review 102:4,1279-1309. [Abstract] [View PDF article] [PDF with links]4. Ivo Vlaev, Ara DarziPreferences and Their Implication for Policy, Health and Wellbeing 305-336.[CrossRef]5. Emily Oster. 2012. <strong>HIV</strong> and Sexual Behavior Change: Why not Africa?. Journal of HealthEconomics . [CrossRef]6. Jeremy R. Magruder. 2011. Marital Shopping and Epidemic AIDS. Demography . [CrossRef]7. Nancy S Padian, Charles B Holmes, Sandra I McCoy, Rob Lyerla, Paul D Bouey, Eric P Goosby.2011. Response <strong>to</strong> Letter <strong>from</strong> Thomas et al Critiquing “Implementation Science for the USPresidentʼs Emergency Plan for AIDS Relief”. JAIDS Journal of Acquired Immune DeficiencySyndromes 58:1, e21-e22. [CrossRef]8. Jonathan Robinson,, Ethan Yeh. 2011. Transactional Sex as a Response <strong>to</strong> <strong>Risk</strong> in WesternKenya. American Economic Journal: Applied Economics 3:1, 35-64. [Abstract] [View PDF article][PDF with links]9. Michael Kremer, Rachel GlennersterImproving Health in Developing Countries 2, 201-315.[CrossRef]10. John Cawley, Chris<strong>to</strong>pher J. RuhmThe Economics of <strong>Risk</strong>y Health Behaviors 2, 95-199.[CrossRef]11. Pascaline Dupas. 2010. Health Behavior in Developing Countries. Annual Review of Economics3:1, 110301095653089. [CrossRef]