RC Circuit(12-23-08).pdf - Physics
RC Circuit(12-23-08).pdf - Physics
RC Circuit(12-23-08).pdf - Physics

You also want an ePaper? Increase the reach of your titles
YUMPU automatically turns print PDFs into web optimized ePapers that Google loves.
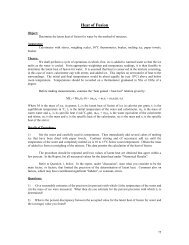
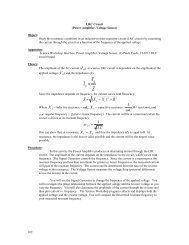
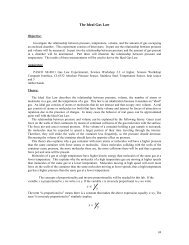
Object:<strong>RC</strong> <strong>Circuit</strong>(Power amplifier, Voltage Sensor)To investigate how the voltage across a capacitor varies as it charges and to find its capacitive timeconstant.Apparatus:Science Workshop, Power Amplifier, Voltage Sensor, (3) Patch Cords, CI-65<strong>12</strong> RLC circuitboard.Theory:When a DC voltage source is connected across an uncharged capacitor, the rate at which thecapacitor charges up decrease as time passes. At first, the capacitor is easy to charge because thereis very little charge on the plates. But as charge accumulates on the plates, the voltage source must“do more work” to move additional charges onto the plates because the plates already have chargeof the same sign on them. As a result, the capacitor charges exponentially, quickly at thebeginning and more slowly as the capacitor becomes fully charged. The charge on the plates atany time is given by:Procedure:q = q ( − e − t τ)Where q 0is the maximum charge on the plate and τ is the capacitive time constant (τ = <strong>RC</strong>,where R is resistance and C is capacitance). NOTE: The stated value of a capacitor may vary byas much as ±20 % from the actual value. Taking the extreme limits, notice that when t = 0, q = 0which means there is not any charge on the plates initially. Also notice that when t goes to infinity,q goes to q 0which means it takes an infinite amount of time to completely charge the capacitor.The time it takes to charge the capacitor to half of full is called the half-life and is related to thetime constant in the following way:t <strong>12</strong>= τ ln 2In this activity the charge on the capacitor will be measured indirectly by measuring the voltageacross the capacitor since these two values are proportional to each other: q=CV.In this activity, the Power Amplifier produces a low frequency square wave (0 to 4 V). Thiswaveform imitates the action of charging and then discharging a capacitor by connecting and thendisconnecting a DC voltage source. The Voltage Sensor measures the voltage across the capacitoras it charges and discharges.The Science Workshop program records and displays the data. You will measure the time for thecapacitor to charge to the “half-maximum” voltage. Using the half-life time and the known valueof the resistor, you can calculate the capacitance of the capacitor.Part I: Computer Setup and Equipment Setup1. Connect the Science Workshop interface to the computer, turn on the interface, and turn on thecomputer.2. Connect the Power Amplifier to Analog Channel B. Connect the Voltage Sensor to AnalogChannel A. Plug the power cord into the back of the Power Amplifier and connect the power cordto an appropriate electrical outlet.0 197
3. Open the Science Workshop document titled as shown below:Windows: P43_<strong>RC</strong>CI.SWS4. The Sampling settings for this activity are: Periodic Samples = Fast at 1000 Hz and StopCondition = Time at 4.00 seconds.5. The Signal Generator is set to output a 4.00 V, “positive only” square AC Waveform, at 0.40 Hz.It is set to Auto so the Signal Generator will start automatically when you click “MON” or “REC”and stop automatically when you click “STOP” or “PAUSE”.6. Connect a jumper cable to remove the inductor from the circuit.7. Connect the positive output from the Power Amplifier to the jack just below the 100Ω resistor.8. Connect the negative output from the Power Amplifier to the jack just below the 330µ fcapacitor.The circuit now consists of a 100Ω resistor in series with a 330µ f capacitor.9. Connect the voltage sensor across the 330µ f capacitor as shown below.Part II: Data Recording1. Turn on the power switch on the back of the Power Amplifier.2. Press the Alt key and the R key simultaneously to start collecting data. The Signal Generatoroutput will automatically start when data recording begins.3. Data recording will continue for four seconds and then stop automatically.4. When data recording is complete, turn off the switch on the back of the Power Amplifier.Analyzing The Data:1. Click the Autoscale button ( ) in the Graph to rescale the Graph to fit the data.98
2. Click the Magnifier button ( ). Use the cursor to click-and-draw a rectangle over a region ofthe plot of Voltage versus Time that shows the voltage rising from zero volts to the maximumvolts.* This will give you an expanded view of the Voltage versus Time plot for that region.3. Click the Smart Cursor button ( ). The cursor changes to a cross-hair when you move thecursor into the display area of the Graph.* The Y-coordinate of the cursor/cross-hair is shown next to the vertical axis.* The X-coordinate of the cursor/cross-hair is shown next to the horizontal axis.99
4. Move the cursor to the point on the plot where the voltage begins to rise. Record the time that isshown in the area below the horizontal axis.5. Move the Smart Cursor to the point where the voltage is approximately 2.00 volts. Record the newtime that is shown in the area below the horizontal axis.6. Find the difference between the two times and record it as the time to “half-max”, ort 1 2.Data:Beginning time = ___________ sTime to 2.00 V = ___________ sTime to half-max (t 1 2) = ____________ s1. Use t 1 2= τ ln 2 = 0.693<strong>RC</strong> to calculate the capacitance (C) of the capacitor.Capacitance = _____________ farad2. If a capacitance meter is available, use it to measure the capacitance of the capacitor. Using thepercent difference method, compare the measured value to the experimental value. (Remember,the stated value of a capacitor may vary by as much as ±20% from the actual measured value.) Ifa capacitance meter is not available, use the percent difference method and compare the statedvalue (e.g., 330µF) to the experimental value.Questions:100
1. The time to half-maximum voltage is how long it takes the capacitor to charge halfway. Based onyour experimental results, how long does it take for the capacitor to charge to 75% of itsmaximum?2. After four “half-lives” (i.e., time to half-max), to what percentage of the maximum charge is thecapacitor charged?3. What is the maximum charge for the capacitor in this experiment?4. What are some factors that could account for the percent difference between the stated andexperimental values?101