MARINE BIOLOGICAL SURVEY OF THE PROPOSED DOCK SITE ...
MARINE BIOLOGICAL SURVEY OF THE PROPOSED DOCK SITE ...
MARINE BIOLOGICAL SURVEY OF THE PROPOSED DOCK SITE ...

You also want an ePaper? Increase the reach of your titles
YUMPU automatically turns print PDFs into web optimized ePapers that Google loves.
<strong>MARINE</strong> <strong>BIOLOGICAL</strong> <strong>SURVEY</strong><strong>OF</strong> <strong>THE</strong> <strong>PROPOSED</strong> <strong>DOCK</strong> <strong>SITE</strong>AT COLONIA, YAPSteven S. Amesbury, Roy T. Tsuda, Richard H.Randall, and Charles E. BirkelandUniversity of Guam Marine LaboratoryTechnical Report No. 35March 1977
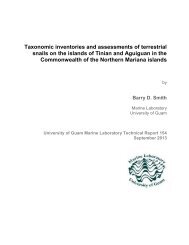
•INTRODUCTIONThe University of Guam Marine Laboratory was asked by the U. S.Army Corps of Engineers to perform a survey of the biota of theproposed dock and harbor site at Colonia, Yap. The proposed site, onthe north side of Colonia Peninsula, includes approximately 200,000square feet of intertidal schistose rock and SUbtidal reef area,which extends from the present shoreline out to the edge of theexisting channel to the north (Figure l). The whole of the biota inthis area will be removed or covered by the dredging and fillingoperation required for the construction of the dock. In order toassess the significance of this disruption of the environment, theMarine Laboratory survey team wa s requested to make a reconnaissanceof the proposed dock site and to prepare a report which would includethe following information:PERSONNEL1. A description of the qualitative conditions of the marineenvjronment at the project site;2. Discussion of the dominant coral, fish, algal, and invertebratespecies found at the project site;3. Discussion of the abundance and distribution of corals,fishes. algae, and invertebrates at the project site;4. Discussion of the probable adverse effects of the projectson the marine resources found at the project site;5. Recommendations for avoidjng or mitigating adverse environmentalimpacts attributed to the project.Steven S. AmesburYt Ph.D., Assistant Professor, Marine Laboratory,University of Guam (Fishes)Charles E. Birkeland, Ph.D., Associate Professor, Marine Laboratory,University of Guam (Hacro-invertebrates)Richard H. Randall, M. S., Assistant Professor, Harine Laboratory,University of Guam (Corals).Roy T. Tsuda, Ph.D., Professor, Marine Laboratory, University ofGuam (Marine Plants)ACKNOWLEDGEMENTSWe would like to thank Mr. Mike Gallen and Mr. Mike McCoy of theDivision of Marine Resources, Yap District, for their help and logisticsupport during this survey.
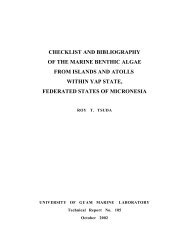
2I\.).. .......i I '.:'·1'., ........Slope'.'........ ---...... ::: -'--., :-.. ."': .. ..... .. ., ,NHospita 1oLegislatureBuildingFigure 1. Proposed dock site, Yap. Transect numbers (1-4) are indicated,as is the pattern of zonation. Dotted line indicated path ofdye patch from channel market A to circular dotted area off thehospital.
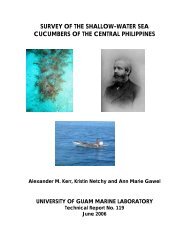
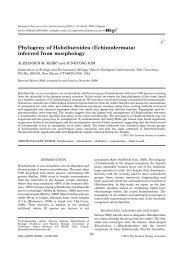
3METHODSThe proposed dock site was visited from March 4 to 7, 1977.Four transects extending across the reef flat and down the slope tothe channel floor, were established in the study area (Figure 2).The biota was quantified for each 10-meter interval along each of thefour transects.Marine plants were quantified by haphazardly tossing a 25 cm x25 em gridded quadrat with sixteen interior "points" (intersectinggrid lines) five to ten times for each 10-meter transect interval.The percent cover or abundance was calculated by dividing the numberof points at which each species was recorded by the total number ofpoints (16 points x number of tosses) and multiplying by 100 toobtain a percent value.Reef corals were quantified by a point-quarter technique (Cottamet al, 1953). At stations 5 meters apart (i.e., two per 10-meterinterval along the transect), a point was selected somewhat randomlyby dropping a collecting chisel. The orientation of the chisel wasused to define perpendicular axes. Within each of the four quadrantsdelimited by these axes, the coral nearest the intersection point waslocated, and the species name, the diameter or basal area of thecoral and the distance from the center of the coral to the point wererecorded. By combining the data for all points falling within eachof the various reef zones (see below), the percentage of substratecovered and the frequency of occurrence for each species encounteredwithin a given zone was calculated. An importance value (IV) foreach species was determined by summing the relative value of thesetwo parameters. Overal density and percentage of substrate coveredby living corals were also determined for each reef zone.Large echinoderms and other macro-invertebrates which occurredwithin one meter of the transect line were enumerated for each 10-meter interval. A separate enumeration was made for the left sideand the right side of the line in order that two censuses, eachcovering an area of 10 m 2 , could be made for each 10-meter interval.All fishes observed within one meter of either side of thetransect line were recorded for each 10-meter interval.Qualitative surveys of marine plants, corals, macro-invertebrates,and fishes in the study area and in an area on the opposite side ofthe channel (Figure 3) were also made so that more complete specieslists could be compiled for the study site, and so that generalcomparisons could be made between the study site and the area acrossthe channel.
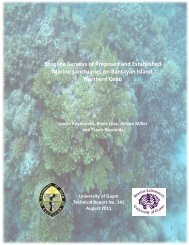
4HIGH TIDE HIGH TIDE0LOW TIDELOW TIDE2· BOULDER BOULDER ENHALUS-RUBBLE RUBBLE THALASSIA SAND4 ZONE LAGOON ZONE ZONE ANDSAND SLOPE CORAL6 020J AND ZONE36 CORAL)0 24 6ZONE8 ENHAWS-THALASSIA10 ZONE 50-t10012TRANSECT 2SLOPE14TRANSECT 11618HIGH TIDE0BOULDERLOW TIDERUBBLE!:NHALUS-2ZONE THALASSIA SAND ANDZONECORAL ZONE40 36672TRANSECT 311 8LAGOONSLOPE 10014LOW TIDE2BOULDER 16RUBBLE4 ZONE ENHALUS- THALASSIA ZONE SAND AND18CORAi. ZOi:E61280 30 9510 12512 TRANSECT 414LAGOONSLOPE16182022Figure 2.Depth profiles of the four transects showing boundaries ofzones. Depth scale is in meters. Numbers at zone boundariesindicate distances along transect line. Vertical exaggerationXS.
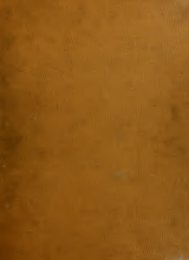
ColoniaChaaorro BarNr Worwor',1 NMToa1l HarborBalabat)( Reef Flat PlatformFigure 3.Map of Tomil Harbor showing study site, as well as channel Market Bandreef flat platform where additional observations were made.'"
6In order to assess the general pattern afwater circulation atthe study site. a patch of fluorescein dye was released at channelmarker A at a depth of 2 meters on March 6, 1977. at 10:02 a.m.This dye patch was tracked for a period of 45 minutes.RESULTS AND DISCUSSIONMarine Plants - A total of 51 species of marine benthic plants(Table 1) was collected or observed in the study site. This comparedfavorable with the 41 species reported previously (Amesbury et al.,1976) at the sewage outfall site off Conitsch Island. Thirty-one ofthe species were common to both sites (Coefficient of Community = 52%).[This value was derived by dividing the number of species common toboth sites by the total number of species present in both sites andmUltiplying by 100 to obtain a percentage value.] None of the algalor seagrass species present at the study site could be considered asendangered or threatened species.The marine benthic flora, quantified within 10-20 m segments,along each of the four transects are presented in Figure 4 in termsof the dominant functional groups, i.e., floristic elements compartmentalizedwith respect to their secondary role in the ecosystem.The four functional groups depicted here are turf (algae usually lessthan 2 cm high), macroalgae (fleshy, usually erect, algae), seagrasses.and the crustose coral-line algae.As seen in Figure 4, the turf community is dominant and oftenserves as the major source of food for herbivorous fishes. Themacroalage and sea-grasses are also conspicuous and serve as coverfor many of the organisms inhabiting this area. In addition, thedecomposed macroalgae and, especially, the decomposed sea-grassesserve as the primary source of food for detritus feeding organisms.The crustose coralline algae, most conspicuous on the upper reefslope, serve primarily as the cementing agent for coral rubble.As mentioned previously, the study site can be divided intofour zones which consist of distinct algal components. The dominantalga in the Boulder-Rubble Zone (N = 50 tosses) was Polysiphoniahowei which formed dark red mats on the vertical walls and covered-----37% of this zone. Other algae quantified here were the blue-greenalgae Microcoleus lyngbyaceus (12% cover) and Brachytrichia quoyi(3% cover). The green alga Neomeris vanbosseae (2% cover) was alsoconspicuous in this zone.Forty-one of the 51 species found in the study site were presentin the Enhalus-Thalassia Zone (N = 105 tosses). The two major seagrassesThalassia hemprichii and Enhalus acoroides were the mostconspicuous component covering 14% and 6%, respectively, of the
7Table 1.Checklist of marine benthic plants collected or observed at theproposed Yap Dock Site, March 4-6, 1977. Soecies preceded byasterisks were not observed at the Donitsch Outfall Site inJanuary 1976 (Amesbury et a1., 1976).SpeciesBoulderRubb 1 eZoneEnha1usTliaiasSlaZoneSandCora 1ZoneLagoonSlopeCYANOPHYTA (blue-green algae)*Brachytrichia quovi (C. Ag.) B. & Fl.Ca10thrix crustacea (Schousb. & Thu.)Nicroco1eus 1yngbyaceus (Kutz . ) CrouanSchizothrix ca1cico1a-rAg.) Gom.XXXXXXXXXXXXXCHLOROPHYTA (green algae)Anadyomene wrightii Gray*Avrainvi11ea 1acerata GeppAvrainvjj1ea obscura J. Ag.Boodlea composita (Harv.) Brand*Caulerpa antoensis Yamada*Caulerpa brachypus HarveyCau1erpa racemosa (Forssk.) J. Ag.Cau1erpa sertularioides (Gmelin) Howe*Caulerpa taxifolia (Vahl) C. Ag.*Caulerpa vertici1lata J. Ag.*Codium geppii O. C. SchmidtDictyosbhaeria cavernosa (Forssk.) Boerg.*Enteromoroha sp .XHali~eda discoidea DecaisneHalimeda incrassata (Ellis) Lamx.Halimeda macroloba DecaisneHalimeda macrophysa AskenasyHalimeda oountia (L.) Lamx.*Neomeris vanbosseae HoweTydemannia expeditionis l~.v. BosseXXXXXXXXXXXXXXXXXXXXXXXXXXxXXXPHAEOPHYTA (brown algae)Dictyota apiculata J. Ag.Dictyota cervicornis Kutz.Hydroclathrus clathratus (C. Ag.) HoweLobophora variegata (Lamx.) lJomersleyPadina tenuis aoryRosenyingea intricata (J. Ag.) Boerg.XXXxXxxXXX
-L8Table 1.Continued.SpeciesBoulderRubbleZoneEnhalusThalassiaZoneSandCoralZoneLagoonSlopeRHODOPHYTA (red algae)Acanthophora spicifera (Vahl) Boerg.Amphiroa foliacea Lamx.Amphiroa fragilissima (L.) Lamx.*Antithamnion sp.*Centroceras clavulatum (C. Ag.) Mont.*Champia parvula (C. Ag.) Harvey*Chondria sp.*Galaxaura cf. marginata Lamx.*Galaxaura cf. oblongata (E. & S.) Lamx.*Gelidiopsis intricata (Ag.) VickersGracilaria crassa HarveyGracilaria salicornia (Mert.) Grev.*Heterosiphonia sp.*Laurencia papillosa (Forssk.) Grev.*Po 1 ys i phoni a howei Ho 11 enbergPolysiphonia tepida HollenbergSpyridia filamentosa (Wulfen) Harv.XXXXXXXXXXXXXXXXxxXXXXANTHOPHYTA (sea-grass)*Cymodocea rotundata Ehrenb. & Hempr.Enhalus acoroides (L.f.) RoyleHalophila minor (Zoll.) den HartogThalassia hemDrichii (Ehrenb.) Aschers.XXXXXNUMBER <strong>OF</strong> SPECIES PER ZONE6411717TOTAL NUMBER <strong>OF</strong> GENERA = 36TOTAL NUMBER <strong>OF</strong> SPECIES = 51
9I~kQ):>ou.....cQ)()kQ)P.5555101055Transect 4~ 1 ()55~ 7/~ 5 5 ' .. .. ' 555 ... .....'.'.. .. .... ......... .5 ~5~ 5 .."
-10sandy substratum. The genus ~olysiphonia (7% cover) was abundanton the coral rubbl~ interspersed among the sea-grasses. Microcoleuslyngbyaceus (3% cover), Halimeda opuntia (2% cover) and Caulerparacemosa (2 % cover) were the other conspicuous algae among the seagrasses.The sea-grasses also served as a substratum for severalof the filamentous-like alge, e.g .• Centroceras clavulatum, Champiaparvula, Spyridia filamentosa, Chondria sp., which grew epiphyticallyOn the blades.The only conspicuous alga in the San-Coral Zone (N = 55 tosses)was Polysiphonia (18% cover) which covered coral rubble. Although17 species of algae were recorded from this zone, the majority ofthe species were rare in this zone.The Lagoon Slope (N = 56 tosses) consisted primarily of coralrubble on which algal turf predominated. Polysiphonia spp. andMicrocoleus lyngbyaceus covered 21% and 4%, respectively, of therubble. In addition, the prostrate brown alga Lobophora variegata(2% cover) was evident.Among the live corals on a reef-flat platform across the studysite, six species of algae were observed - Caulerpa brachypus, ~.racemosa, C. verticillata, Halimeda macrophysa, Gelidiopsis intricataand Polysiphonia tepida. All species were previously observed inthe study site.Corals - The study area consists of a lagoon fringing reefsituated along the eastern side of Yap Island. The reef can bestructurally divided into a shallow reef-flat platform with relativelylittle surface relief and a lagoon slope which dips steeply downwardto the somewhat flattened lagoon floor of Tomil Channel. Based uponphysiographic origin and structure, substrate composition, andpresence of dominant floral and faunal elements the reef was dividedinto four zones as shown in Figure 1.The innermost part of the reef-flat platform consists of a sealevel erosional platform cut into metamorphic schistose rock. Theinner part is rather barren rock with a few scattered boulders hereand there and the outer part is thinly veneered by rubble and boulders.For the most part the zone is exposed during low tide and lacks coralgrowth.The central part of the reef-flat platform consists of a sandyflooredregion dominated principally by sea grasses, called theEnhalus-Thalassia zone. Corals are widely scattered and of smallsize in this zone with the total number of species observed on anytransect ranging from 3 to 4 (Table 2). The principal speciesencountered was Porites australiensis.
Table 2. list of cora Is observed a lonq tne transects of the study area. SyMbols indi cate thei r relativeabundance within the various reef zones: :l ~ uominant, A ~ abundant, C • COII,"on , 0 ~ occasional,R " rare. [I " Enhalus-~ Zone, II • Sand and Coral Zone, III ,. La'loon Sl ope.]11,SUBORDER1Transect Transect Transect Transec tNo.1 No.2 r~o.J :10.4 rjorth Side of Channc:>1nrm nrm nrm nrm Reef rlat lagoon ~lopeCLASS - ArlTllQZOAORDER - SClERACTHHA- ASTROCOE'/I !rIAFAMILY - ASTROCOErHlDA[~tylocoen1ella ~ (Ehrenberg)FAMILY - THAl-1rIASTERIIDAf."PsaJllllOcora WJM~Ja (Esper)Rr~4tLY - potl UA[pocill0oi0ra damicornis (Linnaeus)R 0 0FA.'>1llY - CROPOR!bAEAcronora exi!)ua (Dana)R:croporil. formosa (Dana)C!..Q.E:2..!:! !,.eres Vern 1 I"Astreopora rnyriophthal'"!d (lamarc k) R 0 0~r.a berry 1 Hofflllf!fster 0 0 0 0 0 0IiontjPo.!.a divaricata IIrueQgernannR "~nt Dora sp. cf. M. ~hrenbe.!.9..iJVerrill C 0 C 0 C 0 C 0 C JIiontioora lobuldta Bernanl R 0 0 0 0 0 0 0HOntlpora rnl1 feoora Cross land~J:ontlpor.a tubercul~sa (lamarck) 0 ,Mon_tlpora ~.u~t'~ Bernard 0 0140nl1pora verrucosa (lamarck )RHo_~ sp:-TTPani I late ) R R 0 0 0 0 0 0 R 0~!'tlpora sp. 2 (Pa'llllate ) ,0 R~n~ipo...!:! sp. 3 (Fo~eo1ate ) 0 0 0 0 0SUBDRDE - FUNGII'IAFAMILY - AGARICIIuAEP_a~~d (Pol~astra) ~_enOS_iI (EhrenberQ ) RLt'p~oserls scabrd Vaughan 0 0 0 0~ac!!Y2..~i 5 52!.C lOsa (Dana) R 0Pa.t:!tl.s.erJ.! ~o.sa rLamarck)FA/IILV - FII',r;flIJAff.~ (Heliofurlgia) actinif'p."'li~0 0 ROuoy arid Gdi rlJ r dfuna;;' (DmnJJl\ "~$ (liMite'lIS\FU!lgia t~.e.r)_a_ct.i.~) ~~.h.inata RFNIILV - PORITIDAEGo.~o.r_a. sp. 1 (Rar>lOse )0COnlOpora IOb.J.t! l~i Ine-Edward sand Ita IPJePori tes andrt'ws i Vauqhan ,0 R 0 R \forites aillralit'nsis 0 U U 0 U 0 U D 0 , ,U"POri tes loba·ta j}ana R 0 ,0Po·r·itt'J lutea r~ilne-Edwardsand Haime R RPp!i tes I!IJrraY("SiS. VauQlian R , RPorites sp. 1 maSSlVe ) R \l R 0 0 0 0Porites sp. 2 (r:lIlssive )RPomt's (~aea) iWi!j'dnat'ns is D C~I ... eopoFA al i~i. Hoffl'Jel s te? 0 ,0SUBORD(R - V~FAMILY - fAVIIDA[fa~ia dolnae Verri 11 R ,FiVTa iilatl"haii Vaughan R 0 R 0~av:ra specToS:-a (Dana) 0 0 R 0 0 0Favitt's dcuticol1is (Ortman)Fav i tes me 1 i cerllmTEhrenberfj) R R'(ai/ffes sp:-T R ,RPlatygyra Jamell.i.n.d (EhrenlJerq) R 0~ daedalea (Ellis and SOlander) 011) oastrea hel1opora (lamarck) RLt'rtastrea nrKAEea IOana)RFflltI Y - OCUL ,Galaxt'a fasciclllaris (Linnaeus)0FAM{lY - ~luss!OAELobophyllia costata (Dana)FAMILY - PECTIiITTD7\[Pt'ctinia lactuca (Pallas)CLASS - ~---ORDER - MillEPOR1NAFAmLY - Mlll£PORIDA[Hillepora ~ Forskaal 0R 0TOTAL SPECIES PER REEF ZO~IE 13 3 14 5 4 23 15 3 14 IIlJTOTAL GENERA PER REEF ZONE 6 3 6• , "3 7 2 4 3 II \7TOTAL SPECIES PER TWISECT 1628 23"..TOTAL GENERA PER TRANSECT 7 8 II 10 22TOTAL SPEC 1 ES FOR STUDY AREA VRA:iSECTS 1-4 ) _ 41TOTAL GENERA fOR STUDY AREA ( RAt/SECTS 1-4) _ 11,0
•12The outermost part of the reef-flat platform called the Sandand Coral zone consists of a region dominated by sand-sized sedimentsand scattered to locally abundant, massive, hemispherical shapedPorites colonies. Some of these colonies attain a diameter of ameter or more and up to 80 cm in height. Although coral density,coverage, and species diversity is greater in this zone than for anyother, there is no apparent structural reef development taking place,except for possibly a minor amount at Transect 3 where the outeredge of the reef-flat platform forms a slightly raised topographiclip (Fig. 2). Even though the wide range of coverage measured onthe transects (1.10-6.7~ %, Table 3) reveals the patchy and unevendistribution of corals along the zone there is a general increase incoral density, coverage, and diversity from the inner to outer part.The lagoon slope was not quantitatively analyzed because of thefew corals observed there. In general corals are more abundant alongthe upper slopes where more light and less sedimentation occurs thanalong the lower part, although locally where the slope flattens outto the lagoon floor local aggregations of deeper water species suchas Leptoseris scabra, Alveopora allingi, and Goniopora sp. 1 arefound. It appears that the lagoon slope has been altered by previousdredging and the surface consists of rather unstable rubble and sand.Coral planulae may settle on the larger pieces of more stable rubble,but as they increase in size, these colonies would tend to slumpquite easily downslope to more unfavorable growing conditions.Observations on the upper lagoon slope revealed that except for smallsized colonies most corals were aggregated where uncommon exposuresof more stable large blocks and boulders were exposed.A total of 17 genera and 41 sp"cies of reef-huilding cnralswpre found within the study region enclosed by the area betweenTransects 1 and 4 (Fig. 1). Compared to the rich fauna (over 100species) observed along the reef-flat platforms near the outer partof Tomil Harbor Channel the coral fauna at this study site is ratherdepauperate. An earlier study, conducted near the present study sitea few kilometer to the southeast at Donitsch Island, revealed a somewhatintermed1ate coral tauna composed of 31 genera and 81 species(Amesbury et al., 1976). This attenuation of coral species alongthe length of Tomil Channel is for the most part caused by a generaldeterioration of the more optimum conditions for coral growth foundnear the mouth of the channel toward its head near the study area.Because of the close proximity of land and surface drainage at thestudy area, the water is conSiderably more turbid and the accumulationof silt on the reef ~urface greater than at rpef areas loca~edfart"her se~ward. PreViOl)S distllrbance at the stuny site by dredging,land filling, and construction has also influenced the coralcommunity to an undetermined degree. It is suspected that the pres~ntlagoon slupe is particular and parts of the reef-tlat platform aredepauperate (16-23 species, Table 2) because of previous dredging.
13Table 3 . Size distribution, frequency, density. and percentage of substratum covered by stony corals in various zones along Transects 1-4.Re 1 a t he va 1 ues of fr'@Quency. density. and percentage of subs tratum cover~ are also ?iven and an importance va I ue is c.l cu 1a tedtrOll the sum of these three relative values. The procedures for calculating the stat sties In the columns fT'Olll the data obtainedby the point-centered quarter sampling technique are explained In the Methods section. The standard syrrools are used for the numberof data (n), arithmetic mean (Y), standard deviation (5), and range (101)., Size Distributionof coloniesTransect No.!Oh. ;, emlTrans!!::t Zone DensIty Rel.per 100m2 '0 S cov!! r S cover IV••Corals , Y wTransect No. 1Boulder -Rubble ZoneNo corals encounteredl!!h.ll.l!.l-Thalassh ZonePorites aus tra 11 ens is 10 7.8 7.7 1-22 1.0 52.6 122 76.9 1.06 95 . 5 225 . 0Montioora sp. cf. ,!!. ehrenberg1i 1 .3 15.87.7 .02 1.8 25.3Hontioora dharicata 1 .3 15.87.7 1.8 25.3£w:.11n. s p . 1 (massive) 1 .3 15.87.7" .". 9 24.4Overall Oensity 1.58 corals per ~Overall Pert:ent of coverage 1. 11SSand and Coral ZonePorites australiensis 10 13.9 14.3 2-46 1.0 62.5 190 83.3 5.57 92.5 238.3Porites sp. 1 (massive) 1 .3 18.8 19 8.3 .29 '.8 31. 9Porites lobata 1 .3 18.8 19 8.3 .16 2.7 29.8----nYeranOens1ty 2.28 corals per ~Overall Percent of coverage 6.02STransect Ho. 2Boulder-Rubble Zone110 corals encounteredEnhalus-Thalassh Zone~ ~Yil(Alj!:!Uis 6.' 3.0 3-10 .3 42.9 27 83.3 .11 91.7 217 .9Leptutrra ~ .. 57.1 6 16.7 .01 8.3 8?.1Overall Density .33 corals per m2Overall Percent of coverage .12SSand and Cora 1 ZonePorites austral iensis 20 8.7 11.6 3- 55 .0 83.3 64 90.9 1. 02 86.'1 260.6Flontlporasp:(:f. !! ehrcnbergii 1 .1 S.3 J.15 12.7 25.6• .6Porites sn.l (massive) .1 8.3 3• .6 · 01 ., 13.SOverall Density .70 corals per';'Overa II Percent of coverage 1.181Transect No.3Boulder-Rubble ZoneNo corals encounteredEnhalus-Thalassia Zone----,sorites australiensis-----OVerall Density .31 COrals per ~Ove ra 11 Percent of coverage . lOS"6.0 3.1 3-10 .5 100.0 31 100.0 .10 100.0 300 .0Sand and Coral ZonePorites australiensis 28 10.1 7.1 2-33 1.0 62.5 165 80.0 2.06 12.2 214 .7I1Onti~ora sp. d. lil.enrenbe!JIii 1 .1 6.3 6 2. , .54 HL9 28.1Favia mauhai 2 7.5 0.7 7-8 .2 12.55.7 .05 1.3 20.0'P'ii'rTfe~ (massive) 1 .1 6.3 6 " 2. , .17 6.0 15.2~and r ew5i 2 5.0 0.0 5-5 .1 6.3 12 5.7 .02 .7 12.7-Uvera ll Density 2.07 corals per m2Overall Percent of coverage 2.851tTransect No.480ul der-Rubble ZoneNo corals encountered.EnhJ..l..u..i- T!W.lliii. Zone~ jlJ.litU]le;lIiii 33 8.' 5.2 1-22 .8 72.7 65 91.6 .47 87.0 251.3Mrmtjoon .llI.bu.1..i1.l 1 .1 9.1 2 2.8 .05 9.3 21.2flld..W. andr~ si 1 .1 9.1 2 2.8 < .01
14To get some kind of idea what the study site was possibly like beforebeing disturbed a qualitative snorkeling observation was conductedon the opposite lagoon slope and reef-flat platform directly acrossthe channel (Fig. 3) which revealed a coral fauna composed of 44species. If scuba observations were made on deeper parts of thela~oon slope the difference in species composition would probablybe even greater.Macro-invertebrates - The prevalent macro-invertebrates on thereef flat wpre 1aree dpposit-fepding hnlothurians. Although severalspecies of holothurians could be found in each zone (Table 4), eachzone was characterized by different species which were particularlycommon and representative of that zone. The Enhalus-Thalassia Zonewas characterized by clumps of Actinophyga echinites. The Coral andSand Zone was generally characterized by Holothuria eduli~, although~. flavomaculat~ was very common at the seaward edge of the Reef Marginwhich we have included in the Coral and Sand Zone (Table 4). Holothuria!lavomaculata characterized the Reef Slope.Holothuria ~. ~. leucospilota and Stichopus chloronotus werewidespread across the reef flat, but were never common. Holothuriaatra was found out on open sandy areas. Holothuria leucospilota wasunder coral heads and would extend the anterior part of its body outfrom under the coral heads, especially when dusk approached in thelate afternoon. Stichopus chloronotus was found both on sand andcrawling up on head coral formations.Four species in the genus Holothuria were present and showed adistinct pattern of zonation (Table 5). Holothuria atra was mostfrequent at the shoreward edge of the Enhalus-Thalassia Zone.Holothuria edulis was most common at the seaward edge of the EnhalusThalassia Zone and in the Coral and Sand Zone . Holothuria leucospilotawas most common under coral heads on the inner Reef Margin while H.flavomaculata was common under coral heads on the outer Reef Narginand on down the Reef Slope.It is interesting to note that there was no significant differencebetween zones in terms of total abundance of holothurians taken as agroup. Throught the subtidal area of the study site, the mean andstandard error of the mean number of holothurians per 10 m 2 quadrat(n = 72) was 4.6 ± 1.0, or about one holothurian every 2 m2 . Despitethe relative uniformity in abundances, there were six species presentin the Enhalus-Thalassia Zone and seven species present in the Coraland Sand Zone but only two on the Reef Slope (Table 4). Ninety-fivepercent of the holothurians on the Reef Slope were of the one species,H. flavomaculata.Synaptid holothurians were also present in the study area, butthey are generally nocturnal and so they were not sampled.
• .. •Table 4. The frequency and abundance of large echinoderms along the transects on the subtidal reef flat andreef slope at the study site. No large echinoderms were observed in the intertidal Boulder andRubble Zone although twenty-two 10 m2 vJere examined along the transects in the intertidal zone.In columns under the heading "F" are frequencies of occurrence, the number of 10 m2 quadrats inwhich the species occurred as a ratio to the number of quadrats examined. Under "No./10 m2" arethe means and standard deviations of the counts in the quadrats . If a species did not occur in asampled quadrat but was observed to occur in the zone, its presence is indicated by "+."Enhalus-Thalassia Zone Coral and Sand Zone Reef Slo~eF (No./10 m2) F (No./10 m2) F (No./lO m2)Culcita novaeguineae MUller & Troschel + +Echinaster luzonicus (Gray) + +Protoreaster nodosus (Linnaeus) 12/32 0.6±1.2 7/24 0.4 ±0.7 +Fromia monilis PerrierActinopyqa echinites (Jaeger) 11/32 3.9 ±1O .3 6/24 0.5 ±1.2Holothuria atra Jaeger 6/32 0.3 ± 0.7 1/24 0.04±0.2Holothuria eauTis Lesson 10/32 O.S±1.6 16/24 1 .5 ±2. 1 2/16 0.2±0.8Holothurla leucospilot~ Brandt 1/32 0.03± 0.2 6/24 0.2 ±0.4Holothuria flavomaculata Semper 1/32 D.03± 0.2 5/24 1.6 ±4. 2 6/16 3.S±6.0Stichopus chloronotus Brandt 2/32 0.7 ± 3.5 9/24 0.5 ±O.SStichopus variegatus Semper 1/24 0.O4±0 .2In
14To get some kind of idea what the study site was possibly like beforebeing disturbed a qualitative snorkeling observation was conductedon the opposite lagoon slope and reef-flat platform directly acrossthe channel (Fig. 3) which revealed a coral fauna composed of 44species. If scuba observations were made on deeper parts of thelagoon slope the difference in species composition would probablyhe even greater.Macro-invertebrates - The prevalent macro-invertebrates on thereef flat wpre 1aree dpposit-fepding hnlothurians. Although severalspecies of holothurians could be found in each zone (Table 4), eachzone was characterized by different species which were particularlycommon and representative of that zone. The Enhalus-Thalassia Zonewas characterized by clumps of Actinophyga echinites. The Coral andSand Zone was generally characterized by Holothuria edulis, although~. flavomaculata was very common at the seaward edge~he Reef Marginwhich we have included in the Coral and Sand Zone (Table 4). Holothuriaflavomaeul a t~ characterized the Reef Slope.Holothuri~ atra. ~. leucospilota and Stichopus chloronotus werewidespread across the reef flat, but were never common. Holothuriaatra was found out on open sandy areas. Holothuria leucospilota wasunder coral heads and would extend the anterior part of its body outfrom under the coral heads, especially when dusk approached in thelate afternoon. Stichopus chloronotus was found both on sand andcrawling up on head coral formations.Four species in the genus Holothuria were present and showed adistinct pattern of zonation (Table 5). Holothuria atra was mostfrequent at the shoreward edge of the Enhalus-Thalassia Zone.Holothuria edulis was most common at the seaward edge of the EnhalusThalassia Zone and in the Coral and Sand Zone. Holothuria leucospilotawas most common under coral heads on the inner Reef Margin while H.flavomaculata was common under coral heads on the outer Ree f HargiIland ~n down the Reef Slope.It is interesting to note that there was no significant differencebetween zones in terms of total abundance of holothurians taken as agroup. Throught the subtidal area of the study site, the mean andstandard error of the mean number of holothurians per 10 m 2 quadrat(n = 72) was 4.6 ± 1.0, or about one holothurian every 2 m2 . Despitethe relative uniformity in abundances, there were six species presentin the Enhalus-Thalassia Zone and seven species present in the Coraland Sand Zone but only two on the Reef Slope (Table 4). Ninety-fivepercent of the holothurians on the Reef Slope were of the one species,H. flavomaculata.Synaptid holothurians were also present in the study area, butthey are generally nocturnal and so they were not sampled.
• .. •-.Table 4. The frequency and abundance of large echinoderms along the transects on the subtidal reef flat andreef slope at the study site. No large echinoderms were observed in the intertidal Boulder andRubble Zone although twenty-two 10 m2 were examined along the transects in the intertidal zone.In columns under the heading "F" are frequencies of occurrence, the number of 10 m2 quadrats inwhich the species occurred as a ratio to the number of quadrats examined. Under "No. / 10 m 2 " arethe means and standard deviations of the counts in the quadrats. If a species did not occur in asampled quadrat but was observed to occur in the lone, its presence is indicated by "+."Enhalus-Thalassia Zone Coral and Sand Zone Reef Slo~eF (No./10 m2) F (No./10 m2) F (No./lO m2)Culcita novaeguineae MUller & Troschel + +Echinaster luzonicus (Gray ) + +Protoreaster nodosus (Linnaeus) 12/32 0.6± 1. 2 7/24 0. 4 ±O . 7 +Fromia monilis PerrierActinopyqa echinites (Jaeger) 11 /32 3.9 ±10. 3 6/ 24 0.5 ±1. 2Holothuria atra Jaeger 6/3 2 0. 3 ± 0.7 1/24 0. 04±0 . 2Holothuria eauTis Lesson 10/32 O. 8± 1. 6 16/24 1 . 5 ±2 . 1 2/ 16 0. 2±0 .8Rolothurla leucos~ilota Brandt 1/32 0.03± 0. 2 6/24 0. 2 ±0.4Holothuria flavomaculata Semper 1/32 D.03± 0. 2 5/24 1. 6 ±il . 2 6/ 16 3.3±6 . 0Sticho~us chloronotus Brandt 2/32 0.7 ± 3. 5 9/24 0. 5 ±O.SStichopus variegatus Semper 1/24 0. O4±O . 2'"
16Table 5 . Number of echinodenns per 10 m 2 at 10 [l'I intervals along four transect lines . Two 10 m2 quadratswere taken at each 10 m interval . The data for only the seven most prevalent echinoderm speciesare included in this table. Data for less prevalent species are given in the text. The extentof each zone along each transect is indicated by the underline: . ... '" Intertidal Boulder RubbleZone, '" Enhalus-Thalassia Zone. and ______ '" Coral and Sand Zone.Protoreaster nodosus Transect ........... ~. ,,-5_10 m Intervals from High Tide level on ShoreI 10 I 20 30 40 I 50 60 I 70 I 80 I 90 1100 I JJ 0 1120Transect 2 ..............____ .!..;1.~ O____=2~.Transect 35 ___ ,~ __ LQ ___ ,~ __.5 .5 3.0 1.5 _______ !,Q________ _Transect 4 ................____ ~. 5~:...::5 __--'1:...0'--_____________ _Actinopyga echinites Transect ........... 1 5 2 L!,Q_Transect 2Transect 3Transect 4· ........... ... ... __ 4::."5",2",2-,,. 5",2,,3:.._ 0,--____________________ _Holothuria atra Transect ..........._-_____ 1:.;.::.5 __Transect 2Transect 3Transect 4.5 . 5 3.5 4.5 .5.. . . .••....... -----------------.. . ... . ...... . .. . . __........... _-Transect . 5 .5Tr~nsect 2Transect 3Transect d1"'.~5_'1c.:. 0,,--". .=.5 ____________________ _-c. 5'--__________ ,~ ________ _.............. _____ ~. 5 ________________ _· ..... . ...........____--'.. 5,-- 1.5 .5 . 5 1.5· ..... .. ... ..... _--.:1:..' O~.:.c1.::.5~ ___ _.::4.:.:. 0,--5:::.::.0_?, 2 __ ~:2 ___ _Ho lothuria leucos pilotaHolothuria flavomaculataTransect.. ....... ..5Transect 2 ... ....... .. -----------------------Transect 3 .. ......... .. .. .5 1.0 . 5-----------------------------Transect 4 .. .. ....... . .....5 . 5Transect.. ...... ..13 . 0Transect 2 .. ... ...... ..Transect 3 .... .... .... .. .. _____ '-'. 5~ ______________ ____ ~: 5Transect 4 .... , ....... .. , -----------------!,?----St;chopus chloronotu5 Transect 2.0Transect 2 ..............--------------------------Transect 3.. . .............. ._____.:.:.5'--.c.;:.5 _____________,?___, 5· .............. .____...:.::.5________ _:? __!:2___ _Transect 4
17Protoreaster nodosus was the only common asteroid in the area witha mean and standard error of the mean abundance of 0.5 ± 0.1 per10 m 2 quadrat, or about one Protoreaster every 20 m 2 . The densityof Prntoreaster was not significantly different between the EnhalusThalassia Zone and the Coral and Sand Zone. Large ophiuroids in thegenus Ophiothrix were present, and were seen extending their arms outof crevices in coral heads and also out of beer cans. Only twoOphiothrix were observed in quadrats but this is proDably a greatunderestimation because Ophiothrix generally feeds nacturnally andis very reclusive during the day.Soft corals of the Order Alcyonacea were remarkably scarce. Onlyone patch of 30 rather small colonies of Sinularia were observed onthe Reef Margin. Transect 4 intersected the patch and seven colonieswere contained within the transect.A particularly toxic anemone (Actinodendron sp.) was encounteredin the Enhalus-Thalassia Zone along Transect 2.The scyphozoan medusae, Cassiopea, were rarer than usuallyexpected. Only two Cassiopea were found in thirty-two 10 m2 quadratstaken in the Enhalus-Thalassia Zone.Although large gastropods were conspicuous, the data from oursampling indicate that they were not as common as we might haveguessed. In the fifty-six 10 m2 quadrats in the Enhalus-ThalassiaZone and the Coral and Sand Zone combined, only three Cypraea tigris,two Lambis lambis, one large Conus sp . and one large Vasum sp . wereencountered.Our study found no particularly outstanding aspect of this areain terms of populations of the macro-invertebrates.•Fishes - Although fish abundance is rather low at the study site(Fig. 5), the number of species observed was surprisingly high (54species, Table 6). This diversity is quite comparable to the similarreef flat area off Donitsch Island, where 63 fish species wereobserved (Amesbury et al., 1976). Although considerably fewer fishspecies were observed at channel marker B on the north side of thechannel (26 species) and at the reef-flat platform area (39 species),the time spent surveying these areas was quite short (approximately30 minutes at each site), and many more species would undoubtedly berecorded if more thorough surveys were made in these area .At the principal study area, the fish fauna was clearly mostabundant and diverse in the Sand and Coral Zone (Fig. 5) . There wasalso a relatively rich fish fauna in the Enhalus-Thalassia Zone onTransect 4, which seems to be related to the presence of a depressionin the reef flat in this area (Fig. 2) . Fewer sea grasses and some-
18TRANSECT 1NumberofSpecies"lumberofSpeciesNumberofSoecies~umberofSpecies1 Number ofIndividua~s0per 20 m0 '0 10 -& ,'5"I"-- -- ---- ----- ,-- - ,, , TRANSECT 2Number of~ Ind;vidua~sper 20 ml.,0,II ,, , ,0 ,0 'lO ' "10 ~o ro 100 10'0 "10 '00 110, , , ,, , ",, ,1 , ,1,."..,BOULDER ENHALUS- SA ND ANDLAGOONRUBBLE THALASSIA CORAL ZONE SLOPE TRANSECT 3£. ZONE ZONE 'l.S,It'"'0 Number of" " Ind;vidua~s"3 per 20 m2-0 '0 >0 W '10 '-0 10'""'0 ~ 100 I\~ I:IS"• !.. • ,/' , , ,- --// Ito I ,1:1..II TRANSECT 4'5" ,I{ I Number of3 Individuals:l.ner 20 m200 \0 10DISTANCE ALONG TRANSECT (M)Figure 5. Number of fish species and abundance of fishes in each IO-meter transect interval. EachIO-meter interval contains two bars: the one on the left (down-left hatching) indicatesnumber of species; the one on the right (unshaded or black) indicates abundance. Blackbar indicates abunda n ~e of the dominant pomacentrid Dischistodus perspicillatus. Zoneboundaries (dashed lines) are approximate.
Table 6. Checklist of fishes observed at Yap dock site, March 4-7, 1977. First four columns indicate fishesobserved alon9 transects within the four zones. Fifth column includes all species seen in studyarea. Fishes observed on north side of channel and at an area on the reef flat platfonn are indicatedin columns six and seven.BoulderRubb 1 eZoneEnhalus'TfiaTa"S'S i aZoneSand andCora 1 ZonelaqoonSlopeEntireStudyAreaNorthSide ofChanne 1ReefFla tPl atform19AcanthuridaeAcanthurus nigrofuscus ForskalA. nigroris Cuvier and ValenciennesA. tri os tegus (l i nnaeus)~. xanthopterus Cuvier and ValenciennesCtenochaetus striatus (Quoy and Gaimard)Naso sp. (juvenile)~asoma sco~a~ (Cuvier)Z. vellferum B och)++++++++++++++ApogonidaeAnogon leptacanthus BleekerA. orbicularis Cuvier and Valenciennes~. trlmaculatus Cuvier~rchamla zosterophora (Bleeker)Chellodlpterus qUlnguelineatu~ CuvierBalistidaeJlaJ istapus yndulatus (Mungo Park)Bal istoides flavimarginatus (Ruppell)Rhinecanthus aculeatus (linnaeus)R. yerrucosus (l i nnaeus)Sufflamen chrysoptera (Bloch andSchnei der)/++++++Blenniidaeiennes)+++Canthi gas teridaeCanthiqaster valentini (Bleeker)+ChaetodontidaeCentropxse bicolor (Bloch)C. flavlssimus (Cuvler)C. ti~icen Cuvier(Bleeker)~~~~~~~~Forska 1and Schneider++++++++++ +++ ++ +++++nnaeus++++++++GobiidaeArrtllygobius albimaculatus (Ruppel 1 )goby sp. Aqoby sp. Bgoby sp. Cother unidentified qobies++++++++++++++EleotridaePtereleotris sp.++•labridaeChei li"nus sp.Choerodon anchorago (Bloch)Hahchoeres margaritaceous (Cuvier &Valenciennes)H. trimaculatus (Quoy and Gaimard)Hemigymnus melapterus (Bloch)labroides dlmldiatus (Cuvier & Valenciennes)Macropharynqodon meleagris (Cuvier &Valenciennes)!'1. pardalis (Kner)Pseudocheilinus hexataenia (Bleeker)Stethojulls bandanensls (Bleeker)Thalassoma hardwlckl (Bennett)juvenile labrids+++++++++++++++++++++
-20Table 6.Continued.Boulder Enhalus- Entire North ReefRubble Tha1assia Sa nd and Lagoon Study Side of FlatZone Zone Coral Zone Slope Area Channel PlatfonnLutjanidaeCaes;o pulcherimmus Smith + +lut~anus fulviflamma (Forskal) + + +l. asmira (Forskal) +I. vaig;ans;s (Quay and Ga;mard) +Scolopsis bilineatus (Bloch) +S. cancel1atus (Cuyier and Valenciennes) + + + +~. xenochrous Gunther +MullidaeMullo;dichth~sauriflamma (Forskal)I~ . samoensis (Gunther) + +Parupeneus barberinoides (Bleeker) +P. barberinus (Lacepede) +I. pleurostigma (Bennett) + +PomacentridaeAmbl~gl~phidodon curacao (B loch) + +A. tematensis (Bleeker) + +Chrom;s atrifectoraliS Welander and Schultz +~. caerulea CuYier) + +c. lepidolepis Bleeker +~ . marqaritifer Fowler +Oascyllus aruanus (Linnaeus) + + +D. trimaculatus (Ruppell) +Oischistodu5 nota thalmus (Bleeker) +D. persp,ci'latus CUYler) + + + + +D. 2seudochrxsopoecilus (Allen andRobertson) +Eupomacentrus albifasc;atus (SCh leJel andMuller +E. ni Qr; cans (lacepede) +Gl~2hidodonto~s biocellatus (~uoy andGaimard) + + +~. C\I"n~u
21- what more corals were present in this depression than were typicalof the Enhalus-Thalassia Zone On the other transects (Fig. 4, Table 3).Beer Cans - After corals and sea grasses, the most conspicuousand predominant object in the Enhalus-Thalassia Zone and Sand andCoral Zone were the thousands of beer cans that served as substratafor algae and small corals and as shelters for ophiuroids and smallfishes. The beer cans were found mostly in the Enhalus-ThalassiaZone and the Sand and Coral Zone; relatively few were found in theintertidal Boulder Rubble Zone or on the Reef Slope. Our surveyfound there to be no significant difference between the populationdensities of beer cans in the Enhalus-Thalassia Zone and in the Sandand Coral Zone.One large patch of beer cans totally covered and area aboutfive by seven meters in diameter near Transect 2. The cans werepiled on top of each other so that there were about 300 cans persquare meter or at least 10,000 cans in this particular aggregation.This is probably an underestimate because many cans were buried inthe sand and no count was taken of these.From counts in fifty-five 10 m2 quadrats, we found the mean andstandard error of the mean number of beer cans per square meter tobe 4.1 ± 2.3. The Enhalus-Thalassia Zone and the Sand and Coral Zonetogether occupy about 19,000 mZ in the study area so the number ofbeer cans present is probably about 80,000. Since these beer canslay on sandy substrata, they add a considerable amount of substratafor algae and small corals and also add refuges for ophiuroids andfishes that would not be there otherwise.Water Circulation - The results of the single dye study cannotbe interpreted too broadly as many variables of tidal action, wind,and wave development will modify circulation patterns over time.The dye patch tended to move shoreward rather rapidly, curvingtoward the north-west. Within 4S minutes after placing the dye patchat channel marker A, it was approaching the northwest edge of the bay(Fig. 1), and would presumably have moved off the reef flat had itbeen tracked further. If this pattern is representative of theprevailing circulation in this area, suspended silt produced by theconstruction of the dock will probably be carried in this direction.
22CONCLUSIONS AND RECOMMENDATIONSClearly the nature of the project is such that all attached andslow moving marine life in the construction area will be destroyed,and resident fishes will be destroyed or driven away. Comparisonwith other areas in Tomil Harbor suggests that the proposed docksite is moderately rich in marine life, and the well-developed seagrassbeds indicate that the area is a reasonably productive one.The single dye study indicates that the direction of water flowis toward the north west. Sediments which are resuspended by thedredging operations can be expected to move in this direction. Assome 65,000 cubic yards of fill is to be dredged and deposited duringthe construction period, the amount of silt carried out of theconstruction area will probably be considerable. Should a significantsilt plume develop during the construction period, it may be advisableto monitor the movement of this plume to determine whether marinecommunities in adjacent areas are being inundated with sediments.LITERATURE CITEDAmesbury, S. S. , R. T. Tsuda, R. H. Randall, C. E. Birkeland, andF . A. Cushing. 1976. Limited current underwater biologicalsurvey of the Donitsch Island sewer outfall site, Yap,Western Caroline Islands, Univ. Guam Marine Lab . , Tech.Report 24, 48 p.Cottam, G., J. T. Curtin, and B. W. Hale. 1953 . Some samplingcharacteristics of a population of randomly despersedindividuals. Ecology 34:741-757.