Answers to Problem Set 3
Answers to Problem Set 3
Answers to Problem Set 3

You also want an ePaper? Increase the reach of your titles
YUMPU automatically turns print PDFs into web optimized ePapers that Google loves.
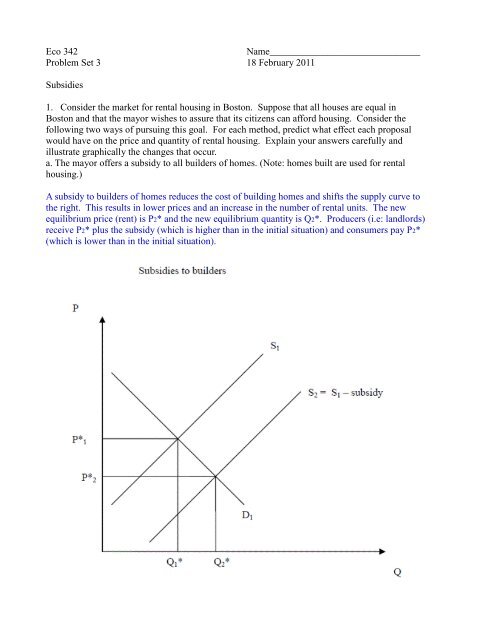
Eco 342Name_______________________________<strong>Problem</strong> <strong>Set</strong> 3 18 February 2011Subsidies1. Consider the market for rental housing in Bos<strong>to</strong>n. Suppose that all houses are equal inBos<strong>to</strong>n and that the mayor wishes <strong>to</strong> assure that its citizens can afford housing. Consider thefollowing two ways of pursuing this goal. For each method, predict what effect each proposalwould have on the price and quantity of rental housing. Explain your answers carefully andillustrate graphically the changes that occur.a. The mayor offers a subsidy <strong>to</strong> all builders of homes. (Note: homes built are used for rentalhousing.)A subsidy <strong>to</strong> builders of homes reduces the cost of building homes and shifts the supply curve <strong>to</strong>the right. This results in lower prices and an increase in the number of rental units. The newequilibrium price (rent) is P2* and the new equilibrium quantity is Q2*. Producers (i.e: landlords)receive P2* plus the subsidy (which is higher than in the initial situation) and consumers pay P2*(which is lower than in the initial situation).
. The mayor provides a subsidy directly <strong>to</strong> renters.The subsidy <strong>to</strong> renters shifts the demand curve for apartments <strong>to</strong> the right resulting in higher rentsand a greater number of apartments. The new equilibrium price (rent) is P2* and the newequilibrium quantity is Q2*. Producers (i.e: landlords) receive P2* (which is higher than in theinitial situation) and consumers pay P2* minus the subsidy (which is lower than in the initialsituation).gains and who loses from the implementation of policy (a) and (b)?c. WhoSubsides <strong>to</strong> builders or renters lead <strong>to</strong> an increase in the number of rental units available.Effective rents paid by consumers decrease and effective rents received by landlords increase.Note that if we did a general equilibrium analysis we should also have considered how thegovernment raised the money <strong>to</strong> finance the subsidies and who benefits and who gains from thegovernment’s financing decision.
2. Suppose that the government provides a per unit subsidy <strong>to</strong> producers of television sets.Show graphically and with the help of a welfare table how (i) consumer surplus, (ii) producersurplus, (iii) government surplus, (iv) social surplus, (v) deadweight loss (DWL), (vi) the priceconsumers pay, (vii) the price producers receive change.With a per unit subsidy on producers of television sets, the (effective) supply curve shifts <strong>to</strong> theright by the amount of the subsidy. With a subsidy of $S per unit, the new (effective) supplycurve is $S below the old supply curve, as shown below. Alternatively, you could use the“wedge” argument by starting at the equilibrium quantity (Q*) and moving <strong>to</strong> the right (theopposite of a tax) until the vertical distance between the supply and demand curves is exactlyequal <strong>to</strong> the amount of the subsidy.P* = Price consumers pay before subsidy = Price producers receive before subsidyPc = Price consumers pay after subsidyPp’ = Price producers receive after subsidyThe change in social surplus can be described as follows:Consumers are betteroff (their post-subsidyprice <strong>to</strong> pay has fallen<strong>to</strong> PC). Producers arealso better off (theirpost-subsidy price <strong>to</strong>receive has risen <strong>to</strong> PP’).But the government(i.e., taxpayers) mustpay an amount thatexceeds the combinedgains <strong>to</strong> producers andconsumers by D, thedeadweight loss.