population density of the endangered florida key deer - BioOne
population density of the endangered florida key deer - BioOne
population density of the endangered florida key deer - BioOne

You also want an ePaper? Increase the reach of your titles
YUMPU automatically turns print PDFs into web optimized ePapers that Google loves.
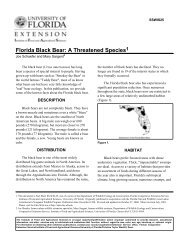
POPULATION DENSITY OF THE ENDANGERED FLORIDA KEY DEERROEL R. LOPEZ, 1 Department <strong>of</strong> Wildlife and Fisheries Sciences, Texas A&M University, College Station, TX 77843, USANOVA J. SILVY, Department <strong>of</strong> Wildlife and Fisheries Sciences, Texas A&M University, College Station, TX 77843, USABRIAN L. PIERCE, Department <strong>of</strong> Wildlife and Fisheries Sciences, Texas A&M University, College Station, TX 77843, USAPHILIP A. FRANK, U.S. Fish and Wildlife Service, National Key Deer Refuge, Big Pine Key, FL 33043, USAMATTHEW T. WILSON, Department <strong>of</strong> Wildlife and Fisheries Sciences, Texas A&M University, College Station, TX 77843, USAKYLE M. BURKE, Department <strong>of</strong> Wildlife and Fisheries Sciences, Texas A&M University, College Station, TX 77843, USAAbstract: With decreased illegal hunting and better habitat conservation, <strong>the</strong> Florida Key <strong>deer</strong> (Odocoileus virginianusclavium) <strong>population</strong> grew from an estimated 25–50 animals in <strong>the</strong> late 1940s to approximately 200 animals onBig Pine and No Name <strong>key</strong>s, Florida, USA, by 1971, <strong>the</strong> last <strong>of</strong>ficial survey. U.S. Fish and Wildlife Service (USFWS)trend data indicate that <strong>the</strong> <strong>deer</strong> <strong>population</strong> continued to increase after 1971; however, current <strong>deer</strong> <strong>density</strong> estimatesare necessary for <strong>the</strong> proposed reclassification <strong>of</strong> <strong>the</strong> Key <strong>deer</strong> from <strong>endangered</strong> to threatened. Our studyobjectives were to (1) obtain current <strong>population</strong> estimates <strong>of</strong> Florida Key <strong>deer</strong> and compare <strong>the</strong>se to historical estimates,(2) evaluate survey methods (USFWS mortality and <strong>deer</strong> counts) in detecting changes in <strong>population</strong> trends,and (3) outline a protocol for future monitoring. Road counts (n = 889) were conducted from January 1971 toDecember 1971 and January 1976 to December 2001 on Big Pine and No Name <strong>key</strong>s. From mark–recapture data,we estimated that <strong>the</strong> Key <strong>deer</strong> <strong>population</strong> on <strong>the</strong>se 2 islands increased by 240% between 1971 and 2001 (2001 estimate:453–517 <strong>deer</strong>). Trend data indicated that annual <strong>deer</strong> mortality was a function <strong>of</strong> <strong>deer</strong> <strong>density</strong> or <strong>population</strong>size (r s = 0.743). We compared <strong>the</strong> annual finite rate <strong>of</strong> increase (R) from USFWS annual <strong>deer</strong> counts and mortalitydata (R = 1.053–1.065) to mark–recapture studies (R = 1.038) and found <strong>the</strong>m to be similar (P = 0.66–0.67).This similarity suggests that all 3 methods (USFWS <strong>deer</strong> counts and mortality data, and mark–recapture data) canbe used to monitor changes in Key <strong>deer</strong> <strong>density</strong>.JOURNAL OF WILDLIFE MANAGEMENT 68(3):570–575Key words: downlisting, <strong>endangered</strong> status, Florida Key <strong>deer</strong>, Odocoileus virginianus clavium, <strong>population</strong> <strong>density</strong>,recovery.The <strong>endangered</strong> Florida Key <strong>deer</strong>, <strong>the</strong> smallestsubspecies <strong>of</strong> white-tailed <strong>deer</strong> in <strong>the</strong> UnitedStates, is endemic to <strong>the</strong> Florida Keys on <strong>the</strong>sou<strong>the</strong>rn end <strong>of</strong> peninsular Florida (Hardin et al.1984). Key <strong>deer</strong> occupy 20–25 islands within <strong>the</strong>boundaries <strong>of</strong> <strong>the</strong> National Key Deer Refuge(NKDR), with approximately 75% <strong>of</strong> <strong>the</strong> overallKey <strong>deer</strong> <strong>population</strong> on Big Pine and No Name<strong>key</strong>s (Lopez 2001). Intense hunting pressure andhabitat loss resulted in a decline in <strong>the</strong> Key <strong>deer</strong><strong>population</strong> to an estimated 25–50 animals by <strong>the</strong>late 1940s (Dickson 1955, USFWS 1999). With areduction in illegal hunting and <strong>the</strong> conservation<strong>of</strong> Key <strong>deer</strong> habitat through <strong>the</strong> establishment <strong>of</strong><strong>the</strong> NKDR in 1957, <strong>the</strong> Key <strong>deer</strong> <strong>population</strong> grewto an estimated 200 animals on Big Pine and NoName <strong>key</strong>s by 1971, <strong>the</strong> last <strong>of</strong>ficial survey (Silvy1975). In 1998, Texas A&M University (TAMU)and USFWS began studies to estimate <strong>the</strong> <strong>population</strong><strong>density</strong> <strong>of</strong> this federally protected subspecies.Trend data collected by USFWS biologistsindicated that <strong>the</strong> <strong>deer</strong> <strong>population</strong> had increased;however, current <strong>deer</strong> <strong>density</strong> estimates,necessary in <strong>the</strong> proposed reclassification <strong>of</strong> <strong>the</strong>1 E-mail: roel@tamu.edu570Key <strong>deer</strong> from <strong>endangered</strong> to threatened, arelacking (USFWS 1999).Key <strong>deer</strong> were marked as part <strong>of</strong> 2 separate fieldstudies (1968–1972, hereafter, historical study;and 1998–2001, hereafter, current study). In addition,USFWS biologists have collected <strong>deer</strong> mortalityand trend survey data since 1968. Collectively,we used <strong>the</strong>se data to (1) obtain current<strong>population</strong> estimates and compare <strong>the</strong>se to historicalestimates, (2) evaluate survey methods indetecting changes in <strong>population</strong> trends, and (3)outline a protocol for future monitoring.STUDY AREAThe Florida Keys are a chain <strong>of</strong> small islandsapproximately 200 km in length extending southwestfrom peninsular Florida, USA. Big Pine Key(2,548 ha) and No Name Key (461 ha) are within<strong>the</strong> boundaries <strong>of</strong> <strong>the</strong> NKDR and Monroe County,and <strong>the</strong>y support approximately 75% <strong>of</strong> <strong>the</strong>Key <strong>deer</strong> <strong>population</strong> (Lopez 2001). Soils varyfrom marl deposits to bare rock <strong>of</strong> <strong>the</strong> ooliticlimestone formation (Dickson 1955). Typically,island areas near sea level (maritime zones) arecomprised <strong>of</strong> red mangrove (Rhizophora mangle),black mangrove (Avicennia germinans), whitemangrove (Laguncularia racemosa), and button-
J. Wildl. Manage. 68(3):2004 DENSITY OF KEY DEER • Lopez et al. 571wood (Conocarpus erecta) forests. With increasingelevation, maritime zones transition into hardwood(e.g., gumbo limbo [Bursera simaruba],Jamaican dogwood [Piscidia piscipula]) andpineland (e.g., slash pine [Pinus elliottii], saw palmetto[Serenoa repens]) upland forests with vegetationintolerant <strong>of</strong> salt water (Dickson 1955, Folk1991). Approximately 24% <strong>of</strong> native areas havebeen developed in <strong>the</strong> last 50 years (Lopez 2001).METHODSTrapping and MarkingKey <strong>deer</strong> were captured as part <strong>of</strong> 2 separate researchprojects conducted December 1968–June1972 (Sou<strong>the</strong>rn Illinois University-Carbondale[SIU]; Silvy 1975) and January 1998–December2001 (TAMU; Lopez 2001) on Big Pine and NoName <strong>key</strong>s. Deer were captured with ei<strong>the</strong>rportable drive nets (Silvy et al. 1975), drop nets(Lopez et al. 1998), and/or by hand (Silvy 1975).Deer were physically restrained after capture withan average holding time <strong>of</strong> 10–15 min (no drugswere used). Sex, age, capture location, bodyweight, radio frequency (if applicable), and bodycondition were recorded for each <strong>deer</strong> prior torelease. In addition, each animal captured wastattooed in an ear (Silvy 1975).Deer were marked in a variety <strong>of</strong> ways dependingon sex and age (Silvy 1975, Lopez 2001). Weused plastic neck collars (8-cm wide) primarilyfor females <strong>of</strong> all age classes, lea<strong>the</strong>r antler collars(0.25-cm wide) for yearling and adult malesonly, and elastic expandable neck collars (3-cmwide) primarily for male fawns/yearlings. A battery-powered,mortality-sensitive radiotransmitter(
572 DENSITY OF KEY DEER • Lopez et al.J. Wildl. Manage. 68(3):2004prior to necropsy or necropsied immediately. Carcassquality or ability to determine cause <strong>of</strong> deathranged from good to marginal (Nettles 1981,Nettles et al. 2002). Age, sex, body weight, andcause <strong>of</strong> death were recorded for each animalusing procedures described by Nettles (1981).Data AnalysisWe estimated <strong>density</strong> for Big Pine and NoName <strong>key</strong>s from SIU and TAMU survey datausing Lincoln-Petersen (Seber’s modification)and Schnabel estimators (White et al. 1982, Krebs1999). These survey routes met <strong>the</strong> requirementsfor both estimators because each survey adequatelycovered what was considered a closed<strong>population</strong> (both areas are islands, with limiteddispersal between islands and small <strong>population</strong>growth), and a segment <strong>of</strong> <strong>the</strong> <strong>population</strong> wasradiomarked when surveys were conducted.We compared <strong>population</strong> estimates betweenislands and time <strong>of</strong> day (sunrise, sunset) usingrepeated-measures analysis <strong>of</strong> variance (ANOVA;Tzilkowski and Storm 1993, SPSS 2001, von Ende2001). Repeated-measures ANOVA accounts forlack <strong>of</strong> independence when repeated observationsare obtained from <strong>the</strong> same experimentalunits (Zar 1996). We log transformed <strong>density</strong> estimatesand selected random samples within yearsto obtain a balanced design. Critical assumptions,such as normality and circularity within <strong>the</strong> variance–covariancematrix, were assessed prior tohypo<strong>the</strong>sis testing. We tested for equality <strong>of</strong> errorvariances using Levene’s test, and we examinedtrends among years (within-subject factor) usingpolynomial transformations (orthagonal contrast;von Ende 2001). Following Lomax (2001),we reported conservative Greenhouse-Geisserprobabilities along with <strong>the</strong> standard F-statistic(Greenhouse and Geisser 1959). Last, we calculatedan overall Schnabel estimate (Krebs 1999)between islands and study (historical, current),and we compared <strong>the</strong>se estimates to averagedLincoln-Petersen estimates.To evaluate Key <strong>deer</strong> <strong>population</strong> trends fromUSFWS survey and mortality data (1976–2000),we compared <strong>the</strong> average number <strong>of</strong> <strong>deer</strong> seenannually to annual <strong>deer</strong> mortality using a Spearman’srank correlation coefficient (Ott 1993). Wecalculated <strong>the</strong> annual finite rate <strong>of</strong> increase (R;Caughley 1977) for successive years for USFWSsurvey and mortality data, and we compared <strong>the</strong>average <strong>of</strong> <strong>the</strong>se estimates to estimates <strong>of</strong> R fromSIU and TAMU survey data using a Student’st-test (Ott 1993, Minitab 1998).RESULTSTrapping and MarkingDuring December 1968–June 1972 and January1998–December 2001, we captured and marked434 Key <strong>deer</strong> (historical = 179, current = 255;fawn female = 41, yearling female = 43, adultfemale = 147, fawn male = 66, yearling male = 54,adult male = 83). The average number <strong>of</strong> markedanimals available on a weekly basis by island andstudy was 76 (range = 62–90) for Big Pine historical,48 (range = 34–64) for Big Pine current, and22 (range = 18–35) for No Name current.Approximately 67–75% <strong>of</strong> animals captured wereradiomarked during both studies (SIU =120/179, TAMU = 191/255).Density EstimatesWe conducted 889 roadside surveys (USFWS =266, SIU = 54, TAMU = 569; Table 1). From historicalweekly surveys (1971), we estimated 167 (95%CI: 149 to 185) and 34 (95% CI could not be calculated;Silvy 1975) Key <strong>deer</strong> on Big Pine and NoName <strong>key</strong>s, respectively (Table 1). From currentweekly surveys (1998–2001), we estimated 406(95% CI: 378 to 433) and 76 (95% CI: 72 to 80) Key<strong>deer</strong> on Big Pine and No Name <strong>key</strong>s, respectively(Table 1). Conversely, Schnabel estimates indicated170 (95% CI: 154 to 191) Key <strong>deer</strong> on Big PineKey from historical surveys, and 390 (95% CI: 371to 411) and 79 (95% CI: 75 to 84) Key <strong>deer</strong> on BigPine and No Name <strong>key</strong>s, respectively, from currentsurveys (Table 1). Schnabel and weekly Lincoln-Petersen <strong>population</strong> estimates were similar (P >0.05; Table 1). Density estimates indicated <strong>the</strong>Key <strong>deer</strong> <strong>population</strong> on <strong>the</strong>se 2 islands increasedby 240% (482/201) between 1971 and 2001.The repeated-measures ANOVA was conductedusing a balanced design that maximized <strong>the</strong>number <strong>of</strong> surveys within each island × year × surveyperiod combination. One data point (BPKsunset; estimate = 6.5 <strong>deer</strong>) was considered anoutlier and removed from consideration. Becauseno o<strong>the</strong>r data were available, <strong>the</strong> 1971 <strong>population</strong>estimate <strong>of</strong> 34 (Silvy 1975) was used for No NameKey and resulted in a loss <strong>of</strong> homogeneity for thatyear (Levene’s test; P = 0.004). All o<strong>the</strong>r yearsdemonstrated equality <strong>of</strong> error variances by Levene’stest (P >0.132 for all remaining years). Therepeated-measures ANOVA results indicated noyear × survey (P = 0.743), year × island (P =0.294), or year × survey × island (P = 0.304) interactions;<strong>the</strong>refore, <strong>population</strong> estimates amongyears were not influenced by ei<strong>the</strong>r time <strong>of</strong> survey
J. Wildl. Manage. 68(3):2004 DENSITY OF KEY DEER • Lopez et al. 573Table 1. Florida Key <strong>deer</strong> <strong>density</strong> estimates for Big Pine andNo Name <strong>key</strong>s, Florida, USA, 1971 and 1998–2001.Year Time n – x 95% CIPetersen estimatesBig Pine Key1971 sunrise 26 141 123 to 1581971 sunset 28 192 164 to 2191998 sunrise 36 447 364 to 5301998 sunset 36 366 322 to 4101999 sunrise 48 400 350 to 4491999 sunset 48 332 289 to 3762000 sunrise 32 498 415 to 5802000 sunset 33 408 331 to 4862001 sunrise 7 571 159 to 9832001 sunset 7 342 212 to 473historical sunrise 26 141 123 to 158sunset 28 192 164 to 219combined 54 167 149 to 185current sunrise 123 449 405 to 493sunset 124 363 332 to 393combined 247 406 378 to 433No Name Key1998 sunrise 36 105 94 to 1161998 sunset 36 81 73 to 891999 night 43 63 52 to 731999 sunrise 48 82 68 to 961999 sunset 48 74 60 to 882000 night 29 72 57 to 862000 sunrise 31 63 53 to 742000 sunset 34 69 59 to 782001 night 2 46 38 to 542001 sunrise 7 97 51 to 1432001 sunset 8 77 52 to 101historical a combined 34current sunrise 122 85 57 to 93sunset 126 75 68 to 81night 74 66 57 to 74combined 322 76 72 to 80Schnabel EstimatesBig Pine Keyhistorical combined 54 170 154 to 191current combined 247 390 371 to 411No Name Keyhistorical combined 34current combined 322 79 75 to 84a Raw data from historical surveys for No Name Key wereunavailable for analyses; however, Silvy (1975) reported anestimate <strong>of</strong> 34 <strong>deer</strong> from mark–recapture efforts for this islandin 1973, and we used this estimate in our comparison whenappropriate.or island. The main effect for year was significant(P
574 DENSITY OF KEY DEER • Lopez et al.J. Wildl. Manage. 68(3):2004The similarity in results between <strong>the</strong> mark–recaptureestimates (R = 1.038), USFWS road-survey data(R = 1.053), and mortality data (R = 1.065) suggestthat all 3 methods can be used to monitor changesin Key <strong>deer</strong> trends. In particular, <strong>the</strong> USFWS roadsurveyand mortality data are useful in monitoring<strong>population</strong> changes <strong>of</strong> this federally protected subspeciesbecause data are collected each year byUSFWS biologists. We recommend <strong>the</strong> continuation<strong>of</strong> both <strong>of</strong> <strong>the</strong>se 25-plus year data sources.Fig. 2. Average number <strong>of</strong> <strong>deer</strong> seen on U.S. Fish and WildlifeService monthly road counts and annual <strong>deer</strong> mortality on BigPine Key, Florida, USA, 1976–2000.illegal hunting as <strong>the</strong> primary reasons for <strong>the</strong>increase (Lopez 2001). For example, in <strong>the</strong> last30 years, NKDR and o<strong>the</strong>r natural resource agencieshave purchased and managed nearly 64% <strong>of</strong><strong>the</strong>se 2 islands for Key <strong>deer</strong> conservation (Lopez2001). Fur<strong>the</strong>rmore, documented Key <strong>deer</strong>poaching has decreased nearly 10-fold since <strong>the</strong>1970s (USFWS, unpublished data). We proposethat urban development also might be responsiblefor <strong>the</strong> increase in Key <strong>deer</strong> numbers. Forexample, since <strong>the</strong> establishment <strong>of</strong> NKDR in 1957,approximately 717 ha (24%) <strong>of</strong> native habitats onBig Pine and No Name <strong>key</strong>s were developed(Lopez 2001) in concert with <strong>the</strong> Key <strong>deer</strong> <strong>population</strong>increase. The results <strong>of</strong> early development(prior to mid-1980s) probably benefited Key <strong>deer</strong>by <strong>the</strong> conversion <strong>of</strong> tidal areas such as mangroveand buttonwood forests into “uplands” (Gallagher1991). Initially, <strong>the</strong> conversion and filling <strong>of</strong> <strong>the</strong>sehabitats provided Key <strong>deer</strong> with both native andornamental vegetation (Lopez 2001). For <strong>the</strong>sereasons, we propose that urban development in <strong>the</strong>form <strong>of</strong> land clearing increased <strong>the</strong> overall carryingcapacity for Key <strong>deer</strong> on <strong>the</strong>se 2 islands. Continueddevelopment in <strong>the</strong> form <strong>of</strong> houses and/orbusinesses, however, might not provide <strong>the</strong> samebenefits as increases in secondary impacts (i.e.,road mortality, habitat loss, fence entanglement)also would be expected (Lopez et al. 2003).Population TrendsIn comparing annual R estimates for <strong>the</strong> Key<strong>deer</strong> <strong>population</strong>, we found USFWS trend datawere similar to and validated SIU/TAMU estimates.Since 1971, we estimate that <strong>the</strong> Key <strong>deer</strong><strong>population</strong> has grown approximately 5% annually.MANAGEMENT IMPLICATIONSThe decision to consider downlisting <strong>the</strong> Key<strong>deer</strong> is based on current <strong>deer</strong> <strong>density</strong> estimatesand recovery criteria that state an R ≥1.0 for a 14-year period would warrant reclassification(USFWS 1999). As a result <strong>of</strong> our study, <strong>the</strong> reclassification<strong>of</strong> <strong>the</strong> Key <strong>deer</strong> from <strong>endangered</strong> tothreatened has been proposed and currently isbeing considered by USFWS (Jay Slack, EcologicalServices Field Supervisor, USFWS, personalcommunication). O<strong>the</strong>r recovery criteria thatshould be addressed in <strong>the</strong> next several years include<strong>the</strong> establishment <strong>of</strong> o<strong>the</strong>r local <strong>population</strong>s<strong>of</strong> Key <strong>deer</strong> on outer islands. Overall, effortsby USFWS, state agencies, and conservation organizationshave been instrumental in <strong>the</strong> first steptoward Key <strong>deer</strong> recovery.ACKNOWLEDGMENTSThanks to TAMU student interns who assistedin <strong>the</strong> collection <strong>of</strong> field data, and J. Morgart, C.Faulhaber, N. Wilkins, W. Grant, T. Peterson, and2 anonymous reviewers for constructive criticismin <strong>the</strong> preparation <strong>of</strong> this manuscript. Funding wasprovided by TAMU System, Rob and Bessie WelderWildlife Foundation, Florida Fish and WildlifeConservation Commission, and USFWS (SpecialUse Permit No. 97-14). Special thanks to <strong>the</strong> staff<strong>of</strong> <strong>the</strong> National Key Deer Refuge, Monroe County,Florida. This manuscript is supported by <strong>the</strong>Welder Wildlife Foundation, Contribution 611.LITERATURE CITEDCAUGHLEY, G. 1977. Analysis <strong>of</strong> vertebrate <strong>population</strong>s.John Wiley & Sons, New York, New York, USA.DICKSON, J. D., III. 1955. An ecological study <strong>of</strong> <strong>the</strong> Key<strong>deer</strong>. Florida Game and Fresh Water Fish Commission,Technical Bulletin 3, Tallahassee, Florida, USA.FOLK, M. L. 1991. Habitat <strong>of</strong> <strong>the</strong> Key <strong>deer</strong>. Dissertation,Sou<strong>the</strong>rn Illinois University, Carbondale, Illinois, USA.GALLAGHER, D. 1991. Impact <strong>of</strong> <strong>the</strong> built environmenton <strong>the</strong> natural environment. Pages 226–229 in J. Gato,editor. Monroe County environmental story. MonroeCounty Environmental Education Task Force, BigPine Key, Florida, USA.
J. Wildl. Manage. 68(3):2004 DENSITY OF KEY DEER • Lopez et al. 575GREENHOUSE, S. W., AND S. GEISSER. 1959. On methods in<strong>the</strong> analysis <strong>of</strong> pr<strong>of</strong>ile data. Psychometrika 24:95–112.HARDIN, J. W., W. D. KLIMSTRA, AND N. J. SILVY. 1984.Florida Keys. Pages 381–390 in L. K. Halls, editor.White-tailed <strong>deer</strong>: ecology and management. StackpoleBooks, Harrisburg, Pennsylvania, USA.HUMPHREY, S. R., AND B. BELL. 1986. The Key <strong>deer</strong> <strong>population</strong>is declining. Wildlife Society Bulletin 14:261–265.KREBS, C. J. 1999. Ecological methodology. Second edition.Addison-Welsey Publishers, Menlo Park, California,USA.LOMAX, R. G. 2001. Statistical concepts: a second coursefor education and <strong>the</strong> behavioral sciences. Secondedition. Lawrence Erlbaum Associates, Mahwah, NewJersey, USA.LOPEZ, R. R. 2001. Population ecology <strong>of</strong> Florida Key<strong>deer</strong>. Dissertation, Texas A&M University, College Station,Texas, USA.———, N. J. SILVY, J. D. SEBESTA, S. D. HIGGS, AND M.SALAZAR. 1998. A portable drop net for capturingurban <strong>deer</strong>. Proceedings <strong>of</strong> <strong>the</strong> Sou<strong>the</strong>astern Association<strong>of</strong> Fish and Wildlife Agencies 52:206–209.———, M. E. VIERA, N. J. SILVY, P. A. FRANK, S. W.WHISENANT, AND D. A. JONES. 2003. Survival, mortality,and life expectancy <strong>of</strong> Florida Key <strong>deer</strong>. Journal <strong>of</strong>Wildlife Management 67:34–45.MINITAB. 1998. Minitab user’s guide. Version 12. Four<strong>the</strong>dition. Minitab, Inc., State College, Pennsylvania,USA.NETTLES, V. F. 1981. Necropsy procedures. Pages 6–16 inW. R. Davidson, F. A. Hayes, V. F. Nettles, and F. E.Kellogg, editors. Diseases and parasites <strong>of</strong> white-tailed<strong>deer</strong>. Tall Timbers Research Station, Tallahassee,Florida, USA.———, C. F. QUIST, R. R. LOPEZ, T. J. WILMERS, P. FRANK,W. ROBERTS, S. CHITWOOD, AND W. R. DAVIDSON. 2002.Morbidity and mortality factors in Key <strong>deer</strong>, Odocoileusvirginianus clavium. Journal <strong>of</strong> Wildlife Diseases38:685–692.OTT, R. L. 1993. An introduction to statistical methodsand data analysis. Fourth edition. Duxbury Press, Belmont,California, USA.SILVY, N. J. 1975. Population <strong>density</strong>, movements, andhabitat utilization <strong>of</strong> Key <strong>deer</strong>, Odocoileus virginianusclavium. Dissertation, Sou<strong>the</strong>rn Illinois University,Carbondale, Illinois, USA.———, J. W. HARDIN, AND W. D. KLIMSTRA. 1975. Use <strong>of</strong>a portable net to capture free-ranging <strong>deer</strong>. WildlifeSociety Bulletin 3:27–29.SPSS. 2001. SPSS advanced models. Version 11. SPSS,Inc., Chicago, Illinois, USA.TZILKOWSKI, W. M., AND G. L. STORM. 1993. Detectingchange using repeated measures analysis: white-tailed<strong>deer</strong> abundance at Gettysburg National Military Park.Wildlife Society Bulletin 21:411–414.USFWS (U.S. FISH AND WILDLIFE SERVICE). 1999. SouthFlorida multi-species recovery plan: Key <strong>deer</strong> recoveryplan. U.S. Fish and Wildlife Service, Atlanta,Georgia, USA.VON ENDE, C. N. 2001. Repeated-measures analysis:growth and o<strong>the</strong>r time-dependent measures. Pages134–157 in S. M. Scheiner and J. Gurevitch, editors.Design and analysis <strong>of</strong> ecological experiments.Oxford University Press, New York, New York, USA.WHITE, G. C., D. R. ANDERSON, K. P. BURNHAM, AND D. L.OTIS. 1982. Capture-recapture and removal methodsfor sampling closed <strong>population</strong>s. Los Alamos NationalLaboratory, Los Alamos, New Mexico, USA.———, AND R. A. GARROTT. 1990. Analysis <strong>of</strong> wildliferadio-tracking data. Academic Press, San Diego, California,USA.ZAR, J. H. 1996. Biostatistical analysis. Third edition.Prentice Hall, Upper Saddle River, New Jersey, USA.Received 5 January 2003.Accepted 16 February 2004.Associate Editor: Morgart.