Monaural Voiced Speech Segregation Based on Pitch and Comb Filter
Monaural Voiced Speech Segregation Based on Pitch and Comb Filter
Monaural Voiced Speech Segregation Based on Pitch and Comb Filter
You also want an ePaper? Increase the reach of your titles
YUMPU automatically turns print PDFs into web optimized ePapers that Google loves.
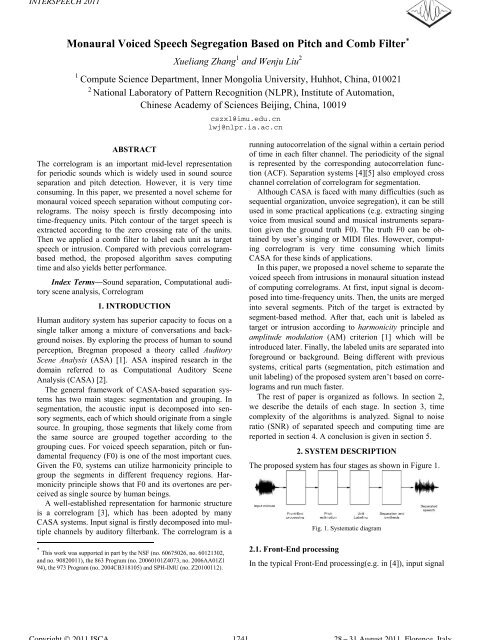
INTERSPEECH 2011<str<strong>on</strong>g>M<strong>on</strong>aural</str<strong>on</strong>g> <str<strong>on</strong>g>Voiced</str<strong>on</strong>g> <str<strong>on</strong>g>Speech</str<strong>on</strong>g> <str<strong>on</strong>g>Segregati<strong>on</strong></str<strong>on</strong>g> <str<strong>on</strong>g>Based</str<strong>on</strong>g> <strong>on</strong> <strong>Pitch</strong> <strong>and</strong> <strong>Comb</strong> <strong>Filter</strong> Xueliang Zhang 1 <strong>and</strong> Wenju Liu 21 Compute Science Department, Inner M<strong>on</strong>golia University, Huhhot, China, 0100212 Nati<strong>on</strong>al Laboratory of Pattern Recogniti<strong>on</strong> (NLPR), Institute of Automati<strong>on</strong>,Chinese Academy of Sciences Beijing, China, 10019cszxl@imu.edu.cnlwj@nlpr.ia.ac.cnABSTRACTThe correlogram is an important mid-level representati<strong>on</strong>for periodic sounds which is widely used in sound sourceseparati<strong>on</strong> <strong>and</strong> pitch detecti<strong>on</strong>. However, it is very timec<strong>on</strong>suming. In this paper, we presented a novel scheme form<strong>on</strong>aural voiced speech separati<strong>on</strong> without computing correlograms.The noisy speech is firstly decomposing intotime-frequency units. <strong>Pitch</strong> c<strong>on</strong>tour of the target speech isextracted according to the zero crossing rate of the units.Then we applied a comb filter to label each unit as targetspeech or intrusi<strong>on</strong>. Compared with previous correlogrambasedmethod, the proposed algorithm saves computingtime <strong>and</strong> also yields better performance.Index Terms—Sound separati<strong>on</strong>, Computati<strong>on</strong>al auditoryscene analysis, Correlogram1. INTRODUCTIONHuman auditory system has superior capacity to focus <strong>on</strong> asingle talker am<strong>on</strong>g a mixture of c<strong>on</strong>versati<strong>on</strong>s <strong>and</strong> backgroundnoises. By exploring the process of human to soundpercepti<strong>on</strong>, Bregman proposed a theory called AuditoryScene Analysis (ASA) [1]. ASA inspired research in thedomain referred to as Computati<strong>on</strong>al Auditory SceneAnalysis (CASA) [2].The general framework of CASA-based separati<strong>on</strong> systemshas two main stages: segmentati<strong>on</strong> <strong>and</strong> grouping. Insegmentati<strong>on</strong>, the acoustic input is decomposed into sensorysegments, each of which should originate from a singlesource. In grouping, those segments that likely come fromthe same source are grouped together according to thegrouping cues. For voiced speech separati<strong>on</strong>, pitch or fundamentalfrequency (F0) is <strong>on</strong>e of the most important cues.Given the F0, systems can utilize harm<strong>on</strong>icity principle togroup the segments in different frequency regi<strong>on</strong>s. Harm<strong>on</strong>icityprinciple shows that F0 <strong>and</strong> its overt<strong>on</strong>es are perceivedas single source by human beings.A well-established representati<strong>on</strong> for harm<strong>on</strong>ic structureis a correlogram [3], which has been adopted by manyCASA systems. Input signal is firstly decomposed into multiplechannels by auditory filterbank. The correlogram is a* This work was supported in part by the NSF (no. 60675026, no. 60121302,<strong>and</strong> no. 90820011), the 863 Program (no. 20060101Z4073, no. 2006AA01Z194), the 973 Program (no. 2004CB318105) <strong>and</strong> SPH-IMU (no. Z20100112).running autocorrelati<strong>on</strong> of the signal within a certain periodof time in each filter channel. The periodicity of the signalis represented by the corresp<strong>on</strong>ding autocorrelati<strong>on</strong> functi<strong>on</strong>(ACF). Separati<strong>on</strong> systems [4][5] also employed crosschannel correlati<strong>on</strong> of correlogram for segmentati<strong>on</strong>.Although CASA is faced with many difficulties (such assequential organizati<strong>on</strong>, unvoice segregati<strong>on</strong>), it can be stillused in some practical applicati<strong>on</strong>s (e.g. extracting singingvoice from musical sound <strong>and</strong> musical instruments separati<strong>on</strong>given the ground truth F0). The truth F0 can be obtainedby user’s singing or MIDI files. However, computingcorrelogram is very time c<strong>on</strong>suming which limitsCASA for these kinds of applicati<strong>on</strong>s.In this paper, we proposed a novel scheme to separate thevoiced speech from intrusi<strong>on</strong>s in m<strong>on</strong>aural situati<strong>on</strong> insteadof computing correlograms. At first, input signal is decomposedinto time-frequency units. Then, the units are mergedinto several segments. <strong>Pitch</strong> of the target is extracted bysegment-based method. After that, each unit is labeled astarget or intrusi<strong>on</strong> according to harm<strong>on</strong>icity principle <strong>and</strong>amplitude modulati<strong>on</strong> (AM) criteri<strong>on</strong> [1] which will beintroduced later. Finally, the labeled units are separated intoforeground or background. Being different with previoussystems, critical parts (segmentati<strong>on</strong>, pitch estimati<strong>on</strong> <strong>and</strong>unit labeling) of the proposed system aren’t based <strong>on</strong> correlograms<strong>and</strong> run much faster.The rest of paper is organized as follows. In secti<strong>on</strong> 2,we describe the details of each stage. In secti<strong>on</strong> 3, timecomplexity of the algorithms is analyzed. Signal to noiseratio (SNR) of separated speech <strong>and</strong> computing time arereported in secti<strong>on</strong> 4. A c<strong>on</strong>clusi<strong>on</strong> is given in secti<strong>on</strong> 5.2. SYSTEM DESCRIPTIONThe proposed system has four stages as shown in Figure 1.2.1. Fr<strong>on</strong>t-End processingFig. 1. Systematic diagramIn the typical Fr<strong>on</strong>t-End processing(e.g. in [4]), input signalCopyright © 2011 ISCA174128-31 August 2011, Florence, Italy
x(t) is decomposed by a gammat<strong>on</strong>e filterbank with 128channels whose center frequencies are quasi logarithmicallyspaced from 80 Hz to 5 kHz <strong>and</strong> b<strong>and</strong>widths equal to theequivalent rectangle b<strong>and</strong>width (ERB). Instead, the proposedsystem decomposes the signal by forward-backwardfiltering. The reas<strong>on</strong> will be given later. Specifically, x(t) isfirst passed through the gammat<strong>on</strong>e filterbank. The outputsare time reversed <strong>and</strong> re-filtered by the gammat<strong>on</strong>e filterbank.Then the filter outputs are time reversed again. Afterthat, phase delay of output is compensated in each channel.Because forward-backward filtering causes the actual b<strong>and</strong>widthnarrower than st<strong>and</strong>ard gammat<strong>on</strong>e filter, we enlargethe b<strong>and</strong>widths to 1.6 times of the ERB.AM of gammat<strong>on</strong>e filter output is extracted by b<strong>and</strong>-passfiltering the Hilbert envelope which is a c<strong>on</strong>venti<strong>on</strong>almethod [2]. C<strong>on</strong>sidering the plausible pitch range of speech,the b<strong>and</strong>pass is set from 50 Hz to 550 Hz. Gammat<strong>on</strong>e filteroutput <strong>and</strong> its AM at channel c are denoted as g(c,t) <strong>and</strong>e(c,t) respectively.The output of each channel is then divided into 20 mstime frames <strong>and</strong> 10 ms time shift. In the following part, u cmis to denote a time-frequency (T-F) unit for frequency channelc <strong>and</strong> time frame m. As in the Hu <strong>and</strong> Wang model [4],we employ different methods to segregate resolved <strong>and</strong>unresolved units. The resolved <strong>on</strong>e is defined as beingdominated by single harm<strong>on</strong>ic <strong>and</strong> unresolved <strong>on</strong>e is definedas being dominated by several harm<strong>on</strong>ics. In order todiscriminate the resolved <strong>and</strong> unresolved units, we introducea feature called carrier to envelope energy ratio (CER)which is calculated as (1). u cm is termed as resolved ifR eng (c,m)> R ; otherwise it is termed as unresolved. Motivati<strong>on</strong>is that when unit is dominated by several harm<strong>on</strong>ics,the AM is relative str<strong>on</strong>g <strong>and</strong> it leads to a small value forR eng .W2 gcmT (, n)n0Reng(, c m) log(1)W2ecmT (, n)n0where, T =160 <strong>and</strong> W=320 corresp<strong>on</strong>ding to 10 ms timeshift <strong>and</strong> 20 ms time frame; the frequency sampling rate is16 kHz.Segmentati<strong>on</strong> plays an important role in CASA system.Each segment c<strong>on</strong>sists of spatially (time <strong>and</strong> frequency)c<strong>on</strong>tinuous units which are generated according to crosschannelcorrelati<strong>on</strong>. In stead of computing it by correlogram(as in [4][5]), the cross channel correlati<strong>on</strong> is computeddirectly <strong>on</strong> gammat<strong>on</strong>e filter outputs by (2) <strong>and</strong> it isthe reas<strong>on</strong> that we use forward-backward filtering to compensatethe phase delay.W 1C ( , ) ˆ( , ) ˆRc m g c mT n g( c1, mT n)(2)n0where, (c,t) is zero-mean <strong>and</strong> unity-variance versi<strong>on</strong> offilter resp<strong>on</strong>se at channel c <strong>and</strong> window m.In additi<strong>on</strong>, we compute the zero crossing rate of gammat<strong>on</strong>efilter output with positive slope in each unit, termedas Z(c,m) for u cm . ZCR is used for pitch detecti<strong>on</strong> in thefollowing secti<strong>on</strong>.2.2. <strong>Pitch</strong> estimati<strong>on</strong>In this subsecti<strong>on</strong>, the c<strong>on</strong>tinuous pitch c<strong>on</strong>tour is extractedbased <strong>on</strong> segments <strong>and</strong> ZCR of units. We know that ZCRdoes not work well for complex waveform. Therefore, theunits used in pitch estimati<strong>on</strong> should be dominated by signalharm<strong>on</strong>ic. The resolved units tend to meet this requirement.To improve the accuracy, the resolved units are furtherselected by the segmentati<strong>on</strong>. Specifically, the units arefirstly selected as c<strong>and</strong>idates when CER exceeds a threshold R = 1.82 <strong>and</strong> cross channel correlati<strong>on</strong> is larger than0.98. Then the neighboring c<strong>and</strong>idates are merged intosegments. The segments shorter than 30 ms are removedsince which unlikely arise from target speech. The remainingunits in l<strong>on</strong>ger segments are used for pitch estimati<strong>on</strong>.We employ cosine functi<strong>on</strong> as substituti<strong>on</strong> for pitch detecti<strong>on</strong>whose frequency is set to the ZCR. In the selectedunits, cosine functi<strong>on</strong> has similar shape with autocorrelati<strong>on</strong>functi<strong>on</strong>. The rest of pitch detecti<strong>on</strong> is similar with the Hu<strong>and</strong> Wang model. The dominant pitch at each frame isshown by the maximum peak of summary cosine functi<strong>on</strong>s.Then, we use the l<strong>on</strong>gest segment <strong>and</strong> dominant pitch as acriteri<strong>on</strong> to segregate each segment into foreground <strong>and</strong>background (details can be found in [4]). Different from theprocess in [4], pitch estimati<strong>on</strong> is based <strong>on</strong> the l<strong>on</strong>gest segmentin foreground <strong>and</strong> its harm<strong>on</strong>ic order. Harm<strong>on</strong>ic ordershows that the segment is dominated by which harm<strong>on</strong>ic. Itis given by (3). n H arg max SCFm, , n u cmS l<strong>on</strong>g Z c m (3) where, S l<strong>on</strong>g st<strong>and</strong>s for the l<strong>on</strong>gest segment in foreground;Z(c,m) is the zero crossing rate at unit u cm ; SCF(m,) issummary cosine functi<strong>on</strong> of units in foreground at frame m.The pitch period at frame m is determined by (4)Pm ( ) argmax SCF' m,(4)where, [2 ms,12.5 ms] corresp<strong>on</strong>ding to the range [80Hz, 500 Hz]; SCF(m,) is summary cosine functi<strong>on</strong>s withthe range [H-/2, H+/2] of units in l<strong>on</strong>gest segments.2.3. Unit labelingWe use estimated pitch period to label the units as “target”or “intrusi<strong>on</strong>”. The labeled units will be segregated intoforeground <strong>and</strong> background in next subsecti<strong>on</strong>.As in the Hu <strong>and</strong> Wang model, resolved <strong>and</strong> unresolvedT-F units are treated differently. For the resolved <strong>on</strong>e, it is1742
labeled according to harm<strong>on</strong>icity principle. If resp<strong>on</strong>se frequencyis multiple of the estimated pitch, the resolved T-Funit is labeled as target. For the unresolved <strong>on</strong>e, it is labeledaccording to AM criteri<strong>on</strong>. AM criteri<strong>on</strong> pointed out that if afilter resp<strong>on</strong>ding to multiple harm<strong>on</strong>ics of a single harm<strong>on</strong>icsound source, the resp<strong>on</strong>se envelope fluctuates at therate of F0 of the source. Therefore, the unresolved T-F unitis labeled as target if the AM rate equals to the estimatedpitch.To measure these two criteri<strong>on</strong>s, we employ an IIR combfilter with sieves at F0 <strong>and</strong> its overt<strong>on</strong>es to filter the flattenedoutput of gammat<strong>on</strong>e filter g N (c,t) or its flattened envelopee N (c,t). The flattened signals are obtained by (5).This process can be viewed as a simplified simulati<strong>on</strong> forthe automatic gain c<strong>on</strong>trol which is <strong>on</strong>e of the functi<strong>on</strong>s ofcochlear. rN(,) c t sgn r c, t r c,t(5)where, r(c,t) st<strong>and</strong>s for output of gammat<strong>on</strong>e filter or itsenvelope at channel c; r N (c,t) is the flattened signal; is thecompressi<strong>on</strong> rate, here =0.1.Then the flattened signals are passed through the combfilter , , , r c t r c t r c t P t(6)R N Rwhere, P(t) is the pitch period at time t which is obtained bylinear interpolati<strong>on</strong> of the frame pitch period; r R (c,t) st<strong>and</strong>sfor comb filter output; =0.55.Unit u cm is labeled as target if most of the flattened signalspassing through the comb filter, i.e. if the relative energyof comb filter output is above a certain threshold c ;otherwise u cm is labeled as intrusi<strong>on</strong>.W 12 rRc,mT n 0log W 1c(7)2rNc,mT n 0For resolved T-F unit, r(c,t) in (5) st<strong>and</strong>s for the outputof gammat<strong>on</strong>e filter g(c,t). Similarly, r N (c,t) <strong>and</strong> r R (c,t)st<strong>and</strong>s for g N (c,t) <strong>and</strong> g R (c,t) respectively. For unresolved T-F unit, r(c,t) in (5) st<strong>and</strong>s for the envelope of gammat<strong>on</strong>efilter output e(c,t). The threshold c =0.55 for resolved units<strong>and</strong> c =0.45 for unresolved units.2.4. Separati<strong>on</strong> <strong>and</strong> synthesisTo directly use labeling informati<strong>on</strong> as the final decisi<strong>on</strong>will lead to some errors. Hence, previous method [4] provideda separati<strong>on</strong> method based <strong>on</strong> segmentati<strong>on</strong>. Here, wetake the similar process with different details.a) The resolved T-F unit separati<strong>on</strong> is based <strong>on</strong> the segmentsgenerated in Secti<strong>on</strong> 2.2. These segments are firstlymarked as matched or mismatched <strong>on</strong> each frame. Specifically,if more than 50% units <strong>on</strong> a frame are labeled as target,we call the segment matched <strong>on</strong> this frame. If morethan half of the segment’s frames marked as matched, it isgrouped into foreground; otherwise it is grouped into background.In foreground, the units labelled as intrusi<strong>on</strong> aremerged into new segments. Then the segments larger than30 ms are moved into background.b) For unresolved T-F units, they resp<strong>on</strong>d to several frequencycomp<strong>on</strong>ents. If dominated by target voiced speech,their AM rate equals to the F0. Therefore, the flattened envelopeis used in (5) <strong>and</strong> (6). However, the large value in (6)doesn’t mean AM rate equals to F0. The units are possiblydominated by noise with fracti<strong>on</strong>al F0 (e.g. F0/2,F0/3…).To eliminate the errors, we compute the ZCR ofunresolved T-F units <strong>on</strong> the comb filter output. The segmentsc<strong>on</strong>sisting of unresolved T-F units are formed by thespatially c<strong>on</strong>tinuous c<strong>and</strong>idates with distance between ZCR<strong>and</strong> F0 less than 50%. The segments l<strong>on</strong>ger than 30 ms aregrouped into foreground.c) The units labelled as target, not in foreground, aremerged iteratively into its adjacent segments in foreground.The rest are grouped into background.Finally, the units in foreground are used to synthesize thewaveform of separated target speeches.3. ANALYSIS OF RUN-TIME COMPLEXITYIn this secti<strong>on</strong>, we analyze the run-time complexity of theproposed algorithm <strong>and</strong> compare it with the Hu <strong>and</strong> Wangmodel. As a typical correlogram-based speech separati<strong>on</strong>system, the Hu <strong>and</strong> Wang model [4] has much better performancethan previous systems. The innovati<strong>on</strong>s of the Hu<strong>and</strong> Wang model are that: 1) different separati<strong>on</strong> methodfor resolved <strong>and</strong> unresolved harm<strong>on</strong>ics; 2) separati<strong>on</strong> based<strong>on</strong> segmentati<strong>on</strong>; 3) pitch detecti<strong>on</strong> in noisy envir<strong>on</strong>ment.Correlogram plays a vital role in each stage.Because the entire separati<strong>on</strong> systems are relative complicated,we <strong>on</strong>ly compared the major processes in eachstages. From table 1, it can be seen that computing correlogramsis the bottleneck of the Hu <strong>and</strong> Wang system. Toaccelerate the computati<strong>on</strong>, autocorrelati<strong>on</strong> could be d<strong>on</strong>ein frequency domain [2]. Then the complexity of computingcorrelograms is O(CLlogW). Another place of the Hu <strong>and</strong>Wang system which could be accelerated is in unit labeling,where we can c<strong>on</strong>duct b<strong>and</strong>pass filtering in frequency domain,<strong>and</strong> its complexity is O(CLlogL). In our algorithm,the complexity of those two counterparts is O(CL). Specificrunning time of the algorithms is shown in next secti<strong>on</strong>.4. SYSTEM EVALUATIONThe proposed scheme is evaluated <strong>on</strong> a corpus of 100 mixturescomposed of ten voiced utterances mixed with tendifferent kinds of intrusi<strong>on</strong>s collected by Cooke [6] whichis widely used to evaluate the separati<strong>on</strong> systems. In thedataset, ten voiced utterances have c<strong>on</strong>tinuous pitch nearly1743
throughout whole durati<strong>on</strong>. And the intrusi<strong>on</strong>s are ten differentkinds of sounds including N0, 1 kHz pure t<strong>on</strong>e; N1,white noise; N2, noise bursts; N3, “cocktail party” noise;N4, rock music; N5, siren; N6, trill teleph<strong>on</strong>e; N7, femalespeech; N8, male speech; <strong>and</strong> N9, female speech. Tenvoiced utterances are regarded as targets. Frequency samplingrate of the corpus is 16 kHz.As comm<strong>on</strong>ly used objective performance measure forseparati<strong>on</strong> systems [4][5], signal to noise rati<strong>on</strong> (SNR) ischosen. Its computati<strong>on</strong> is as follows:2 R( t)tSNR 10 log (8)102[ R( t) S ( t)] twhere, R(t) is the clean speech <strong>and</strong> S(t) is the synthesizedwaveform by segregati<strong>on</strong> systems.In table 2, each value represents the average SNR for <strong>on</strong>eintrusi<strong>on</strong> mixed with ten target speeches. The average ofoverall intrusi<strong>on</strong>s is shown in last row. As shown in table,our algorithm improves SNR for most of the intrusi<strong>on</strong>s <strong>and</strong>produces a gain of 0.7 dB over the Hu <strong>and</strong> Wang model.For further comparis<strong>on</strong>, we replace estimated pitch bytrue pitch in the Hu <strong>and</strong> Wang model (termed as TP-HW)<strong>and</strong> the proposed algorithm (termed as TP-Pro). The truepitch is obtained by performing the algorithm <strong>on</strong> cleanspeech. The performances are listed in table 2. It can beseen that TP-HW produces a gain of 0.35 dB comparedwith the original Hu <strong>and</strong> Wang model. While the TP-Proproduces a gain of 0.17 dB. Although we didn’t comparethe pitch estimati<strong>on</strong> of both algorithms, the proposed pitchestimati<strong>on</strong> is at least no worse than the method in the Hu<strong>and</strong> Wang model. The SNR gap between TP-HW <strong>and</strong> TP-Pro is 0.53 dB.To compare the computing time, both of the proposed algorithm<strong>and</strong> the Hu <strong>and</strong> Wang model are implemented by Clanguage <strong>and</strong> run <strong>on</strong> the PC platform with 1.6 GHz CPU<strong>and</strong> 3 GB storage memory. The implementati<strong>on</strong> of the Hu<strong>and</strong> Wang model is provided by Prof. Deliang Wang. Wealso accelerate the Hu <strong>and</strong> Wang model by computing correlograms<strong>and</strong> b<strong>and</strong>pass filtering in frequency domainwhich is termed as accHW. Results of computing time arelisted in table 3.From table 3, we can see that total durati<strong>on</strong> of 100 mixturesis 168.3 sec<strong>on</strong>ds. And the computing time of the Hu<strong>and</strong> Wang is 14.6 times of real time. For the accelerated Hu<strong>and</strong> Wang model, the computing time is 6.33 times of realtime. It saves 57% computing time. While, the total computingtime of the proposed system is 2.23 times of realtime. Compared with original Hu <strong>and</strong> Wang model <strong>and</strong>accelerated Hu <strong>and</strong> Wang model, the proposed methodsaves 84.8 % <strong>and</strong> 64.8 % of computing time respectively.5 DISCUSSION AND CONCLUSIONIn this paper, we propose a novel algorithm for m<strong>on</strong>auralvoiced speech separati<strong>on</strong> which avoids computing the correlograms.Segmentati<strong>on</strong>, pitch detecti<strong>on</strong> <strong>and</strong> segregati<strong>on</strong>are implemented in an efficient way by the novel scheme.Compared with the typical correlogram-based algorithm Hu<strong>and</strong> Wang model, the proposed scheme achieves better performance<strong>and</strong> saves computing time.6REFERENCE[1] S. Bregman, Auditory Scene Analysis, MA: MIT press, 1990.[2] D. L.Wang <strong>and</strong> G. J. Brown, Computati<strong>on</strong>al Auditory Scene Analysis:Principles, Algorithms <strong>and</strong> Applicati<strong>on</strong>s, Wiley-IEEE Press, 2006.[3] J. C. R. Licklider, “A duplex theory of pitch percepti<strong>on</strong>,” Experientiavol. 7 no.4, pp. 128–134, 1951.[4] G. N. Hu <strong>and</strong> D. L. Wang, “<str<strong>on</strong>g>M<strong>on</strong>aural</str<strong>on</strong>g> speech segregati<strong>on</strong> based <strong>on</strong>pitch tracking <strong>and</strong> amplitude modulati<strong>on</strong>,” IEEE Trans. Neural Networks,vol. 15, no. 5, pp. 1135–1150, 2004.[5] D. L. Wang, <strong>and</strong> G. J. Brown, “Separati<strong>on</strong> of speech from interferingsounds based <strong>on</strong> oscillatorycorrelati<strong>on</strong>,” IEEE Trans. Neural Networks,vol. 10, no. 3, pp. 684-697, 1999.[6] M.P. Cooke, Modeling Auditory Processing <strong>and</strong> Organizati<strong>on</strong>, U.K.:Cambridge University, 1993TABLE 1 COMPARISON OF TIME COMPLEXITYStage Process HW ProposedFr<strong>on</strong>t-End proc. Signal decompositi<strong>on</strong> O(CL) O(CL)Envelope extracti<strong>on</strong> O(CLlogL) O(CLlogL)Correlograms O(CLD) –ZCR – O(CL)<strong>Pitch</strong> estimati<strong>on</strong> Segmentati<strong>on</strong> O(CL/T) O(CL/T)<strong>Pitch</strong> estimati<strong>on</strong> O(CL) O(CL)Unit Labeling B<strong>and</strong>pass filtering O(CLF) –<strong>Comb</strong> filtering – O(CL)Sep & Syn O(CL) O(CL)C: the number of channels; L: length of input signal; T: time shift; D:maximum pitch period; F: Length of FIR b<strong>and</strong>pass filter.TABLE 2 SNR RESULTSIntrusi<strong>on</strong> Mixture HW Proposed TP-HW TP-ProN0 -3.27 16.44 17.86 16.41 17.87N1 -4.08 7.80 8.16 8.15 8.32N2 10.18 16.71 18.27 16.55 18.46N3 4.34 8.24 8.26 8.66 8.76N4 3.98 10.77 11.28 11.11 11.28N5 -5.83 14.87 16.04 14.83 16.04N6 1.89 16.66 17.46 17.07 17.59N7 6.61 11.99 11.93 12.15 11.87N8 10.36 14.27 14.84 14.87 15.15N9 0.72 4.25 4.98 5.69 5.48AVG 2.49 12.20 12.91 12.55 13.08TABLE 3 COMPUTING TIMETotal Durati<strong>on</strong> Run Time Real-Time propertyMixture 168 s – –HW – 2460 s 14.6×RTaccHW – 1064 s 6.33×RTProposed – 375 s 2.23×RT1744


