Leaching of DEHA and DEHP from PET bottles to water Final ... - Sodis
Leaching of DEHA and DEHP from PET bottles to water Final ... - Sodis
Leaching of DEHA and DEHP from PET bottles to water Final ... - Sodis
- No tags were found...

You also want an ePaper? Increase the reach of your titles
YUMPU automatically turns print PDFs into web optimized ePapers that Google loves.
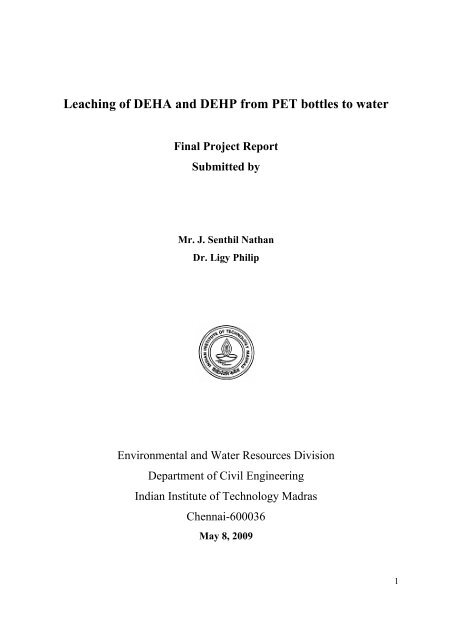
continent has many rivers <strong>and</strong> canals’ flowing the need for the drinking <strong>water</strong> is increasing dayby day. Apart <strong>from</strong> the increase in the population the present technological improvement aroundthe world which brought many industries <strong>to</strong> the county has also contributed <strong>to</strong> it. At this junctureas the community feels happy when they are able <strong>to</strong> get drinking <strong>water</strong> <strong>and</strong> they hardly thinkabout the quality <strong>of</strong> the <strong>water</strong> they are consuming. So, there is a greater need <strong>to</strong> create awarenessamong the families <strong>and</strong> community about the consequences <strong>of</strong> the unsafe drinking <strong>water</strong> <strong>and</strong> themethods <strong>to</strong> get the safe drinking <strong>water</strong> so that they can be prevented by the <strong>water</strong> born diseases.Even though both the governmental <strong>and</strong> non-governmental agencies have involved themselves inmaking the community aware about the methods <strong>of</strong> preparing safe drinking <strong>water</strong> in the past fewyears Solar Disinfection Water treatment has become the zero cost method <strong>of</strong> preparing a safedrinking <strong>water</strong>.BackgroundSODIS (Solar <strong>water</strong> disinfection) is a simple <strong>and</strong> effective <strong>water</strong> treatment procedure <strong>to</strong> improvethe microbiological quality <strong>of</strong> drinking <strong>water</strong>. SODIS uses solar radiation <strong>and</strong> elevatedtemperature destroys pathogenic micro-organisms causing <strong>water</strong> borne diseases. In this processcontaminated <strong>water</strong> is filled in<strong>to</strong> transparent plastic <strong>bottles</strong> made form <strong>PET</strong>. Recently, concernshave been raised about leaching <strong>of</strong> <strong>DEHA</strong> (di(2-ethylhexyl) adiphate) <strong>and</strong> <strong>DEHP</strong> (di(2-ethylhexyl) phthalate) <strong>from</strong> <strong>PET</strong> bottle during SODIS process. The present study was done <strong>to</strong>quantify the migration <strong>of</strong> plasticizers <strong>DEHA</strong> (di(2-ethylhexyl) adiphate) <strong>and</strong> <strong>DEHP</strong> (di(2-ethylhexyl) phthalate) <strong>from</strong> <strong>PET</strong> bottle during the SODIS process. The migration <strong>of</strong> <strong>DEHA</strong> <strong>and</strong><strong>DEHP</strong> components <strong>from</strong> transparent <strong>PET</strong> <strong>bottles</strong> which were used for SODIS <strong>and</strong> also new <strong>PET</strong><strong>bottles</strong> which can be used for SODIS process in the future were selected for the study. Samples<strong>from</strong> different locations like Chennai, Kolkata <strong>and</strong> Delhi were studied under differentconditions. .3
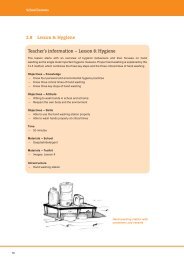
Similarly, experiment was conducted under sunlight along with heating the <strong>bottles</strong> in a <strong>water</strong>bath at 60ºC. Sample numbers 6, 16, 23, 26, 38, 41, 44 <strong>and</strong> 47 were collected <strong>from</strong> Chennai.Sample number 29, 32, 50, 53, 56 <strong>and</strong> 59 were collected <strong>from</strong> Kolkata. Sample numbers 35, 62<strong>and</strong> 65 were collected <strong>from</strong> Delhi. Before conducting the experiment, the <strong>PET</strong> <strong>bottles</strong> wererinsed twice with distilled <strong>water</strong>. Known quantity <strong>of</strong> distilled <strong>water</strong> was filled in the <strong>PET</strong> <strong>bottles</strong><strong>and</strong> kept at 60ºC in <strong>water</strong> bath under sunlight for 48 h. Similar experiment was conducted usingsample numbers 5 <strong>and</strong> 15 at 60ºC under the sunlight for 6 h. The blank analysis was carried outfor all the experiments.Figure 3: Experiments conducted under the sunlight at 60ºC2.4.3 Experiments conducted in shade at different temperatureThis experiment was conducted for only 8 samples. Sample numbers 7 <strong>and</strong> 17 were kept in a<strong>water</strong> bath at 30ºC <strong>and</strong> sample numbers 8 <strong>and</strong> 18 were kept at 40 ºC. Similarly, sample numbers9 <strong>and</strong> 19 were kept in <strong>water</strong> bath at 50ºC <strong>and</strong> sample numbers 10 <strong>and</strong> 20 kept at 60ºC. All thesamples were kept in <strong>water</strong> bath under shade for 48h. The blank study was conducted using glass<strong>bottles</strong> filled with distilled <strong>water</strong> <strong>and</strong> kept along with the <strong>PET</strong> <strong>bottles</strong>.8
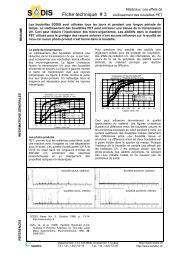
Figure 4: Experiments conducted with different temperature under the shade3.0 DiscussionThe first study was conducted in shade <strong>and</strong> 19 <strong>PET</strong> <strong>bottles</strong> were used for this experiment.Among these, two <strong>PET</strong> <strong>bottles</strong> were kept in shade for 6h <strong>and</strong> remaining 17 <strong>PET</strong> <strong>bottles</strong> were keptin shade for 48h. After 6h reaction time, there was no <strong>DEHA</strong> observed in either <strong>of</strong> the sampleswhereas <strong>DEHP</strong> concentration was 0.006 <strong>and</strong> 0.024µg/L, for samples number 1 <strong>and</strong> 11,respectively. After 48h reaction time, <strong>DEHA</strong> concentration was below detectable limit for most<strong>of</strong> the samples. Only sample number 63 showed 0.002µg/L <strong>of</strong> <strong>DEHA</strong>. However, <strong>DEHP</strong> waspresent in all the samples <strong>and</strong> the concentration was ranging <strong>from</strong> 0.0165 <strong>to</strong> 0.5271µg/L. Theresults <strong>of</strong> experiments conducted in shade are given in Table-1. The GC-MS chroma<strong>to</strong>grams forsample number 2 <strong>and</strong> 12 are given in Figs. 6 <strong>and</strong> 7, respectively.Two set <strong>of</strong> experiments (6 <strong>and</strong> 48 h) were carried out under the sunlight without heating. Theresults <strong>of</strong> experiments conducted under sunlight (without heating) are given in Table-2. Theconcentration <strong>of</strong> <strong>DEHA</strong> was below detectable limit for sample 3 <strong>and</strong> 13 <strong>and</strong> <strong>DEHP</strong>concentrations were 0.202 <strong>and</strong> 0.112µg/L for samples 3 <strong>and</strong> 13, respectively. After 48h <strong>of</strong>exposure, <strong>DEHA</strong> concentration was below detectable limit for most <strong>of</strong> the samples.Concentrations <strong>of</strong> <strong>DEHA</strong> were ranging between 0.0010 <strong>and</strong> 0.0053µg/L <strong>and</strong> concentrations <strong>of</strong><strong>DEHP</strong> were between 0.020 <strong>to</strong> 0.2885µg/L.9
Experiments under the sunlight with heating (60ºC) were conducted for 19 samples. The resultsare given in Table-3. Two samples, 5 <strong>and</strong> 15, were heated for 6 h <strong>and</strong> remaining samples wereheated for 48 h under sunlight. The concentrations <strong>of</strong> <strong>DEHA</strong> were 0.0090 <strong>and</strong> 0.0178µg/L <strong>and</strong><strong>DEHP</strong> were 0.0321 <strong>and</strong> 0.2937µg/L for samples 5 <strong>and</strong> 15, respectively. Concentrations <strong>DEHA</strong>present in samples exposed <strong>to</strong> sunlight <strong>and</strong> heating for 48h varied between 0.0068 <strong>and</strong>0.0256µg/L. Similarly for <strong>DEHP</strong>, the concentrations were ranging <strong>from</strong> 0.0576 <strong>to</strong> 0.5320µg/L.The GC-MS chroma<strong>to</strong>grams for sample numbers 6, 16, 26, 32, 41, 47, 53 <strong>and</strong> 59 are given inFigs. 8, 9, 10, 11, 12, 13, 14 <strong>and</strong> 15, respectively.The third sets <strong>of</strong> experiments were conducted in different temperature (30 <strong>to</strong> 60ºC) under theshade <strong>and</strong> the results are given in Table-4. Low level <strong>of</strong> <strong>DEHA</strong> concentration was observed <strong>from</strong>30 <strong>to</strong> 50ºC (0.001-0.007µg/L). At 60ºC, the concentration <strong>of</strong> <strong>DEHA</strong> was 0.019 <strong>and</strong> 0.029 µg/Lfor sample number 10 <strong>and</strong> 20, respectively. <strong>DEHP</strong> concentrations were between 0.088 <strong>and</strong> 0.324µg/L. The maximum concentration <strong>of</strong> <strong>DEHP</strong> (0.324 µg/L) was observed in sample number 9<strong>and</strong> minimum concentration (0.088 µg/L) was observed in sample 10.ConclusionTrace amount <strong>of</strong> leaching <strong>of</strong> <strong>DEHA</strong> <strong>and</strong> <strong>DEHP</strong> was observed in most <strong>of</strong> the samples irrespective<strong>of</strong> the condition (heating, without heating <strong>and</strong> under solar light). <strong>DEHA</strong> present in <strong>water</strong> samples<strong>of</strong> present experiments varied between 0.001 <strong>and</strong> 0.0256 μg/L <strong>and</strong> <strong>DEHP</strong> concentrations varied<strong>from</strong> 0.006 <strong>to</strong> 0.5320μg/L. World Health Organization (WHO) guideline for drinking <strong>water</strong> withrespect <strong>to</strong> <strong>DEHA</strong> <strong>and</strong> <strong>DEHP</strong> is presented in Table-5. As per WHO guidelines for drinking <strong>water</strong>quality, the concentration <strong>of</strong> <strong>DEHA</strong> <strong>and</strong> <strong>DEHP</strong> are well within the permissible limits.ReferencesWHO Guidelines for drinking <strong>water</strong> quality, Di(2-ethylhexyl)adipate, World HealthOrganization, Geneva, 1993,http://www.who.int/<strong>water</strong>_sanitation_health/GDWQ/Chemicals/di2ethylhexylsum.htm.WHO Guidelines for drinking <strong>water</strong> quality, Di(2-ethylhexyl)phthalate, World HealthOrganization, Geneva, 1993,http://www.who.int/<strong>water</strong>_sanitation_health/GDWQ/Chemicals/di2ethylhexyphtasum.htm.10
Table-1 : Experiments carried out in shadeS. No Bottles Shade Results µg/L Shade Results µg/L6 hrs <strong>DEHA</strong> <strong>DEHP</strong> 48 <strong>DEHA</strong> <strong>DEHP</strong>hrs1 Bottle 1- big br<strong>and</strong> Chennai 1 BDL 0.006 2 BDL 0.52712 Bottle 1a - big br<strong>and</strong> / SODIS Chennai 11 BDL 0.024 12 BDL 0.39393 Bottle 2 - big br<strong>and</strong> Chennai - - - 21 BDL 0.08584 Bottle 2a - big br<strong>and</strong> / SODIS Chennai - - - 24 BDL 0.02225 Bottle 3 - big br<strong>and</strong> Kolkata - - - 27 BDL 0.12946 Bottle 3 a - big br<strong>and</strong> / SODIS Kolkata - - - 30 BDL 0.01657 Bottle 4 - big br<strong>and</strong> Delhi - - - 33 BDL 0.11878 Bottle 5 – no br<strong>and</strong> Chennai - - - 36 BDL 0.02459 Bottle 5 a – no br<strong>and</strong> / SODIS Chennai - - - 39 BDL 0.032910 Bottle 6 – no br<strong>and</strong> Chennai - - - 42 BDL 0.020611 Bottle 6 a – no br<strong>and</strong> / SODIS Chennai - - - 45 BDL 0.074412 Bottle 7 – no br<strong>and</strong> Kolkata - - - 48 BDL 0.027713 Bottle 7 a – no br<strong>and</strong> / SODIS Kolkata - - - 51 BDL 0.070214 Bottle 8 – no br<strong>and</strong> Kolkata - - - 54 BDL 0.114415 Bottle 8 a – no br<strong>and</strong> / SODIS Kolkata - - - 57 BDL 0.223616 Bottle 9 – no br<strong>and</strong> Delhi - - - 60 BDL 0.376017 Bottle 10 – no br<strong>and</strong> Delhi -- -- -- 63 0.002 0.1281BDL: Below detectable limit11
Table-2 : Experiments carried out in sunlight 6 <strong>and</strong> 48 hrsS. No Bottles Sun Results µg/L Sun Results µg/L6 hrs <strong>DEHA</strong> <strong>DEHA</strong> 48 <strong>DEHA</strong> <strong>DEHP</strong>hrs1 Bottle 1- big br<strong>and</strong> Chennai 3 BDL 0.202 4 0.0016 0.07502 Bottle 1a - big br<strong>and</strong> / SODIS Chennai 13 BDL 0.112 14 0.0012 0.26133 Bottle 2 - big br<strong>and</strong> Chennai - - - 22 0.0010 0.05844 Bottle 2a - big br<strong>and</strong> / SODIS Chennai - - - 25 BDL 0.28855 Bottle 3 - big br<strong>and</strong> Kolkata - - - 28 0.0011 0.07696 Bottle 3 a - big br<strong>and</strong> / SODIS Kolkata - - - 31 0.0019 0.06487 Bottle 4 - big br<strong>and</strong> Delhi - - - 34 BDL 0.0208 Bottle 5 – no br<strong>and</strong> Chennai - - - 37 BDL 0.03239 Bottle 5 a – no br<strong>and</strong> / SODIS Chennai - - - 40 BDL 0.082810 Bottle 6 – no br<strong>and</strong> Chennai - - - 43 BDL 0.054911 Bottle 6 a – no br<strong>and</strong> / SODIS Chennai - - - 46 0.0011 0.079312 Bottle 7 – no br<strong>and</strong> Kolkata - - - 49 0.0012 0.106913 Bottle 7 a – no br<strong>and</strong> / SODIS Kolkata - - - 52 BDL 0.058314 Bottle 8 – no br<strong>and</strong> Kolkata - - - 55 BDL 0.008515 Bottle 8 a – no br<strong>and</strong> / SODIS Kolkata - - - 58 BDL 0.011716 Bottle 9 – no br<strong>and</strong> Delhi - - - 61 0.0053 0.111517 Bottle 10 – no br<strong>and</strong> Delhi - - - 64 BDL 0.1473BDL: Below detectable limit12
Table-3 : Experiments carried out in sunlight <strong>and</strong> heated <strong>to</strong> 60ºCS. No Bottles collected Sun Results µg/L Sun Results µg/L60ºC <strong>DEHA</strong> <strong>DEHA</strong> 60ºC <strong>DEHA</strong> <strong>DEHP</strong>6 hrs48 hrs1 Bottle 1- big br<strong>and</strong> Chennai 5 0.0090 0.0321 6 BDL 0.38202 Bottle 1a - big br<strong>and</strong> / SODIS Chennai 15 0.0178 0.2937 16 BDL 0.53203 Bottle 2 - big br<strong>and</strong> Chennai - - - 23 BDL 0.03694 Bottle 2a - big br<strong>and</strong> / SODIS Chennai - - - 26 BDL 0.05765 Bottle 3 - big br<strong>and</strong> Kolkata - - - 29 0.0256 0.05776 Bottle 3 a - big br<strong>and</strong> / SODIS Kolkata - - - 32 BDL 0.32837 Bottle 4 - big br<strong>and</strong> Delhi - - - 35 0.0149 0.10878 Bottle 5 – no br<strong>and</strong> Chennai - - - 38 0.0068 0.28519 Bottle 5 a – no br<strong>and</strong> / SODIS Chennai - - - 41 BDL 0.212010 Bottle 6 – no br<strong>and</strong> Chennai - - - 44 0.0106 0.045811 Bottle 6 a – no br<strong>and</strong> / SODIS Chennai - - - 47 BDL 0.218112 Bottle 7 – no br<strong>and</strong> Kolkata - - - 50 BDL 0.173713 Bottle 7 a – no br<strong>and</strong> / SODIS Kolkata - - - 53 BDL 0.203614 Bottle 8 – no br<strong>and</strong> Kolkata - - - 56 0.0227 0.015515 Bottle 8 a – no br<strong>and</strong> / SODIS Kolkata - - - 59 BDL 0.178316 Bottle 9 – no br<strong>and</strong> Delhi - - - 62 BDL 0.069717 Bottle 10 – no br<strong>and</strong> Delhi - - - 65 0.0166 0.0692BDL: Below detectable limit13
Table-4 : Experiments carried out in shade with different TemperatureS. No Bottles TemperatureTime inhrs.SampleNoResults µg/L<strong>DEHA</strong> <strong>DEHP</strong>1 Bottle 1- big br<strong>and</strong> Chennai 30ºC 48 hrs 7 0.007 0.2295 Bottle 1a - big br<strong>and</strong> / SODIS Chennai 30ºC 48 hrs 17 BDL 0.1552 Bottle 1- big br<strong>and</strong> Chennai 40ºC 48 hrs 8 BDL 0.2556 Bottle 1a - big br<strong>and</strong> / SODIS Chennai 40ºC 48 hrs 18 BDL 0.1483 Bottle 1- big br<strong>and</strong> Chennai 50ºC 48 hrs 9 0.002 0.3247 Bottle 1a - big br<strong>and</strong> / SODIS Chennai 50ºC 48 hrs 19 0.001 0.2444 Bottle 1- big br<strong>and</strong> Chennai 60ºC 48 hrs 10 0.029 0.0888 Bottle 1a - big br<strong>and</strong> / SODIS Chennai 60ºC 48 hrs 20 0.019 0.315BDL: Below detectable limitTable-5: WHO Guidelines for drinking <strong>water</strong> qualityS.No Compounds Range μg/L WHO St<strong>and</strong>ard μg/L1 <strong>DEHA</strong> 0.001-0.0256 802 <strong>DEHP</strong> 0.006-0.5320 8BDL: Below detectable limit14
GC-MS Analysis <strong>of</strong> St<strong>and</strong>ard <strong>DEHA</strong> <strong>and</strong> <strong>DEHP</strong>Figure-4: St<strong>and</strong>ard Graph 0.1 mg/L <strong>DEHA</strong> (GC-MC Analysis)Figure-5: St<strong>and</strong>ard Graph 0.1 mg/L <strong>DEHP</strong> (GC-MS Analysis)15
Figure-6: GC-MS Analysis Sample No 2Figure-7: GC-MS Analysis Sample No 1216
Figure-8: GC-MS Analysis Sample No 6Figure-9: GC-MS Analysis Sample No 1617
Figure-10: GC-MS Analysis Sample No 26Figure-11: GC-MS Analysis Sample No 3218
Figure-12: GC-MS Analysis Sample No 41Figure-13: GC-MS Analysis Sample No 4719
Figure-14: GC-MS Analysis Sample No 53Figure-15: GC-MS Analysis Sample No 5920