Appropriateness of Minimum Nurse Staffing Ratios In Nursing ... - PHI
Appropriateness of Minimum Nurse Staffing Ratios In Nursing ... - PHI
Appropriateness of Minimum Nurse Staffing Ratios In Nursing ... - PHI

Create successful ePaper yourself
Turn your PDF publications into a flip-book with our unique Google optimized e-Paper software.
CHAPTER 13.0 TIME-MOTION APPROACH TO SETTING NURSE STAFFING STANDARDS 113.1 <strong>In</strong>troductionAs described in Chapter 1, we have identified three general approaches for establishingappropriate nursing home staffing standards. One approach, soliciting the consensusopinion <strong>of</strong> experts, is examined in Chapter 6, and has been found to have some seriouslimitations. The second approach is empirical: Measures <strong>of</strong> nurse staffing and residentoutcomes measures are obtained for a large number <strong>of</strong> nursing homes and therelationship between the two are examined. This empirical approach constitutes theprimary strategy <strong>of</strong> this project, yielding the results presented in the previous fourchapters (Chapters 9 through 12).The third approach, what we broadly characterize as a “time-motion” method, attemptsto identify the time it takes to complete nursing tasks for nursing home residents. Thesetimes, aggregated to the facility level, determine the nurse staffing required to providethis level <strong>of</strong> care. The staffing algorithms derived from this method are adjusted fordifferences in the kind and intensity <strong>of</strong> care needed by residents with differing levels <strong>of</strong>acuity and functional limitations.This time-motion approach is the subject <strong>of</strong> this chapter. As a method <strong>of</strong> derivingappropriate nursing staffing standards, it is intuitively understandable, particularly tothose who find the statistical modeling <strong>of</strong> the empirical approach to be too complex, orsuspect. If there is an impact on some important resident outcomes by what nursingstaff actually do, an assumption that would be hard to reject, then it would seemreasonable to determine how much time it takes to perform these necessary nursingtasks and the consequent staffing implied by this allocation <strong>of</strong> time.1This chapter was written by Marvin Feuerberg and Susan Joslin (HCFA). We wish to acknowledge ourappreciation for the printed information and clarifying discussions from Lt. Col. Harper (U.S. Army),William Thoms, and Abt’s Karen Reilly. Editorial assistance was provided by Jeane Nitsch, HCFA.<strong>Appropriateness</strong> <strong>of</strong> <strong>Minimum</strong> <strong>Nurse</strong> <strong>Staffing</strong> <strong>Ratios</strong> in <strong>Nursing</strong> HomesReport to Congress−1
2. “What is the evidence supporting this system? Most important, can yousend or refer us to a key article, report, or document that provides thesupporting evidence?”3. “Do you think the WMSN is applicable to the impaired population typicallyfound in U.S. nursing homes?”Nearly identical questions were asked in a December 7, 1999, letter to William Thoms. 3The letters also indicated that after their response was received, we would call them toask a few follow-up questions. Written responses were received from both Lt. Col.Richard Harper and William Thoms, the two key informants according to Mohler andWilner, and one or more follow-up telephone conference calls were conducted. Theassessment below is based on their written replies, other printed materials we obtained,and information obtained from the two separate conference calls on February 17, 2000with Lt.Col. Richard Harper and Williams Thoms.13.2.2 U.S. Army WMSN for Setting <strong>Staffing</strong> StandardsIt is probably understandable that after some 20 years, we were not able to find anyprinted evidence about the development <strong>of</strong> this system. According to Lt. Harper, timemotionstudies were conducted in well over eight facilities, mostly larger communityhospitals and acute care facilities, including some overseas. Estimates <strong>of</strong> both directand indirect patient care times were obtained. He also indicated that the training <strong>of</strong>army RNs and Aides are comparable to their civilian counterparts. Although this systemis a Department <strong>of</strong> Defense tri-service model, it was originally developed and primarilyused/accepted by the army.Some indication <strong>of</strong> how this system would staff nursing homes can be discerned from a1990 training manual that we obtained. 4 The WMSN is an automated nursingmanagement information system used to determine the manpower requirements, bothpr<strong>of</strong>essional and parapr<strong>of</strong>essional nursing personnel, for inpatient units. Morespecifically, this system can be used to determine the staffing needs formedical/surgical, newborn nursery, neonatal intensive care and psychiatric inpatientnursing units. It cannot be used to determine the manpower requirements for outpatientpsychiatric treatment centers, recovery room, labor and delivery and outpatient sameday surgery units.The nursing manpower requirements are based upon patient acuity levels which aredetermined daily by the nurse responsible for the patient. <strong>Nurse</strong>s use a patient acuity34The letters can be found in Appendix G.The Workload Management System for <strong>Nursing</strong>, Headquarters Department <strong>of</strong> the Army, November 1990.<strong>Appropriateness</strong> <strong>of</strong> <strong>Minimum</strong> <strong>Nurse</strong> <strong>Staffing</strong> <strong>Ratios</strong> in <strong>Nursing</strong> HomesReport to Congress−4
worksheet (general or psychiatric) to select the appropriate critical indicators tocalculate each patient’s acuity. Critical indicators are the nursing care activities thathave the greatest impact on time spent in direct patient care. Each critical indicator hasa point value. There is a total <strong>of</strong> ninety-nine critical indicators and they are grouped inone <strong>of</strong> the following categories: Vital signs monitoring, activities <strong>of</strong> daily living, feeding,IV therapy, treatments/procedures/medications, respiratory therapy, teaching, emotionalsupport and continuous observation.The WMSN process is done daily and begins with the nurse calculating an individualpatient point value based upon the sum <strong>of</strong> their critical indicators. Next, patients areplaced in the appropriate acuity category according to their total value. There are sevenpatient categories with category one having the lowest value, zero for patients on leavefrom the facility, and category seven having the highest sum <strong>of</strong> critical indicator valuesbetween 146 and 256 points. The hours <strong>of</strong> nursing care and recommended numberand mix <strong>of</strong> personnel are then calculated based upon the total number <strong>of</strong> patients ineach category. This recommended number and mix <strong>of</strong> personnel are compared to theactual number <strong>of</strong> available staff to determine if staffing levels are within the requirednumber. <strong>Staffing</strong> levels or workload are adjusted accordingly to balance anydeficiencies or staff excess.13.2.3 U.S. Army WMSN: CritiqueThere does not appear to be a more authoritative source on the U.S. Army WMSNsystem than Lt. Col. Harper. He is a consultant to the Army Surgeon General fornursing methods, in a sense “owns” this system through consulting to others, andrewriting manuals and policies on this system. Yet, Harper himself does not think thissystem, as currently developed, is appropriate for the population found in nursinghomes today. He writes in an informal 1/6/00 e-mail response to our letter:“I will begin by telling you that I am very familiar with the WMSN and have writtennumerous manuals pertaining to it over the years. And while it has served itspurpose well there are concerns that cannot be overlooked when addressing theWMSN and its intended use and in the possibility <strong>of</strong> adapting it to another setting.Some <strong>of</strong> my concerns follow:The research on the WMSN is over 20 years old at this time. Medicine haschanged significantly during that period and the WMSN is in severe need<strong>of</strong> revision.The WMSN was standardized in a variety <strong>of</strong> acute care military hospitalsalong a broad range <strong>of</strong> acuity's and ages <strong>of</strong> patients. From a pureresearch standpoint, the validity <strong>of</strong> the WMSN for a narrow acuity and agerange <strong>of</strong> patients in a chronic care setting would be difficult to support.<strong>Appropriateness</strong> <strong>of</strong> <strong>Minimum</strong> <strong>Nurse</strong> <strong>Staffing</strong> <strong>Ratios</strong> in <strong>Nursing</strong> HomesReport to Congress−5
The WMSN is somewhat complex and time intensive to implement andmaintain. There is a high learning curve associated with the WMSN and isresource intensive to teach. There are easier and quicker acuity basedstaffing systems that may be able to provide better answers for thispopulation.I wish I could support the notion that the WMSN, in its current form, could serveto identify the proper staffing requirements for nursing home patients. But, Ibelieve the limitations <strong>of</strong> the WMSN and the corresponding scientific and politicalarguments against using it, might overshadow the efforts to delineate a staffingsystem for the nursing home population.While I am sure that you have explored hundreds <strong>of</strong> possibilities, I can onlyrecommend that some objective form <strong>of</strong> measurement, like the WMSN, beadopted. There are many acuity based systems that are quite easy to use andavailable to all.Having said that, I can also recommend the following. If a satisfactory system isnot identified, the WMSN does have a broad foundation <strong>of</strong> research behind itcoupled with many years <strong>of</strong> data and could be used as a basis to develop anoriginal staffing requirements system specific to the nursing home environment. Iwould suspect that such a system could be researched and developed within an18-month time frame.Regardless <strong>of</strong> what you choose to pursuit, I hope your efforts succeed. Thereclearly is a need for regulatory guidance in some form for the industry.” 5Richard W. Harper LTC, ANLt. Col. Harper does not think the resource intensive, 20 year old WMSN developed foran acute population can be applied to the population typically found in nursing homestoday. Even if the time-motion estimates and required staffing <strong>of</strong> this system could beapplied to the current nursing home population, there is another very severe limitation tothis system. There is no evidence or claim that these staffing standards result in goodoutcomes. According to Harper, it was assumed that the facilities that were used todevelop the time estimates were indeed good facilities, and their staff times werenecessary to produce good care. No evidence on outcomes was generated. <strong>In</strong>deed,the emphasis upon outcomes, while important to health researchers today, was not aconcern at the time this system was developed. As will be shown in the followingsections, this is a severe limitation <strong>of</strong> Thoms’ Management Minutes system, and to alesser extent, HCFA’s Staff Time Measurement studies.5Dialog from telephone conversation with LTC Harper on February 17, 2000.<strong>Appropriateness</strong> <strong>of</strong> <strong>Minimum</strong> <strong>Nurse</strong> <strong>Staffing</strong> <strong>Ratios</strong> in <strong>Nursing</strong> HomesReport to Congress−6
13.3 William Thoms’ Management Minutes System13.3.1 <strong>In</strong>troductionThe time-motion/staffing estimates <strong>of</strong> Thoms’ system were obtained from a nursinghome with apparently a similar chronic-care needs population as found in nursinghomes today, in contrast to the acute population <strong>of</strong> the WMSN described above.However, the nursing times were developed over a 3-yr period, 1972-1975, from 700records within a single nursing home, the Greenbriar Terrace Healthcare nursing homein Nashua, New Hampshire. It would be hard to argue that nursing time estimatesgenerated from a single facility over 25 years ago could provide sufficient basis forestablishing current staffing standards. Further, William Thoms’ reported to us that thenursing times were not derived from direct observation but were estimated by seniornurses. However, Thoms also noted that on the occasions when he checked thenurses estimates, he found them to be generally accurate.13.3.2 Management Minutes SystemAlthough we were unable to secure a presumably important paper with the description<strong>of</strong> the development <strong>of</strong> this system (see discussion below), the materials we receivedfrom Thoms together with our telephone discussion provided some indication <strong>of</strong> howthis system is constructed. The core <strong>of</strong> this system, according to Thoms, is the PatientCare Pr<strong>of</strong>ile (PCP) assessment form, which is used to gather information about thedirect, hands-on nursing care needs <strong>of</strong> any patient regardless <strong>of</strong> their diagnosis. <strong>In</strong> turnthis information is used to determine staffing requirements, patient needs both preadmissionand in-house, and the cost <strong>of</strong> patient care.Pr<strong>of</strong>iles are completed, if at all possible, by the same person each month. The processis limited to gathering information from hardcopy documentation and does not requiredirect patient assessment or interview. Charts are reviewed for documentation thatsupports, according to definition, the presence <strong>of</strong> any <strong>of</strong> the 18 patient care needs listedon the PCP form. The patient care needs used in this system, unlike the WMSN, arevery applicable to a nursing home population and include the following: dispensemedications and chart, skilled observation daily, personal hygiene (assist or total), aidwith dressing, assist with mobility, feed (partial or total or tube feeding), incontinence(bowel and bladder), bowel and/or bladder training, positioning, decubitus preventionand skilled procedure daily. 6 Each <strong>of</strong> the patient care needs has an assigned timevalue ranging from 10 minutes to 90 minutes. The time values for each <strong>of</strong> the patient6The instructions provide examples <strong>of</strong> the types <strong>of</strong> care activities that would be covered by the category aswell as any exclusion criteria.<strong>Appropriateness</strong> <strong>of</strong> <strong>Minimum</strong> <strong>Nurse</strong> <strong>Staffing</strong> <strong>Ratios</strong> in <strong>Nursing</strong> HomesReport to Congress−7
care needs that apply to the patient are summed to provide an individual pr<strong>of</strong>ile total.The sum <strong>of</strong> the patient pr<strong>of</strong>ile totals by unit are used to calculate the number <strong>of</strong> hours <strong>of</strong>direct care required for each unit. Several other calculations using information from thePCP are performed in order to determine the number <strong>of</strong> licensed and non-licensed staffhours required.13.3.3 Thoms’ Management Minutes System: CritiqueAs noted above, it would be hard to argue that nursing time estimates generated from asingle facility over 25 years ago could provide sufficient basis for establishing currentstaffing standards. <strong>In</strong> spite <strong>of</strong> these limitations, a number <strong>of</strong> health researchers havereferred to Thoms’ Management Minutes system as a basis for estimating the nursingneeds and acuity <strong>of</strong> residents within a facility and as a basis to compare facilities. 7 All <strong>of</strong>these health services researchers have referred to Thoms’ “Management Minutes”system as described in a 1975 unpublished paper. 8 We have not been able to secure acopy <strong>of</strong> this paper, nor did the now retired Thoms himself have a copy <strong>of</strong> this 25 yearold unpublished paper. It is also unclear from those who have used Thoms’ system,the degree to which they have used his system with the time estimates unaltered. Forexample, in Cohen and Dubay’s article referenced above, they refer to modification <strong>of</strong>Thoms’ system by the West Virginia Medicaid program:The long-term care case-mix index used in this project was derived from theMedicare/Medicaid Automated Certification System (MMACS) [the administrativedata set that preceded OSCAR] patient characteristics, the “ManagementMinutes” system developed by Thoms (1975) and its adaptation by the WestVirginia Medicaid program. Thoms’ system assigns weights to discrete caregivingactivities and characteristics <strong>of</strong> patients. Thoms’ weights were developedusing time and motion studies, and are, in theory, the actual minutes <strong>of</strong> carerequired on a daily basis for patients requiring specific procedures or with certainlevels <strong>of</strong> impairments. . . The complete Thoms system recognizes very specificindividual care needs. For example, any procedure or treatment ordered by aphysician to be performed by a licensed nurse is counted as ten times the weight<strong>of</strong> the same procedure when not required to be performed by a licensed nurse.Ideally, we would utilize the complete system, but available data do not provide78See: Dor, A; 1989. “The Costs <strong>of</strong> Medicare Patients in <strong>Nursing</strong> Homes in the United States.” Journal <strong>of</strong>Health Economics. 8(3):253-270; Cohen, J., and Dubay, L., 1990. “The Effects <strong>of</strong> MedicaidReimbursement Method and Ownership on <strong>Nursing</strong> Home Costs, Case Mix, and <strong>Staffing</strong>.” <strong>In</strong>quiry. 183-200; Cowles, C. M., <strong>Nursing</strong> Home Statistical Yearbook, 1997, The Johns Hopkins University Press, 1998;Harrington, C., et al, <strong>Nursing</strong> Facilities, <strong>Staffing</strong>, Residents, and Facility Deficiencies, 1992 Through 1998,Department <strong>of</strong> Social and Behavioral Sciences, University <strong>of</strong> California, San Francisco, CA., January 2000.Thoms, W. 1975. Proposed Criteria for Long Term Care Quality and Cost Containment Systems.Unpublished paper, Greenbriar Terrace <strong>Nursing</strong> Home, Nashua, NH.<strong>Appropriateness</strong> <strong>of</strong> <strong>Minimum</strong> <strong>Nurse</strong> <strong>Staffing</strong> <strong>Ratios</strong> in <strong>Nursing</strong> HomesReport to Congress−8
this level <strong>of</strong> detail. For the purpose <strong>of</strong> this study, Thoms’ “minutes” are used toweight raw activities <strong>of</strong> daily living (ADLs) and service data, enabling theconstruction <strong>of</strong> a continuous case-mix measure. The long-term care index wasconstructed by multiplying the weights developed by Thoms, or modification <strong>of</strong>these weights made by the West Virginia Medicaid program, for ten patientcharacteristics by the percentage <strong>of</strong> patients with these characteristics andsumming the results . . . 9The various patient characteristics employed by Cohen and Dubay include theproportion <strong>of</strong> patients completely bedfast, needing assistance with ambulation andeating, with indwelling catheters, incontinent, with decubiti, receiving bowel and bladderretraining, and receiving special skin care. It is not clear from the above the degree towhich the West Virginia Medicaid program conducted new time motion estimates andthe degree to which all <strong>of</strong> these adaptations <strong>of</strong> Thoms’ even reflect Thoms’ timeestimates, with all the limitations discussed above.All <strong>of</strong> these limitations notwithstanding, this system has another very severe limitationfor setting nurse staffing standards across the United States. As with the WMSN, thereis no evidence that the Management Minutes 25-year-old time estimates from a singlefacility are linked to resident outcomes, good or otherwise. <strong>In</strong> fairness to Thoms’ thecurrent focus on outcomes was not a9Cohen, J., and Dubay, L., 1990. “The Effects <strong>of</strong> Medicaid Reimbursement Method and Ownership on<strong>Nursing</strong> Home Costs, Case Mix, and <strong>Staffing</strong>.” <strong>In</strong>quiry. 183-200<strong>Appropriateness</strong> <strong>of</strong> <strong>Minimum</strong> <strong>Nurse</strong> <strong>Staffing</strong> <strong>Ratios</strong> in <strong>Nursing</strong> HomesReport to Congress−9
primary concern <strong>of</strong> health researchers 25 years ago, and Thoms’ was also concernedwith developing a patient assessment instrument that could measure patient resourceneeds which would be reflected in reimbursement. 1013.4 HCFA’s Staff Time Measurement Studies on <strong>Nursing</strong> Care in <strong>Nursing</strong>Homes, 1995-1997 1113.4.1 <strong>In</strong>troduction<strong>In</strong> contrast to the WMSN and Thoms’ Management Minutes system described in theprior sections, HCFA’s Staff Time Measurement studies were conducted during the lastfive years, primarily as a more resource intensive research effort as opposed to thedevelopment <strong>of</strong> a clinical tool for the staffing <strong>of</strong> nursing homes and hospitals. Hence,far more evidence is available to judge the applicability <strong>of</strong> staffing algorithms to U.S.nursing homes that may be derived from this project. The Health Care FinancingAdministration (HCFA) commissioned three major skilled nursing facility (SNF) StaffTime Measurement (STM) studies. The purpose <strong>of</strong> the studies was to define therelationship between individual SNF resident clinical characteristics and SNF staff timeor resource use. The Resource Utilization Groups (RUG-III) were derived in part, andupdated based on these studies. Resource utilization groups underlie the case-mixadjusted payment rates for both the <strong>Nursing</strong> Home Case-Mix and QualityDemonstration and the National Medicare SNF Prospective Payment System (PPS).Although the primary objective <strong>of</strong> this effort was to set prospective case-mix adjustedSNF payment rates, the staff time measurements for different kinds <strong>of</strong> residents couldbe used to derive staffing algorithms, as many have suggested.13.4.2 Staff Time Measurement Data Collection<strong>In</strong> efforts to refine the resource utilization groups, HCFA commissioned 1990 Staff TimeMeasurement data collection in seven States -- Kansas, Maine, Mississippi, SouthDakota, Texas, Nebraska, and New York. Data were collected in 202 nursing facilityunits (7,684 residents), 12 <strong>of</strong> which were special Alzheimer’s units (see Table 13.1:HCFA STM Data Collection). <strong>Nursing</strong> staff time was collected by stopwatch over a 24hour period. Auxiliary staff time data were collected over the period <strong>of</strong> one week.10<strong>In</strong> some sense, Thoms’ early concern with setting standards that are based on individual resident’s needs,measurable, and convertible in dollars and cents (i.e., reflected in reimbursement) precededrecommendations by the 1986 IOM panel and many States and current Federal efforts to case-mixadjusted nursing home payments.11The discussion in this section is based in large part from materials prepared by Karen E. Reilly, Sc.D., AbtAssociates <strong>In</strong>c., December, 1999.<strong>Appropriateness</strong> <strong>of</strong> <strong>Minimum</strong> <strong>Nurse</strong> <strong>Staffing</strong> <strong>Ratios</strong> in <strong>Nursing</strong> HomesReport to Congress−10
Table 13.1 HCFA STM Data CollectionYear Facility Units Residents States Data Collection Method1990 202 7,684 KS, ME, MS, NE, NY,SD, TX1995 98 1,896 KS, ME, MS, OH, SD,TX, WAStopwatch and paper<strong>Nursing</strong>—24 hoursAuxiliary—7 daysDatawand, limited paper<strong>Nursing</strong>—48 hoursAuxiliary—7 days1997 74 2,037 CA, CO, FL, MD, NY Datawand, limited paper<strong>Nursing</strong>—48 hoursAuxiliary—7 days<strong>In</strong> 1995, as part <strong>of</strong> the <strong>Nursing</strong> Home Case-Mix and Quality Demonstration’sprospective payment design, HCFA commissioned another staff time measurementdata collection effort. This second study encompassed seven States (Kansas, Maine,Mississippi, South Dakota, Texas, Ohio, Washington) and included 98 facility unit’s(1,896) residents. To incorporate a therapy component in the case-mix reimbursementindex, HCFA commissioned another data collection effort in 1997 focusing on highrehabilitation SNF units and including a broader geographic distribution <strong>of</strong> providers.Additionally, states and facilities were carefully chosen to generate a final analytic STMdatabase that geographically represented the distribution <strong>of</strong> Medicare residents in theUS. The 1997 STM data collection included 74 facility units, 26 <strong>of</strong> which were highrehabilitation units (2,037 residents) across five States (California, Colorado, Florida,Maryland, and New York). The 1995 and 1997 STM data collection included nursingstaff time over 48 hours and auxiliary staff time over a seven day period. The 1995 and1997 data were combined and provided the analytic database used to establish theinitial national SNF Medicare PPS case-mix indices.For the selected facilities and units within facilities, resident specific nursing time (RST)and nonresident specific nursing time (NRST) data were collected. RST included allnursing staff time <strong>of</strong> 30 seconds or more spent in an activity directly attributable to aspecific resident. NRST included staff time not directly related to a specific resident butnecessary as a part <strong>of</strong> unit administration.The total nursing staff time estimates, both resident specific and nonresident specific,resulting from these data collection efforts equaled an average 250 minutes (4.16 hrs.)per resident day. This can be compared to an average <strong>of</strong> about 3.4 hours per residentday for facilities throughout the U.S. during this same period. Given how the facilities<strong>Appropriateness</strong> <strong>of</strong> <strong>Minimum</strong> <strong>Nurse</strong> <strong>Staffing</strong> <strong>Ratios</strong> in <strong>Nursing</strong> HomesReport to Congress−11
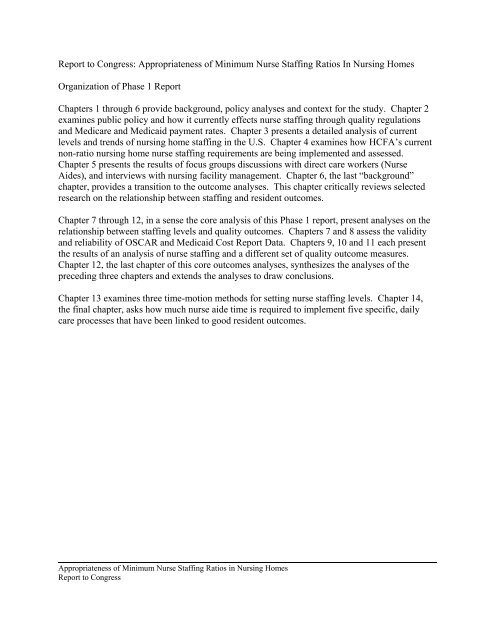
were selected and data was collected on only high-Medicare volume units within thesefacilities, it is not surprising that the STM estimates are considerable higher thantypically found in U.S. nursing homes. The resident specific and nonresident specificnursing staff time estimates for each nursing category (RN, LVN, Aide) and for each <strong>of</strong>the 44 RUGs groupings can be found in Table 13.2.13.4.3 Critique: HCFA’s Staff Time Measurement Study as a Basis for Setting<strong>Staffing</strong> StandardsPerhaps the most serious limitation in the WMSN and Thoms’ Management Minutessystem is that there is no evidence on the relation between these staff time allocationsand resident outcomes, good or otherwise. <strong>In</strong> contrast, the selection <strong>of</strong> facilities for theStaff Time Measurement studies would seem to address this issue <strong>of</strong> outcomes:An important consideration in each <strong>of</strong> these data collection efforts was the inclusion<strong>of</strong> only high quality facilities. The foundation <strong>of</strong> a national case-mix adjustedpayment system, based on resource utilization is staff time associated with highquality resident care. That is, the staff time spent per resident must be sufficientlyhigh to be considered quality clinical care. Toward this end, facilities met stringentselection criteria prior to being included in any <strong>of</strong> the staff time samples. Forexample, facility selection criteria in the 1997 staff time data collection effortincluded: a requirement that the facility be Medicare certified and have 8 or moreMedicare residents on any unit, there be no waivers or complaints against thefacility; the facility must meet or exceed the 1997 OBRA staffing requirements (1.5RNs for a facility <strong>of</strong> 1-59 and at least 2.5 RNs for a facility <strong>of</strong> 60 or more residents); a40% occupancy rate; the facility must deliver more than 110 minutes <strong>of</strong> dailyresident specific nurse staff time; and each facility must pass quality review from atechnical expert panel. 12Although there is at least some attempt in the STM studies to select high-qualityfacilities, it is difficult to determine how the specific selection criteria ensure this result.For example, some <strong>of</strong> the selection criteria seem trivial or irrelevant. When the averageoccupancy rate during 1995-1997 was about 85%, a minimum 40% occupancy is notvery meaningful. Similarly, meeting the OBRA minimum staffing requirements does notseem to be meaningful when all facilities must meet these requirements.12Personal communication from Karen Reilly to Marvin Feuerberg, March, 2000<strong>Appropriateness</strong> <strong>of</strong> <strong>Minimum</strong> <strong>Nurse</strong> <strong>Staffing</strong> <strong>Ratios</strong> in <strong>Nursing</strong> HomesReport to Congress−12
Table 13.2 1995 & 1997 Resident specific and Nonresident specific <strong>Nursing</strong> Staff Time Estimates1995 & 1997 STM Pop 1995 & 1997 STM Pop WeightedNumber PercentWeightedRUG-III ADL in inClinically Smoothed RSTMinutesClinically Smoothed RST & NRSTMinGroup <strong>In</strong>dex 1995/1997 1995/1997 Staff Type Total Staff Type TotalSTM Pop STM Pop RN LVN AIDE Minutes RN LVN AIDE Minutes3,933 100% 38.7 25.9 84.4 149.0 68.8 42.2 139.0 250.0REHABILITATIONREHAB ULTRA HIGH 343 8.7%RUC 16 - 18 45 1.1% 66.8 35.8 109.0 211.6 112.7 53.8 180.1 346.6RUB 9 - 15 216 5.5% 48.8 23.0 73.9 145.7 87.7 37.4 123.8 248.9RUA 4 - 8 82 2.1% 36.5 23.4 54.4 114.3 64.5 40.4 98.4 203.3REHAB VERY HIGH 253 6.4%RVC 16 - 18 37 0.9% 51.5 30.2 102.2 183.9 90.9 50.7 164.9 306.5RVB 9 - 15 127 3.2% 53.1 25.5 83.0 161.6 94.7 41.6 136.3 272.6RVA 4 - 8 89 2.3% 40.6 16.6 55.1 112.3 75.6 30.0 106.8 212.4REHAB HIGH 235 6.0%RHC 13 - 18 82 2.1% 66.4 35.0 105.0 206.4 110.6 53.5 167.0 331.1RHB 8 - 12 112 2.8% 58.4 25.5 73.9 157.8 102.3 39.9 129.9 272.1RHA 4 - 7 41 1.0% 49.6 16.7 51.1 117.4 89.7 27.6 102.6 219.9REHAB MEDIUM 416 10.6%RMC 15 - 18 123 3.1% 68.8 44.6 114.2 227.6 111.2 66.8 180.0 358.0RMB 8 - 14 217 5.5% 56.3 25.7 80.4 162.4 101.2 42.4 141.8 285.4RMA 4 - 7 76 1.9% 54.2 19.4 60.2 133.8 95.0 33.9 117.3 246.2REHAB LOW 85 2.2%RLB 14 - 18 26 0.7% 40.3 25.6 120.4 186.3 79.0 48.9 191.3 319.2RLA 4 - 13 59 1.5% 31.2 17.8 69.6 118.6 64.5 32.0 122.8 219.3EXTENSIVE 339 8.6%SE3 NOT USED 73 1.9% 89.1 70.7 122.8 282.6 140.7 101.5 191.3 433.5SE2 NOT USED 246 6.3% 69.1 56.7 104.7 230.5 110.4 85.4 163.2 359.0SE1 NOT USED 20 0.5% 45.7 36.1 131.5 213.3 77.9 60.1 195.3 333.3SPECIAL 403 10.2%SSC 17 - 18 116 2.9% 40.8 41.9 121.1 203.8 72.9 64.3 184.1 321.3SSB 15 - 16 126 3.2% 39.6 35.5 115.2 190.3 70.9 55.0 172.4 298.3SSA 7 - 14 161 4.1% 56.5 26.8 79.6 162.9 91.7 41.7 130.4 263.8CLINICAL COMPLEX 615 15.6%CC2 17 - 18 D 11 0.3% 54.5 23.3 127.9 205.7 85.2 42.5 191.1 318.8CC1 17 - 18 75 1.9% 31.9 38.4 115.5 185.8 55.7 57.7 176.9 290.3CB2 12 - 16 D 47 1.2% 37.3 27.5 101.2 166.0 61.5 41.8 159.0 262.3CB1 12 - 16 249 6.3% 29.9 22.6 94.1 146.6 59.0 36.2 147.3 242.5CA2 4 - 11 D 41 1.0% 34.5 23.7 72.7 130.9 58.8 43.3 130.3 232.4CA1 4 - 11 192 4.9% 33.3 23.8 56.7 113.8 59.7 37.6 103.3 200.6IMPAIRED COG. 263 6.7%IB2 6 - 10 31 0.8% 22.0 20.0 77.8 119.8 40.0 32.0 137.2 209.2IB1 6 - 10 127 3.2% 22.0 18.0 73.9 113.9 39.0 32.0 130.0 201.0IA2 4 - 5 4 0.1% 20.0 15.0 60.0 95.0 38.0 27.0 100.0 165.0IA1 4 - 5 101 2.6% 20.0 15.0 50.0 85.0 33.0 26.0 96.0 155.0BEHAV. ONLY 21 0.5%BB2 2 0.1% 20.0 15.0 70.0 105.0 40.0 30.0 136.0 206.0BB1 6 - 10 5 0.1% 18.0 14.0 70.0 102.0 38.0 28.0 130.0 196.0BA2* 4 - 5 1 0.0% 19.0 15.0 50.0 84.0 38.0 30.0 90.0 158.0BA1* 4 - 5 13 0.3% 17.0 15.0 40.0 72.0 34.0 25.0 73.5 132.5PHYSICAL FUNCTION 960 24.4%PE2 16 - 18 41 1.0% 17.0 14.3 123.9 155.2 37.0 32.0 184.8 253.8PE1 16 - 18 160 4.1% 17.4 15.4 118.1 150.9 37.0 29.4 181.6 248.0PD2 11 - 15 76 1.9% 16.9 16.0 90.7 123.6 36.0 25.0 170.0 231.0PD1 11 - 15 358 9.1% 16.4 15.4 91.5 123.3 36.0 27.6 160.0 223.6PC2 9 - 10 5 0.1% 15.0 23.8 99.4 138.2 25.6 32.8 154.4 212.8PC1 9 - 10 41 1.0% 20.5 9.7 71.4 101.6 45.1 20.6 124.2 189.9PB2 6 - 8 8 0.2% 15.0 22.9 39.3 77.2 28.0 36.8 80.6 145.4PB1 6 - 8 86 2.2% 12.8 15.7 48.7 77.2 27.5 27.7 93.9 149.1PA2 4 - 5 10 0.3% 14.7 15.9 33.2 63.8 31.9 30.6 72.9 135.4PA1 4 - 5 175 4.4% 14.3 15.7 32.5 62.5 28.2 29.8 72.8 130.8(clinically smoothed where bolded)<strong>Appropriateness</strong> <strong>of</strong> <strong>Minimum</strong> <strong>Nurse</strong> <strong>Staffing</strong> <strong>Ratios</strong> in <strong>Nursing</strong> HomesReport to Congress−13
It should be noted that staff time are not measured for all residents or even a sample <strong>of</strong>residents within the facility, but rather for residents on selected units within the facility.Although we canpresume that these selected units provided a sufficient number <strong>of</strong> residents to providestaff time estimates for a residents with very different medical conditions and functionallimitations (i.e., the 44 RUGs groupings), it is possible that the time estimates for thesehigh-Medicare volume units is not representative <strong>of</strong> staff time found for similar residentsin other units. It is also difficult to know how this particular “quality review from atechnical expert panel” ensures good outcomes. We have no information about how theexperts determined high quality. <strong>In</strong> the last analysis, there appears to be no evidencethat links the staff times <strong>of</strong> the STM studies to direct measures <strong>of</strong> resident outcomes.This does not mean that the HCFA STM studies were inadequate for their centralpurpose, the development <strong>of</strong> the RUG-III and HCFA’s National Medicare SNFProspective Payment System (PPS).13.5 Conclusion: U.S. Army Workload Management System for <strong>Nursing</strong>,William Thoms’ “Management Minutes” System, and HCFA’s Staff TimeMeasurement StudiesThis chapter has examined three time-motion methods for setting nurse staff levels: theU.S. Army Workload Management System for <strong>Nursing</strong> (WMSN); William Thoms’“Management Minutes” system; and HCFA’s Staff Time Measurement studies onnursing care in nursing homes in 1995-1997. Common to all <strong>of</strong> these efforts is theattempt to identify the time it takes to complete nursing tasks for nursing homeresidents. These times are aggregated to the level <strong>of</strong> the facility and the nurse staffingrequired to provide this level <strong>of</strong> care is determined. The staffing algorithms derived fromthis method are adjusted for differences in the kind and intensity <strong>of</strong> care needed byresidents with differing levels <strong>of</strong> acuity and functional limitations. As was noted at thebeginning <strong>of</strong> this chapter, this method <strong>of</strong> deriving appropriate nursing staffing standardsis intuitively understandable, particularly to those who find the statistical modeling <strong>of</strong> theempirical approach to be too complex, or suspect. If what nursing staff actually doimpacts on some important resident outcomes, an assumption that would be hard toreject, then it would seem reasonable to determine how much time it takes to performthese necessary nursing tasks and the consequent staffing implied by this allocation <strong>of</strong>time.<strong>Appropriateness</strong> <strong>of</strong> <strong>Minimum</strong> <strong>Nurse</strong> <strong>Staffing</strong> <strong>Ratios</strong> in <strong>Nursing</strong> HomesReport to Congress−14
Nevertheless, we have found all three <strong>of</strong> these particular efforts <strong>of</strong> little value for settingstaffing standards. Both the WMSN and Thoms’ Management Minutes system weredeveloped 20-25 years ago to assist the U.S. Army and in Thoms’ case, a singlenursing home in New Hampshire, in assessing residents and the nurse staffing requiredto provide needed care. As such, they were not primarily research efforts addressed toa research community with published journal articles. <strong>In</strong>deed, the WMSN is unknown tonearly everyone working in this area. After more than two decades, we have little to noevidence on the data collection procedures and evidence produced. The mostknowledgeable person on the WMSN, Lt. Col. Harper, does not think this system,developed from an acute care hospital population, can be applied in its current form tothe typical chronic-care population found in nursing homes today. <strong>In</strong> contrast, Thoms’Management Minutes system has <strong>of</strong>ten been cited by various health servicesresearchers. Unfortunately, they all reference a 1975 unpublished paper by Thoms’ thatwe have not been able to obtain, even from Thoms himself. It appears that neither theWMSN nor Thoms’ system has attempted to link their recommended staffing levels toresidents’ outcomes. <strong>In</strong>deed, the current emphasis upon outcomes and qualityindicators was not a particularly important consideration at the time they weredeveloping their systems.<strong>In</strong> contrast to the above, HCFA’s more recent and more research intense STM studiesprovide far more information about the selection <strong>of</strong> facilities and data collectionprocedures. Further there is some attempt to select facilities on the basis <strong>of</strong> a criteriawhich is thought to be related to high quality. Unfortunately, we have found this criteriasuspect for developing a staffing standard. As we noted above, “in the last analysis,there appears to be no evidence that links the staff times <strong>of</strong> the STM studies to directmeasures <strong>of</strong> resident outcomes.” Although we have found the three time-motion effortsreview here to be an inadequate basis for setting nurse staffing standards, we think thetime-motion approach has merit. A very inventive and entirely new analysis applyingthis time-motion approach will be presented in the next chapter.<strong>Appropriateness</strong> <strong>of</strong> <strong>Minimum</strong> <strong>Nurse</strong> <strong>Staffing</strong> <strong>Ratios</strong> in <strong>Nursing</strong> HomesReport to Congress−1
CHAPTER 14.0MINIMUM NURSE AIDE STAFFING REQUIRED TOIMPLEMENT BEST PRACTICE CARE IN NURSING HOMES 1314.1 <strong>In</strong>troduction<strong>Nursing</strong> home (NH) staffing patterns evidence a heavy reliance on nurse aides to provide directassistance to residents, and controversy exists about the nurse aide-to-resident ratio needed toprovide good care. Unfortunately, the type <strong>of</strong> study that can most defensibly address thiscontroversy has not yet been conducted. There is, however, sufficient evidence about selectedcare processes to estimate minimal resident-to-nurse aide ratios needed to provide care. Drawingon this evidence, this chapter concludes that inadequate staffing may exist in many nursinghomes. The investigators arrive at this conclusion by addressing two fundamental questions:• How much nurse aide time is required to implement five specific, daily careprocesses that have been linked to resident outcomes?• Given that nurse aide labor resources vary among NHs, how might differentlevels <strong>of</strong> staffing effect the daily care that residents receive?<strong>In</strong> the first section <strong>of</strong> this chapter, investigators review existing research evidence that identifiesthe amount <strong>of</strong> time nurse aides need to provide care that has been proven effective or has beencited as “best practice.” This chapter focuses only on care processes that are performed by nurseaides, have been specifically defined (i.e., the steps involved in providing care have beendetailed), and have been linked through research evidence or expert consensus to outcomes thathave both clinical and quality-<strong>of</strong>-life implications. Given the chapter’s focus on best practices,this specific process-outcome link is required for a care process to be included in the outcomeanalyses.<strong>In</strong> the second section <strong>of</strong> this chapter, innvestigators use operational research models to projectthe number <strong>of</strong> residents who are likely to receive efficacious care processes under variousstaffing scenarios. These models are based on data and reasonable assumptions about criticalinput variables needed to project the outcomes <strong>of</strong> different staffing ratios.There are three critical input variables:13Sections 14.1 through 14.13 were written by John F. Schnelle, Borun Center forGerontological Research, Los Angeles Jewish Home for the Aging, UCLA School <strong>of</strong>Medicine and Sepulveda VA; Shan Cretin, Borun Center for Gerontological Research;Debra Saliba, Borun Center for Gerontological Research and RAND Corporation, SantaMonica, California; and Sandra F. Simmons, RAND Corporation. The conclusion section,14.14, was written by Marvin Feuerberg <strong>of</strong> HCFA with the concurrence <strong>of</strong> Jack Schnelle.Editorial assistance was provided by Jeane Nitsch and Susan Joslin, HCFA.<strong>Appropriateness</strong> <strong>of</strong> <strong>Minimum</strong> <strong>Nurse</strong> <strong>Staffing</strong> <strong>Ratios</strong> in <strong>Nursing</strong> HomesReport to Congress−2
1. The amount <strong>of</strong> time nurse aides have available to provide direct care, whichincludes care processes linked to improved clinical outcomes as well as otherroutine care processes that are necessary but may not be linked to a specificclinical outcome (e.g., answering call lights).2. The frequency with which the need for an efficacious care process arises and thenumber <strong>of</strong> residents who need it.3. The time needed to provide each episode <strong>of</strong> efficacious care.With this information as input, the operations models will provide as output:1. Estimates <strong>of</strong> the difference between the care activities that should occur ifimproved outcomes are to result and the number that actually do occur given thestaffing model being tested.2. <strong>Staffing</strong> ratios that are most likely to result in desirable clinical outcomes.<strong>In</strong> order to model the effects staffing ratios have on the care delivered, investigators needed tomake assumptions about the efficiency with which services are provided. An important output<strong>of</strong> the investigators’ analysis is an estimate <strong>of</strong> the minimum number <strong>of</strong> staff necessary tocomplete care for all residents based on the three input variables listed above. <strong>In</strong>vestigatorstherefore chose to make the conservative assumption that work is scheduled for maximum timeefficiency as opposed to individualized care scheduling (i.e., providing care that varies based onresident preferences). The investigators’ minimal staffing scenarios also resulted in a very high(perhaps unrealistically high) nurse aide work productivity. Given their assumptions, theinvestigators simulated estimates <strong>of</strong> minimal staffing should be regarded as a low bound on thenumber <strong>of</strong> staff required in real NHs, where the efficiency and productivity may be less thanoptimal. The rationale for the investigators’ approach, as well as its limitations, is morethoroughly discussed in the “Limitations and Future Directions” section 14.14 <strong>of</strong> this chapter.While investigators estimated the minimum number <strong>of</strong> staff necessary to provide care underconditions <strong>of</strong> high efficiency and productivity, the investigators did not identify specific ways forbetter managing nurse aides so as to encourage either high productivity or efficiency. <strong>Nurse</strong> aideproductivity could probably be enhanced with better management, including increasedsupervision from licensed nurses, more in-service training for aides, and management trainingfor those who supervise them — a hypothesis that the investigators strongly believe should betested under controlled conditions. Unfortunately, due to lack <strong>of</strong> data, investigators are unable toestimate the effect <strong>of</strong> using pr<strong>of</strong>essional nurse management in the staffing models they areanalyzing.<strong>In</strong>vestigators also note that they are not making a distinction between quality <strong>of</strong> care and quality<strong>of</strong> life in their choice <strong>of</strong> the care processes analyzed in this chapter for two reasons. First, eventhough the outcomes that these processes improve have high relevance to both academic<strong>Appropriateness</strong> <strong>of</strong> <strong>Minimum</strong> <strong>Nurse</strong> <strong>Staffing</strong> <strong>Ratios</strong> in <strong>Nursing</strong> HomesReport to Congress−3
definitions <strong>of</strong> quality <strong>of</strong> life (e.g., resident independence) and clinical outcomes (e.g.,continence), investigators do not believe that these constructs should be arbitrarily separated.For example, incontinent residents report that timely toileting assistance is a valuable careprocess, and the extent to which such assistance decreases wetness rates (e.g., clinical outcome)or improves resident satisfaction (e.g., quality-<strong>of</strong>-life outcome) should not be separated. Second,most <strong>of</strong> the care protocols that investigators are evaluating describe interpersonal communicationprocesses as a vital aspect <strong>of</strong> the care practice. There is evidence that residents value suchinterpersonal processes, independent <strong>of</strong> the outcomes such care produces. For example, theprompted voiding protocol that has been linked to the outcome <strong>of</strong> continence involvescommunication steps designed to give the residents personal control over their toiletingassistance. <strong>In</strong>vestigators, thus, believe that the staff time costs reported in this chapter forimplementing care processes deemed “best practices” include the time to interact with a residentin a manner consistent with high standards <strong>of</strong> both technical (e.g., rendering toileting assistance)and interpersonal (e.g., social communication) care quality. This point will be further elaboratedin the discussion later in this chapter in the section “Limitations and Future Directions.”14.2 Identification <strong>of</strong> Care PracticesThis paper projects the staffing resources required to implement care practices that have beenlinked to improved outcomes and are under the control <strong>of</strong> nurse aides. <strong>In</strong>vestigators make nojudgements about how appropriate it is to charge nurse aides with these care responsibilities; theinvestigators intent is simply to reflect current NH practice.<strong>In</strong>vestigators developed the following criteria to select care practices for analysis:1. The care process must be specifically designed.2. The care process must be primarily implemented by non-licensed direct care staffgiven current NH staffing practices.3. There must be evidence that a care process meeting the first two criteria changes aspecific outcome when implemented.4. There must be expert consensus that the care process reflects high quality NHcare.5. Assuming a care process meets criteria 1 through 4, there must be informationregarding the amount <strong>of</strong> time needed to implement it.<strong>In</strong>vestigators then reviewed research literature, practice guidelines developed using expertconsensus methodologies, and the quality indicator literature, using several search strategies toidentify care practices that might meet their criteria. <strong>In</strong>vestigators first searched the followingdatabases: Medline, Healthstar, Embase, and Ageline, using combinations <strong>of</strong> these key words:nursing homes, best practices, daily care/activities, nurse aides, workload, nursing care, time<strong>Appropriateness</strong> <strong>of</strong> <strong>Minimum</strong> <strong>Nurse</strong> <strong>Staffing</strong> <strong>Ratios</strong> in <strong>Nursing</strong> HomesReport to Congress−4
factors, incontinence, pressure sore, nutritional care/feeding behaviors, mobility, exercise,activities <strong>of</strong> daily living/independence, behavior management, agitation, mood. With thisapproach, investigators identified approximately 950 articles, which they narrowed down, basedon a review <strong>of</strong> their abstracts, to about 200 for more thorough review. Because practiceguidelines and quality indicators are seldom referenced in the traditional scientific databases,investigators used a number <strong>of</strong> other search strategies to locate these materials. They searchedthe following sources: Directory <strong>of</strong> Clinical Practice Guidelines, Guide to Clinical andPreventive Services, National Guideline Clearinghouse, National Library <strong>of</strong> Healthcare<strong>In</strong>dicators, and The Medical Outcomes and Guidelines Source Book. 1,2,3,4 <strong>In</strong>vestigatorsspecifically reviewed all guidelines developed by the American Agency for Healthcare Policyand Research and the American Medical Directors Association because <strong>of</strong> their obviousrelevance to NH care.The investigators’ ability to identify relevant practice guidelines was facilitated by a recentlycompleted project at the RAND Corporation designed to develop quality indicators for NH care.The Assessing the Care <strong>of</strong> Vulnerable Elderly Project (ACOVE) conducted comprehensiveliterature reviews, including a review <strong>of</strong> relevant practice guidelines, for the purpose <strong>of</strong>identifying process outcome relationships, which content experts then constructed into a series <strong>of</strong>quality indicators using an “IF/THEN” format. The following example illustrates this format:IF a nursing home resident incapable <strong>of</strong> independent toileting is assessed and foundcapable <strong>of</strong> appropriately using the toilet over 65% <strong>of</strong> the time,THEN the resident should be placed on a toileting assistance programBECAUSE the resident will maintain continence as long as the program is implementedconsistently.Summary: Toileting assistance interventions have proved efficacious in multi-sitecontrolled clinical trials with nursing home residents who are incapable <strong>of</strong> independenttoileting. It has been difficult to implement these care protocols in daily nursing homepractice because <strong>of</strong> data accuracy and labor intensity barriers.A panel <strong>of</strong> nine experts in NH care evaluated each indicator on a nine-point scale for: (a)Validity (Is there evidence <strong>of</strong> a process-outcome link?), (b) importance (Would this processsignificantly impact the quality <strong>of</strong> NH care if it were implemented?), and (c) feasibility (Can atypical NH be expected to implement the process?). <strong>In</strong>dicators with a median rating <strong>of</strong> seven orhigher for validity, importance, and feasibility were accepted as an indicator <strong>of</strong> NH quality. <strong>In</strong>this way, the expert panel approved 280 NH indicators, out <strong>of</strong> a total set <strong>of</strong> 479 choices forquality indicator content and wording. Twenty-two <strong>of</strong> these indicators involve care processesthat are under the control <strong>of</strong> nurse aides (e.g., toileting and changing, feeding assistance,repositioning, ADL independence enhancement, and exercise). <strong>In</strong> the literature review thatfollows this section, investigators describe in more detail these indicators. Henceforth,investigators will refer to these indicators as the “ACOVE indicators.”Ultimately, investigators identified five care processes that met their criteria and are needed bythe majority <strong>of</strong> NH residents, as will be documented in the “Literature Review” section <strong>of</strong> this<strong>Appropriateness</strong> <strong>of</strong> <strong>Minimum</strong> <strong>Nurse</strong> <strong>Staffing</strong> <strong>Ratios</strong> in <strong>Nursing</strong> HomesReport to Congress−5
chapter. These processes represent a reproducible consensus-based subset <strong>of</strong> the tasks nurseaides might provide while caring for NH residents even though the five care processes areobviously not a complete list <strong>of</strong> what nurse aides must do.• Repositioning and changing wet clothes· Repositioning and toileting· Exercise· Feeding assistance· ADL dressing independenceReluctantly, investigators excluded interventions designed to reduce agitation or improve moodas well as interventions that reportedly improved independent functioning in ADL areas otherthan dressing, feeding, and toileting. The justification for excluding these interventions isarguable in some cases. The investigators explain their decisions later in this chapter.It should also be noted that the five care processes selected for analyses include processes thatare recommended for restrained residents; that is, releasing residents every two hours to provideincontinence care, repositioning, and mobility exercise. <strong>In</strong>vestigators have not, however,included a separate set <strong>of</strong> care processes for managing or preventing restraint use despite reportsthat restraint use has been significantly reduced in NHs with training/consultativeinterventions. 5,6 Unfortunately, these studies did not report what specific care processes werechanged to produce improvements in restraint use and there is no information about how muchtime aides spent caring for residents during time periods either before or after restraints werereduced.It is noteworthy that several articles that investigators reviewed in content areas outside <strong>of</strong>restraints also reported that training interventions produced significant changes in outcomes,without documenting the care process that changed after training that led to the improvements. 7,8<strong>In</strong> particular, one study reported that nurse aide training prevented ADL decline in multiple areasas measured by the MDS. 7 This finding is surprising given that other literature suggests that careprocesses which improve ADL independence are very labor intensive. <strong>In</strong> two studies, forexample, nurse aides specifically reported that time was a barrier to implementing care processesknown to improve independence. 9,10 <strong>In</strong> contrast to these studies, the training intervention studysuggests that NHs are adequately staffed to improve ADL outcomes if employees are trained andthat time is not a barrier to implementing efficacious care processes.<strong>In</strong>vestigators believe that all studies that report that better training is sufficient to produceimproved outcomes should be replicated, with specific attention to documenting the careprocesses that led to these improved outcomes. It would be particularly important to note whatmanagement or incentive initiatives led to the sustained application <strong>of</strong> the new care processesthat were the focus <strong>of</strong> training. <strong>In</strong> any case, the absence <strong>of</strong> specific process data, particularlydata about nurse aide care behavior, forced us to exclude a number <strong>of</strong> studies from the analysesconducted in this chapter.<strong>Appropriateness</strong> <strong>of</strong> <strong>Minimum</strong> <strong>Nurse</strong> <strong>Staffing</strong> <strong>Ratios</strong> in <strong>Nursing</strong> HomesReport to Congress−6
14.3 Review <strong>of</strong> Literature Describing Process-Outcome Relationships and LaborRequirements14.3.1 Repositioning and <strong>In</strong>continence Care<strong>In</strong>vestigators integrated repositioning with an incontinence protocol on changing wet linens andanalyzed it separately from an integrated care process based on repositioning and toileting. Thereasons for both the integration and the separate analyses <strong>of</strong> the two sets <strong>of</strong> processes are asfollows:1. Repositioning and incontinence care (either toileting or changing), bothrecommended to prevent skin problems, logically should not be separated inpractice. It would be inefficient, for example, to reposition incontinent residentswithout changing them if they are wet or toileting them if they request assistance.2. One incontinence protocol will not work for all incontinent residents. Studiesshow that only 33% to 50% <strong>of</strong> incontinent residents are good candidates fordaytime toileting programs and fewer are responsive to nighttime toiletingprograms. 11,12 Also, the toileting care process is more time intensive than eitherchanging or repositioning. 13 Thus, it is necessary to evaluate the repositioningprotocol that includes toileting separately from the repositioning process thatinvolves changing, at least during the daytime.14.3.2 Repositioning and Changing ProcessesTwo separate practice guideline panels have recommended a repositioning program for residentsat risk for pressure sores based on their review <strong>of</strong> the research literature and expert opinion. 14,15For example, “the practice guideline panel for the Agency for Health Care Policy and Research(AHCPR) made two recommendations relevant to repositioning:·“Any individual, in bed, who is assessed to be at risk for developing pressureulcers should be repositioned at least every two hours if consistent with overallresident goals. A written schedule for systematically turning and repositioning anindividual should be used.” 14· “Plans for positioning <strong>of</strong> chair-bound individuals in chairs or wheelchairs shouldinclude consideration <strong>of</strong> postural alignment, distribution <strong>of</strong> weight, balance,strength, and pressure release. It is furthermore recommended that a written planfor the use <strong>of</strong> positioning devices and repositioning schedules may be helpful forchair-bound individuals.” 14With respect to incontinence management, the recommendation <strong>of</strong> the AHCPR practiceguideline panel is as follows: “Minimize skin exposure to incontinence, perspiration, or wounddrainage. When these sources <strong>of</strong> moisture cannot be controlled, underpads or briefs that are<strong>Appropriateness</strong> <strong>of</strong> <strong>Minimum</strong> <strong>Nurse</strong> <strong>Staffing</strong> <strong>Ratios</strong> in <strong>Nursing</strong> HomesReport to Congress−7
made <strong>of</strong> materials that absorb moisture and present a quick-drying surface to the skin may beused.”Supporting the validity <strong>of</strong> the practice guideline recommendations, the ACOVE consensus panel,charged with evaluating indicators to assess NH quality, approved the following indicator: “If arisk assessment score indicates that a resident is ‘at risk’ for pressure ulcer development, then apreventive intervention should be instituted that addresses pressure reduction and the resident’srepositioning needs because reducing or eliminating risk factors can prevent pressure ulcerformation.”This widespread acceptance <strong>of</strong> repositioning and changing programs by multiple expertconsensus panels is based on extensive indirect and limited direct evidence. Two studiesreported a relationship between spontaneous body movement and the incidence <strong>of</strong> pressureulcers or other skin conditions, but only one <strong>of</strong> these studies evaluated the effects <strong>of</strong> anintervention that increased body movement. 16,17 This uncontrolled study reported beneficialeffects on pressure ulcers when residents were turned every two to three hours. 16 Supporting thehypothesis that incontinence and infrequent body movement are risk factors for pressure ulcers, athird prospective study demonstrated that a subject’s score on the Braden Skin Risk Assessment<strong>In</strong>ventory, which includes incontinence and mobility rankings, is predictive <strong>of</strong> pressure ulcerdevelopment. 18With regard to the importance <strong>of</strong> incontinence management, one study reported a positiverelationship between the frequency <strong>of</strong> urinary or fecal incontinence and skin conditionsassociated with pressure ulcer development. 17 This study suggested that more timely changing ortoileting <strong>of</strong> incontinent residents might reduce the deleterious effect <strong>of</strong> skin wetness and fecalexposure on skin health. <strong>In</strong> support <strong>of</strong> the hypothesis that skin wetness exacerbates skinproblems, the AHCPR consensus panel on pressure sore prevention reviewed four studies thatfound that absorbent materials, which minimize the skin’s exposure to wetness, reduced theincidence <strong>of</strong> skin irritations. 14 Unfortunately, no controlled study has documented the effect onskin conditions <strong>of</strong> an intervention that combines better repositioning and incontinence care. Oneuncontrolled study, however, showed positive intervention effects. This study reportedsignificant reductions in the incidence <strong>of</strong> pressure ulcers following implementation <strong>of</strong> amultifaceted protocol, which included more frequent repositioning. The study, however, did notspecifically describe how much the repositioning care process changed from baseline tointervention. 19The importance <strong>of</strong> incontinence management is further underscored by evidence that NHresidents value the timely changing <strong>of</strong> wet linens. Residents interviewed in one study reported apreference to be changed two times per eight-hour period, and consumer focus groups have20, 21consistently reported that they value timely toileting and changing assistance.14.3.3 Repositioning and Toileting Process<strong>Appropriateness</strong> <strong>of</strong> <strong>Minimum</strong> <strong>Nurse</strong> <strong>Staffing</strong> <strong>Ratios</strong> in <strong>Nursing</strong> HomesReport to Congress−8
Two separate practice guidelines have recommended toileting assistance programs as a treatmentprocess for NH residents. 22,23 The AHCPR practice guidelines for urinary incontinence in adultspresent the following recommendation: “Prompted voiding is recommended in residents who canlearn to recognize some degree <strong>of</strong> bladder fullness or the need to void or who can ask forassistance or respond when prompted to toilet. Residents who are appropriate for promptedvoiding may not have sufficient cognitive ability to participate in other more complex behavioraltherapies.”Two quality indicators developed by the ACOVE project reinforce the importance <strong>of</strong> bothtoileting assistance programs and an assessment protocol for identifying responsive residents forthese programs. The first <strong>of</strong> these two quality indicators is: “If a NH resident incapable <strong>of</strong>independent toileting is assessed and found capable <strong>of</strong> appropriately using the toilet over 65% <strong>of</strong>the time, then the resident should be placed on a toileting assistance program because theresident will maintain continence as long as a program is implemented consistently.” Thecorrelated diagnostic or assessment quality indicator recommendation is: “If a NH residentcontinues to be incontinent after transient causes <strong>of</strong> incontinence are treated, then the residentshould be placed on a three- to five-day toileting assistance trial because this assessment ispredictive <strong>of</strong> long-term responsiveness to a toileting assistance program.” It is noteworthy thateven though these indicators exceeded the median ratings necessary for acceptance on validityand importance criteria (7 on a 9-point scale), they were rated as only marginal on theirfeasibility <strong>of</strong> implementation in a typical NH because <strong>of</strong> the panel’s concerns about staffinglimitations.There is strong direct evidence that toileting assistance programs reduce incontinence. Fourcontrolled trials have tested toileting assistance programs for NH residents. Three studies, with acombined total <strong>of</strong> 289 subjects, reported a 25%, 30%, and 50% decrease in incontinencefrequency in their intervention groups compared to the subject’s baseline levels, as well assignificant differences between the intervention and control groups. The fourth study, with 88subjects, reported that 86% <strong>of</strong> the treatment group showed improvements, with 30% reducingtheir incontinence frequency by 25%. The control group showed no significant change inincontinence frequency. 24,25,26,27As reported earlier in this chapter, there is strong evidence that only 33% to 50% <strong>of</strong> NH residentsare good candidates for toileting assistance programs. Two separate studies reported that 40%and 41% <strong>of</strong> residents who participated in a prompted voiding trial significantly improved theirdryness and appropriate-toileting rates. 11,12 The remaining subjects in these trials did not showsignificant improvement, so it was recommended that they be managed with a timely changingprogram. Studies also show that residents who are responsive to toileting assistance programscan be identified in a three-day assessment period. A validated assessment protocol alreadyexists for efficiently identifying such residents.<strong>In</strong> addition to this clinical evidence, there is also evidence that residents value toiletingassistance. One recent study reported that NH consumers prefer assistance with toileting two tothree times per day when they are out <strong>of</strong> bed. 20 A second study reported that NH residents preferconsistent toileting assistance to other “perks” such as private rooms and better food. 28<strong>Appropriateness</strong> <strong>of</strong> <strong>Minimum</strong> <strong>Nurse</strong> <strong>Staffing</strong> <strong>Ratios</strong> in <strong>Nursing</strong> HomesReport to Congress−9
<strong>In</strong> sum, there is strong evidence that residents value daytime toileting programs and that suchprograms effectively improve dryness outcomes during their implementation (typically between7:00 a.m. to 7:00 p.m.).More recent evidence suggests that incontinence care during he night must be conducteddifferently than during the day. Two studies documented that incontinence care routines, as theyare typically conducted in NHs, disrupt residents’ sleep, and one study reported that a nighttimetoileting assistance program was significantly less effective than a daytime program. 29,30,31 Thisreduction in effectiveness occurred even for those residents who were highly responsive to adaytime toileting assistance program.Acknowledging the importance <strong>of</strong> sleep in the overall health and quality <strong>of</strong> life <strong>of</strong> NH residents,one recent study recommended that incontinence care be individualized at night based on aresident’s sleep/wake patterns. This individualized intervention was accomplished by checkingand changing incontinent residents at night if they were awake. Residents were left undisturbedfor up to five hours if they were observed sleeping. This intervention did not include toiletingassistance, but it did significantly reduce nighttime awakenings due to incontinence care withoutadversely affecting skin health. 3214.3.4 <strong>In</strong>continence Care: Labor EstimatesThere is extensive data about the time required per episode <strong>of</strong> incontinence care and the number<strong>of</strong> residents who are likely to need incontinence-related assistance. According to the most recentOnline Survey Certification Reporting System (OSCAR), 1997 data, 49% <strong>of</strong> NH residents areincontinent, 8% have a catheter, and 14% are on a bladder training program and, thus,presumably need toileting assistance. 33 <strong>In</strong> fact, 75% <strong>of</strong> NH residents are reportedly eitherdependent or require assistance with toileting according to OSCAR. These percentagesapproximate those reported for specific NHs that have participated in incontinence managementresearch trials. These trials, which have generally excluded people who are catheterized orunable to respond to verbal stimuli, report that 60% <strong>of</strong> NH residents are incontinent, withapproximately 33% to 50% <strong>of</strong> these residents responsive to daytime toileting assistanceinterventions. 11,12According to one report, the nursing time required to reposition a resident is 3.5 minutes. 34Repositioning is recommended every two hours when the resident is in bed and more frequentlywhen the resident is in a chair. However, because most residents who require repositioning alsohave mobility and incontinence problems, it seems most efficient to either change or toilet theseresidents at the time <strong>of</strong> repositioning. Studies show that incontinent residents are wet and needchanging approximately eight times in a 24-hour period, with incontinence episodes roughlydistributed equally over the 24-hour period. 35 Calculations show that the time per episode <strong>of</strong>changing is approximately 5.5 minutes, with repositioning occurring during the changingprocess. 13 Based on this data, a resident who is not a candidate for a toileting program wouldrequire four changes with associated repositioning between 7:00 a.m. and 7:00 p.m., at a time<strong>Appropriateness</strong> <strong>of</strong> <strong>Minimum</strong> <strong>Nurse</strong> <strong>Staffing</strong> <strong>Ratios</strong> in <strong>Nursing</strong> HomesReport to Congress−10
cost <strong>of</strong> 5.5 minutes per episode. Also during this period, these residents would need to berepositioned two more times when they are dry, at a time cost <strong>of</strong> approximately 3.5 minutes perepisode. With this schedule, these residents would receive care every two hours during daytimeperiods. From 7:00 p.m. to 7:00 a.m., these residents would need another four changes andrepositioning. The nighttime schedule would consider a resident’s need for sleep, soincontinence care and repositioning would be provided less frequently than every two hours. 32With regard to providing toileting assistance to the 33% to 50% <strong>of</strong> incontinent residents who arelikely to be responsive to such care, evidence shows that toileting assistance consumesapproximately 7.5 minutes <strong>of</strong> staff time per episode. 13 How frequently residents need toileting ismore controversial, but it has been shown that when residents are <strong>of</strong>fered assistance every twohours and toileted only when they respond affirmatively, they toilet approximately four times ina 12-hour period. 28 Given that toileting programs have not proven successful at night,investigators are not projecting time to implement a nighttime toileting program, even for thoseresidents who toilet during the day. The investigators project that approximately 40% <strong>of</strong>incontinent residents who are responsive to daytime toileting programs would request threetoileting assists between 7:00 a.m. and 7:00 p.m. at a time cost <strong>of</strong> 7.5 minutes per episode. Theywill also need an additional three repositionings during this period, at a time cost <strong>of</strong> 3.5 minutesper episode. During nighttime hours (7:00 p.m. to 7:00 a.m.), investigators project thatincontinence care time costs for these residents will be the same as for residents who are notresponsive to toileting programs. All nighttime time costs are based on the premise that fourrepositionings and changes occur in consideration <strong>of</strong> a resident’s sleep. 32Data from observational studies have described how incontinence care is conducted under usualNH conditions, with relevance to the time costs associated with implementing incontinence careprotocols. These studies show that residents are toileted and changed less frequently thanresidents prefer or clinical evidence indicates is effective. Studies conducted between 1988 and1998 in six homes in two states show that changing occurs at a rate <strong>of</strong> .57 to 1.13 times perincontinent resident over an eight-hour daytime period and toileting occurs at a rate <strong>of</strong> .23 to .49times per incontinent resident over the same period. 13,20 During the night, observational dataindicate that toileting assistance seldom occurs (perhaps appropriately, given data that show mostresidents will not toilet at night) but changing occurs one to three times per resident, <strong>of</strong>ten whilethe residents are asleep. 29,30 These data suggest that nurse aides either do not have adequate timeto provide incontinence care or work in a fashion that precludes higher levels <strong>of</strong> care or both.<strong>In</strong>deed, in two studies, the researchers suggested that nursing staff report that inadequate time istheir primary barrier to implementing incontinence care protocols consistently. 36,3714.3.5 Feeding AssistanceExperts agree that feeding assistance interventions are an important component <strong>of</strong> NH care. Onepractice guideline on nutritional care as well as the MDS-based Resident Assessment Protocols(RAPs) which are used in all NHs, recommend a trial <strong>of</strong> feeding assistance for residents who eat<strong>Appropriateness</strong> <strong>of</strong> <strong>Minimum</strong> <strong>Nurse</strong> <strong>Staffing</strong> <strong>Ratios</strong> in <strong>Nursing</strong> HomesReport to Congress−11
less than 75% <strong>of</strong> most meals. 38,39 The ACOVE expert consensus panel also rated feedingassistance as an important indicator <strong>of</strong> nutritional care quality. The panel’s approved indicatorreads as follows: “If a resident requires assistance for feeding (i.e., MDS eating dependency itemscores <strong>of</strong> 1, supervision, 2, limited assistance, 3, extensive assistance, or 4, total dependence),then NH staff should promote increased independence and self performance with graduatedprompting protocols matched to residents’ need.” The panel agreed that this indicator was validand clinically important but there was less enthusiasm about how feasible this indicator would beto implement in a typical NH because <strong>of</strong> staffing limitations. These practice guideline, MDS-RAP, and expert consensus panel recommendations are supported by both indirect and directevidence.Many studies support the hypothesis that low staffing levels and a resulting lack <strong>of</strong> adequate staffto provide feeding assistance results in undernutrition and excessive feeding dependency amongresidents. These problems occur not only among residents who are completely dependent onstaff assistance to eat, but also among many residents who are partially independent.<strong>In</strong>vestigators reviewed a series <strong>of</strong> studies that document an association between NH staffingpatterns, eating dependency, and undernutrition. 40,41,42 Abassi & Rudman (1993) divided 27Veterans Administration NHs into two groups: Those with a high rate <strong>of</strong> undernutrition (asdefined by residents’ weights and albumin levels) and those with a low rate <strong>of</strong> undernutrition. Acomparison <strong>of</strong> the two groups showed that in homes with high undernutrition rates, staff wereless aware <strong>of</strong> undernutrition among residents; a higher percentage <strong>of</strong> residents were eatingdependent;and nursing staff-to-resident ratios were lower. 40 A cross-sectional, observationalstudy involving 200 NH residents in Canada found that undernutrition was positively associatedwith eating-dependency, poor positioning for eating, slow eating, poor appetite, low activitylevels, impaired communication ability, poor mental state, and dysphagia. 42 Kayser-Jones andcolleagues (1997) conducted an observational study <strong>of</strong> 58 residents in two NHs during all mealsfor seven days. Findings showed that inadequate staffing and inadequate supervision <strong>of</strong> nurseaides responsible for providing feeding assistance resulted in multiple problems that contributedto low oral intake and poor quality <strong>of</strong> life for residents. 41 The problems identified included thefollowing: the majority <strong>of</strong> residents were fed in bed instead <strong>of</strong> the dining room; food was servedat inappropriate temperatures; feeding assistance was rendered in a sporadic, rapid manner evento residents who ate slowly due to swallowing difficulties; eating assistance was forced uponresidents who could eat independently but did so slowly; and some residents received little or n<strong>of</strong>ood at all. <strong>In</strong> this study, the nurse aides themselves reported that they lacked sufficient time toadequately help all eating-dependent residents. Overall, the results <strong>of</strong> these studies stronglysuggest that inadequate NH staffing and supervision during mealtimes adversely affects thenutritional status <strong>of</strong> residents who require staff assistance to eat and may diminish the quality <strong>of</strong>the mealtime experience for all NH residents.A second series <strong>of</strong> studies documents the amount <strong>of</strong> time that staff spend providing feedingassistance and/or describes the type <strong>of</strong> assistance provided. Four <strong>of</strong> the studies recruitedresidents who were completely eating-dependent, according to NH staff ratings. Amella (1999)observed 53 resident-nurse aide dyads in one NH for one (breakfast) meal. The average length<strong>Appropriateness</strong> <strong>of</strong> <strong>Minimum</strong> <strong>Nurse</strong> <strong>Staffing</strong> <strong>Ratios</strong> in <strong>Nursing</strong> HomesReport to Congress−12
<strong>of</strong> time that assistance was provided to these eating-dependent residents was 15.66 minutes (+7.83). 43Backstrom and colleagues (1987) instructed NH staff at 24 facilities to take notes at every mealfor 28 days for a sample <strong>of</strong> 214 eating-dependent residents. 44 The staff reported that most (94%)meals in which residents were “spoon-fed” were completed in 20 minutes or less. The mediannumber <strong>of</strong> staff providing feeding assistance to any one resident during this four-week periodwas 16 to 20 different nurse aides. The authors report that the variability in the number <strong>of</strong> staffproviding assistance and the small amount <strong>of</strong> time spent providing physical assistance “could notcreate situations that promote self-feeding or harmonious assisted-feeding.”Ohwaki and colleagues (1988) studied a group <strong>of</strong> 111 pr<strong>of</strong>oundly mentally retarded, severelyphysically handicapped individuals with multiple medical problems. 45 It should be noted thatthis study did not include a NH sample (subjects’ ages ranged from 3 months to 11 years);however, all subjects were completely eating-dependent, with severe cognitive and physicalimpairments. The study showed that pr<strong>of</strong>essional caregivers spent an average <strong>of</strong> 57 minutes aday (i.e., 19 minutes/meal) providing feeding assistance. Specifically, caregivers reported thatthey provided oral feeding assistance for 72 minutes per day (i.e., 24 minutes/meal) and tubefeeding for 43 minutes a day. Caregivers also reported, however, that they did not have enoughtime to provide “optimal” assistance, which they defined as the provision <strong>of</strong> social interactionduring meals.Findings from other caregiver studies support the perception <strong>of</strong> NH caregivers that they lacksufficient time to provide optimal assistance. Hu and colleagues (1986) compared the amount <strong>of</strong>time that NH staff in three facilities spent providing care to a sample <strong>of</strong> 25 demented residents tothe amount <strong>of</strong> time that family caregivers spent providing the same type <strong>of</strong> care to 19 dementedelderly living in their own homes. 46 All subjects had to score below 20 on the MMSE to beincluded in the study. Functional assessments were conducted with all subjects to determine theextent <strong>of</strong> their physical impairment. <strong>Nurse</strong>s and family caregivers were asked to keep “costdiaries” for two weeks to document the amount <strong>of</strong> time they spent meeting a variety <strong>of</strong> daily careneeds including, but not limited to, feeding assistance. According to these “cost diaries,” NHstaff spent an average <strong>of</strong> 16 minutes per day (i.e., < 6 minutes per meal) providing feedingassistance while family caregivers spent an average <strong>of</strong> 73 minutes a day (i.e., 24 minutes permeal). For the more severely cognitively impaired subjects (MMSE score < 10), NH stafffeeding times increased slightly to an average <strong>of</strong> 18 minutes per day. By contrast, familycaregivers increased feeding times for these more severely impaired individuals to an average <strong>of</strong>99 minutes per day. Across all daily care areas, family caregivers, compared to NH staff, spentsignificantly more time providing both supervision and assistance, despite the fact that,according to the functional assessments, the elderly subjects residing at home were moreindependent in all activities <strong>of</strong> daily living than the NH sample. The authors explain thedifference in feeding assistance times by noting, “One nursing aide can feed and supervise eightto ten residents at the same time,” whereas, at home, a family caregiver “must devote his or herentire attention to a single person.” Based on the previously reviewed, more recent studies thatshow a significant association between staffing ratios and undernutrition, 40,41,42 it is unlikely that<strong>Appropriateness</strong> <strong>of</strong> <strong>Minimum</strong> <strong>Nurse</strong> <strong>Staffing</strong> <strong>Ratios</strong> in <strong>Nursing</strong> HomesReport to Congress−13
nurse aides can adequately feed and supervise eight to ten residents. Rather, the time spent byfamily caregivers (i.e., 24 minutes per meal) 46 is probably more reflective <strong>of</strong> the time needed toprovide “optimal” feeding assistance.Two other studies have documented the amount <strong>of</strong> time that NH residents have access to theirmeal trays and/or receive feeding assistance. 47,48 These studies used subject samples that variedin their eating-dependency status. Steele and colleagues (1997) showed that, in one NH with aresident population representing the full range <strong>of</strong> feeding assistance needs (i.e., completelyindependent to completely dependent), the amount <strong>of</strong> time needed to complete a meal was lessthan 20 minutes for 13% <strong>of</strong> the residents, 20 to 29 minutes for 35%, 30 to 39 minutes for 34%,and 40 minutes or more for 18%. The average time to complete a meal for the group was 29minutes (ranging from 5 to 70). The researchers did not report the total times needed tocomplete a meal for independent eaters versus residents who required assistance. They also didnot present data useful for evaluating the quality or outcomes <strong>of</strong> the mealtime experience (e.g.,how much residents ate and/or whether individual residents received appropriate types <strong>of</strong>assistance). 47Durnbaugh and colleagues (1996) conducted a study in four NHs using a sample <strong>of</strong> 20 residentswho had been diagnosed with probable Alzheimer’s disease (AD). The purpose <strong>of</strong> the study wasto test the utility <strong>of</strong> the Feeding Behaviors <strong>In</strong>ventory as an instrument to help NH staff identifymealtime behaviors that interfered with a resident’s self-feeding ability. The Feeding Behaviors<strong>In</strong>ventory involved direct observations <strong>of</strong> two meals per subject. Study results showed that allsubjects displayed “problem behaviors” (i.e., behaviors that interfered with intake) duringmealtimes, with the most common problem being “distractibility” (i.e., easily distracted fromeating). On average, residents had access to their trays and were engaged in eating for 38.8minutes (ranging from 13 to 54 minutes). Most residents, however, had to wait in the diningroom for more than 20 minutes to receive their trays. The authors reported that the amount andtype <strong>of</strong> assistance rendered to individual residents varied, but they did not report the extent <strong>of</strong>this variability. They concluded that distractibility was a major problem among AD residentsand, thus, suggested that the dining room environment be modified (e.g., to reduce noise levels)and verbal cues be provided to maximize AD residents’ self-feeding ability. 48A study by Osborn and Marshall (1993) used the Self-Feeding Assessment Tool to determineeating dependency status for a small sample <strong>of</strong> 23 partially-dependent NH residents withmoderate to severe cognitive impairments. 49 The researchers conducted individual assessments<strong>of</strong> capability (one meal) and performance (one meal) over a total <strong>of</strong> two meals per subject. Thetool included a rating <strong>of</strong> five levels <strong>of</strong> assistance: unassisted, verbal prompt, nonverbal prompt,physical guidance, and full assistance. Capability was determined through the implementation <strong>of</strong>a graduated-assistance protocol that maximized self-feeding ability; performance was assessedthrough observations <strong>of</strong> the feeding assistance provided by NH staff. Based on the capabilityassessment, every subject was capable <strong>of</strong> self-feeding to some degree; rarely did research staffhave to provide full physical assistance. By contrast, the performance assessment showed thatNH staff almost always provided full physical assistance. Using research staff assessments <strong>of</strong>capability as the “gold standard,” NH staff “over-assisted” 52% <strong>of</strong> the subjects and “under-<strong>Appropriateness</strong> <strong>of</strong> <strong>Minimum</strong> <strong>Nurse</strong> <strong>Staffing</strong> <strong>Ratios</strong> in <strong>Nursing</strong> HomesReport to Congress−14
swallowing problems that placed them at risk for undernutrition and/or dehydration. The threeinterventions were: (1) the availability <strong>of</strong> trained volunteers during one meal per day (i.e., lunchor dinner) to transport residents to and from the dining room and provide feeding assistance; (2)a daily afternoon “Happy Hour” during which residents were transported to a central area andfluids and snacks were provided to residents in a social context; and (3) a separate, “secondseating” in the dining room during lunchtime, designed specifically to meet the needs <strong>of</strong>residents who required feeding assistance and/or experienced swallowing difficulties. 52 Theauthors report that, prior to implementing the intervention programs, residents with feedingand/or swallowing difficulties were fed in their rooms and, as a result, were “<strong>of</strong>ten poorlypositioned for eating, left in bed for many hours <strong>of</strong> the day, and rushed in the eating process” dueto staffing limitations. The 40 subjects were divided into four groups. Group One (5 residents)received feeding assistance from NH staff for all meals and snacks in their rooms. Group Two (9residents) received feeding assistance from NH staff for all meals in their rooms, but alsoattended “Happy Hour” every afternoon. Groups Three and Four (13 residents per group) bothreceived feeding assistance from NH staff during breakfast and dinner in their rooms but weretransported to the dining room for lunch (Volunteer and Second Seating programs) and attendedHappy Hour every day. The only difference between groups three and four was that NH staffbegan monitoring weights during the first month <strong>of</strong> program implementation for Group Threeand after one month <strong>of</strong> implementation for Group Four.The primary outcome measure reported in this study was change in weight status over threemonths. Group One showed an average weight loss (-1.4 lbs) while Groups Two, Three, andFour all showed weight gains (average + 2.6, 4.2, and 6.2 lbs, respectively). Although thesample sizes within each group were small, these results indicate that providing adequate feedingassistance in a social environment may improve the nutritional status <strong>of</strong> NH residents withfeeding and/or swallowing difficulties.<strong>In</strong> light <strong>of</strong> the absence <strong>of</strong> intervention studies in this area, the Borun Center is currentlycollecting preliminary data necessary to design a controlled clinical trial <strong>of</strong> a feeding assistanceintervention. These data provide specific information about the efficacy and time costs <strong>of</strong>feeding assistance protocols, which is generally absent from the published literature; thus, thedata are highly relevant to this chapter.This preliminary study used a sample <strong>of</strong> 19 residents in one NH who were considered to be “atrisk” for undernutrition due to low food intake. Low food intake was defined as eating less than75% <strong>of</strong> five or more <strong>of</strong> nine meals on three days within one week (i.e., MDS criteria foridentifying low intake), and research staff evaluated intake for each <strong>of</strong> the 19 subjects. Theintervention, pilot-tested during two meals for each subject, used the following methodology: (a)Research staff asked residents where they would prefer to eat (i.e., in their own room versus thedining room) and, whenever possible, complied with residents’ requests; (b) research staffinsured that residents were positioned properly for eating; (c)research staff interacted sociallywith residents throughout the meal, and (d)research staff provided continuous one-on-oneassistance that maximized self-feeding ability (i.e., encouragement, verbal prompts, physicalguidance, physical manipulation <strong>of</strong> items on meal tray so that items were easily accessible to<strong>Appropriateness</strong> <strong>of</strong> <strong>Minimum</strong> <strong>Nurse</strong> <strong>Staffing</strong> <strong>Ratios</strong> in <strong>Nursing</strong> HomesReport to Congress−16
esident). With respect to location <strong>of</strong> meals, research staff were able to comply with thepreferences <strong>of</strong> the majority (13) <strong>of</strong> subjects. Such compliance may have contributed to improvedintake for these subjects. Specifically, eight residents preferred to eat in the dining room, fiveresidents preferred their rooms, two residents “didn’t care,” one was unable to state a preference,and the remaining three preferred a location with which staff could not comply (i.e., own home,restaurant). Common problems observed during mealtimes included complaints about food (11residents), slow eating pace (10 residents), swallowing difficulties (5 residents), and, consistentwith findings from one previously reviewed study (Durnbaugh et. al., 1996), distractibility (6residents). Residents also had unlimited access to their meal trays. A different research staffmember conducted continuous, direct observations throughout the meal for all subjects and allmeals in order to document the extent <strong>of</strong> research staff assistance (i.e., type and frequency) andthe amount <strong>of</strong> time required to provide assistance. <strong>In</strong> addition, photographs <strong>of</strong> meal trays weretaken before and after each meal to document intake. Prior to implementing the intervention,research staff conducted continuous direct observations <strong>of</strong> NH staff during two meals for eachsubject in order to document the extent <strong>of</strong> NH staff assistance (i.e., type, frequency, and time).The 19 subjects represented a full range <strong>of</strong> eating assistance needs (i.e., completely independentto completely dependent). Table 14.1 presents some <strong>of</strong> the primary outcomes this studymonitored. On average, the subjects were responsive to the research staff’s intervention asmeasured by a significant increase in total percentage <strong>of</strong> food and fluid intake (t = 2.38, p < .05).<strong>Appropriateness</strong> <strong>of</strong> <strong>Minimum</strong> <strong>Nurse</strong> <strong>Staffing</strong> <strong>Ratios</strong> in <strong>Nursing</strong> HomesReport to Congress−17
Table 14.1 Effects <strong>of</strong> a Behavioral and Environmental <strong>In</strong>tervention toImprove <strong>In</strong>takeNH Staff(Mean + Sd)Research Staff-<strong>In</strong>tervention(Mean + Sd)<strong>In</strong>take - Total % (food+ fluid)Verbal Prompts -Total Number/MealTime ProvidingAssistance (minutes)Tray Access Time(minutes)39% (+ 11%) 52% (+ 24%)0.8 (+ 1.6) 16.3 (+ 11.7)5.0 (+ 7.2) 40.1 (+ 14.235.4 (+ 15.7) 40.1 (+ 14.2)An analysis <strong>of</strong> individual data, however, showed that 12 (63%) <strong>of</strong> the 19 subjects significantlyincreased their intake as a result <strong>of</strong> the intervention, while the remaining seven subjects showedonly small increases (i.e., < 10% gain) in intake. Five <strong>of</strong> these seven subjects reported generalcomplaints related to the food itself (e.g., taste, appearance) while the remaining two expressedsignificant symptoms <strong>of</strong> depression in a structured interview and reported not being “hungryenough” to eat.Research staff assistance was compared to NH staff assistance with respect to the total time spentproviding any type <strong>of</strong> assistance (i.e., physical and/or verbal) and the number <strong>of</strong> verbal promptsprovided to residents throughout the meal to encourage self feeding. Findings showed thatresearch staff spent significantly more time providing assistance (t = 11.14, p < .001) and <strong>of</strong>feredsignificantly more verbal prompts (range 1 to 50 per meal, mode=23; t = 5.54, p < .001) than NHstaff (range 0 to 6 per meal, mode=0). <strong>In</strong>terestingly, tray access time did not differ significantlyas a result <strong>of</strong> the intervention. These observational data describing what NH staff normally doduring mealtimes are consistent with those reported in other studies previously reviewed in thischapter.Despite the absence <strong>of</strong> larger, published trials describing the efficacy <strong>of</strong> feeding assistanceinterventions, there is strong expert consensus about the importance <strong>of</strong> providing NH residentswith consistent assistance that maximizes their feeding ability. One expert consensus panelrecently recommended that staffing levels, particularly the number <strong>of</strong> nurse assistants, beincreased during mealtimes. Specifically, the panel recommended lowering the current ratio <strong>of</strong>seven to nine residents per Certified <strong>Nursing</strong> Assistant (CNA) during the day and 12 to 15residents per CNA during the evening to three or four residents per CNA during both shifts, atleast during mealtimes and for those residents who are eating dependent. The panel alsorecommended that a registered nurse be available during both shifts to provide adequate<strong>Appropriateness</strong> <strong>of</strong> <strong>Minimum</strong> <strong>Nurse</strong> <strong>Staffing</strong> <strong>Ratios</strong> in <strong>Nursing</strong> HomesReport to Congress−18
supervision, appropriate assessment <strong>of</strong> resident feeding needs, and assistance to those residentswho are more difficult or time consuming to feed. Panel members agreed that 30 to 60 minutes<strong>of</strong> nursing staff time per resident is necessary to provide “optimal” feeding assistance. 5014.3.6 Feeding Assistance: Labor Estimates<strong>In</strong>vestigators have reviewed strong evidence that residents receive inadequate feeding assistanceunder usual NH care conditions. <strong>In</strong> addition, case studies, expert consensus, and preliminaryintervention data suggest that appropriate, consistent feeding assistance can improve food intake,at least under conditions in which such assistance is rendered with one-on-one supervision at atime cost <strong>of</strong> approximately 25 to 60 minutes per resident. The remaining key issue indetermining the labor requirements <strong>of</strong> a feeding assistance intervention is how many residentsare likely to require such assistance.Estimates <strong>of</strong> the percentage <strong>of</strong> NH residents who require some level <strong>of</strong> feeding assistance rangefrom approximately 30% to 50%, or higher. The estimates vary due to differences in definitions<strong>of</strong> “assistance” (e.g., total versus partial) and the type <strong>of</strong> assessment used to determine eatingdependency (e.g., NH staff ratings, direct observations <strong>of</strong> residents during meals, response tograduated feeding assistance protocols that maximize self-feeding capability). A review <strong>of</strong> thesestudies follows.All community NHs and some VA facilities use standardized assessment tools to rate residents’level <strong>of</strong> dependency in various activities <strong>of</strong> daily living (ADLs), including eating ability. Across-sectional study <strong>of</strong> MDS data for 6832 residents from 202 NHs in seven states showed that27.9% were “dependent” on staff for eating. Residents’ level <strong>of</strong> dependency (e.g., partial or full)was not specifically reported in this study. 54 The national OSCAR data, which is also based onNH staff ratings <strong>of</strong> dependency status, indicates that 48% <strong>of</strong> the NH population requires somelevel <strong>of</strong> assistance (i.e., supervision to full assistance). 33Another study, conducted in a VA facility, examined the nutritional status <strong>of</strong> 130 residents usingthe <strong>Nursing</strong> Patient Classification. The subject sample represented 92% <strong>of</strong> the total residentpopulation. <strong>In</strong> this study, 6% <strong>of</strong> the subjects were rated as “completely independent” in allADLs, including eating; 45% were rated as requiring “partial assistance” in one or more ADLs;and 50% were rated as “completely dependent” in all ADLs. 55 Thus, a minimum <strong>of</strong> 50% <strong>of</strong> theresidents required full feeding assistance. This estimate is conservative because an unknownnumber <strong>of</strong> additional residents required “partial assistance” with eating.<strong>In</strong>stead <strong>of</strong> examining MDS data, Siebens and colleagues (1986) asked all NH staff (i.e., licensednurses and nursing assistants) in one facility to complete a questionnaire about the diets, upperextremity dysfunction, signs <strong>of</strong> dysphagia, and self-feeding ability <strong>of</strong> 240 residents. A physicianand speech-language pathologist conducted chart reviews and independent examinations <strong>of</strong> asub-sample <strong>of</strong> 131 residents. It is unclear, however, whether these independent examinationsincluded an evaluation <strong>of</strong> self-feeding ability. The NH staff reported that 47% <strong>of</strong> the subjectswere “dependent”. Of these subjects, according to NH staff, 33% required only “verbal<strong>Appropriateness</strong> <strong>of</strong> <strong>Minimum</strong> <strong>Nurse</strong> <strong>Staffing</strong> <strong>Ratios</strong> in <strong>Nursing</strong> HomesReport to Congress−19
supervision” while 67% required physical assistance. Residents who required physicalassistance represented 32% <strong>of</strong> the total NH population. Staff also reported that the need forphysical assistance was variable for this group, with approximately 50% requiring physicalassistance “all <strong>of</strong> the time” (i.e., every meal) and 50% requiring physical assistance “part <strong>of</strong> thetime” (i.e.,. some meals and not others). 56Other studies have determined the prevalence <strong>of</strong> eating-dependency through direct observations<strong>of</strong> mealtimes and documentation <strong>of</strong> the level <strong>of</strong> staff assistance provided to individual residents.Implied in these studies is that staff have accurately assessed each resident’s need for feedingassistance and are, thus, providing the appropriate level <strong>of</strong> assistance. This assumption may beflawed, because it is unclear what assessments NH staff conduct to determine a resident’s needfor feeding assistance. For example, Steele and colleagues (1997) conducted an observationalstudy in which a Mealtime Screening Tool was administered to 349 residents in one facility. Thetool was used to assess “current feeding assistance patterns” as provided by the indigenous NHstaff, based on an observation <strong>of</strong> each subject for one complete meal. The primary purpose <strong>of</strong>the tool was to identify eating-related difficulties that interfered with oral intake. Based on theobservations, research staff rated 51% <strong>of</strong> the subjects as “independent” and 49% as “dependent”or requiring (e.g., receiving) some level <strong>of</strong> staff assistance. The types <strong>of</strong> feeding assistanceprovided by NH staff ranged from tray setup (14%), monitoring (5%), verbal prompting (3%),partial physical feeding (8%), to total physical feeding (18%). 47 An important limitation <strong>of</strong> thisstudy is that observations were conducted for only one meal per subject; thus, variability infeeding assistance was not measured. Other studies have shown that there is variability in theamount and type <strong>of</strong> feeding assistance NH staff provide to residents as well as residents’ need forassistance. 48,49,56Another study, conducted in a long-term-care hospital for veterans in Canada, involvedobservations <strong>of</strong> 200 residents during all three meals on one day. Based on these observations,25% <strong>of</strong> the subjects were rated as “completely dependent” on staff for eating and 15.5% wererated as “partially dependent” (i.e., observed to receive some assistance). Thus, a total <strong>of</strong> 40.5%<strong>of</strong> the subjects required some level <strong>of</strong> feeding assistance. This study also showed undernutritionwas significantly associated with needing more than 25 minutes to complete a meal. 42Finally, one could estimate the number <strong>of</strong> residents who might need feeding assistance byestimating the number who consistently eat less than 75% <strong>of</strong> most meals. The 75% criterionserves as a trigger on the MDS for identifying residents who are at risk for potential nutritionalproblems. <strong>In</strong> three recent studies, research staff conducted independent assessments <strong>of</strong> foodintake and compared these estimates to NH staff documentation <strong>of</strong> intake. 57,58,59 Results fromtwo <strong>of</strong> these studies indicate that approximately 65% (Simmons & Reuben, 2000) to 75%(Pokrywka et. al., 1997) <strong>of</strong> NH residents eat less than 75% <strong>of</strong> most meals and, thus, are at riskfor potential nutritional problems. All three studies found that NH staff significantlyoverestimated residents’ intake levels by approximately 20% or more, compared to research staffestimates. As a result, NH staff may fail to identify many residents potentially at risk forundernutrition due to low food intake.<strong>Appropriateness</strong> <strong>of</strong> <strong>Minimum</strong> <strong>Nurse</strong> <strong>Staffing</strong> <strong>Ratios</strong> in <strong>Nursing</strong> HomesReport to Congress−20
14.4 Activities <strong>of</strong> Daily Living (ADL) <strong>In</strong>dependence Enhancement (Morning Care)The studies investigators have reviewed that focus on multiple ADL care areas generally drewtwo conclusions: (1) <strong>Nursing</strong> staff provide excessive physical assistance to residents for mostactivities <strong>of</strong> daily living; and (2) Behavioral interventions relying on graduated assistanceprotocols quickly increase residents’ independence. The fact that it takes less time to physicallyhelp residents complete an ADL task than it takes to motivate them to do the task by themselvesis frequently cited as a primary factor that reinforces care patterns which create “excessivedisability.”Two recent studies focusing on the ADL area <strong>of</strong> dressing provide specific data about behavioralintervention processes that promote independence as well as data about associated time costs. <strong>In</strong>addition, one <strong>of</strong> these studies provides information about the time required to complete all ADLmorning care, including dressing, bathing, grooming, toileting, and oral mouth care.<strong>In</strong> the first study, by Beck, et al., 1997, a behavioral intervention based on a graduated assistanceprotocol targeted a group <strong>of</strong> NH residents with cognitive impairment but no psychiatricdiagnoses. 9 These residents had no physical disability that prevented them from dressingthemselves. The types <strong>of</strong> physical disability that would have led to a subject’s exclusion werenot defined. Most <strong>of</strong> the 90 residents who participated in this study quickly improved in dressingindependence, as measured by direct observations. The time required to implement theintervention was 5.10 minutes, with a standard deviation <strong>of</strong> .24 minutes (range 2.03 minutes to12.58 minutes).<strong>In</strong> the second study, Rogers, et. al., 1999, used a similar behavioral intervention and also targeteda group <strong>of</strong> demented NH residents. <strong>In</strong> this study, however, residents were not excluded for eitherpsychiatric diagnoses or physical disabilities that prevented independent dressing. Presumably,this study targeted a more behaviorally disturbed and physically impaired NH population thanthe Beck study. This study also reported the total amount <strong>of</strong> time needed to complete all ADLmorning care tasks, including dressing, bathing, toileting, oral hygiene, and grooming, duringboth usual care and the intervention period. The intervention targeted only dressing ability, andimmediate improvements in dressing independence were produced. The total time for all ADLcare activities was 10.5 minutes under usual care conditions and 20.09 minutes during theintervention period. Dressing care consumed an average <strong>of</strong> 4.10 minutes during usual care and11.18 minutes during the intervention. 60Two other controlled studies have reported positive effects <strong>of</strong> behavioral interventions formultiple ADL skills. 10,61 The first study tested a behavioral intervention designed to promoteindependence in toileting, eating, dressing, grooming, standing, and walking. <strong>In</strong> thisintervention, clinical specialists in geriatric nursing and one rehabilitation aide provided ADLpractice to subjects in a group setting (up to eight residents). The sessions were conducted for2.5 hours a day, five days a week, for 20 weeks. The intervention group showed significantlymore improvement in independence than the control group. The authors speculate that a less<strong>Appropriateness</strong> <strong>of</strong> <strong>Minimum</strong> <strong>Nurse</strong> <strong>Staffing</strong> <strong>Ratios</strong> in <strong>Nursing</strong> HomesReport to Congress−21
intensive maintenance protocol might be effective in maintaining the gains produced by theintervention, although they reported no data pertaining to maintenance issues.Maintenance <strong>of</strong> ADL gains is a key problem according to two other reports. <strong>In</strong> one study, Blair,1995, implemented a care process based on operant conditioning and reported immediateimprovements in multiple ADL areas, including shaving, bathing, dressing, combing hair,feeding, and brushing teeth. 10 Unfortunately, the study did not report the amount <strong>of</strong> time neededto implement any <strong>of</strong> the care processes nor did it report how the intervention separately effectedeach <strong>of</strong> the ADL activities. The authors noted, however, that nursing staff reverted to their usualcare practices, which promote dependency because <strong>of</strong> time pressures. Two other authors havepresented reports from caregivers that they lack sufficient time to implement care practices thatpromote more independence. 36,37An additional study has provided data about the amount <strong>of</strong> time required to provide morningcare, although it did not describe interventions targeted specifically toward ADL independence.<strong>In</strong> this study, the intervention was designed to promote better communication between caregiversand residents. Positive results were reported on multiple measures <strong>of</strong> communication with moremixed results on ADL independence measures. 62 The study reported that the total time needed toprovide morning care during the intervention period was 13.7 minutes, not including time forincontinence care. This estimate is comparable to the 20 minutes for ADL care reported in thestudy by Rogers, et. al., 1999, which included time for incontinence care. As noted in otherstudies reviewed in this chapter, incontinence care consumes about five to seven minutes perepisode.14.4.1 ADL Morning Care: Labor EstimatesAs previously noted, studies show that protocols that increase residents’ independence inmorning ADL dressing consume approximately 7 to 11 minutes per care episode. <strong>In</strong> addition,total morning care for all ADLs ranges from 14 to 20 minutes.Several studies suggest that independence in morning ADL areas other than dressing can beimproved with behavioral interventions based on graduated assistance protocols. These studies,however, have not provided specific data about the amount <strong>of</strong> time needed to implement theseprotocols, nor have they reported improvements in specific ADL areas. For these reasons,investigators chose to include only behavioral care processes that promote dressingindependence in the analyses to be conducted in this chapter because <strong>of</strong> specific data describingboth a process-outcome link and time costs. However, investigators will use the data providedby other studies to estimate the total time required to complete all ADL morning care. Thesedata will be used to estimate how much time nursing staff have available to implement thebehavioral care processes that promote independent dressing. It should be noted that the timeneeded to provide this “other ADL” care under usual care conditions does not include time toimplement protocols designed to increase independence. Implementing graduated assistanceprotocols for these “other” areas would almost certainly increase ADL time above that spent inusual care conditions. Finally, investigators will assume that residents will require the same time<strong>Appropriateness</strong> <strong>of</strong> <strong>Minimum</strong> <strong>Nurse</strong> <strong>Staffing</strong> <strong>Ratios</strong> in <strong>Nursing</strong> HomesReport to Congress−22
from nurse aides for p.m. care (e.g., going to bed) as they do for a.m. care. <strong>In</strong>vestigators couldlocate no studies that specifically reported p.m. care times, but the ADL tasks appear to beidentical during the a.m. and p.m. time periods (e.g., clothes changing, oral care, etc.).The remaining key labor requirement issue concerns how many residents would need behavioralprotocols that promote ADL independence. Unfortunately, the clinical trials that have beenconducted—and reviewed in this chapter—used different subject inclusion criteria. With theirdescriptive data, it is not possible to estimate the number <strong>of</strong> NH residents who would likely needADL dressing protocols. Two alternative sources, however, provide information about thenumber <strong>of</strong> residents who are either semi- or totally dependent in multiple ADL skills and/ordressing. The most recent OSCAR data indicates that approximately 85% <strong>of</strong> NH residents areeither dependent in or require assistance with dressing. 33 A second study using a large MDSdatabase reported that 14% <strong>of</strong> residents in the sample were independent in seven ADL areas: bedmobility, eating, toileting, transferring, locomotion, dressing, and grooming. This study did notreport specific ADL dressing data, but assuming that dressing is an early ADL loss, investigatorscan project that most residents who are dependent in some ADL area (86%) have problems withdressing. 63 This study also reported data about the total amount <strong>of</strong> nursing time needed toprovide assistance to residents with different ADL limitations under usual care conditions.Unfortunately, time amounts were not reported for different types <strong>of</strong> nursing staff (licensed vs.nurse aides) nor was specific information given about the amount <strong>of</strong> time needed to provide carefor any one ADL area (e.g., dressing).14.5 Exercise<strong>In</strong>vestigators could find no practice guidelines for NH residents written explicitly on the topic <strong>of</strong>exercise, even though multiple quality indicators prescribe exercise for both treatment andprevention purposes. Quality indicators recommending exercise were approved in the ACOVEproject for such diverse conditions as osteoporosis, falls, prevention <strong>of</strong> disability, and residentiallife quality. For example, the approved quality indicator pertaining to residential life qualityreads as follows: “If residents are physically inactive, then they should be provided with assistedexercise daily unless they refuse.”<strong>In</strong>vestigators reviewed a number <strong>of</strong> both controlled and uncontrolled intervention studies thatgenerally reported beneficial outcomes <strong>of</strong> exercise for NH residents. <strong>In</strong>vestigators elaborate hereon primarily the controlled studies.<strong>In</strong> their largest controlled study, Fiatarone and her colleagues evaluated a progressive resistancetrainingprogram with ambulatory and mildly cognitively impaired residents in a long-term-carefacility that included both NH and assisted living residents. The progressive resistance trainingwas implemented three times per week for 45 minutes per day with one-on-one supervision <strong>of</strong>participating residents. The researchers reported significant improvements in resident leg musclestrength, stair-climbing power, and physical activity, at least during the training days. There wasalso a trend for significant increase in muscle mass. 64<strong>Appropriateness</strong> <strong>of</strong> <strong>Minimum</strong> <strong>Nurse</strong> <strong>Staffing</strong> <strong>Ratios</strong> in <strong>Nursing</strong> HomesReport to Congress−23
Two controlled studies have evaluated the effects <strong>of</strong> a walking endurance intervention forambulatory NH residents. 65,66 One study recruited residents similar to those recruited for theFiatarone study with respect to ambulatory status, but these subjects were more cognitivelyimpaired, and all <strong>of</strong> them lived in NHs. <strong>In</strong> this study, supervised walking exercise was <strong>of</strong>feredonce a day for 30 minutes for 12 to 22 weeks. Significant changes were reported on two walkingendurance measures. The second study also evaluated a walking exercise interventionimplemented three days a week for 30 minutes per day for 10 weeks. This study recruitedambulatory but severely cognitively impaired residents who suffer from Alzheimer’s Diseaseand reported significant improvements on a communication score measure. 66One controlled study recruited incontinent NH residents who were significantly less ambulatorythan the subjects who participated in all the preceding controlled trials but who were ascognitively impaired as the residents who suffer from Alzheimer’s Disease in the previousstudy. 67 <strong>In</strong> this trial, 60% <strong>of</strong> the residents used wheelchairs for mobility and 40% could walksafely only with some human assistance. Sit-to-stand exercise and walking or wheelchairendurance was integrated with an incontinence care protocol that was <strong>of</strong>fered every two hoursbetween 8:00 a.m. and 4:00 p.m. The residents were <strong>of</strong>fered the opportunity to exercise fourtimes per day. Residents complied with the exercise three times per day, and the exercise addedapproximately six minutes per incontinence care session. The total time for incontinence careplus exercise was about 13.2 minutes per session, with a range from 2 to 17 minutes. Significantimprovements in walking, wheelchair, and standing endurance were reported for the exercisegroup while direct observational measures <strong>of</strong> agitation showed significant improvements in boththe exercise group and the group randomized to incontinence care only, which received extensivesocial interaction.More recently, a controlled study reported the effects <strong>of</strong> an exercise program implemented byNH staff and volunteers on three performance measures (sit-to-stand, balance, walkingendurance) as well as ADL decline as measured by the MDS. 7 There were no significantdifferences between the intervention and control groups on the three performance measures, butthe exercise intervention group showed significantly less decline on ADL scores than the controlgroup. The study did not report how many residents participated in the exercise sessions or howmuch time was devoted to the sessions. Endurance training was <strong>of</strong>fered every other day (onalternate days, resistance training sessions were <strong>of</strong>fered), and nursing staff “monitored”residents’ walking for up to 20 minutes during these sessions. The study noted that an unknownnumber <strong>of</strong> residents who were assigned to the exercise group did not exercise because <strong>of</strong> eithercognitive or physical impairments. The specific ADL performance <strong>of</strong> these subjects was notseparated from the performance <strong>of</strong> those subjects who participated in the exercise sessions. Noinformation was provided about the differential ADL performance <strong>of</strong> these two groups. Despitethe absence <strong>of</strong> more specific data about the exercise program, the associated time costs, and thenumber <strong>of</strong> staff or residents involved in the program, this study does have important implicationsfor this chapter. The study implies that an unknown number <strong>of</strong> volunteers can supplement NHstaff to successfully implement an exercise program.<strong>Appropriateness</strong> <strong>of</strong> <strong>Minimum</strong> <strong>Nurse</strong> <strong>Staffing</strong> <strong>Ratios</strong> in <strong>Nursing</strong> HomesReport to Congress−24
Three other controlled studies evaluating exercise interventions reported mixed results. Onestudy randomized a small group <strong>of</strong> 15 residents without significant cognitive impairment to anexercise program based on cycling activity and upper body exercise. 68 The program wasimplemented three times a week for an unknown period <strong>of</strong> time, although it was clear that theresidents could not tolerate more than five to ten minutes <strong>of</strong> activity during any one session. Dueto this level <strong>of</strong> deconditioning, a rest session was scheduled between the exercise sessions. Thisstudy reported significant increases in upper body strength but no improvements in lower bodystrength. The researchers attribute these mixed results to a high illness rate among the subjects.A second study randomized 97 restrained NH residents to an exercise intervention that involvedrowing, walking, or wheelchair endurance training for approximately 20 minutes a day, andbehavioral training based on the principal <strong>of</strong> over-correction for safety issues (e.g., lockingwheelchair before sitting down). 69 The sessions were conducted three times per week.Compared to the control group, the exercise group showed significantly more improvement inwheelchair mobility endurance and upper body strength measures, but not in walking enduranceor measures <strong>of</strong> lower body strength. <strong>In</strong> addition, the objective performance measures <strong>of</strong> fall riskshowed statistically significant but not clinically significant differences between groups. Thisstudy reported that many residents did not complete the exercise program because <strong>of</strong> eitherillness or failure to comply with the exercise protocol due to behavioral disturbance issues.The third controlled study evaluated an intervention implemented by physical therapists threedays a week for approximately 30 to 45 minutes a day for four months. 70 This study reported nodifferences between intervention and control groups on most <strong>of</strong> the physical performancemeasures and observational measures <strong>of</strong> a resident’s ability to perform ADLs, although there wasimprovement on one mobility endurance measure. This study implied that the high frailty andillness rate that characterizes the NH population limited the effectiveness <strong>of</strong> the intervention.<strong>In</strong>deed, all three <strong>of</strong> the controlled exercise studies that reported negative or mixed results citedresidents’ frailty and inability to consistently participate in exercise interventions.<strong>In</strong> addition to the clinical data, there is evidence that residents value exercise interventions. Onestudy reported that residents valued a program that provided at least 15 minutes <strong>of</strong> supervisedactivity or exercise per day over such options as private rooms or better food. 28 These preferencedata reinforce those reported in a nationwide study that used quantitative procedures to prioritizeservices valued by NH consumers. 21 <strong>In</strong> this study, access to physical therapy programs was themost valued service. A third study reported that NH residents who require ambulation assistancefrom staff reported a preference for receiving walking assistance twice a day and also expresseddissatisfaction with the number <strong>of</strong> assists per day that are actually provided in NHs. 1914.5.1 Exercise: Labor Estimates<strong>In</strong>vestigators reviewed controlled studies indicating that either progressive resistance training orendurance training has beneficial effects on residents who can ambulate without physicalassistance if implemented from three to five times per week for 30 to 45 minutes per session.<strong>Appropriateness</strong> <strong>of</strong> <strong>Minimum</strong> <strong>Nurse</strong> <strong>Staffing</strong> <strong>Ratios</strong> in <strong>Nursing</strong> HomesReport to Congress−25
Another controlled study targeting less ambulatory and more physically frail incontinent subjectsalso reported positive effects from an exercise intervention that consumed approximately 18minutes per day beyond the time needed to provide incontinence care. Two other controlledstudies reported both positive and negative effects <strong>of</strong> exercise on ADL function, but eitherprovided no data about time costs (e.g., Morris, et. al., 1999) or described interventions that werenot under the control <strong>of</strong> nurse aides (e.g., Mulrow, et. al., 1994).The clinical outcome’s data do not make an overwhelmingly strong case that exerciseinterventions will produce important changes in resident functioning, but they generally indicatethat residents who are healthy enough to consistently participate in exercise enjoy some positiveoutcomes. When this clinical data is considered along with residents’ preferences, a strong casecan be made that exercise care processes are valued, potentially beneficial, and should be a dailycare practice <strong>of</strong>fered to residents.Furthermore, because exercise is conceptualized as a prevention intervention, all NH residents,with the exception <strong>of</strong> those few who are bed-bound or who prefer not to exercise, would becandidates for exercise. With bed-bound residents, investigators assume that some range <strong>of</strong>motion exercise (either passive or active) is necessary to prevent contractures, although theMulrow, 1994, study suggested that such exercise was ineffective. Unfortunately, it is unknownhow many residents would rather not exercise or cannot exercise because they are sick at thegiven time period. Thus, for the purposes <strong>of</strong> this chapter, investigators will assume that all NHresidents are candidates for exercise, at least on days when they are well.The subject recruitment criteria described in the clinical trials provide further assistance inidentifying the time cost <strong>of</strong> the exercise care processes. <strong>In</strong>vestigators can also assume that theNH residents can be roughly subdivided into three major groups with respect to the type <strong>of</strong>exercise most appropriate for them. Residents who are incontinent, or those who receivetoileting assistance, are generally more cognitively and physically impaired than continentresidents and comprise 70% <strong>of</strong> the NH population. These residents are candidates for thepreviously reviewed intervention that was integrated with incontinence care and whichconsumed about 18 minutes per day beyond incontinence care. 67 If this intervention were notintegrated with incontinence care, the time cost would be higher due to the extra time needed tolocate residents for the singular purpose <strong>of</strong> exercise. Less cognitively impaired and ambulatoryresidents, most <strong>of</strong> whom are very likely not incontinent, are good candidates for either theprogressive resistance training or walking endurance programs, which are implemented 30 to 45minutes per session, three to five times per week. 64,65,66 Although the continence status <strong>of</strong> theresidents who participated in these exercise trials was not reported, investigators do know thatthe participants were significantly more cognitively intact and more ambulatory than theincontinent residents who participated in the exercise trials. The assumption that theseambulatory residents generally were not incontinent and did not need toileting assistance isjustified based on these data and the fact that immobility and dementia are the two primary riskfactors for incontinence in NHs.<strong>Appropriateness</strong> <strong>of</strong> <strong>Minimum</strong> <strong>Nurse</strong> <strong>Staffing</strong> <strong>Ratios</strong> in <strong>Nursing</strong> HomesReport to Congress−26
If 70% <strong>of</strong> residents in a NH are incontinent and approximately 8% are bed-bound, as reported on1997 OSCAR, investigators project that the remaining 22% are candidates for the walkingendurance or progressive resistance training interventions. With respect to bed-bound residents,there are no studies to the investigators’ knowledge that have documented a relationship betweena specific range <strong>of</strong> motion exercise and an outcome measure. However, given that range <strong>of</strong>motion exercise is required as “standard care” for bed-bound residents, investigators will assumethat this group requires two to three minutes <strong>of</strong> such exercise four times a day, to be integratedwith other care (e.g., incontinence care).<strong>In</strong>vestigators found three studies that report the frequency <strong>of</strong> exercise or activity provided toresidents under normal NH conditions. <strong>In</strong> one study, restrained residents who were capable <strong>of</strong>independent ambulation were observed in assisted walking movement on less than 1% (.6) <strong>of</strong> 48observations conducted over two days. 71 <strong>In</strong> the same study, residents who were ambulatory andunrestrained were observed in movement on 16% <strong>of</strong> the observations, although 22% <strong>of</strong> theseresidents were never found walking on any <strong>of</strong> the observations. Measures <strong>of</strong> fall risk weresignificantly predictive <strong>of</strong> low activity levels for both restrained and unrestrained residents,suggesting that residents’ fear <strong>of</strong> falling limits their willingness to move, even when they areunrestrained and they can do so independently.A second study <strong>of</strong> 230 residents in eight NHs described the location <strong>of</strong> residents between 6:00a.m. and 7:00 p.m. These location data suggest a high degree <strong>of</strong> physical inactivity. Theresidents were observed in bed on an average <strong>of</strong> 36% <strong>of</strong> the observations, with the majority <strong>of</strong>residents in bed before 10:00 a.m. and after 4:00 p.m. 72<strong>In</strong> a third study, residents who were capable <strong>of</strong> independent ambulation but who requiredassistance were observed every 15 minutes for one minute between 7:00 a.m. and 5:00 p.m. forthree consecutive days. The study reported that residents received an average <strong>of</strong> .23 walkingassists per day (mode 0 to 2), although their stated preference was for an average <strong>of</strong> two assistsper day. 20These three studies suggest that NH residents, even those capable <strong>of</strong> independent ambulation, areextremely inactive under usual care conditions, receive less supervised walking assistance thanthey prefer, and spend more than 36% <strong>of</strong> the daytime period in bed.14.6 <strong>In</strong>put Variables for <strong>Staffing</strong> Model14.6.1 <strong>In</strong>put Variable I: Estimating Amount <strong>of</strong> <strong>Nurse</strong> Aide Time Available toProvide Direct Care<strong>Appropriateness</strong> <strong>of</strong> <strong>Minimum</strong> <strong>Nurse</strong> <strong>Staffing</strong> <strong>Ratios</strong> in <strong>Nursing</strong> HomesReport to Congress−27
<strong>In</strong>vestigators considered two approaches to estimating this input variable. For the first,investigators reviewed studies that estimate the amount <strong>of</strong> time residents receive care from nurseaides and considered using these calculations as potential estimates <strong>of</strong> the “time available” toprovide care. This approach works if one assumes that the amount <strong>of</strong> time residents reportedlyreceived care in these studies reflects what nurse aides are capable <strong>of</strong> providing under normalwork conditions and if the studies provide consistent data. Both points proved problematic.One study (by Holmes, et. al., <strong>In</strong> Press) 73 using a computerized time recording procedure,reported that the total time a resident received either direct or indirect care from a nurse aide in a24-hour period was 44.8 minutes. This study was conducted in both special care and traditionalcare units in NHs and documentation activities were considered to be indirect care activities.This study divided the total time by shift and reported that, on average, a resident would receivecare from nurse aides for 19.1 minutes on the 7:00 a.m. to 3:00 p.m. shift, 15.2 minutes on the3:00 p.m. to 11:00 p.m. shift, and 10.3 minutes on the 11:00 p.m. to 7:00 a.m. shift.Using the same computerized time recording procedure as the Holmes study, a second series <strong>of</strong>studies, which led to the RUGs used by HCFA for prospective payment, reported that theaverage time a resident received direct/indirect care from nurse aides in a 24-hour period was139 minutes. 74 These studies did not provide time estimates for each shift. Unlike the Holmesstudy, these studies included many residents on transitional care units, in addition to chronic careresidents. <strong>Staffing</strong> ratios in transitional care units may be higher than those in traditional NHunits, and transitional care is not the focus <strong>of</strong> this paper.Ultimately, investigators decided not to base their time estimate on these studies for two reasons.First, the studies report significantly different time estimates. Second, staffing levels in thefacilities during data collection were not reported in any <strong>of</strong> the studies. Given the largediscrepancy in the studies’ time estimates, the work or staffing conditions in the two groups <strong>of</strong>NHs must have been very different. For example, if the daily time estimate in the Holmes study(44.8 total minutes over 24 hours) was distributed over 24 hours, then a resident would receiveonly about two minutes <strong>of</strong> care per hour. Does this reflect poor management <strong>of</strong> nurse aides ortypical work patterns that actually exist in NHs? Alternatively, assuming that the RUGs data aremore accurate presents another dilemma because these time estimates exceed the average nurseaide minutes reported as available by NHs in OSCAR. 33 According to the OSCAR data, 126minutes <strong>of</strong> nurse aide time is scheduled per resident per 24-hour period. By comparison, theRUGs studies reported that 139 minutes <strong>of</strong> nurse aide time is received per resident in a 24-hourperiod.Rather than assume an arbitrary ratio for the number <strong>of</strong> minutes per hour that aides could deliverdirect resident care, investigators chose to use a second approach. <strong>In</strong>vestigators developed asimulation <strong>of</strong> the process <strong>of</strong> delivering care and assumed that nurse aides are available to providecare during their scheduled shift time whenever they are not specifically on meal breaks or otherscheduled breaks. Thus, full-time aides scheduled for an eight hour shift (480 minutes) areavailable to deliver care for seven hours (420 minutes, that is 480 minutes minus 60 minutes forbreaks/ meals). <strong>In</strong>vestigators then included in the simulation not only the time spent directly<strong>Appropriateness</strong> <strong>of</strong> <strong>Minimum</strong> <strong>Nurse</strong> <strong>Staffing</strong> <strong>Ratios</strong> in <strong>Nursing</strong> HomesReport to Congress−28
delivering care to residents, but also an estimate <strong>of</strong> how much time it would take aides to locateresidents and walk to and from care delivery. This was necessary because the studies that doreport time estimates for providing efficacious care processes (e.g., feeding assistance) do notinclude time estimates for locating and transporting residents so that this care can be delivered.Moving between residents to provide care can be very time consuming, as evidenced by oneobservational study that found that walking was the most frequent aide activity observed. 75To estimate transportation time, investigators first collected data describing how much time ittook research staff to locate residents and to provide exercise and incontinence care in an ongoingNIH clinical trial project. These observations were conducted on two floors with differentconfigurations that represented two typical NH floor arrangements, according to one report. 76One was an L-shaped floor with the nursing station centrally located and the other was T-shaped,also with a centrally located nursing station and dining room. Observations <strong>of</strong> 130 care episodesrevealed that it took approximately 3 minutes between the time one care process was terminatedwith a resident and the time another was initiated with a second resident. <strong>In</strong>vestigators thenestimated the total time that an aide would spend locating residents by simulating the movement<strong>of</strong> aides from one resident room to another during episodes <strong>of</strong> scheduled care. <strong>In</strong>vestigatorsassumed that aides traveled at typical rates observed in other health-care settings, that is 114 feetper minute when moving by themselves and at the speed <strong>of</strong> the residents when accompanyingresidents. <strong>In</strong>vestigators estimated, based on published reports, that wheelchair-bound residentsmove at 30 feet per minutes (.16 meters per second) and residents requiring assistance walk at 40feet per minute (.2 meters per second). 67 These assumptions resulted in simulated average traveltimes <strong>of</strong> less than 1.5 minutes per episode <strong>of</strong> care. Thus, the investigators simulated travel timesare conservative underestimates compared to the times observed in the field.A second assumption affects the percentage <strong>of</strong> time an aide spends in travel; that is, the degree towhich services for a resident are “bundled” on a single trip. <strong>In</strong> the simulation, services such astoileting assistance, range <strong>of</strong> motion exercises, repositioning, or housekeeping services werecombined when this was reasonable (based on time <strong>of</strong> day) and feasible (based on upcomingshift changes or time-limited services such as meals). <strong>In</strong>vestigators assumed a different type <strong>of</strong>"bundling" when aides needed to accompany residents to and from the dining hall. <strong>In</strong> this case,rather than have the aide escort one resident at a time (with a separate trip to pick up eachresident), investigators assumed that a single aide could make a "sweep" down a corridorescorting up to seven residents on a single trip. These assumptions combined to produce about 5minutes <strong>of</strong> travel time per aide per hour worked. This varied by shift, with aides on the 11:00p.m. to 7:00 a.m. shift spending about 25 minutes per shift in travel, while day and evening shiftaides spent about 40 minutes per shift. Given the conservative nature <strong>of</strong> their assumptions,investigators believe that aides will spend at least this much time in walking to and from careepisodes in real NH operations.Output from the investigators’ simulation was used to estimate the fraction <strong>of</strong> time that aidesactually spent in direct resident care, as well as the time they spent in direct care plus travel,based on the assumptions above. The investigators’ detailed findings are presented anddiscussed in the Results section. While varying by shift and staffing level, the estimates<strong>Appropriateness</strong> <strong>of</strong> <strong>Minimum</strong> <strong>Nurse</strong> <strong>Staffing</strong> <strong>Ratios</strong> in <strong>Nursing</strong> HomesReport to Congress−29
averaged more than 40 minutes <strong>of</strong> direct care in a 60-minute period, a number consistent withfield observations.Two observational studies that focused on describing the work behavior <strong>of</strong> nurse aides provideinformation to substantiate the validity <strong>of</strong> this 40-minute time estimate. 75,77 Unlike the timestudies described previously, these observational studies focused on the work behavior <strong>of</strong> nurseaides rather than the amount <strong>of</strong> time residents received services.The two studies differ in their observational strategies and definitions <strong>of</strong> work activities inseveral critical ways. One study, for example, collected information about three different staffmembers, most <strong>of</strong> whom were nurse aides, every 15 minutes during the 8:00 a.m. to 5:00 p.m.shift. 77 For the second study, the researchers scanned the hallway and recorded the behavior <strong>of</strong>the first two staff members they could locate, collecting the data at the point <strong>of</strong> location. Withregard to their definitions <strong>of</strong> direct resident care activities, one study included documentationactivities while the other did not. 75Despite these differences, the studies reached remarkably similar conclusions regarding thepercentage <strong>of</strong> observations that found nurse aides providing direct care. <strong>In</strong> one study, 67% <strong>of</strong> allobservations were <strong>of</strong> direct care activities such as bathing, incontinence care, shaving, feeding,and “procedures.” <strong>In</strong> the second study, it was more difficult to calculate all “direct” careactivities, but easy to distinguish the percentage <strong>of</strong> observations during which nurse aidesprovided no resident care. <strong>In</strong> this study, nurse aides were using the phone on 2% <strong>of</strong> theobservations, sitting alone or simply not working on 14.5% <strong>of</strong> the observations, and talking withother staff on 16.8% <strong>of</strong> the observations (total = 33%). Both studies, thus, concluded thatapproximately 67% <strong>of</strong> all observations were <strong>of</strong> direct resident care activities.Neither study recorded the “duration” <strong>of</strong> observed resident care activities, so investigators cannottranslate their “percentage <strong>of</strong> total observations” directly into a time measure. At the same time,however, it is likely that a correlation exists between the frequency <strong>of</strong> observed activities and theamount <strong>of</strong> time engaged in them. 78The authors <strong>of</strong> both studies note that their data indicate more resident-care behavior than wasreported by similar observational studies conducted in acute-care facilities or facilities for thedevelopmentally disabled. Thus, both research teams openly worried about the possibility thattheir observations were reactive and improved the work behavior <strong>of</strong> the staff being observed.Despite their limitations, the studies provide specific and consistent advice about how to estimatethe amount <strong>of</strong> time that nurse aides have available to provide direct care.These studies suggest that an estimate <strong>of</strong> how much time aides have available to provide care canbe derived by correcting the 60 minutes that it is theoretically available to provide care by a 33%correction factor, suggested by both studies as the amount <strong>of</strong> time that aides spend in non-directcare activities. The resulting figure <strong>of</strong> 40.2 minutes for direct care (60 minutes minus 33%) isvery similar to the figure that investigators derived by their alternative approach <strong>of</strong> correcting 60minutes per hour by times for breaks, meals, and travel time. <strong>In</strong> both cases, the 40 minutes per<strong>Appropriateness</strong> <strong>of</strong> <strong>Minimum</strong> <strong>Nurse</strong> <strong>Staffing</strong> <strong>Ratios</strong> in <strong>Nursing</strong> HomesReport to Congress−30
hour available to provide care most likely reflects NH work conditions in which direct care staffare either very well-managed or working unusually hard.Finally, there is also the issue <strong>of</strong> how to evaluate the time required to provide necessary care thatdid not meet the investigators’ inclusion criteria for a process-outcome link. <strong>In</strong> the absence <strong>of</strong>defensible data about how much time such other care takes, investigators decided to beconservative in estimating these time requirements. <strong>In</strong>vestigators allowed 15 minutes for ashower or bath on a schedule <strong>of</strong> approximately twice per week and 10 minutes per day for suchhousekeeping tasks as making beds, sorting laundry, replacing supplies, etc. <strong>In</strong> cases whereresidents needed no assistance with a specific ADL care area because <strong>of</strong> their independence,investigators assigned a minimum time <strong>of</strong> one to two minutes for such nurse aide activities asproviding these residents with their food trays or checking with them in the morning as they weregetting up. <strong>In</strong>vestigators also assigned five minutes at the beginning and end <strong>of</strong> each shift forshift report and documentation activities. Finally, interviews with nurse aides at sitesparticipating in the investigators’ clinical trials indicated that they also spend time inunscheduled care activities. For example, answering requests for assistance, cleaning up spills,or transporting residents to doctors’ visits. <strong>In</strong>vestigators decided to account for some <strong>of</strong> theseunscheduled events in some <strong>of</strong> the work scenarios that they evaluated because <strong>of</strong> theirsurprisingly large impact on work scheduling and efficiency. <strong>In</strong> general, investigators believethat their estimates <strong>of</strong> time spent on all <strong>of</strong> these other care-related activities are extremelyconservative, as investigators will discuss further in the “Limitations and Future Directions”section <strong>of</strong> this chapter.14.6.2. <strong>In</strong>put Variable 2: Time to Provide CareThere are two components to this input variable: (1) The amount <strong>of</strong> time that it takes toimplement a care process per episode <strong>of</strong> care, and (2) the number <strong>of</strong> episodes <strong>of</strong> care that arerequired to produce a beneficial outcome. For example, how long should a resident receivewalking exercise on any given exercise session, and how frequently should the sessions bescheduled to produce beneficial effects?It was problematic to arrive at a specific number for this critical input variable. These problemswere created in part by the way research trials and practice guidelines are designed and reported.Most notably, time to provide a care process was not calculated in many studies that otherwisevalidated a process-outcome link, and practice guidelines do not report labor time associatedwith their assessment and intervention recommendations. Labor times are also effected by workroutines. For example, practice guidelines recommend multiple care routines for pressure soreprevention including repositioning, incontinence care, and mobility exercise. 14 It is obvious thatthese care routines should be integrated in daily practice for efficiency purposes and should notbe viewed as independent processes to be scheduled separately (e.g., changing one hour andrepositioning at another). <strong>In</strong> most cases, however, there is scant data to describe time costs whencare routines are integrated or scheduled in consideration <strong>of</strong> efficiency.14.6.3 <strong>In</strong>put Variable 3 : Number <strong>of</strong> Residents that Need Care<strong>Appropriateness</strong> <strong>of</strong> <strong>Minimum</strong> <strong>Nurse</strong> <strong>Staffing</strong> <strong>Ratios</strong> in <strong>Nursing</strong> HomesReport to Congress−31
The total amount <strong>of</strong> time per work period or shift that a nurse aide must spend in providingefficacious care is a product <strong>of</strong> input variable 2 and the number <strong>of</strong> residents who need a specificcare process. For example, if incontinence care takes 7 minutes per episode and must bedelivered 3 times per shift to produce high levels <strong>of</strong> dryness, then any one resident will require21 minutes <strong>of</strong> direct incontinence care in an 8-hour period (<strong>In</strong>put Variable 2). However, the totaltime demand on the aides delivering care would be 21 minutes multiplied by the number <strong>of</strong>residents who need the incontinence care. Thus, if four residents need incontinence care, thenthe total time required <strong>of</strong> aides in any one shift is 4 multiplied by 21 minutes or 84 minutes.Two problems arise with regard to projecting the number <strong>of</strong> residents who need a specific careprocess. The clinical studies investigators reviewed vary with regard to their subject exclusioncriteria and seldom report the number <strong>of</strong> residents who were either responsive to or preferred aparticular intervention once it was implemented. Ideally, an estimate <strong>of</strong> the number <strong>of</strong> peoplewho are candidates for a care process should be based on data concerning the number <strong>of</strong> peoplewho either want or are likely to be responsive to the care process. For example, investigatorsknow that 33% to 50% <strong>of</strong> residents who are incontinent are likely to be responsive to a toiletingcare process. 11,12 Thus, it would be inappropriate to assume that all incontinent residents aregood candidates for toileting assistance. Unfortunately, investigators have no information abouthow many residents either want or would be responsive to the exercise, feeding assistance, orADL independence enhancement protocols that they are evaluating.14.6.4 <strong>In</strong>vestigators’ Approach to Estimating <strong>In</strong>put Variables 2 and 31. <strong>In</strong>vestigators used responsiveness data when possible; but in the absence <strong>of</strong> such datainvestigators used only descriptive data about the number <strong>of</strong> residents who have aproblem (e.g., dressing dependence) as an estimate <strong>of</strong> the number <strong>of</strong> residents who arecandidates for a care process.2. <strong>In</strong> cases where multiple care routines could be integrated and when it might be possibleto provide simultaneous care to multiple residents, investigators made reasonableestimates about the time required to implement the integrated care.3. With regard to work scheduling efficiency, which impacts on how well different careactivities can be integrated for implementation, investigators developed a scenario thatpermitted 100% <strong>of</strong> care to be delivered with the minimal number <strong>of</strong> staff.The efficiency scenario presumes that most residents are out <strong>of</strong> bed by 8:00 a.m., many nap inbed around 2:00 p.m. but, after waking, do not return to bed for the night until after 7:00 p.m. <strong>In</strong>this scenario, most residents eat all meals in the dining room, where they receive feedingassistance in groups. All other care processes are scheduled around or integrated with the laborintensive mealtimes.<strong>Appropriateness</strong> <strong>of</strong> <strong>Minimum</strong> <strong>Nurse</strong> <strong>Staffing</strong> <strong>Ratios</strong> in <strong>Nursing</strong> HomesReport to Congress−32
To implement this scenario, it is necessary for nurse aides to provide the morning ADL care toapproximately 20% <strong>of</strong> the residents who need it between 6:00 a.m. and 7:00 a.m. <strong>In</strong>vestigatorsconsider this schedule feasible given that some residents seem to prefer early rising times. Theday shift then completes all ADL care for the remaining residents between 7:00 a.m. and 8:00a.m. except for the full bed bath, which is delayed until later in the morning so that there issufficient time for breakfast. Also in this scenario, and again to save time for feeding assistanceat breakfast, all residents who require ambulation or wheelchair mobility assistance are activelytransported to the dining room by staff between 8:00 a.m. and 9:00 a.m. <strong>In</strong>vestigators consideredthis type <strong>of</strong> resident transport necessary in order to save time for feeding assistance at breakfast.Research findings provide the rationale. Studies show, for example, that wheelchair-boundresidents independently wheel their chairs at an average <strong>of</strong> .16 meters per second when givenfrequent encouragement; the average resident who requires human assistance with walkingstrolls at approximately .20 meters per second. 67 <strong>In</strong>vestigators estimate that approximately 70%<strong>of</strong> NH residents move at these speeds. Thus, it would take four to six minutes <strong>of</strong> staff time perresident to provide mobility assistance between 8:00 a.m. and 9:00 a.m., with a consequent loss<strong>of</strong> time to provide feeding assistance. Alternatively, staff, who walk much faster than residents,can transport residents to the dining room in significantly less time. Based on data describingresidents’ ambulation ability, investigators project that approximately 22% <strong>of</strong> NH residents canmove to the dining room without staff supervision and approximately 8% <strong>of</strong> residents will bebed-bound or otherwise sick and unable to go to the dining room on a particular day. Data tosupport the investigators’ projection that 70% <strong>of</strong> residents can move to the dining room withsupervised assistance is provided in the literature review on exercise.Despite the lack <strong>of</strong> early morning exercise under this scenario, most residents will be in thedining room for breakfast, so investigators can assume that the feeding assistance protocols,which have proven effective on a one-on-one basis, can be implemented with groups <strong>of</strong>residents. <strong>In</strong> this regard, investigators assume that residents who are completely dependent onstaff for food assistance could be fed in groups <strong>of</strong> two and that residents who needed onlyprompting or minimal assistance could be fed in groups <strong>of</strong> four. The literature review on feedingassistance only provides data about the time needed to provide feeding assistance to residents ona one-to-one basis, but there is some indication that residents could be provided such assistancein a group social context. 52 <strong>In</strong>vestigators divided the time reported spent in providing assistancein a one-to-one situation by the number <strong>of</strong> people in the group. <strong>In</strong> addition, since all residents,except those few who are bed-bound, will be in the dining room, the exercise and incontinencemanagement protocols can then be integrated and delivered between 10:00 a.m. and 5:00 p.m.,with residents receiving exercise on the way to their rooms for incontinence care or naps; enroute to shower rooms for baths; or on their return to the dining room for lunch or dinner.Residents who are not incontinent, bed-bound, or catheterized (approximately 30% <strong>of</strong> a typicalaide’s work load) and who are more ambulatory can also participate in group exercise sessionsfour times per week, 30 minutes per day, starting from the dining room area.<strong>In</strong>vestigators also conceptualized other scenarios that involve more flexible mealtimes andoperate on different assumptions about the number <strong>of</strong> residents want to eat in the dining room,want to exercise, or want any <strong>of</strong> the other care processes investigators selected for evaluation.<strong>Appropriateness</strong> <strong>of</strong> <strong>Minimum</strong> <strong>Nurse</strong> <strong>Staffing</strong> <strong>Ratios</strong> in <strong>Nursing</strong> HomesReport to Congress−33
These scenarios place a greater and much-needed emphasis on individualized care, based on aresident’s preferences. Space and time constraints prevent us from either describing or analyzingthe outcomes <strong>of</strong> these individualized care scenarios. However, investigators believe suchanalyses should be conducted given that individualized care has been recognized as an importantelement <strong>of</strong> quality; is not being considered in the work scenarios investigators are analyzing; andyet has such important staffing implications. Most notably, more staff members than thoseprojected in the investigators’ efficiency focused scenarios would be necessary to individualizecare due to the loss <strong>of</strong> efficiency that results when residents are not managed in groups (e.g., allresidents eat in dining room). <strong>In</strong>vestigators will discuss some <strong>of</strong> these issues in the FutureDirections section <strong>of</strong> this chapter.14.7 Methodology and Analysis Strategy14.7.1 Analytical Approach Simulation LogicTo estimate the number <strong>of</strong> staff needed to provide all recommended efficacious care to residents,investigators developed a computer simulation <strong>of</strong> the process <strong>of</strong> delivering care. Simulation is aflexible tool that is especially appropriate for evaluating the effects <strong>of</strong> physical layout, staffinglevels, and service scheduling on the level <strong>of</strong> services provided, resident waiting time, and staffworkload. Simulation has been used as an analytic tool in many areas <strong>of</strong> health care, includingemergency departments, 79 operating rooms/surgical suites, 80,81 clinic applications, 82,83 andinpatient applications. 84,85 MedModel TM , a PC-based program, allowed us to model both thephysical layout <strong>of</strong> a typical nursing unit and characteristics <strong>of</strong> the residents. Simulation has theadvantage <strong>of</strong> allowing us to model several realistic scenarios, including factors such as:• observed variation in time to deliver a service;• aide travel time from one resident to another;• the need to accommodate breaks for staff;• the fact that some services (i.e., morning care and meals) must be delivered in arelatively narrow time window, while others (e.g., showers, putting away laundry,and exercise) can be worked into available slack periods during the day;• the need to accommodate unscheduled events, which may occur at different ratesthrough the day.The output <strong>of</strong> the program included shift-by-shift estimates <strong>of</strong> workload estimates <strong>of</strong> time spentin direct resident care and in travel, estimates <strong>of</strong> the total minutes devoted to each <strong>of</strong> therecommended services, and the approximate time <strong>of</strong> day when time-critical services werecompleted on all residents.<strong>Appropriateness</strong> <strong>of</strong> <strong>Minimum</strong> <strong>Nurse</strong> <strong>Staffing</strong> <strong>Ratios</strong> in <strong>Nursing</strong> HomesReport to Congress−34
For the physical layout, investigators used a 40-bed nursing unit with a T-shaped floor plan and acentrally located nursing station and dining hall. Each branch <strong>of</strong> the T was equipped with abathroom with a shower. <strong>In</strong>vestigators assumed that toilets and sinks were available in eachresident room.Based on resident characteristics, investigators created a schedule <strong>of</strong> recommended services andthe estimated times to complete them. <strong>Nurse</strong> aides were assigned to typical shifts, with twoscheduled 15-minute breaks and a 30-minute meal period. The simulation <strong>of</strong> a 24-hour periodinvolved:• the arrival and departure <strong>of</strong> staff, with five minutes for shift reports at thebeginning and end <strong>of</strong> each 8-hour shift and breaks occurring as close to theirscheduled times as possible without interrupting already in-progress service to aresident;• provision <strong>of</strong> scheduled services, with aides traveling from one resident to the nextto deliver care, spending the estimated times appropriate to each resident type;• in some scenarios, the addition <strong>of</strong> random, unscheduled demands for services(representing resident call lights, spills, accidents, and similar events).14.8 Resident Service Categories and <strong>Staffing</strong> Model <strong>In</strong>put DataTable 14.2 provides time and frequency estimates for five evidence-based care processes thatnurse aides perform. These estimates are provided for each <strong>of</strong> six major categories <strong>of</strong> residents.<strong>In</strong>vestigators divided residents into these six categories by considering the care processes thatresidents receive because <strong>of</strong> either their disabilities or projected responsiveness to the careprotocols (e.g., toileting). The columns <strong>of</strong> the table illustrate, for each <strong>of</strong> the five evidence-basedcare processes, the time required to complete the process and the minimum frequency forproviding the services. All <strong>of</strong> the numbers in these columns were justified and more fullydescribed in the Review <strong>of</strong> Literature section <strong>of</strong> this paper.The first two rows <strong>of</strong> the table (groups 1 and 2) illustrate residents who are ambulatory withouthuman assistance, whom investigators project to be approximately 30% <strong>of</strong> the NH population.These residents are equally divided into 14% who need no assistance with ADLs (Row 1) andthose who need independent ADL enhancement care. This number was based on data thatsuggests that 14% <strong>of</strong> NH residents are independent in all ADL areas and that approximately 85%need assistance with dressing. 63 <strong>In</strong>vestigators project that none <strong>of</strong> the residents in these first twocategories would need incontinence care since immobility is a primary risk factor for urinaryincontinence. Likewise, these residents, by definition, do not need human assistance withrepositioning. However, all <strong>of</strong> these ambulatory residents would need exercise for 30 minutesevery two days (3.5 times per week or .5 times per day).<strong>Appropriateness</strong> <strong>of</strong> <strong>Minimum</strong> <strong>Nurse</strong> <strong>Staffing</strong> <strong>Ratios</strong> in <strong>Nursing</strong> HomesReport to Congress−35
Groups 3 through 6 in Table 14.2 are all incontinent and would need incontinence care, exerciseintegrated with incontinence care, and ADL enhancement exercise. Differences in the timedevoted to incontinence care in these four groups is primarily due to Group 3’s ability to beresponsive to a toileting program that is more time-consuming than changing.<strong>Appropriateness</strong> <strong>of</strong> <strong>Minimum</strong> <strong>Nurse</strong> <strong>Staffing</strong> <strong>Ratios</strong> in <strong>Nursing</strong> HomesReport to Congress−36
Table 14.2 Frequency and Time <strong>In</strong>put Data for Care Processes (Ideal <strong>Staffing</strong>)Patient type1. Continent,<strong>In</strong>dependently ambulatory,no diapers, no need forrepositioning, no need forADL enhancements, fullyindependent eatingFrequency: 15% (6 <strong>of</strong>40)2. Continent,<strong>In</strong>dependently ambulatory,no diapers, no need forrepositioning, ADLenhancements needed,fully independent eatingFrequency: 15% (6 <strong>of</strong>40)3. <strong>In</strong>continent, Assistedambulation, day toilet/nightdiapers, repositioningneeded,ADLenhancements needed,fully independent eatingFrequency: 20% (8 <strong>of</strong> 40)4. <strong>In</strong>continent, Assistedambulation, 24 hourdiapers, repositioningneeded,ADLenhancements needed,semi dependent eatingFrequency: 40% (16 <strong>of</strong>40)5. <strong>In</strong>continent, Assistedambulation, 24 hourdiapers, repositioningneeded,ADLenhancements needed,dependent eatingFrequency: 4.5% (2 <strong>of</strong>40)6. <strong>In</strong>continent, Bed bound,24 hour diapers,repositioning needed, ADLenhancements needed,% <strong>of</strong>ResidentsTimea.m. CARE EXERCISE CHANGE ORTOILETINGFrequencyTimeFrequency15.0% 2 1 per day 30 Everyother day15.0% 11 1 per day 30 Everyother dayTime20.0% 14 1 per day 6 3 per day 7-day,5-nightFrequencyREPOSITIONINGTimeFrequencyGROUP FEEDINGASSISTANCETimeFrequencyTimeSHOWER p.m. CARE HOUSEKEEPINGFrequency0 0 0 0 1 3 per day 15 Everyfourth day0 0 0 0 1 3 per day 15 Everyfourth day7 per day 3.5 3 per day 1 3 per day 15 Everyfourth day40.0% 14 1 per day 6 3 per day 5 8 per day 3.5 2 per day 7.5(ingroups<strong>of</strong> 4)5.0% 14 1 per day 6 3 per day 5 8 per day 3.5 2 per day 22.5(ingroups<strong>of</strong> 2)5.0% 14 1 per day 2 3 per day 5 8 per day 3.5 2 per day 22.5(ingroups<strong>of</strong> 2)3 per day 15 Everyfourth day3 per day 15 Everyfourth day3 per day 15 Everyfourth dayTimeFrequencyTimeFrequency2 1 per day 5 2 per day11 1 per day 5 2 per day14 1 per day 5 2 per day14 1 per day 5 2 per day14 1 per day 5 2 per day14 1 per day 5 2 per day<strong>Appropriateness</strong> <strong>of</strong> <strong>Minimum</strong> <strong>Nurse</strong> <strong>Staffing</strong> <strong>Ratios</strong> in <strong>Nursing</strong> HomesReport to Congress−37
dependent eatingFrequency: 5.0% (2 <strong>of</strong>40)Average time per patient (over allpatients):11.7516.50 28.40 5.60 17.25 3.75 11.75 10.00Total = 95 minutesNote: Shift report time (10 minutes per day) is not presented I this table which illustrates care frequency per day and time on a per-resident basis. A total <strong>of</strong> 10 minutes <strong>of</strong> aide time for all residents isassigned to shift report and documentation. The a.m. and p.m. care does not include incontinence care, and repositioning may be combined with toileting or changes<strong>Appropriateness</strong> <strong>of</strong> <strong>Minimum</strong> <strong>Nurse</strong> <strong>Staffing</strong> <strong>Ratios</strong> in <strong>Nursing</strong> HomesReport to Congress−38
All six groups <strong>of</strong> residents receive the same bathing assistance (e.g., shower every four days) andten minutes is allowed per resident for such housekeeping duties as changing bed linens,replenishing supplies, and managing laundry.<strong>In</strong>vestigators decided to distribute the 50% <strong>of</strong> residents whom they predict will need feedingassistance across the three highest acuity groups (Groups 4, 5, and 6) based on the assumptionthat there is a positive association between the need for feeding assistance and the extent <strong>of</strong> otherADL limitations. Following this logic, investigators placed all residents who need completeassistance with feeding (estimated 10%) in the two highest acuity groups (Categories 5 and 6)and residents who need prompting or minimal assistance in Group 4. <strong>In</strong> the “efficientenvironment” care scenarios investigators modeled (Scenarios A and B), morning care iscompleted before breakfast and residents are brought to the dining room to be fed. This allowsan aide to simultaneously feed four semi-dependent residents over a 30-minute period or twodependent residents over a 45-minute period. These group feeding models are also used forlunch and dinner.14.9 Simulation A and B: Minimal Number <strong>of</strong> Staff Necessary to Provide all Services<strong>In</strong>vestigators first simulated a work-scheduling scenario that would allow for the minimum staffto provide all recommended care listed in Table 14.2 to 100% <strong>of</strong> the residents. This required usto begin a.m. care at 6:00 a.m. with, at least, some people and to use part-time aides during peaktimes (6:00 a.m. to 10:00 a.m., 12:00 p.m. to 4:00 p.m., 5:00 p.m. to 9:00 p.m.). All residentswere fed in the dining room so that efficient feeding assistance could be <strong>of</strong>fered. Any otherstaffing distribution resulted in less efficiency (e.g., more staff were needed to provide careand/or there was increased idle time on the part <strong>of</strong> the staff who were present). The majordifference between Scenario A and B was that in Scenario B investigators allowed for a lowvolume <strong>of</strong> demands for unscheduled service. These unscheduled requests were assumed to take5 to 16 minutes, with an average time <strong>of</strong> ten minutes required. Requests or other needs forassistance were programmed to occur probabilistically, with an average <strong>of</strong> four requests comingfrom 11:00 p.m. to 7:00 a.m. and 16 requests coming in from 7:00 a.m. to 11:00 p.m. <strong>In</strong> otherwords, the 40 residents in the investigators’ sample generated an average <strong>of</strong> 0.5 requests per 24-hour period.14.10 Simulations to Identify Outcomes <strong>of</strong> Less-Than-Ideal StaffScenarios C and D were designed to reflect the outcomes <strong>of</strong> a more typical NH staffing level.<strong>In</strong>vestigators projected a ratio <strong>of</strong> 10 residents to one aide on the 7:00 a.m. to 3:00 p.m. shift, 13.3residents to one aide on the 3:00 p.m. to 11:00 p.m. shift, and one person for 40 residents on the11:00 p.m. to 7:00 a.m. shift. A variant with two aides on the 11:00 p.m. to 7:00 a.m. shift (ratio:20 residents per aide) was also modeled. The investigators’ intent with these scenarios, onceagain, was to maximize the amount <strong>of</strong> care that can be delivered with the available staffing time.However, in these scenarios the frequency <strong>of</strong> some processes had to be reduced from therecommended level (less repositioning or toileting) and the time it takes to provide a service alsohad to be reduced from the recommended level (e.g., feeding assistance times). These reductions<strong>Appropriateness</strong> <strong>of</strong> <strong>Minimum</strong> <strong>Nurse</strong> <strong>Staffing</strong> <strong>Ratios</strong> in <strong>Nursing</strong> HomesReport to Congress−39
were necessary to reflect the reduced time available to provide care. <strong>In</strong>vestigators specificallyillustrate these reduced times and frequencies that were necessary for the reduced staffing modelin Table 14.3.<strong>Appropriateness</strong> <strong>of</strong> <strong>Minimum</strong> <strong>Nurse</strong> <strong>Staffing</strong> <strong>Ratios</strong> in <strong>Nursing</strong> HomesReport to Congress−40
Table 14.3 Frequency and Time <strong>In</strong>put Data for Care Processes (Lower <strong>Staffing</strong>)Patient type1. Continent, <strong>In</strong>dependentlyambulatory, no diapers, no needfor repositioning, no need for ADLenhancements, fully independenteating Frequency: 15% (6 <strong>of</strong>40)% <strong>of</strong>ResidentsTimea.m. CARE EXERCISE CHANGE ORTOILETINGFrequencyTimeFrequencyTimeFrequencyREPOSITIONINGTimeFrequencyGROUP FEEDINGASSISTANCETimeFrequencyTimeSHOWER p.m. CARE HOUSEKEEPINGFrequencyTimeFrequency15.0% 2 1 20 0.5 0 0 0 0 1 3 15 0.125 2 0 5 1Sd\Frequency Unit per day 4Xweek per day 2Xweek per day per day2. Continent, <strong>In</strong>dependentlyambulatory, no diapers, no needfor repositioning, ADLenhancements needed, fullyindependent eating Frequency:15% (6 <strong>of</strong> 40)15.0% 8.25 1 20 0.5 0 0 0 0 1 3 15 0.125 5.5 1 5 1Sd\Frequency Unit 7 per day 4Xweek per day 2Xweek 7 per day per day3. <strong>In</strong>continent, Assistedambulation, day toilet/nightdiapers, repositioning needed,ADL enhancements needed, fullyindependent eating Frequency:20% (8 <strong>of</strong> 40)20.0% 9.5 1 4 2 6 5 3.5 2 1 3 15 0.125 7 1 5 1Sd\Frequency Unit 7 per day per day 7-day,5-night,Sd-24. <strong>In</strong>continent, Assistedambulation, 24 hour diapers,repositioning needed, ADLenhancements needed, semidependent eating Frequency:40% (16 <strong>of</strong> 40)TimeFrequencyper day per day per day 2Xweek 7 per day per day40.0% 9.5 1 4 2 5 5 3.5 2 4.4 3 15 0.125 7 1 5 1Sd\Frequency Unit 7 per day per day 2 per day per day groups<strong>of</strong> 45. <strong>In</strong>continent, Assisted ambulation,24 hour diapers, repositioningneeded, ADL enhancements needed,dependent eating Frequency: 4.5%(2 <strong>of</strong> 40)per day 2Xweek 7 per day per day5.0% 9.5 1 2 2 5 5 3.5 2 10.25 3 15 .0125 7 1 5 1Sd\Frequency Unit 7 per day 2 per day per day groups<strong>of</strong> 26. <strong>In</strong>continent, Bed bound, 24hour diapers, repositioningper day 2Xweek 7 per day per day5.0% 9.5 1 2 2 5 5 3.5 2 10.25 3 15 0.125 7 1 5 1<strong>Appropriateness</strong> <strong>of</strong> <strong>Minimum</strong> <strong>Nurse</strong> <strong>Staffing</strong> <strong>Ratios</strong> in <strong>Nursing</strong> HomesReport to Congress−41
needed, ADL enhancementsneeded, dependent eatingFrequency: 5.0% (2 <strong>of</strong> 40)Sd\Frequency Unit 7 per day 2 per day per day groups<strong>of</strong> 4per day 2Xweek 7 per day per dayAverage time per patient (over all patients): 8.19 1.0 8.4 1.55 18.5 3.5 4.9 1.4 9.86 3.0 1.88 0.13 5.73 .85 5.0 1.00Total =57.44 minutes Note: Shift report time (10 minutes per day) is not presented in this table which illustrates care frequency per day and time on a per-resident basis. A total <strong>of</strong> 10 minutes <strong>of</strong> aide time for all residents is assigned toshift report and documentation. The a.m. and p.m. care does not include incontinence care, and repositioning may be combined with toileting or changes<strong>Appropriateness</strong> <strong>of</strong> <strong>Minimum</strong> <strong>Nurse</strong> <strong>Staffing</strong> <strong>Ratios</strong> in <strong>Nursing</strong> HomesReport to Congress−42
14.11 Results14.11.1 Scenario A: Full- and Part-time Staff: 13.5 FTE per Day, NoUnscheduled Care<strong>In</strong>vestigators first ran the model assuming that there were no resident-initiated care needs (i.e.,no “call lights”). This allowed us to schedule all the recommended care in what is undoubtedlyan unrealistically efficient manner using the following staff:Full-time ShiftsPart-time Shifts7:00 a.m. to 3:00 p.m. shift 5 people 6:00 a.m. to 10:00 a.m. 3 people3:00 p.m. to 11:00 p.m. shift 4 people 12:00 p.m. to 4:00 p.m. 1 person11:00 p.m. to 7:00 a.m. shift 1 person 5:00 p.m. to 9:00 p.m. 2 people1:00 a.m. to 5:00 a.m. 1 personResulting hour by hour ratios:11:00 p.m. to 1:00 a.m. 1 aide per 40 residents (ratio = 40 residents per aide)1:00 a.m. to 5:00 a.m. 2 aides per 40 residents (ratio = 20 residents per aide)5:00 a.m. to 6:00 a.m. 1 aide per 40 residents (ratio = 40 residents per aide)6:00 a.m. to 7:00 a.m. 4 aides per 40 residents (ratio = 10 residents per aide)7:00 a.m. to 10:00 a.m. 8 aides per 40 residents (ratio = 5 residents per aide)10:00 a.m. to 12:00 p.m. 5 aides per 40 residents (ratio = 8 residents per aide)12:00 p.m. to 3:00 p.m. 6 aides per 40 residents (ratio = 6.67 residents per aide)3:00 p.m. to 4:00 p.m. 5 aides per 40 residents (ration = 8 residents per aide)4:00 p.m. to 5:00 p.m. 4 aides per 40 residents (ratio = 10 residents per aide)5:00 p.m. to 9:00 p.m. 6 aides per 40 residents (ratio = 6.67 residents per aide)9:00 p.m. to 11:00 p.m. 4 aides per 40 residents (ratio = 10 residents per aide)The average staffing ratios are:from 7:00 a.m. to 3:00 p.m. 6.4 residents per aidefrom 3:00 p.m. to 11:00 p.m. 8.1 residents per aidefrom 11:00 p.m. to 7:00 a.m. 26.25 residents per aide<strong>In</strong> Scenario A, all residents receive all recommended care, as listed in Table 14.2. This meantthat the average NH resident in the simulation received 95 minutes <strong>of</strong> recommended direct careservices per day plus an additional 10 minutes <strong>of</strong> housekeeping services:Exercise/range <strong>of</strong> motionChanging/toileting/repositioningFeeding assistanceMorning and evening care, showeringHousekeeping services16.5 minutes34.0 minutes17.25 minutes27.25 minutes10.0 minutes<strong>Appropriateness</strong> <strong>of</strong> <strong>Minimum</strong> <strong>Nurse</strong> <strong>Staffing</strong> <strong>Ratios</strong> in <strong>Nursing</strong> HomesReport to Congress−43
<strong>In</strong> the simulation, services were scheduled to minimize resident delays; but even so, shiftchanges and limits on the number <strong>of</strong> staff available led to interruptions in care for someresidents, averaging about 5 minutes per resident per day.When part-time aides are used, more aides are available to deliver care during "peak" times, suchas the early morning and meal times. Under this scenario, morning care began at 6:00 a.m.(probably acceptable to some residents) and was completed on all residents by 7:56 a.m. Allthree meals were completed within their scheduled one-hour time period. Evening care wascompleted by 7:45 p.m. (Note: An alternative scenario was tried starting morning care at 7:00a.m. with the morning part-time shift running from 7:00 a.m. to 11:00 a.m. Under this scenario,two additional morning part-time staff [a total <strong>of</strong> 10 aides available from 7:00 a.m. to 11:00p.m!] were needed to complete morning care by 8:20 a.m. This delayed the start <strong>of</strong> breakfast,although under the group feeding assumptions, breakfast was completed by 9:00 a.m.).<strong>In</strong>vestigators assumed that full-time staff with an 8-hour (480 minute) scheduled shift wereavailable to provide care for 7 hours (420 minutes). <strong>In</strong>vestigators assumed a 30-minute mealperiod and two 15-minute breaks, which were staggered. Part-time staff were available toprovide 3.5 hours <strong>of</strong> care (scheduled for 4 hours with one 30-minute break). Each staff memberwas assumed to spend 5 minutes at the end <strong>of</strong> the shift and 5 minutes at the beginning <strong>of</strong> the shiftgiving report, receiving assignments and doing paperwork. <strong>In</strong> this scenario, all staff memberscombined worked about 143 minutes <strong>of</strong> overtime (a little more than 10 minutes per FTE) eachday. This overtime was related to completing a resident task begun just before the end <strong>of</strong> theshift.<strong>In</strong> this scenario, the staff was engaged in direct resident care nearly 75% <strong>of</strong> the time (Column 1Table 14.4). <strong>In</strong> other words, about 45 minutes <strong>of</strong> direct resident care was provided per 60minutes <strong>of</strong> available work time. <strong>In</strong> addition, staff spent approximately 5 minutes per hourwalking to and from resident rooms to provide care, so that on average staff, were not engaged inwork activities about 17% <strong>of</strong> the time. They were either providing direct care or walking toresidents’ rooms for 49 minutes per available hour or 43 minutes per scheduled hour. Thesenumbers varied by shift, as shown in Table 14.4.Table 14.4 Staff workload for Scenario A: 13.5 FTEs No Unscheduled EventsBased on 7 (3.5) Available Hours per 8 (4) Hour ShiftShift% Time indirect care% Time incare + travelto/from care% Time notengaged inwork activ.Minutes Directcare +travel/avail.hourMinutes Directcare/avail hour8 Hour Shifts:7 a.m. to 3 p.m. 73.8 81.1 18.9 49 443 p.m. to 11 p.m. 81.9 90.5 9.5 54 49<strong>Appropriateness</strong> <strong>of</strong> <strong>Minimum</strong> <strong>Nurse</strong> <strong>Staffing</strong> <strong>Ratios</strong> in <strong>Nursing</strong> HomesReport to Congress−44
11 p.m. to 7 a.m. 54.3 60.0 40.0 36 334 Hour Shifts:6 a.m. to 10 a.m. 75.5 83.4 16.6 50 45Noon-4 p.m. 67.8 75.4 24.6 45 415 p.m. to 9 p.m. 82.2 91.3 8.7 55 491 a.m. to 5 a.m. 62.1 68.1 31.9 41 37Overall 74.8 82.5 17.5 49 4514.11.2 Scenario B: Full- and Part-time Staff: 13.5 FTE per Day, LowVolume Unscheduled EventsScenario B was run exactly like Scenario A, except that a low volume <strong>of</strong> resident-initiated callsor unscheduled work was introduced. These “call-light” requests were assumed to take 5 to 16minutes, with an average time <strong>of</strong> 10 minutes required. Call-light requests occurredprobabilistically, with an average <strong>of</strong> 4 requests coming in from 11:00 p.m. to 7:00 a.m. and 16requests coming in from 7:00 a.m. to 11:00 p.m. <strong>In</strong> other words, residents generated an average<strong>of</strong> 0.5 requests per 24-hour day. For each variation on this scenario, 200 days <strong>of</strong> care weresimulated.Even with this low volume <strong>of</strong> unscheduled tasks, the effects on resident care were noticeable.On 15% <strong>of</strong> the 200 simulated days, staff were simply unable to complete all the recommendedcare. On days when all care was able to be delivered, staff overtime averaged 16 minutes foreach FTE. To consistently provide all resident care under Scenario B, it was necessary toimprove staffing to 14.5 FTE as compared to 13.5 FTE for Scenario A. When unscheduled callsfor care were doubled to an average <strong>of</strong> one episode per resident per day, the Scenario B staff <strong>of</strong>13.5 FTE could only complete all recommended care on slightly less than half <strong>of</strong> the simulateddays and two additional FTE were needed to enable the staff to consistently provide allrecommended services.<strong>In</strong> addition, staff workload increased under Scenario B, so that aides were occupied with directcare about 78% <strong>of</strong> the time and were either giving care or walking to resident rooms more than86% <strong>of</strong> the time. Details are shown in Table 14.5.Table 14.5 Staff workload for Scenario B: 13.5 FTEs with Unscheduled EventsBased on 7 (3.5) Available Hours per 8 (4) Hour ShiftShift% Timein directcare% Time incare + travelto/from care% Timenotengaged inMinutes Directcare + travel/avail. hourMinutesDirectcare/avail<strong>Appropriateness</strong> <strong>of</strong> <strong>Minimum</strong> <strong>Nurse</strong> <strong>Staffing</strong> <strong>Ratios</strong> in <strong>Nursing</strong> HomesReport to Congress−45
work activ.hour8 Hour Shifts:7 a.m. to 3 p.m. 76.3 83.6 16.4 50 463 p.m. to 11 p.m. 83.5 92.4 7.6 55 5011 p.m. to 7 a.m. 62.9 68.6 31.4 41 384 Hour Shifts:6 a.m. to 10 a.m. 79.0 86.9 13.1 52 47Noon-4 p.m 74.0 81.9 18.1 49 445 p.m. to 9 p.m. 87.9 97.0 3.0 58 531 a.m. to -5 a.m. 71.9 77.9 22.2 47 43Overall 78.3 86.1 13.9 52 4714.11.3 Scenario C: Full- and Part-time Staff: Eight FTE per Day, NoUnscheduled EventsThe staffing was reduced to a pattern that may be typical in some NHs and no resident-initiatedcalls were allowed.Full-time Shifts7:00 a.m. to 3:00 p.m. shift 4 people ratio: 10 residents per aide3:00 p.m. to 11:00 p.m. shift 3 people ratio: 13.33 residents per aide11:00 p.m. to 7:00 a.m. shift 1 person ratio: 40 residents per aideA variant with 2 aides on the 11:00 p.m. to 7:00 a.m. shift (ratio: 20 residents per aide) was alsomodeled. <strong>In</strong> this scenario, investigators followed the typical NH practice <strong>of</strong> beginning morningcare at 7:00 a.m.<strong>In</strong> Scenario C, care was scheduled to maximize the amount <strong>of</strong> care that could be delivered withinthe staffing time. The frequency <strong>of</strong> some services was reduced from the recommendedfrequency (e.g., repositioning, toileting, and showering) while the time taken to provide theservice was reduced from the recommended level for others (e.g., feeding assistance, morningand evening care, exercise). Range <strong>of</strong> Motion exercises were reduced both in frequency and intime. These service reductions are listed in Table 14.3.The details <strong>of</strong> the services actually delivered under Scenario C are shown in Table 14.6.<strong>Appropriateness</strong> <strong>of</strong> <strong>Minimum</strong> <strong>Nurse</strong> <strong>Staffing</strong> <strong>Ratios</strong> in <strong>Nursing</strong> HomesReport to Congress−46
<strong>In</strong> Scenario C the average NH resident in the simulation received 57.4 minutes <strong>of</strong> direct care perday plus an additional 5 minutes <strong>of</strong> housekeeping services. This is about 60% <strong>of</strong> therecommended care.Exercise/range <strong>of</strong> motionChanging/toileting/repositioningFeeding assistanceMorning and evening care, showeringHousekeeping services8.4 minutes (50.9% <strong>of</strong> recommended)23.4 minutes (68.8% <strong>of</strong> recommended)9.9 minutes (57.4% <strong>of</strong> recommended group feeding)15.8 minutes (58.0% <strong>of</strong> recommended)5.0 minutes (50% <strong>of</strong> recommended)The feeding assistance level is 57.4 % <strong>of</strong> the recommended level with group feeding; however,this overstates the quality <strong>of</strong> care. <strong>In</strong> this scenario, only about 40% <strong>of</strong> the residents hadcompleted morning care by 8:00 a.m., so many residents had to be fed in their rooms. For theseresidents who are forced to receive one-on-one assistance, the recommended times are actuallytwo to four times higher than the group feeding times.The actual mix <strong>of</strong> care delivered was somewhat arbitrary. The time spent toileting residentscould have been reduced and more time added to exercise. However, the total care deliveredrepresents a realistic bound given the staffing ratios used: the staff workload was very highduring the simulation runs.<strong>In</strong> Scenario C, adding an additional staff member to the 11:00 p.m. to 7:00 a.m. shift did notactually result in more care being delivered to residents. This is due to the restrictions placed onwhen certain services can be provided. If morning care could start earlier, at 6:00 a.m. forexample, then adding an additional night shift person could increase the total care delivered bythree minutes per resident per day. Similarly, if the night shift could do certain housekeepingservices, day and evening staff could deliver more direct care, such as feeding assistance,exercise, and grooming.<strong>In</strong> this scenario, the day and evening shift staff are providing direct care about 80% <strong>of</strong> the time(Table 14.6). When the time walking to and from care is added in, day and evening shift aidesare not engaged in work activities 7.9% and 4.7% <strong>of</strong> the time, respectively. The night shiftbusiness depends, <strong>of</strong> course, on whether one or two aides are available. With only one nightshift aide (a ratio <strong>of</strong> 40 to 1), the night shift is not engaged in work activities only about a quarter<strong>of</strong> the time. With two night shift aides (a ratio <strong>of</strong> 20 to 1), the night shift is not engaged in workactivity more than half the time.<strong>Appropriateness</strong> <strong>of</strong> <strong>Minimum</strong> <strong>Nurse</strong> <strong>Staffing</strong> <strong>Ratios</strong> in <strong>Nursing</strong> HomesReport to Congress−47
Table 14.6 Staff Workload for Scenario C: 8 or 9 FTEs with Unscheduled EventsBased on 7 Available Hours per 8 Hour ShiftShift% Timein directcare% Time incare + travelto/from care% Time notengaged inwork activ.Minutes Directcare + travel/avail. hourMinutesDirectcare/availhourWith total <strong>of</strong> 8 FTEs7 to 3 79.1 92.1 7.9 55 473 to 11 81.3 95.3 4.7 57 4911 to 7 (1 aide) 71.0 78.5 21.6 47 43Overall w/8 FTEs 78.9 91.6 8.4 55 47With one additional FTE on 11 to 711 to 7 (2 aides) 38.1 43.4 56.6 26 23Overall w/9 FTE 70.19 81.8 18.23 49 42The workloads in Scenario C leave no time for responding to call lights or other unscheduledevents. Adding unscheduled events, as investigators saw in Scenario B, decreases the chancethat all <strong>of</strong> the scheduled care can be accomplished. Very likely, real human beings being askedto deliver the simulated care under these conditions will cut corners and actually deliver evenless direct resident care.The situation could be improved by adding another staff person to the day shift, bringing theratio for that shift up to 8 residents per aide. At best, this would result in about 8 additionalminutes <strong>of</strong> care per resident, or a total <strong>of</strong> about 65 minutes per resident, still less than 70% <strong>of</strong> therecommended care.14.12 Conclusions1. <strong>In</strong>vestigators estimate that 13.5 to 15.5 FTE’s for a 24-hour period are necessary tocomplete all care under conditions <strong>of</strong> high efficiency and nurse aide work productivity.The higher FTE’s would occur when the possibility <strong>of</strong> a moderate level <strong>of</strong> unscheduledcare demands for service are considered. <strong>In</strong> all models, the amount <strong>of</strong> time that aideswere not involved in direct care was extremely low and potentially even reflectsunrealistically high levels <strong>of</strong> on-task work performance for a healthcare worker. Even inhighly regimented workplaces, workers will typically spend 5% to 10% <strong>of</strong> their time inpersonal activities, such as going to the bathroom, greeting a co-worker, getting a drink<strong>Appropriateness</strong> <strong>of</strong> <strong>Minimum</strong> <strong>Nurse</strong> <strong>Staffing</strong> <strong>Ratios</strong> in <strong>Nursing</strong> HomesReport to Congress−48
<strong>of</strong> water. 86 <strong>In</strong> more complex tasks such as the nursing aides face, some additional timeneeds to be spent in planning the next activity, gathering supplies and equipment, and inparticipating in staff education programs. 87,88 High on-task productivity is also reflectedby the high numbers <strong>of</strong> service minutes that each resident would receive for these idealstaffing models. This average <strong>of</strong> 105 minutes is much closer to those service minutesreported by the RUGs studies (139 nurse aide minutes per resident) than those reportedby the Holmes study (approximately 45 minutes per resident). To provide 139 minutes <strong>of</strong>direct resident care per resident per day, the staff <strong>of</strong> 13.5 FTE for 40 residents would havebeen busy with direct resident care an unbelievable 98% <strong>of</strong> their available hours, leaving2% <strong>of</strong> their time for travel to and from care and all other personal activities. The shiftresident-to-aide ratios that the 13.5 to 15.5 FTE’s represent would be 5.2 to 6.4, 7:00 a.m.to 3:00 p.m. shift, 7.6 to 8.1, 3:00 p.m. to 11:00 p.m. shift, 26.0 to 26.25, 11:00 p.m. to7:00 a.m. shift.2. The outcomes in the reduced staffing model suggest that a low level <strong>of</strong> care will occurwith the staffing ratios that exist in many NHs, despite high productivity that continue tocharacterize the reduced staffing model. <strong>In</strong> these conditions, it is clear that aides must“cut corners” and make arbitrary decisions about what care to provide and who to provideit to. One observational study that described nurse aide work performance, documentedthat these types <strong>of</strong> efficiency decisions are routinely made by nurse aides in the course <strong>of</strong>their daily work. 89 The resident care outcomes that investigators predict from this modelalso appear to be consistent with observational studies that they have described in theliterature review. These observational studies, which have not relied upon NH-generateddata, have documented extremely low levels <strong>of</strong> incontinence care and particularly themore time consuming incontinence care involving toileting assistance. 13,20 The low levels<strong>of</strong> exercise assistance (also time consuming) and sporadic feeding assistancecharacterized by excessive use <strong>of</strong> physical assistance, which have also been described inthese observational studies, appear consistent with the outcomes predicted by ScenarioC. 20,71,41,48,4914.13 Limitations and Future Directions14.13.1 <strong>In</strong>vestigators Excluded Important Care Processes from the<strong>Staffing</strong> Projections<strong>Appropriateness</strong> <strong>of</strong> <strong>Minimum</strong> <strong>Nurse</strong> <strong>Staffing</strong> <strong>Ratios</strong> in <strong>Nursing</strong> HomesReport to Congress−49
<strong>In</strong>vestigators were given the task <strong>of</strong> estimating nurse aide staffing resources needed toimplement care processes that improve outcomes. To accomplish this objective,investigators had to develop inclusion criteria that went beyond “opinion” to define anefficacious care practice (see page 14-3). These criteria led us to exclude someprocesses that many experts believe are important for high quality NH care. The mostcontroversial excluded processes were those designed to improve quality <strong>of</strong> life and tomanage behavioral and mood disturbance problems; there is widespread opinion andsome evidence that there are effective interventions in both areas. On a separate note,investigators believe they may have underestimated the amount <strong>of</strong> time nurse aidesneed to perform necessary tasks that are unrelated to specific outcomes. With respectto all these issues, investigators have several major points to make.The first and most important point is that the five protocols investigators included in theinvestigators’ analyses feature intervention components that are conceptually related toquality <strong>of</strong> life. These components are integrated with staff assistance in protocols thataddress residents’ need for physical activity, incontinence care, and feeding anddressing assistance. This same point led us to argue in the introduction that adistinction between quality <strong>of</strong> care and quality <strong>of</strong> life is both arbitrary and misleading.<strong>In</strong>vestigators will elaborate on the point here.All care processes that met the investigators’ inclusion criteria involve significantlyincreased personal contact between residents and NH staff. The literature reviewdocumented the extent to which this personal contact exceeds contact under “usualcare” conditions for the protocols pertaining to feeding assistance, ADL dressingenhancement, and incontinence management. If one believes that increased socialinteraction and personal contact between residents and NH staff can improve residents’perceptions <strong>of</strong> life quality and/or their agitation and mood, then measures <strong>of</strong> theseoutcomes should also improve following implementation <strong>of</strong> the five care protocols thatmet the investigators’ inclusion criteria.<strong>In</strong> addition, care provided under the exercise, incontinence, and feeding assistanceprotocols is consistent with resident preferences (e.g., incontinence care and exerciseare <strong>of</strong>fered frequently enough to meet resident preferences) and allows residents tomaximize their independence. To the extent that quality <strong>of</strong> life is improved by providingcare consistent with personal preferences or independence enhancement, then the fiveprotocols that met the investigators’ inclusion criteria are related to improved life quality.To illustrate these points, consider the Functional <strong>In</strong>cidental Training (FIT) exerciseprotocol that investigators are recommending for the approximately 70% <strong>of</strong> NHresidents who are incontinent. 67 This intervention has been shown to improve drynessrates, physical activity levels, and mobility performance measures. It also, however,provides approximately 15 minutes <strong>of</strong> contact every two hours between a nurse aideand a resident; over a 12-hour shift, that amounts to approximately 53 minutes morethan is observed during usual care. <strong>In</strong> addition, FIT significantly reduces agitation as<strong>Appropriateness</strong> <strong>of</strong> <strong>Minimum</strong> <strong>Nurse</strong> <strong>Staffing</strong> <strong>Ratios</strong> in <strong>Nursing</strong> HomesReport to Congress−50
well as delivers incontinence and mobility assistance at a frequency consistent withmany residents’ preferences. When combined with a nighttime intervention thatindividualizes incontinence care, FIT also improves sleep. 90 <strong>In</strong>vestigators are currentlyevaluating whether this protocol improves residents’ and families’ reported perceptions<strong>of</strong> life quality. But even with just the available data, a strong case can be made that theprotocol improves both functional measures and measures <strong>of</strong> behavioral disturbance.Regarding a second point about the investigators’ care process selection, it can beargued that NH residents should receive even more social-interaction time than the fiveprotocols provide and that this additional time should be devoted exclusively to socialinteraction. For example, in addition to receiving feeding assistance in a group orindividualized setting for 30 minutes, perhaps each resident should also be engaged inconversation following each meal. This is an interesting hypothesis, but there are nodata to suggest what outcomes such a protocol would produce, much less specificinformation about how long the social-interaction-only sessions should be (an importantcost issue).<strong>In</strong>vestigators also considered the possibility that social stimulation and residentinvolvement in activities completely independent <strong>of</strong> any other care process might beefficacious. <strong>In</strong> this regard, investigators reviewed two separate groups <strong>of</strong> evidence.Several studies reported mixed but some positive results when residents were given aspecific stimulation protocol (e.g., human interaction, audio tape) whenever theydisplayed agitation symptoms. 91,92,93 <strong>In</strong>vestigators did not include these protocols intheir staffing simulations due to uncertainty about their efficacy if implemented overtime. A key, unanswered question is, “Would residents cease to be attentive to thesestimulation procedures, given that the duration <strong>of</strong> the effects were reportedly limited tothe time that the agitation was occurring?” <strong>In</strong>vestigators do not discount the clinicalimportance <strong>of</strong> even a temporary reduction in agitation, but investigators believe theseresults should be further replicated before the protocols are recommended for NH use.These replication studies should be conducted with attention to documentingmaintenance effects and nurse-aide labor requirements, which will certainly increasebecause other care activities will have to stop so that nurse aides can providestimulation to agitated residents. These time costs will increase even when stimulationis provided via audio tapes.Another study reported that a multi-faceted intervention combining medication review, ageropsychiatrist consult, and an activity program resulted in improved measures <strong>of</strong>behavioral disturbance and mood. 94 The intervention’s most labor-intensive featureinvolved non-licensed staff (activity staff) who performed work outside the normal scope<strong>of</strong> work for nurse aides. <strong>In</strong> this study, staff cost to treat 20 residents for six months was$13,200.00. This study is important, but its implications for nurse aide staffing areunclear. If the intervention were implemented, nurse aides probably would not be freedfrom other responsibilities (e.g., residents would still need incontinence care), but rather<strong>Appropriateness</strong> <strong>of</strong> <strong>Minimum</strong> <strong>Nurse</strong> <strong>Staffing</strong> <strong>Ratios</strong> in <strong>Nursing</strong> HomesReport to Congress−51
new activity staff would have to be hired. Furthermore, depending on the number <strong>of</strong>residents participating in the intervention, the staffing costs could be very high.<strong>In</strong> short, investigators believe there is evidence that social stimulation and activity/engagement interventions can produce improvements in behavioral disturbance andmood. However, it is unclear whether social activity beyond those levels provided in thefive protocols that investigators have included for analysis is necessary to producebeneficial effects. Assuming such “extra” social stimulation were necessary, it isunclear who should deliver that additional care or what it will cost. Based on their ownclinical experience, investigators believe the most logical approach is to maximizeappropriate social interaction between nurse aides and residents while other necessarycare is also being provided. Staff who are not consumed by the physically demandingcare tasks typically required <strong>of</strong> nurse aides (e.g., activity staff, social service personnel,volunteers, etc.) could more efficiently provide residents with additional socialstimulation when needed.With respect to a third and final point, investigators noted previously that nurse aidesperform tasks that may be unrelated to specific outcomes but are neverthelessnecessary. <strong>In</strong> their staffing model, investigators estimated that such tasks consume 30minutes per day. <strong>In</strong>vestigators believe, however, that investigators haveunderestimated the time needed to perform these tasks according to high qualitystandards. Unfortunately, defensible data upon which to base such “high quality” timeestimates are currently unavailable, though efforts are underway to correct this problem.Consider, for example, the assessment activities involved in completing the MDS andResident Assessment Protocols (RAPs). The investigators’ staffing model does notinclude time for these activities beyond what might be needed to complete shift reportssimply because investigators could find no data about how much time nurse aidesspend in these activities. Currently, investigators are collecting information on the laborrequirements associated with completing the MDS and RAP nutrition items. Theinvestigators’ preliminary data suggest that it takes 20 to 30 minutes <strong>of</strong> nurse-aide timeper day just to record MDS food intake items accurately and to implement all the RAPassessment recommendations for residents identified as at risk for potential nutritionalproblems.<strong>In</strong>vestigators did not include this time estimate in their “other care” category becausethe clinical value <strong>of</strong> some <strong>of</strong> the assessments are unclear, and the data are preliminary.<strong>In</strong> other articles, investigators have argued that practice-guideline and RAPrecommendations in multiple areas should be implemented under controlled conditionsso that the cost-effectiveness <strong>of</strong> each recommendation can be determined. 95,96 Basedon their preliminary data, however, investigators believe that some practice-guidelineand RAP recommendations will prove to have high clinical utility and that significantlymore nurse-aide time than investigators have projected in their staffing models will beneeded to accurately complete these assessments.<strong>Appropriateness</strong> <strong>of</strong> <strong>Minimum</strong> <strong>Nurse</strong> <strong>Staffing</strong> <strong>Ratios</strong> in <strong>Nursing</strong> HomesReport to Congress−52
14.13.2 The Labor Requirements <strong>of</strong> <strong>In</strong>dividualizing Care Was Not Simulatedin the <strong>Staffing</strong> Models.<strong>In</strong>vestigators did not project the staffing requirements associated with individualizingcare in part because it is beyond their scope <strong>of</strong> work but also because it is not possibleto do so with the data currently available. <strong>In</strong>vestigators believe this topic is extremelyimportant, however, and when data describing residents’ preferences for daily care areavailable, staffing simulations should be conducted to determine the labor requirement<strong>of</strong> meeting those preferences.Despite the absence <strong>of</strong> data about the time costs or outcomes that would result fromindividualized care interventions, there is consensus that providing care based onresidents’ preferences is an important aspect <strong>of</strong> quality. <strong>In</strong>deed, the ACOVE ExpertConsensus Panel confirmed the importance <strong>of</strong> individualization for life quality with twoindicators:1. IF a vulnerable elder is admitted to a NH,THEN, within 2 weeks, the resident’s preferences for daily life activities in all <strong>of</strong> thefollowing areas should be assessed and documented in the record:sleep schedulemealsroommatestelephone accessparticipation in activitiesspiritualityprivacy2. IF a NH resident can provide stable and realistic preference information about dailylifeactivities that are related to quality <strong>of</strong> life,THEN the degree to which these preferences are being met should be monitored atleastquarterly after admission.Despite the lack <strong>of</strong> data to document a process-outcome link for these indicators, theywere rated as clinically valid and important because <strong>of</strong> the ACOVE panel’s belief thatindividualized care is intuitively linked to high quality. It is possible to test the validity <strong>of</strong>this intuition.Assessing residents’ preferences is an initial step to operationalizing the concept <strong>of</strong>individualization. <strong>In</strong>vestigators are currently conducting such research and areconfident that stable preferences describing activities <strong>of</strong> daily living (e.g., time out <strong>of</strong>bed, dining location) can be obtained from 40% to 62% <strong>of</strong> residents, depending on the<strong>Appropriateness</strong> <strong>of</strong> <strong>Minimum</strong> <strong>Nurse</strong> <strong>Staffing</strong> <strong>Ratios</strong> in <strong>Nursing</strong> HomesReport to Congress−53
care domain for which the preference is being elicited. What is less clear at this stageare the following points:1. How are decisions to be made about individualized care when a resident’spreferences seem unhealthy (i.e., a resident reports a preference to stay in bed allday and never exercise)?2. How much do resident preferences change when monitored daily, and how do youcalculate the staffing cost <strong>of</strong> such variability? For example, if a resident is allowedto decide when to get out <strong>of</strong> bed each day, how will this decision vary from day today and how do you allocate staffing resources so that they are flexible enough toaccommodate this variability?3. How is daily care individualized when a resident’s preferences cannot bedetermined?<strong>In</strong>vestigators are conducting preliminary research designed to answer these questions;soon, investigators should be able to simulate the labor requirements <strong>of</strong> specific nurseaidework schedules that can accommodate individual preferences. <strong>In</strong>vestigatorsanticipate these preliminary data will show that significantly more staff resources thanthose projected in this chapter are needed to individualize care. This prediction takesinto account that the work scheduling scenarios investigators simulated in this chapterwere based on time-efficiency concerns that can be inconsistent with work schedulesdesigned to accommodate individual preferences. For example, previouslyinvestigators reported data showing that 26% <strong>of</strong> a small subset <strong>of</strong> 19 residents with lowfood intake preferred to eat in their rooms. The cost <strong>of</strong> individualizing care consistentwith this preference would be high because each resident separately would needfeeding assistance, at an estimated cost <strong>of</strong> 20 to 30 minutes per resident versus the 30minutes needed to assist the entire group. <strong>Nurse</strong> aides in one study reported lack <strong>of</strong>“time” as a major barrier to individualizing care. 97Alternatively, identifying and satisfying resident preferences may result in some costreductions. For example, it is likely that at least some <strong>of</strong> the residents projected toreceive exercise under the investigators’ simulations do not really want to exercise.Since exercise is a relatively time-consuming care activity, labor savings could resultfrom honoring these residents’ preferences.<strong>In</strong> short, it is technically feasible to define individualized-care work schedules based onresidents’ preferences and to project the staffing resources needed to implement thesecare processes. This work would greatly improve our understanding <strong>of</strong> howindividualized care principles can be operationalized in practice and would be a logicalextension <strong>of</strong> the analyses begun in this chapter.<strong>Appropriateness</strong> <strong>of</strong> <strong>Minimum</strong> <strong>Nurse</strong> <strong>Staffing</strong> <strong>Ratios</strong> in <strong>Nursing</strong> HomesReport to Congress−54
14.13.3 <strong>In</strong>vestigators Did Not Report <strong>Staffing</strong> Requirements Needed toCompensate for Poor Management and High Staff Turnover.<strong>In</strong>vestigators projected the staffing resources needed to implement high quality careunder work conditions characterized as both efficient and productive, even though thereis strong reason to believe that the NH environment is not conducive to such workconditions. <strong>In</strong>vestigators considered simulating staff models that accounted for poormanagement and high staff turnover in two ways:1. Reduce the amount <strong>of</strong> time that nurse aides have available to provide care, to lessthan the approximately 42 to 46 minutes per hour that investigators used in theirstaffing simulations. This correction would assume that poorly managed aideswork inefficiently and spend less time than they have available providing directcare.2. <strong>In</strong>crease the amount <strong>of</strong> time needed to implement each <strong>of</strong> the five protocols toaccommodate for new staff who are learning on the job (e.g., increase the amount<strong>of</strong> time needed to complete ADL morning care from 20 minutes to 25 minutes).Either <strong>of</strong> the above corrections would increase the number <strong>of</strong> nurse aides needed toprovide high quality care beyond the numbers projected in this chapter. <strong>In</strong>vestigatorsdid not make either correction in part because <strong>of</strong> inconsistent data about nurse-aideproductivity but also due to conceptual reasons.With respect to inconsistent data, consider the mixed results investigators reported inthe chapter subsections <strong>In</strong>put Variables Estimating Amount <strong>of</strong> Time Aides HaveAvailable to Provide Care and Review <strong>of</strong> Literature Describing Process-OutcomeRelationships and Labor Requirements. Data from the RUGs studies, which report howmany minutes <strong>of</strong> care residents receive from nurse aides, suggest either very high staffproductivity or high staffing levels, as do two observational studies that reported nurseaides are <strong>of</strong>ten observed in direct care activities. 74,75,77 By contrast, the time studyconducted by Holmes, et.al. (<strong>In</strong> Press), which documented that nurse aides provide only44.8 minutes <strong>of</strong> care per resident in a 24-hour period, suggests either extremely lowstaffing or low productivity. Supporting the Holmes data are other observational studiesthat have described surprisingly low frequencies <strong>of</strong> incontinence care, mobilityassistance, and feeding assistance. 13,20,71,41 <strong>In</strong> short, the available data provide no cleardirection about how to determine the efficiency and productivity <strong>of</strong> nurse aides undercurrent NH work conditions. A case could be made for assuming either high or lowproductivity as a typical NH work scenario.The second reason for not simulating staffing needs under conditions <strong>of</strong> poormanagement was conceptual. <strong>In</strong>vestigators do not believe that financial managers willincrease staff beyond those needed to provide care under good managementassumptions just to compensate for bad management. The most typical andappropriate approach to the problem is to identify the labor resources needed to provide<strong>Appropriateness</strong> <strong>of</strong> <strong>Minimum</strong> <strong>Nurse</strong> <strong>Staffing</strong> <strong>Ratios</strong> in <strong>Nursing</strong> HomesReport to Congress−55
care under good management and then create the management conditions that lead toefficient use <strong>of</strong> these labor resources.There also is strong reason to believe that NH work conditions are not conducive tomotivating staff to be either highly efficient or productive. <strong>In</strong>vestigators note thefollowing:1. Due to high turnover among both nurse aides and supervisory nurses, staff trainingis constantly needed. During their training, nurse aides cannot be expected towork very efficiently or skillfully with residents.2. Salaries for nurse aides are very low in an organization with a vertical salarystructure (if administrative and pr<strong>of</strong>essional salaries are considered). This salarystructure plus the absence <strong>of</strong> a nurse aide career advancement path to highersalaries very likely adversely affects both morale and productivity.3. There are no timely or accurate measures that either supervisors or nurse aidescan efficiently use to judge their own daily work performance, which makesfeedback for the purpose <strong>of</strong> reinforcing and sustaining good performance difficult.4. Supervisory staff trained in management and clinical care are either not present inNHs, do not work directly on the floors, or have multiple jobs exclusive <strong>of</strong>management. Given the difficulty and importance <strong>of</strong> assuring that multiple lowpaidstaff provide consistent care, a full-time supervisor devoted exclusively tonurse-aide management would seem to be minimally necessary to assure highproductivity.<strong>In</strong> sum, this chapter identified the nurse-aide resources necessary to implementefficacious care processes under highly productive work conditions, which investigatorsdoubt exist in most NHs. A minimally necessary step to improving care is to assure thatthe required labor resources are available. This chapter provides some guidance aboutwhat these staffing resources might be. However, it is very likely that investments instaffing must also be accompanied by improvements in working conditions if theresources are to be effectively used to improve quality.14.14 Conclusion: Setting <strong>Nursing</strong> Home <strong>Nurse</strong> <strong>Staffing</strong> Standards14.14.1 Study Question: How Should <strong>Appropriateness</strong> Be Defined?This chapter concludes HCFA’s Phase 1 report in response to the current concern aboutinadequate nursing home nurse staffing, and a long-standing requirement for a study and reportto Congress on the “appropriateness” <strong>of</strong> establishing minimum nurse staffing ratios. TheCongressional language was clear, but sparse and it was necessary to operationalize“appropriateness” so that there was a study question open to empirical investigation. Consistent<strong>Appropriateness</strong> <strong>of</strong> <strong>Minimum</strong> <strong>Nurse</strong> <strong>Staffing</strong> <strong>Ratios</strong> in <strong>Nursing</strong> HomesReport to Congress−56
with this objective, the analysis presented in Chapters 9 through 12 have defined the key studyquestion: Is there some ratio <strong>of</strong> nurses to residents below which nursing home residents are atsubstantially increased risk <strong>of</strong> quality problems? As we have seen, there is strong evidencesupporting the existance <strong>of</strong> these nurse staffing ratio thresholds, and this finding in turnseemingly provides support for a regulatory minimum ratio requirement. Of course, theappropriateness <strong>of</strong> establishing a new regulatory minimum would also have to assess the costs,feasibility <strong>of</strong> implementation, and other considerations which are the subject <strong>of</strong> a Phase 2 studyand report to Congress. What is important to note here is that this conceptualization <strong>of</strong>appropriateness is what is expected from a regulatory agency; regulatory standards are typicallyminimal standards.The “appropriateness” <strong>of</strong> minimum staffing ratios, however, could be defined as the staffingthreshold required to attain good or optimal quality outcomes, as opposed to avoiding badoutcomes. As was discussed in Chapter 1, this focus on optimal outcomes is analogous to howthis question <strong>of</strong> appropriate ratios has emerged in education with respect to classroom size. Herethe emphasis has been on determining the optimal (not a minimum) ratio <strong>of</strong> students to teacherswhich has been found to be somewhere around 18 students per teacher, at least for the lowergrade levels. Below that ratio no improvement in student performance is observed.Although the definition <strong>of</strong> appropriateness implicit in Chapters 9 through 12 as minimal ratios isconsistent with normal regulatory standards, the alternative definition <strong>of</strong> appropriateness asoptimal ratios would seem consistent - even required - by current statutes and regulations. As wehave discussed in greater detail in Chapter 4, The Omnibus Budget Reconciliation Act <strong>of</strong> 1987(OBRA ‘87) provided amendments to the Social Security Act (SSA) for Skilled <strong>Nursing</strong>Facilities (SNF) and <strong>Nursing</strong> Facilities (NF). The statutory language throughout theseamendments and regulations and guidelines promulgated under OBRA ‘87 placed emphasisupon providing the scope <strong>of</strong> care and services (including sufficient qualified staff) for a residentresiding in a LTC facility to assure that each resident could attain or maintain his/her highestpracticable physical, mental, and psychosocial well-being. Hence, it would appear that HCFA’scurrent staffing regulations, particularly the general regulation requiring “. . . sufficient nursingstaff to attain or maintain the highest practicable . . . well-being <strong>of</strong> each resident . . .,” areintended to provide appropriate care conceptualized as an optimal standard, not a minimalstandard. 14With respect to what is appropriate nurse aide staffing, the analysis presented in this chapter isconsistent with identifying a minimum ratio for attaining optimal quality outcomes. Essentially,the analysis asks how much nurse aide time is required to implement five specific, daily care14 . With the repeal <strong>of</strong> the Boren Amendment in 1997, it would appear that Congress does not now require thatthe States Medicaid nursing home payment rates must be sufficient to provide “ . . . services required toattain or maintain the highest practical physical, mental and psychosocial well-being <strong>of</strong> each Medicaidresident . . .” Nevertheless, the OBRA “highest practical” quality standard remains unchanged. SeeChapter 2 for a discussion <strong>of</strong> the Boren Amendment and State Medicaid payment rates.<strong>Appropriateness</strong> <strong>of</strong> <strong>Minimum</strong> <strong>Nurse</strong> <strong>Staffing</strong> <strong>Ratios</strong> in <strong>Nursing</strong> HomesReport to Congress−57
processes that have been linked to (good) resident outcomes: repositioning and changing wetclothes; repositioning and toileting; exercise encouragement/assistance; feeding assistance; andActivities <strong>of</strong> Daily Living (ADL) independence enhancement (morning care). The simulationanalysis estimates these times for six major categories <strong>of</strong> residents with different functionallimitations and care needs that broadly define the nursing home population. Obviously, thesefive care processes are not a complete list <strong>of</strong> what nurse aides must do, and the analysis took intoconsideration such things as shower assistance, p.m. care, housekeeping duties (e.g., changingbed linens), and random, unscheduled demands for services (e.g., responding to patient calllights, spills, accidents, and similar events).One key simulation estimated that the average number <strong>of</strong> minimal nurse aide staff necessary toprovide all services (i.e., the stated OBRA ‘87 standard) that can benefit a hypothetical 40resident unit <strong>of</strong> average acuity is 14.5 FTEs or 2.9 hours per resident day. This is an estimate <strong>of</strong>the minimally necessary nurse aide staff to provide optimal care. This standard should beviewed as a necessary condition for optimal care by nurse aides, not a sufficient condition.Obviously, the other licensed categories <strong>of</strong> nursing, RNs and LPNs are also important, asdemonstrated from the findings presented in the previous four chapters. <strong>In</strong>deed, the Ohio resultsfor one <strong>of</strong> the outcome measures that would normally be expected to be more highly related tonurse aide staffing, improvement in resisting care, was in fact more strongly associated with RNstaffing. The simulation estimate assumes an extremely highly motivated and productive nurseaide staff. Even under conditions <strong>of</strong> 2.9 hours per resident day <strong>of</strong> potentially available time,what nurse aides actually do and accomplish with respect to patient care is dependent upon asufficiently skilled licensed staff to supervise aides as well as other organizational factors.14.14.2 Strong EvidenceThe full evidence in support <strong>of</strong> this 2.9 hour per resident day optimal nurse aide standard is muchgreater than what might be apparent from this chapter alone. The analysis presented in Chapters9 through 12 found an estimated 2.0 nurse aide hours as a minimal or preferred nurse aidestaffing threshold. These other analysis lends support to the optimal standard in two ways. First,the differences in the two standards are in predicted direction - we expect the minimal orpreferred standard to be less than the optimal standard. Second, the two analyses used entirelydifferent data, methods, and even the outcome measures or domains were different.The outcomes analysis in Chapters 9 through 12 (a) selected States and facilities, (b) developedfacility-level measures <strong>of</strong> nurse staffing and outcomes, and (c) examined the relationshipbetween the two with logistic regression models. <strong>In</strong> contrast, the analysis in this chapteressentially synthesized and simulated from a large number <strong>of</strong> time-motion studies; the nurse aidetime (and staffing implications) necessary to perform specific “best practices”care processes. Itwould be hard to imagine a more divergent approach than found in these two analyses. Yet, theestimated thresholds are not only in the predicted direction, as noted above, but the order <strong>of</strong>magnitude appears consistent. If the simulation analysis had produced an optimal standard <strong>of</strong>say - 4 or 5 hours - then we might have to conclude that the differences between the two analysisare due to the different standards - minimal or preferred vs. optimal - or due to differences in<strong>Appropriateness</strong> <strong>of</strong> <strong>Minimum</strong> <strong>Nurse</strong> <strong>Staffing</strong> <strong>Ratios</strong> in <strong>Nursing</strong> HomesReport to Congress−58
data and methods, and we would invoke the usual “more research is needed.” Fortunately, theresults <strong>of</strong> these two very different analyses appear remarkably consistent.14.14.3 Applying the OBRA ‘87 StandardAs noted in the chapter, the simulation estimate <strong>of</strong> minimally necessary nurse aide time is muchhigher than typically found in U.S. nursing homes. But how much higher? <strong>In</strong> Tables 14.7 and14.8 below, we have estimated the number <strong>of</strong> homes that fail to meet this standard. We haveutilized a modified OSCAR data set to generate this estimate. As was discussed in greater detailin Chapter 7, this OSCAR file has been created with decision rules that improve the accuracyand reliability <strong>of</strong> the reported data. As we can see from the table, nearly all nursing homes in theU.S., over 92%, fall below the 2.9 hours per resident day standard. Nearly half <strong>of</strong> facilitieswould need to increase nurses aide staffing by 50% or more to reach this threshold, including16% that would be required to increase nurses aide staffing by at least 100 percent.• Only 5% <strong>of</strong> freestanding facilities used 2.9 or more aide hours, and 62% wouldneed to increase aide staffing by 50% or more to reach this level. The impact wasless for hospital-based facilities, but nearly 25% <strong>of</strong> hospital-based facilities usedfewer than 2.9 nurses aide hours, and many <strong>of</strong> these were well below the 2.9level.• Reflecting the lower staffing levels <strong>of</strong> for-pr<strong>of</strong>it facilities, they would be affectedmore by this proposal than non-pr<strong>of</strong>it or government facilities. Nearly 96% <strong>of</strong>for-pr<strong>of</strong>it facilities used fewer than 2.9 nurses aide hours, compared to 87% <strong>of</strong>non-pr<strong>of</strong>its and 84% <strong>of</strong> government facilities.• The 2.9 nurse aide hours per resident requirements affects most facilities in everyState, but the impact differs across States. <strong>In</strong> California, for example, 30% <strong>of</strong>facilities would need to increase aide staffing by 50% <strong>of</strong> more to reach the 2.9level, compared to 70% <strong>of</strong> Texas facilities and more than 80% <strong>of</strong> Oklahomafacilities (Table 14.7)Table 14.7: <strong>Staffing</strong> Levels in U.S. <strong>Nursing</strong> Homes: Impact <strong>of</strong> Schnelle <strong>Nurse</strong>s Aide<strong>Staffing</strong> Requirement (2.90 <strong>Nurse</strong>s Aide Hours per Resident Day), 1998Facilities% affected byrequirementDistribution <strong>of</strong> required increase:≤10% 11-20% 21-30% 31-40% 41-50% 50-99% ≥100%All 0.922 .049 .067 .095 .113 .117 .321 .161Freestanding 0.950 .041 .063 .093 .115 .124 .344 .170Hospital-based 0.742 .097 .093 .111 .098 .070 .167 .105<strong>Appropriateness</strong> <strong>of</strong> <strong>Minimum</strong> <strong>Nurse</strong> <strong>Staffing</strong> <strong>Ratios</strong> in <strong>Nursing</strong> HomesReport to Congress−59
For-pr<strong>of</strong>it 0.957 .029 .048 .081 .107 .126 .373 .193Non-pr<strong>of</strong>it 0.866 .079 .102 .120 .128 .101 . 227 .110Government 0.833 . 108 .097 .127 .115 .094 .218 .073Note: The minimum nurses aide staffing level suggested by Schnelle is 2.90 hours per resident day (see Chapter 13).Source: OSCAR<strong>Appropriateness</strong> <strong>of</strong> <strong>Minimum</strong> <strong>Nurse</strong> <strong>Staffing</strong> <strong>Ratios</strong> in <strong>Nursing</strong> HomesReport to Congress−60
Table 14.8: <strong>Staffing</strong> Levels in U.S. <strong>Nursing</strong> Homes:Impact <strong>of</strong> Schnelle <strong>Nurse</strong>s Aide<strong>Staffing</strong> Requirement (2.90 <strong>Nurse</strong>s Aide Hours per Resident Day), 1998State% affected byrequirementDistribution <strong>of</strong> staffing increase required for facilities not incompliance≤10% 11-20% 21-30% 31-40% 41-50% 51-99% ≥100%AK 0.45 0.18 0.00 0.18 0.09 0.00 0.00 0.00AL 0.83 0.20 0.13 0.17 0.10 0.06 0.14 0.02AR 0.94 0.03 0.05 0.04 0.10 0.15 0.51 0.08AZ 0.88 0.04 0.04 0.10 0.13 0.10 0.42 0.06CA 0.89 0.05 0.09 0.13 0.16 0.16 0.22 0.08CO 0.94 0.03 0.09 0.08 0.12 0.12 0.40 0.12CT 0.95 0.07 0.14 0.17 0.16 0.13 0.14 0.15DE 0.67 0.04 0.04 0.00 0.21 0.08 0.25 0.04FL 0.92 0.04 0.08 0.10 0.09 0.15 0.36 0.10GA 0.95 0.03 0.03 0.10 0.13 0.15 0.43 0.07HI 0.75 0.03 0.19 0.22 0.19 0.03 0.03 0.06IA 0.96 0.02 0.01 0.04 0.06 0.06 0.42 0.37ID 0.69 0.13 0.09 0.11 0.09 0.07 0.18 0.02IL 0.92 0.02 0.03 0.05 0.05 0.07 0.36 0.33IN 0.96 0.01 0.01 0.03 0.04 0.04 0.36 0.48KS 0.97 0.02 0.02 0.03 0.05 0.04 0.42 0.39KY 0.89 0.04 0.06 0.05 0.12 0.18 0.33 0.12LA 0.95 0.02 0.04 0.04 0.13 0.16 0.50 0.06MA 0.93 0.09 0.12 0.18 0.16 0.13 0.20 0.04MD 0.92 0.04 0.05 0.08 0.16 0.16 0.34 0.09ME 0.74 0.15 0.22 0.16 0.07 0.07 0.06 0.02MI 0.91 0.10 0.09 0.16 0.17 0.16 0.19 0.04MN 0.99 0.02 0.04 0.09 0.14 0.16 0.36 0.18MO 0.93 0.03 0.03 0.04 0.05 0.06 0.32 0.39MS 0.93 0.05 0.07 0.10 0.11 0.16 0.30 0.14MT 0.89 0.11 0.12 0.16 0.11 0.18 0.20 0.01NC 0.84 0.09 0.10 0.10 0.14 0.09 0.28 0.04<strong>Appropriateness</strong> <strong>of</strong> <strong>Minimum</strong> <strong>Nurse</strong> <strong>Staffing</strong> <strong>Ratios</strong> in <strong>Nursing</strong> HomesReport to Congress−61
ND 0.91 0.06 0.18 0.19 0.13 0.13 0.20 0.03NE 0.94 0.01 0.03 0.04 0.10 0.08 0.38 0.30NH 0.79 0.03 0.11 0.13 0.11 0.21 0.15 0.05NJ 0.96 0.03 0.08 0.09 0.17 0.17 0.36 0.06NM 0.87 0.05 0.02 0.04 0.09 0.15 0.42 0.11NV 0.86 0.06 0.00 0.06 0.03 0.03 0.46 0.23NY 0.98 0.05 0.11 0.17 0.20 0.12 0.20 0.12OH 0.93 0.05 0.08 0.11 0.13 0.13 0.31 0.12OK 0.96 0.02 0.00 0.03 0.04 0.08 0.35 0.44OR 0.95 0.12 0.05 0.16 0.08 0.13 0.35 0.06PA 0.92 0.07 0.08 0.12 0.13 0.14 0.32 0.07RI 0.94 0.09 0.12 0.10 0.14 0.12 0.19 0.19SC 0.87 0.03 0.11 0.11 0.13 0.21 0.24 0.03SD 1.00 0.04 0.05 0.06 0.11 0.15 0.53 0.06TN 0.95 0.03 0.04 0.06 0.11 0.12 0.43 0.16TX 0.93 0.03 0.03 0.04 0.07 0.07 0.42 0.27UT 0.90 0.06 0.04 0.13 0.04 0.09 0.33 0.19VA 0.89 0.04 0.05 0.08 0.08 0.11 0.47 0.07VT 1.00 0.17 0.14 0.21 0.21 0.03 0.14 0.10WA 0.81 0.11 0.17 0.12 0.15 0.10 0.12 0.03WI 0.97 0.05 0.09 0.16 0.16 0.17 0.31 0.03WV 0.91 0.00 0.06 0.12 0.31 0.17 0.25 0.00WY 0.94 0.06 0.06 0.16 0.06 0.10 0.42 0.06Note: The minimum nurses aide staffing level suggested by Schnelle is 2.90 hours per resident day (see Chapter 14).Source: OSCAROf course it should be noted that the 2.9 hour <strong>of</strong> nurse aide time per resident day estimate is foran average nursing home. A nursing home with residents <strong>of</strong> higher or lower acuity would have ahigher or lower threshold, respectively, if this optimal standard is to be met. Hence, the OSCARdata alone would not be sufficient for identifying this optimal standard for a particular nursinghome; the threshold would have to be adjusted individually for the case-mix <strong>of</strong> the facility.Nevertheless, HCFA expects that our improved OSCAR file provides a reasonable estimate <strong>of</strong>the staffing distribution <strong>of</strong> all nursing homes in the U.S. - a distribution <strong>of</strong> nursing homes whichby definition are in the aggregate <strong>of</strong> average acuity and functional limitations.<strong>Appropriateness</strong> <strong>of</strong> <strong>Minimum</strong> <strong>Nurse</strong> <strong>Staffing</strong> <strong>Ratios</strong> in <strong>Nursing</strong> HomesReport to Congress−62
Meeting this optimal standard can also be expressed in the number <strong>of</strong> required nurse aide FTEs.The 14.5 FTE is equivalent to 2.9 hours per resident day for 40 resident. The average number <strong>of</strong>residents per certified nursing home is 87.6. 15 For this “average” nursing home, the standard <strong>of</strong>2.9 hours <strong>of</strong> nurse aide time per resident day is equivalent to 31.76 FTE nurse aides. Yet theaverage staffing level for this “average” nursing home is 22.01. Hence, the “average” nursinghome would have to increase its nurse aide staffing by just under 10 FTEs to meet this optimalstandard, an increase <strong>of</strong> about 44 percent.14.14.4 Is the OBRA <strong>Staffing</strong> Standard Attainable?The findings produced here raise serious doubts whether this minimally optimal standard is arealistic goal. Clearly, a very large percentage <strong>of</strong> facilities fail to meet this standard and they failby a very wide margin. This failure is compounded when one takes into consideration the 2.9hours <strong>of</strong> nurse aide time per resident day as a lower bound estimate for providing all needed care.As was shown in the chapter, the simulations assume very little unscheduled care demands, andwhat might be considered unrealistic high levels <strong>of</strong> on-task work performance and productivityfor a health care worker. It also assumes a convenient physical layout, and a deployment <strong>of</strong> staffin what was recognized as an unrealistically efficient manner. More realistic assumptions wouldclearly raise this lower bound estimate considerably.<strong>In</strong> a sense, the stated OBRA ‘87 standard <strong>of</strong> staffing to provide the highest practicable well-beinghas a well-intended, but probably unrealistic goal similar to the “sleeper” clause in the EconomicOpportunity Act <strong>of</strong> 1964 which required the “maximum feasible participation” <strong>of</strong> the poor in theadministration <strong>of</strong> the Community Action Programs for the War on Poverty. 16 Just as the povertylegislation was silent on the meaning <strong>of</strong> “maximum feasible participation,” the OBRA legislationand regulations are silent with respect to what exactly is required to meet the “highest practicablewell-being.”; indeed with the repeal <strong>of</strong> the Boren Amendment, it can be argued that Congress hasrejected the cost implications <strong>of</strong> its “highest practicable”quality standard. On the other hand, asan ideal goal, the much higher staffing levels found in other countries indicates (see Chapter 3)that it is possible to move a very substantial distance toward this goal.______________________________________________________________________________Appendices for this Report to Congress: <strong>Appropriateness</strong> <strong>of</strong> <strong>Minimum</strong> <strong>Nurse</strong> <strong>Staffing</strong> <strong>Ratios</strong> in<strong>Nursing</strong> Homes, can be found in a separate volume.1516Unpublished data from OSCAR, current surveys, March 27, 2000.Kramer, Ralph M., Participation <strong>of</strong> the Poor - Community Case Studies in the War onPoverty. Prentice-Hall, 1969.<strong>Appropriateness</strong> <strong>of</strong> <strong>Minimum</strong> <strong>Nurse</strong> <strong>Staffing</strong> <strong>Ratios</strong> in <strong>Nursing</strong> HomesReport to Congress−63
References1. Toepp MC, Kuznets N, Herrera S. Directory <strong>of</strong> clinical practice guidelines: Titles,sources, and updates (1998). Chicago, IL: American Medical Association.2. U.S. Preventive Services Task Force. Guide to clinical preventive services, 2 nd ed.(1996) Alexandria, VA: <strong>In</strong>ternational Medical Publishing.3. National Library <strong>of</strong> Healthcare <strong>In</strong>dicators: Health Plan and Network Edition (1997).Oakbrook Terrace. IL: Joint Commission on Accreditation <strong>of</strong> HealthcareOrganizations.4. The Medical Outcomes & Guidelines Sourcebook: A progress report and resourceguide on medical outcomes research and practice guidelines: Developments, data,and documentation (1997). New York, NY: Faulkner & Gray.5. Neufeld RR, Libow LS, Foley WJ, Dunbar JM, Cohen C, Breuer B (1999).Restraint reduction reduces serious injuries among nursing home residents. J AmGeriatr Soc, 47(10):1202-1207.6. Evans LK, Strumpf NE, Allen-Taylor SL, et al (1997). A clinical trial to reducerestraints in nursing homes. J Am Geriatr Soc, 45:675-681.7. Morris JN, Fiatarone M, Kiely DK, Belleville-Taylor P, Murphy K, Littlehale S, OoiWL, O’Neill E, Doyle N (1999). <strong>Nursing</strong> rehabilitation and exercise strategies in thenursing home. J <strong>of</strong> Gerontology: Medical Sciences, 54(10):494-500.8. McCallion P, Toseland RW, Lacey D, Banks, S. (1999). Educating nursingassistants to communicate more effectively with nursing home residents withdementia. The Gerontologist, 39(5):546-558.9. Beck C, Heacock P, Mercer SO, Walls RC, Rapp CG, Vogelpohl TS (1997).Improving dressing behavior in cognitively impaired nursing home residents. NursRes, 46:126-132.10. Blair CE (1995). Combining behavior management and mutual goal setting toreduce physical dependency in nursing home residents. Nurs Res; 44(3):160-165.11. Ouslander JG, Schnelle JF, Uman G, Fingold S, Nigam JG, Tuico E, Bates-JensenB (1995). Predictors <strong>of</strong> successful prompted voiding among incontinent nursinghome residents. JAMA, 273(17):1366-1370.12. Schnelle JF (1990). Treatment <strong>of</strong> urinary incontinence in nursing home patients byprompted voiding. J Am Geriatr Soc, 38:356-360.<strong>Appropriateness</strong> <strong>of</strong> <strong>Minimum</strong> <strong>Nurse</strong> <strong>Staffing</strong> <strong>Ratios</strong> in <strong>Nursing</strong> HomesReport to Congress−64
13. Schnelle JF, Sowell VA, Traughber B, Hu T-W (1988). A behavioral analysis <strong>of</strong> thelabor cost <strong>of</strong> managing continence and incontinence in nursing home patients. JOrganizational Behav Management, 9(2):137-153.14. Clinical Practice Guideline Number 3. Pressure ulcers in adults: Prediction andprevention (May 1992). U.S. Dept. <strong>of</strong> Health and Human Services, Public HealthService, Agency for Health Care Policy and Research, Rockville, MD. AHCPRPubl. No. 92-0047.15. Clinical Practice Guideline, 1996. Pressure Ulcers. Am Med Directors Association.16. Norton D, McLaren R, Exton-Smith AN (1975). An investigation <strong>of</strong> geriatric nursingproblems in hospital. London: Churchill Livingstone, 238 p. Original work publishedin 1962.17. Schnelle JF, Adamson GM, Cruise PA, Al-Samarrai N, Sarbaugh BsC, Uman G,Ouslander, JG (1997). Skin disorders and moisture in incontinent nursing homeresidents: <strong>In</strong>tervention implications. J Am Geriatr Soc, 045:1182-1188.18. Bergstrom N, Braden B, Kemp M, Champagne M, Ruby E (1996). Multi-site study<strong>of</strong> incidence <strong>of</strong> pressure ulcers and the relationship between risk level,demographic characteristics, diagnoses, and prescription <strong>of</strong> preventiveinterventions. J Am Geriatr Soc, 44(1):22-30.19. Xakellis GC, Frantz RA, Lewis A, Harvey P (1998). Cost-effectiveness <strong>of</strong> anintensive pressure ulcer prevention protocol in long-term care. Advances in WoundCare, 11:22-29.20. Simmons SF, Schnelle JF (1999). Strategies to measure nursing home residents’satisfaction and preferences related to incontinence and mobility care: Implicationsfor evaluating intervention effects. The Gerontologist, 39(3): 345-355.21. Gustafson DH, Gustafson R (1996). Re-engineering long-term care quality <strong>of</strong> lifeimprovement. HCFA Report, August: 1-19.22. Clinical Practice Guideline Number 2, March 1996 Update. Urinary incontinence inadults: Acute and chronic management. U.S. Department <strong>of</strong> Health and HumanServices, Public Health Service, Agency for Health Care Policy and Research,Rockville, MD. AHCPR Publication No. 96-0682.23. Clinical Practice Guideline, 1996. Urinary <strong>In</strong>continence. American MedicalDirectors Association.<strong>Appropriateness</strong> <strong>of</strong> <strong>Minimum</strong> <strong>Nurse</strong> <strong>Staffing</strong> <strong>Ratios</strong> in <strong>Nursing</strong> HomesReport to Congress−65
24. Schnelle JF (1990). Treatment <strong>of</strong> urinary incontinence in nursing home patients byprompted voiding. J Am Geriatr Soc, 38:356-360.25. Creason NS, Grybowski JA, Burgener S, Whippo C, Yeo SA, Richardson B (1989).Prompted voiding therapy for urinary incontinence in aged female nursing homeresidents. J Adv Nurs, 14:120-126.26. Hu TW, Igou JF, Kaltreider DL, Yu LC, Rohner TJ, Dennis PJ, Craighead WE,Hadley ED, Ory MG (1995). A clinical trial <strong>of</strong> a behavioral therapy to reduceurinary incontinence in nursing homes. JAMA, 273(17):1366-1370.27. Colling J, Ouslander J, Hadley BJ, Eisch J, Campbell E (1992). Effects <strong>of</strong>patterned urge response toileting (PURT) on urinary incontinence among nursinghome residents. J Am Geriatr Soc, 40:135-141.28. Schnelle JF, Keeler E, Hays RD, Simmons S, Ouslander JG, Siu A (1995). A costand value analysis <strong>of</strong> two interventions with incontinent nursing home residents. JAm Geriatr Soc , 43:1112-1117.29. Schnelle JF, Ouslander JG, Simmons SF, Alessi CA, Gravel MD (1993). Thenighttime environment, incontinence care, and sleep disruption in nursing homes.J Am Geriatr Soc, 41:910-914.30. Cruise PA, Schnelle JF, Alessi CA, Ouslander JG (1998). The nighttimeenvironment and incontinence care practices in nursing homes. J Am Geriatr Soc,46:181-186.31. Ouslander JG, Al-Samarrai N, Schnelle JF (<strong>In</strong> Review). Prompted voiding fornighttime incontinence in nursing homes: Is it effective?32. Schnelle JF, Cruise PA, Alessi CA, Al-Samarrai N, Ouslander JG (1998).<strong>In</strong>dividualizing nighttime incontinence care in nursing home residents. Nurs Res,47(4):197-204.33. Online Survey, Certification and Reporting System (1997). Health Care FinancingAdministration: Forms 671, 672.34. Frantz RA, Gardner S, Harvey P, Specht J (1991). The cost <strong>of</strong> treating pressureulcers in a long-term care facility. Decubitus, 4(3): 37-45.35. Ouslander J, Schnelle J, Simmons S, Bates-Jensen B, Zeitlin M. The dark side <strong>of</strong>incontinence: Nighttime incontinence in nursing home residents (1993). J AmGeriatr Soc, 41: 371-376.<strong>Appropriateness</strong> <strong>of</strong> <strong>Minimum</strong> <strong>Nurse</strong> <strong>Staffing</strong> <strong>Ratios</strong> in <strong>Nursing</strong> HomesReport to Congress−66
36. Lekan-Rutledge D, Palmer MH, Belyea M (1998). <strong>In</strong> their own words: nursingassistants’ perceptions <strong>of</strong> barriers to implementation <strong>of</strong> prompted voiding in longtermcare. The Gerontologist, 38(3):370-378.37. Harke JM, Richgels K (May 1992). Barriers to implementing a continence programin nursing homes. Clin Nurs Res, 1(2):158-168.38. Council for Nutrition. Nutritional clinical strategies in long-term care (1999).MultiMedia Health Care/Freedom, LLC, Plainsboro, NJ.39. Health Care Financing Administration. Long-Term Care Facility ResidentAssessment <strong>In</strong>strument (RAI) User’s Manual (April 1999). <strong>Minimum</strong> Data Set v2.Eliot Press, Natik, MA.40. Abbasi AA, Rudman D (1993). Observations on the prevalence <strong>of</strong> protein-calorieundernutrition in VA nursing homes. J Am Geriatr Soc, 41: 117-121.41. Kayser-Jones J, Schell E (1997). The effect <strong>of</strong> staffing on the quality <strong>of</strong> care atmealtime. <strong>Nursing</strong> Outlook, 45(2): 64-72.42. Keller HH (1993). Malnutrition in institutionalized elderly: How and why? J AmGeriatr Soc, 41: 1212-1218.43. Amella EJ (1999). Factors influencing the proportion <strong>of</strong> food consumed by nursinghome residents with dementia. Special Series: Advancing Geriatrics <strong>Nursing</strong>Practice. Mezey M, Fulmer T. Eds. J Am Geriatr Soc, 47:879-885.44. Backstrum A, Norberg A, Norberg B (1987). Feeding difficulties in long-staypatients at nursing homes. Caregiver turnover and caregivers’ assessments <strong>of</strong>duration and difficulty <strong>of</strong> assisted feeding and amount <strong>of</strong> food received by thepatient. <strong>In</strong>t J Nurs Stud, 24(1): 69-76.45. Ohwaki S, Zingarelli G (1988). Feeding clients with severe multiple handicaps in askilled nursing care facility. Mental Retardation, 26(1): 21-24.46. Hu T-w, Huang L-f, Cartwright WS (1986). Evaluation <strong>of</strong> the costs <strong>of</strong> caring for thesenile demented elderly: A pilot study. The Gerontologist, 26(2): 158-163.47. Steele CM, Greenwood C, Ens I, Robertson C, Seidman-Carlson R (1997).Mealtime difficulties in a home for the aged: Not just dysphagia. Dysphagia, 12:43-50.48. Durnbaugh T, Haley B, Roberts S (1996). Assessing problem feeding behaviors inmid-stage alzheimer’s disease. Geriatric <strong>Nursing</strong>, 17(2): 63-67.<strong>Appropriateness</strong> <strong>of</strong> <strong>Minimum</strong> <strong>Nurse</strong> <strong>Staffing</strong> <strong>Ratios</strong> in <strong>Nursing</strong> HomesReport to Congress−67
49. Osborn CL, Marshall MJ (1993). Self-feeding performance in nursing homeresidents. Journal <strong>of</strong> Gerontological <strong>Nursing</strong>, 19(3): 7-14.50. Phillips LR, Van Ort S (1993). Measurement <strong>of</strong> mealtime interactions amongpersons with dementing disorders. Journal <strong>of</strong> <strong>Nursing</strong> Measurement, 1(1):41-55.51. Baltes MM, Zerbe MB (1976). <strong>In</strong>dependence training in nursing-home residents.The Gerontologist, 16(5):428-433.52. Musson ND, Kincaid J, Ryan P, Glussman B, Varone L, Gamarra N, Wilson R,Reefe W, Silverman M (1990). Nature, nature, nutrition: <strong>In</strong>terdisciplinary programsto address the prevention <strong>of</strong> malnutrition and dehydration. Dysphagia, 5: 96-101.53. Mondoux L (1998). Testimony <strong>of</strong> the American <strong>Nurse</strong>s Association before theNational Academy <strong>of</strong> Sciences <strong>In</strong>stitute <strong>of</strong> Medicine Committee on ImprovingQuality in Long-Term Care, Washington, DC.54. Blaum CS, Fries BE, Fiatarone MA (1995). Factors associated with low bodymass index and weight loss in nursing home residents. Journal <strong>of</strong> Gerontology:Medical Sciences, 50A(3): M162-M168.55. Silver AJ, Morley JE, Strome LS, Jones D, Vickers L (1988). Nutritional status inan academic nursing home. J Am Geriatr Soc, 36: 487-491.56. Siebens H, Trupe E, Siebens A, Cook F, Anshen S, Hanauer R, Oster G.Correlates and consequences <strong>of</strong> eating dependency in institutionalized elderly(1986). J Am Geriatr Soc, 34: 192-198.57. Kayser-Jones J, Schell E, Porter C, Paul S (1997). Reliability <strong>of</strong> percentagefigures used to record the dietary intake <strong>of</strong> nursing home residents. Nurs HomeMed, 5(3):69-76.58. Pokrywka HS, K<strong>of</strong>fler KH, Remsburg R, Bennett RG, Roth J, Tayback M, WrightJE (1997). Accuracy <strong>of</strong> patient care staff in estimating and documenting mealintake <strong>of</strong> nursing home residents. J Am Geriatr Soc, 45: 1223-1227.59. Simmons SF, Reuben D (<strong>In</strong> Press). Nutritional intake monitoring for nursing homeresidents: A comparison <strong>of</strong> staff documentation, direct observation, andphotography methods. J Am Geriatr Soc.60. Rogers JC, Holm MB, Burgio LD, Granieri E, Hsu C, Hardin JM, McDowell BJ(1999). Improving morning care routines <strong>of</strong> nursing home residents with dementia.J Am Geriatr Soc, 47(9):1049-1057.<strong>Appropriateness</strong> <strong>of</strong> <strong>Minimum</strong> <strong>Nurse</strong> <strong>Staffing</strong> <strong>Ratios</strong> in <strong>Nursing</strong> HomesReport to Congress−68
61. Tappen RM (1994). The effect <strong>of</strong> skill training on functional abilities <strong>of</strong> nursinghome residents with dementia. Research in <strong>Nursing</strong> & Health, 17: 159-165.62. Kihlgren M, Kuremyr D, Norberg A, Brane G, Karlson I, Engstrom B, Melin E(1993). <strong>Nurse</strong>-patient interaction after training in integrity promoting care at a longtermward: analysis <strong>of</strong> video-recorded morning care sessions. <strong>In</strong>t J Nurs Stud,30(1):1-13.63. Williams BC, Fries BE, Foley WJ, Schneider D, Gavazzi M (1994 Summer).Activities <strong>of</strong> daily living and costs in nursing homes. Health Care FinancingReview, 15(4): 117-135.64. Fiatarone MA, O”Neill EF, Ryan ND, Clements KM, Solares GR, Nelson ME,Roberts SB, Kehayias JJ, Lipsitz LA, Evans WJ (1994). The New England Journal<strong>of</strong> Medicine, 330(25): 1769-1775.65. MacRae PG, Asplund LA, Schnelle JF, Ouslander JG, Abrahamse A, Morris C(1996). A walking program for nursing home residents: Effects on walk endurance,physical activity, mobility, and quality <strong>of</strong> life. J Am Geriatr Soc, 44: 175-180.66. Friedman R, Tappen RM (1991). The effect <strong>of</strong> planned walking on communicationin Alzheimer’s disease. J Am Geriatr Soc, 39: 650-654.67. Schnelle JF, MacRae PG, Ouslander JG, Simmons SF, Nitta M (1995). Functionalincidental training, mobility performance, and incontinence care with nursing homeresidents. J Am Geriatr Soc, 43:1356-1362.68. Naso F, Carner E, Blankfort-Doyle W, Coughey K (1990). Endurance training inthe elderly nursing home patient. Arch Phys Med Rehabil, 71: 241-243.69. Schnelle JF, MacRae PG, Giacobassi K, Holden SH, Simmons SF, Ouslander JG(1996). Exercise with physically restrained nursing home residents: Maximizingbenefits <strong>of</strong> restraint reduction. J Am Geriatr Soc, 44: 507-512.70. Mulrow CD, Gerety MB, Kanten D, Cornell JE, DeNino LA, Chiodo L, Aguilar C,O’Neill MB, Rosenberg J, Solis RM (1994). A randomized trial <strong>of</strong> physicalrehabilitation for very frail nursing home residents. J Am Med Assoc, 271(7): 519-524.71. MacRae PG, Schnelle JF, Simmons SF, Ouslander JG (1996). Physical activitylevels <strong>of</strong> ambulatory nursing home residents. J Aging & Phys Activity, 4: 264-278.<strong>Appropriateness</strong> <strong>of</strong> <strong>Minimum</strong> <strong>Nurse</strong> <strong>Staffing</strong> <strong>Ratios</strong> in <strong>Nursing</strong> HomesReport to Congress−69
72. Schnelle JF, Cruise PA, Alessi CA, Ludlow K, Al-Samarrai NR, Ouslander JG(1998). Sleep hygiene in physically dependent nursing home residents: Behavioraland environmental intervention implications. Sleep, 21(5): 515-523.73. Holmes D, Teresi J (<strong>In</strong> Press). Personnel costs in special dementia care unitscompared with costs on traditional care units. Research & Practice in Alzheimer’sDisease.74. Burke R, Cornelius B. (1998). Analysis <strong>of</strong> staff time based on HCFA’s multistatecase-mix and quality demonstration and HCFA’s staff time measurement study forthe national SNF system. Baltimore, MD: Health Care Financing Administration.75. Burgio LD, Engel BT, Hawkins A, et.al (1990). A descriptive analysis <strong>of</strong> nursingstaff behaviors in a teaching nursing home: Differences among NAs, LPNs andRNs. Gerontologist, 30(1): 107-112.76. Hiatt LG (1985). Wandering behavior <strong>of</strong> older people in nursing homes: A study <strong>of</strong>hyperactivity, disorientation and the spatial environment. A dissertation submittedto the Graduate Faculty in Psychology in partial fulfillment <strong>of</strong> the requirements forthe degree <strong>of</strong> Doctor <strong>of</strong> Philosophy, The City University <strong>of</strong> New York.77. Cardona P, Tappen RM, Terrill M, Acosta M, Eusebe MI (1997). <strong>Nursing</strong> staff timeallocation in long-term care: A work sampling study. JONA, 27(2): 28-36.78. Abdellah FG, Levine E (1954). Work-sampling applied to the study <strong>of</strong> nursingpersonnel. Nurs Research, 3(1): 11-16.79. Edmonds MI, et al (Fall 1999). The use <strong>of</strong> computer simulation as a strategicdecision-making tool: a case study <strong>of</strong> an emergency department application.Healthcare Management Forum, 12(3):32-8.80. Dexter F, et al (Jul 1999). Statistical method to evaluate management strategies todecrease variability in operating room utilization: application <strong>of</strong> linear statisticalmodeling and Monte Carlo simulation to operating room management.Anesthesiology, Jul;91(1):262-74.81. Tucker JB, et al (Jan 1999). Using queuing theory to determine operating roomstaffing needs. Journal <strong>of</strong> Trauma, 46(1):71-9.82. Fries BE and Maranthe VP (1981). Determination <strong>of</strong> optial variable sized multipleblockappointment systems. Operations Research, 29: 324-328.83. Myers JE, Johnson RE and Egan DM (1972). A computer simulation <strong>of</strong> outpatientpharmacy operations. <strong>In</strong>quiry, 9: 40-47.<strong>Appropriateness</strong> <strong>of</strong> <strong>Minimum</strong> <strong>Nurse</strong> <strong>Staffing</strong> <strong>Ratios</strong> in <strong>Nursing</strong> HomesReport to Congress−70
84. Hershey JC, Pierskalla W and Wandel S (1981). <strong>Nurse</strong> staffing management. <strong>In</strong>Operational research applied to health services (D. Boldy, ed.) New York: St.Martin's Press.85. Bagust A, et al (1999). Dynamics <strong>of</strong> bed use in accommodating emergencyadmissions: stochastic simulation model. British Medical Journal, 17; 319(7203):155-8.<strong>Appropriateness</strong> <strong>of</strong> <strong>Minimum</strong> <strong>Nurse</strong> <strong>Staffing</strong> <strong>Ratios</strong> in <strong>Nursing</strong> HomesReport to Congress−71
86. Nadler, Gerald (1970). Work design; a systems concept. Rev. ed. Homewood,Ill., R. D. Irwin.87. Upenieks VV Work sampling (Apr 1998). Assessing nursing efficiency. <strong>Nursing</strong>Management, 29(4):27-9.88. Urden LD; Roode JI (Sep 1997). Work sampling. A decision-making tool fordetermining resources and work redesign. Journal <strong>of</strong> <strong>Nursing</strong> Administration,27(9):34-41.89. Bowers B, Becker M (1992). <strong>Nurse</strong>’s aides in nursing homes: The relationshipbetween organization and quality. The Gerontologist, 32(3): 360-366.90. Alessi CA, Yoon EJ, Al-Samarrai NR, Cruise PA, Schnelle JG (1999). A combinedphysical activity and environmental intervention in nursing home residents: Dosleep and agitation improve? J Am Geriatr Soc, 47: 784-791.91. Cohen-Mansfield J, Werner P (1997). Management <strong>of</strong> verbally disruptivebehaviors in nursing home residents. Journal <strong>of</strong> Gerontology: Medical Sciences,52A(6): M369-M377.92. Burgio L, Scilley K, Hardin JM, Hsu C, Yancey J (1996). Environmental “whitenoise”: An intervention for verbally agitated nursing home residents. J <strong>of</strong>Gerontology: Psychological Sciences, 51B(6): P364-P373.93. Camberg L, Woods P, Ooi WL, Hurley A, Colicer L, Ashley J, Odenheimer G,Mc<strong>In</strong>tyre K (1999). Evaluation <strong>of</strong> simulated presence: A personalized approach toenhance well-being in persons with Alzheimer’s disease. J Am Geriatr Soc, 47(4):446-452.94. Rovner BW, Steele CD, Shmuely Y, Folstein MF (1996). A randomized trial <strong>of</strong>dementia care in nursing homes. J Am Geriatr Soc, 44: 7-13.95. Schnelle JF, Cruise PA, Rahman A, Ouslander JG (1998). DevelopingRehabilitative Behavioral <strong>In</strong>terventions for Long-Term Care: Technology Transfer,Acceptance, and Maintenance Issues. J Am Geriatr Soc, 46:1-7.96. Schnelle JF, Ouslander JG, Cruise PA (1997). Policy Without Technology: ABarrier to Changing <strong>Nursing</strong> Home Care. The Gerontologist, 37(4):527-532.97. Walker L, Porter M, Gruman C, Michalski M (1999). Developing individualizedcare in nursing homes: <strong>In</strong>tegrating the views <strong>of</strong> nurses and certified nurses aides.J <strong>of</strong> Gerontological <strong>Nursing</strong>, (3): 30-35.<strong>Appropriateness</strong> <strong>of</strong> <strong>Minimum</strong> <strong>Nurse</strong> <strong>Staffing</strong> <strong>Ratios</strong> in <strong>Nursing</strong> HomesReport to Congress−72
Appendix A1National Citizens’ Coalition for <strong>Nursing</strong> Home ReformFederal & State <strong>Minimum</strong> <strong>Staffing</strong> RequirementsOctober 1999 Draft<strong>Appropriateness</strong> <strong>of</strong> <strong>Minimum</strong> <strong>Nurse</strong> <strong>Staffing</strong> <strong>Ratios</strong> in <strong>Nursing</strong> HomesReport to Congress−73
NATIONAL CITIZENS’ COALITION FOR NURSING HOME REFORMFEDERAL & STATE MINIMUM STAFFING REQUIREMENTSOctober 1999 DraftAdequate numbers <strong>of</strong> well-trained, well-supervised staff are critical to quality in longterm care. The <strong>Nursing</strong> Home Reform Act <strong>of</strong> 1987 (Public Law 100-203) promised each nursinghome resident that s/he had the right to expect care and services from the nursing home whichwould allow him/her to “attain or maintain his/her highest practicable level <strong>of</strong> physical, mental,and psychosocial functioning.” Unfortunately, however, Congress did not go that extra step andrequire a specific minimum caregiver/resident ratio or a minimum standard setting out thenumber <strong>of</strong> hours per patient day that a resident should be receiving care.<strong>In</strong> 1990, Congress did require the Department <strong>of</strong> Health and Human Services to conducta study and report to Congress by January 1, 1992 on the appropriateness <strong>of</strong> establishingminimum supervisor to caregiver to resident ratios and provide recommendations on such ratios.Only now, in 1999, is that report being completed. The Department <strong>of</strong> Health and HumanServices expects such a report and recommendation to be submitted to Congress in 2000.Until the federal report was completed, the role <strong>of</strong> setting specific standards was left tothe States to develop and implement. Most states have a specific minimum standard in state law,regulation, or policy. None <strong>of</strong> those state standards, however, meet the Consumer <strong>Minimum</strong><strong>Staffing</strong> Standard – a standard developed by nursing pr<strong>of</strong>essionals with long term care expertiseand adopted by the membership <strong>of</strong> the National Citizens’ Coalition for <strong>Nursing</strong> Home Reform(in 1995 and an updated version in 1998). The Consumer <strong>Minimum</strong> <strong>Staffing</strong> Standard requires,at the very least:FOR EVERY NURSING FACILITY:A full-time RN Director <strong>of</strong> <strong>Nursing</strong>A full-time RN Assistant Director <strong>of</strong> <strong>Nursing</strong> (in facilities <strong>of</strong> 100 beds or more)A full-time RN Director <strong>of</strong> <strong>In</strong>-service EducationAn RN nursing supervisor on duty at all times (24 hours, 7 days per week)PLUSDirect caregivers (RN, LPN, LVN, or CAN)Day 1:5 residentsEvening 1:10 residentsNight 1:15 residentsLicensed nurses (RN, LPN, or LVN)Day 1:15 residentsEvening 1:25 residentsNight 1:35 residents<strong>Appropriateness</strong> <strong>of</strong> <strong>Minimum</strong> <strong>Nurse</strong> <strong>Staffing</strong> <strong>Ratios</strong> in <strong>Nursing</strong> HomesReport to Congress−74
[See attached for a complete copy <strong>of</strong> the Consumer <strong>Minimum</strong> <strong>Staffing</strong> Standard]<strong>In</strong> addition to NCCNHR, the Consumer <strong>Minimum</strong> <strong>Staffing</strong> Standard was endorsed by theprestigious John A. Hartford foundation.The issue <strong>of</strong> adequate staffing is becoming <strong>of</strong> greater interest to legislatures around thecountry. <strong>In</strong> the last year or two, approximately 2/3 <strong>of</strong> states have either promulgated a new lawor regulation or ordered a committee to evaluate the information necessary to decide whether toset another (more appropriate) standard.The attached information reviews each state’s minimum staffing standard.<strong>Appropriateness</strong> <strong>of</strong> <strong>Minimum</strong> <strong>Nurse</strong> <strong>Staffing</strong> <strong>Ratios</strong> in <strong>Nursing</strong> HomesReport to Congress−75
FEDERAL STANDARDAs contained in the <strong>Nursing</strong> Home Reform Act <strong>of</strong> 1987Each nursing home must provide 24-hour licensed nursing services which are sufficient to meetthe nursing needs <strong>of</strong> its residents.Each nursing home must use the services <strong>of</strong> a registered pr<strong>of</strong>essional nurse for at least 8consecutive hours a day, 7 days a week.Waivers <strong>of</strong> these standards are allowed as indicated below. If a waiver is granted, the State(under Medicaid) or the Secretary (under Medicare) must notify the long term care ombudsmanand the facility must notify its residents and their immediate families.Medicaid Facilities: States may, on an annual basis, waive the nursing requirements tothe extent a home cannot meet them if: A facility demonstrates to the satisfaction <strong>of</strong> the state that it has beenunable, despite diligent efforts (including <strong>of</strong>fering wages at the communityprevailing rate for nursing facilities) to recruit appropriate personnel; The state determines that a waive will not endanger the health or safety<strong>of</strong> residents; The state finds that, for any periods in which licensed nursing servicesare not available, an R.N. or a physician is obligated to respondimmediately to telephone calls from the facility; If the Secretary determines that a state shows a pattern and practice <strong>of</strong>allowing waivers in the absence <strong>of</strong> diligent efforts by facilities to meetstaffing patterns, the Secretary must assume the state’s authority to grantwaivers. A facility’s reimbursement must be reduced to take into accountthe waivered facility’s lowered costs.Medicare facilities: The Secretary may, on an annual basis, waive the requirement for aregistered pr<strong>of</strong>essional nurse for more than 40 hours per week if the Secretary finds that: The facility is located in a rural area and the supply <strong>of</strong> skilled nursing facilityservices in the area that is not sufficient to meet the demand for suchservices’; The facility has a full-time registered nurse regularly on duty 40 hours perweek; The facility either: has only patients who do not require the services <strong>of</strong> aregistered nurse or physician for a 48-hour period, as documented by thephysician, or has arranged for a registered or physician to spend time in thefacility as necessary to provide needed services when the regular full-timeregistered nurse is not on duty.<strong>Appropriateness</strong> <strong>of</strong> <strong>Minimum</strong> <strong>Nurse</strong> <strong>Staffing</strong> <strong>Ratios</strong> in <strong>Nursing</strong> HomesReport to Congress−76
ALABAMANo additional state minimum staffing requirement. Follows federal rule.ALASKAStandardRegulation [07 AAC 012.275]Pr<strong>of</strong>essional <strong>Nurse</strong> CoverageA nursing facility must have an RN on duty 7 days/week day shift, 5 days/week evening shift.An LPN must be on duty during all shifts when an RN is not present.Facility w/
CNAs: 1:7 Day Shift Licensed Pr<strong>of</strong>essionals (RN, LPN,LVN): 1:15 Day Shift1:12 Evening Shift1:15 Evening Shift1:18 Night Shift1:35 Night ShiftPr<strong>of</strong>essional <strong>Nurse</strong> CoverageFacilities containing 70 or more beds must employ an RN supervisor during the day andevening shifts in addition to the above requirements.Facilities containing 100 or more beds must, in addition to the above requirements, employ anRN supervisor during the night shift; employ a full-time assistant director <strong>of</strong> nursing; and employa full-time RN director <strong>of</strong> in-service education.Staff Counted in Standard<strong>In</strong>dividuals employed to provide services such as food preparation, housekeeping, laundry ormaintenance services shall not be counted in determining the above staffing ratios.<strong>Staffing</strong> Disclosure<strong>Nursing</strong> homes must post on each hall, wing, or corridor the number <strong>of</strong> licensed and unlicensedpersonnel on duty at each shift. The posting will consist <strong>of</strong> a sign-in sheet where the staffmember must sign in upon arrival and again upon departure. The current number <strong>of</strong> residents onthat unit shall also be posted at the same place as the staffing report. This information must beposted in a conspicuous place and in a manner which is visible and accessible to all residents,families, and visitors.<strong>Nursing</strong> WaiversNoCALIFORNIAStandardWelfare & <strong>In</strong>stitutions Code 14110.7 (California regulation) requires the minimum nursing hoursto be:SNF = 3.0 hours/patient daySNF w/ special treatment program = 2.3 hours/patient dayNF = 1.1 hour/patient dayNF/Developmentally Disabled = 2.7 hours/patient dayPr<strong>of</strong>essional <strong>Nurse</strong> Coverage22 CCR 72329 <strong>Nursing</strong> Service – Staff<strong>Appropriateness</strong> <strong>of</strong> <strong>Minimum</strong> <strong>Nurse</strong> <strong>Staffing</strong> <strong>Ratios</strong> in <strong>Nursing</strong> HomesReport to Congress−78
-- Facilities licensed for 59 or fewer beds must have at least one RN or LVN awake and on duty,in the facility at all times, day and night-- Facilities licensed for 60 – 99 beds must have at least one RN or LVN awake and on duty, inthe facility at all times, day and night, in addition to the director <strong>of</strong> nursing services. The DoNshall not have charge nurse responsibilities.-- Facilities licensed for 100 or more beds must have at least one RN awake and on duty, in thefacility at all times, day and night, in addition to the director <strong>of</strong> nursing services. The DoN shallnot have charge nurse responsibilities.22 CCR 73319 – <strong>Nursing</strong> Service Staff-- Facilities must employ an RN or LVN 8 hours per day on the day shift, 7 days/week.-- Facilities with 100 or more beds shall employ an RN 8 hours per day on the day shift, 7days/week. Additionally, an RN or LVN must be employed 4 hours per day, 7 days per week,during the day for each 50 beds or portion there<strong>of</strong> in excess <strong>of</strong> 100.Staff Counted in Standard“<strong>Nursing</strong> hours” means the number <strong>of</strong> hours <strong>of</strong> work performed per patient day by aides, nursingassistants, or orderlies, plus 2 times the number <strong>of</strong> hours worked per patient day by registerednurses and licensed vocational nurses, and in distinct part <strong>of</strong> facilities and freestanding facilitiesproviding care.<strong>Nursing</strong> Waivers1276.2 <strong>of</strong> the Health & Safety Code includes a prohibition on the requirement <strong>of</strong> the use <strong>of</strong>registered nurses in SNFs for which vocational nurses are qualified, when the facility is unableto obtain a registered nurse.COLORADOStandardCode <strong>of</strong> Colorado Regulations 1011, Chapter 5, Part 7<strong>Nursing</strong> care facility must provide nurse staffing sufficient in number to provide at least 2.0hours <strong>of</strong> nursing time per resident per day.Pr<strong>of</strong>essional <strong>Nurse</strong> Coverage<strong>Nursing</strong> care facility: at least one RN must be on duty (and on the premises) at all times [exceptas provided under section 7.6].Each resident care unit must be staffed with at least a licensed nurse.<strong>In</strong>termediate care facility: at least one RN or LPN must be on duty (and on the premises) on theday shift 7 days/week. Facility may use LPN as DoN.<strong>Nursing</strong> facility required to employ a full-time Director <strong>of</strong> <strong>Nursing</strong> who is an RN and qualified byeducation and experience to direct facility nursing care.Staff Counted in Standard<strong>Appropriateness</strong> <strong>of</strong> <strong>Minimum</strong> <strong>Nurse</strong> <strong>Staffing</strong> <strong>Ratios</strong> in <strong>Nursing</strong> HomesReport to Congress−79
If 60+ residents, the time <strong>of</strong> the DoN, Staff development Coordinator, and other supervisorypersonnel who are not providing direct resident care may not be used in computing this ratio.<strong>Nursing</strong> WaiversWaivers <strong>of</strong> the RN requirement may be granted if:• facility is located in a rural area;• the facility has at least one FT RN who is regularly on duty;• facility has only residents whose attending physicians have indicated that each residentdoes not require the services <strong>of</strong> an RN for a 48-hour period or the facility has madearrangements for a pr<strong>of</strong>essional nurse or physician to be on-site as necessary to provideneeded services when the regular FT RN is not on duty; and• facility has made a good faith effort to comply with the RN requirement but RNs areunavailable in the area.CONNECTICUTStandardConnecticut Public Health Code Sec. 19-13-D8t<strong>Minimum</strong> staffing for chronic and convalescent nursing home:Licensed nursing personnel7 am - 9 pm = .47 hours/patient9 pm - 7 am = .17 hours/patientTotal nursing & nurses' aide personnel7 am - 9 pm = 1.40 hours/patient9 pm - 7 am = .50 hours/patient<strong>Minimum</strong> staffing for a rest home with nursing supervision staff:Licensed nursing personnel7 am - 9 pm = .23 hours/patient9 pm - 7 am = .08 hours/patientTotal nursing & nurses aide personnel7 am - 9 pm = .70 hours/patient9 pm - 7 am = .17 hours/patientPr<strong>of</strong>essional <strong>Nurse</strong> CoverageThere shall be at least one RN on duty 24 hours per day, 7 days per week<strong>In</strong> a chronic and convalescent nursing home, there must be at least one licensed nurse on dutyon each patient occupied floor at all times.<strong>In</strong> a rest home with nursing supervision, there must be at least one nurse's aide on duty on eachpatient occupied floor at all times and intercom communication with a licensed nurse.Staff Counted in Standard<strong>In</strong> facilities <strong>of</strong> 61+ beds, the DoN shall not be included in the above requirements.<strong>Appropriateness</strong> <strong>of</strong> <strong>Minimum</strong> <strong>Nurse</strong> <strong>Staffing</strong> <strong>Ratios</strong> in <strong>Nursing</strong> HomesReport to Congress−80
<strong>In</strong> facilities <strong>of</strong> 121+ beds, the AdoN shall not be included in the above requirements.<strong>Nursing</strong> WaiversNoDELAWARE<strong>In</strong>formation unreported as <strong>of</strong> 10/99DISTRICT OF COLUMBIANo additional state minimum staffing requirement. Follows federal rule.FLORIDAStandardTitle 59A-4 Florida Administrative Code• At a minimum, the facility will staff an average <strong>of</strong> 1.7 hours <strong>of</strong> certified nursing assistant and0.6 hours <strong>of</strong> licensed nursing staff time for each resident during a 24 hour period.• The DoN shall designate one licensed nurse on each shift to be responsible for the delivery<strong>of</strong> nursing services during that shift.• <strong>In</strong> a multi-story, multi-wing, or multi-station facility, there shall be a minimum <strong>of</strong> one nursingservices staff person who is capable <strong>of</strong> providing direct care on duty at all times on eachfloor, wing, or station.Note: <strong>In</strong> 1999, the Florida legislature passed legislation giving nursing homes $40 million toincrease staffing and CNA wages, but it did not legislatively require specific staffing ratios.Pr<strong>of</strong>essional <strong>Nurse</strong> CoverageWhen a DoN is delegated institutional responsibilities, a full-time qualified RN must bedesignated to serve as Assistant DoN.Facilities with a census <strong>of</strong> 121 or more residents must designate an RN as an Assistant DoN.<strong>Nursing</strong> WaiversNo<strong>Appropriateness</strong> <strong>of</strong> <strong>Minimum</strong> <strong>Nurse</strong> <strong>Staffing</strong> <strong>Ratios</strong> in <strong>Nursing</strong> HomesReport to Congress−81
GEORGIAStandardGeorgia DHR Rules, chapter 290-5-8-.04• A minimum <strong>of</strong> 2.0 hours <strong>of</strong> direct nursing care per patient in a 24 hour period.• For every 7 total nursing personnel required, there shall not be less than one registerednurse or licensed practical nurse.• <strong>Nursing</strong> staff shall be employed for nursing duties only.Medicaid policy• Level I and Level II nursing facilities are required to provide a minimum <strong>of</strong> 2.5 nursing hoursper patient day.Pr<strong>of</strong>essional <strong>Nurse</strong> CoverageThere must be at least one nurse, registered, licensed undergraduate, or licensed practical onduty and in charge <strong>of</strong> all nursing activities during each 8-hour shift.An RN shall be employed full-time as DoN. She may not also be the administrator.<strong>Nursing</strong> WaiverNoHAWIIStandardDepartment <strong>of</strong> Health Regulations, 11-94-23Pr<strong>of</strong>essional <strong>Nurse</strong> CoverageSkilled <strong>Nursing</strong> Facility -- at least one RN, full-time, 24 hours per day, 7 days per week<strong>In</strong>termediate Care Facility -- at least one RN, full-time, on day shift and at least one licensednurse whenever medications are administered.IDAHOStandardIDAPA 16.03.02200,02Skilled <strong>Nursing</strong> Facilities59 or less residents -- 2.4 hours/resident/day. Hours shall not include DoN but may include thesupervising nurse on each shift.60+ residents -- 2.4 hours/resident/day. Hours shall not include the DoN or supervising nurse.<strong>Appropriateness</strong> <strong>of</strong> <strong>Minimum</strong> <strong>Nurse</strong> <strong>Staffing</strong> <strong>Ratios</strong> in <strong>Nursing</strong> HomesReport to Congress−82
<strong>Nursing</strong> Facilities1.8 hours/resident/day. Hours may include the DoN, supervising nurse and charge nurses.SNFs & NFs shall be considered in compliance w/the minimum staffing ratios if, on Monday <strong>of</strong>each week, the total hours worked by nursing personnel for the previous 7 days equal or exceedthe minimum, staffing ratio for the same period when averaged on a daily basis and the facilityhas received prior approval from the Licensing Agency to calculate nursing hours in thismanner.Pr<strong>of</strong>essional <strong>Nurse</strong> Coverage<strong>In</strong> facilities with 60+ residents, the DoN shall have strictly nursing administrative duties<strong>In</strong> facilities with 59 or less residents the DoN may, in addition to administrative responsibilities,serve as the supervising nurse.SNFs with 60+ residents• an RN shall be on duty 8 hours each day and no less than an LPN shall be on duty for each<strong>of</strong> the other 2 shifts.SNFs with 60 - 89 residents• an RN shall be on duty during the day shift and the evening shift and no less than an LPNshall be on duty during the night shiftSNFs with 90+ residents• an RN must be on duty at all times.ICFs• an RN or LPN must be on duty at all times as charge nurse• if an LPN is charge nurse, the facility must make documented arrangements for an RN to beon call for these shifts to provide pr<strong>of</strong>essional nursing support<strong>Nursing</strong> WaiverRegulation permits waiver <strong>of</strong> RN as Superivisng or Charge <strong>Nurse</strong> if a facility is unable to hire anRN to meet the requirements so long as: the facility continues to seek an RN at a compensationlevel at least equal to prevailing community rates; documented record <strong>of</strong> efforts to secure RNpersonnel is maintained in the facility; and the facility maintains at least 40 hours/week RNcoverage.ILLINOISStandard77 Illinois Administrative Code Chapter I, sec. 300.1230<strong>Appropriateness</strong> <strong>of</strong> <strong>Minimum</strong> <strong>Nurse</strong> <strong>Staffing</strong> <strong>Ratios</strong> in <strong>Nursing</strong> HomesReport to Congress−83
Skilled <strong>Nursing</strong> Care = at least 2.5 hours <strong>of</strong> nursing care each day, <strong>of</strong> which at least 20% mustbe licensed nurse time.<strong>In</strong>termediate Care = at least 1.7 hours <strong>of</strong> nursing care each day, <strong>of</strong> which at least 20% must belicensed nurse time.Light intermediate care shall be provided with at least 1 hour <strong>of</strong> nursing care each day, <strong>of</strong> whichat least 20% must be licensed nurse time.A resident needing light intermediate care is one who needs personal care as defined in section1-120 <strong>of</strong> the Act; is mobile; requires some nursing services; needs a program <strong>of</strong> social servicesand activities directed toward independence in daily living skills; and needs daily monitoring.At least 40% <strong>of</strong> the minimum required hours shall be on the day shift; at least 25% on theevening shift; and at least 15% on the night shift.Pr<strong>of</strong>essional Staff CoverageA licensed nurse must be designated as a charge nurse when neither the DoN or Assistant DoNare on duty. If both RNs and LPNs are on duty, this person shall be an RN.SNFs = at least one RN must be on duty 8 consecutive hours, 7 days per weekThere shall be at least one RN or LPN on duty at all times in an ICF or a SNF.Staff Counted in <strong>Ratios</strong>The DoNs time shall not be included in staffing ratios<strong>Nursing</strong> WaiversYesINDIANAStandard410 IAC 16.2-3.1-17Except when waived, facility shall provide a licensed nurse hour to resident ration <strong>of</strong> 0.5licensed nurse hour per resident day, averaged over a one week period.Pr<strong>of</strong>essional Staff CoverageFacility must designate a licensed nurse to serve as charge nurse on each tour <strong>of</strong> duty.Facility must have an RN on duty for at least 8 consecutive hours per day, 7 days a week.DoN may serve as charge nurse only when facility daily occupancy is fewer than 60 residents.These hours may be counted toward the staffing requirement.<strong>Appropriateness</strong> <strong>of</strong> <strong>Minimum</strong> <strong>Nurse</strong> <strong>Staffing</strong> <strong>Ratios</strong> in <strong>Nursing</strong> HomesReport to Congress−84
<strong>Nursing</strong> WaiversYes if:• facility demonstrates it was unable to recruit proper personnel• a waiver would not endanger the health or safety <strong>of</strong> the residents• an RN or physician is on call at all times and required to respond immediately to calls• state agency provides notice to the LTC Ombudman and the protection and advocacysystemIOWAStandardIAC 58.11(2)• The minimum hours <strong>of</strong> resident care personnel required for residents needing intermediatenursing care shall be 2.0 hours per resident/day computed on a 7-day week. A minimum <strong>of</strong>20% <strong>of</strong> this time shall be provided by qualified nurses.• If the maximum medical assistance rate is reduced below the 74th percentile, therequirement will return to 1.7 hours per resident/day computed on a 7-day week. Aminimum <strong>of</strong> 20% <strong>of</strong> this time shall be provided by qualified nurses.• The minimum hours <strong>of</strong> pr<strong>of</strong>essional nursing personnel for residents requiring skilled nursingcare shall be 168 hours per week for facilities under 50 beds. For every additional bed over50, 2.24 hours <strong>of</strong> additional nursing per week is required.• Non pr<strong>of</strong>essional nursing care staff shall be required in the ratio <strong>of</strong> 0.28 employee per bed,per week.Pr<strong>of</strong>essional <strong>Nurse</strong> CoverageAn ICF with 75+ beds must have a qualified nurse on duty, 24 hours a day, 7 days a weekAn ICF with less than 75 beds that employs an LPN as a health service supervisor must alsoemploy an RN for at least 4 hours each week for consultation. The RN must be on duty at thesame time as the supervisor.Facilities with 75+ beds must employ a health services supervisor who is a registered nurse.A SNF must provide 24 hour service by licensed nurses, including at least one registered nurseon the day shift, 7 days per week.The health service supervisor must not serve as the charge nurse in a SNF with 60 + residents.Staff Counted in StandardThe health supervisor's hours worked per week shall be included in computing the 20%requirement.<strong>Appropriateness</strong> <strong>of</strong> <strong>Minimum</strong> <strong>Nurse</strong> <strong>Staffing</strong> <strong>Ratios</strong> in <strong>Nursing</strong> HomesReport to Congress−85
KANSASStandardKansas Administrative Regulations, 28-39-154Per facility, there shall be a weekly average <strong>of</strong> 2.0 hours <strong>of</strong> direct care staff time per residentand a daily average <strong>of</strong> not fewer than 1.85 hours during any 24 hour period.The ratio <strong>of</strong> nursing personnel to residents per nursing unit shall not be fewer than one nursingstaff member for each 30 residents or for each fraction <strong>of</strong> that number <strong>of</strong> residents.A licensed nurse shall be on duty 24 hours per day, seven days per week. An RN must be onduty at least 8 consecutive hours per day, 7 days per week.On the day shift there shall be the same number <strong>of</strong> licensed nurses on duty as there are nursingunits.Staff Counted in StandardThe DoN shall not be included in the weekly and daily average computation in facilities w/ < 60beds.However, the DoN may be counted to meet the licensed nurse on duty requirement.KENTUCKYNo minimum staffing standard exists in Kentucky. The Licensing Agency provided the followingclarification:The Division <strong>of</strong> Licensing and Regulation has followed the lead <strong>of</strong> the FederalGovernment in that the licensing regulations reflect the certification regulations regardingminimum staffing requirements. The reasons are as follows:• Often when minimum staff requirements are established, the minimum thenbecomes the maximum;• Acuity levels <strong>of</strong> residents may change on a daily basis, and thus it would notbe possible to predict what staffing ratios are necessary; and• <strong>Minimum</strong> staff ratios would hamper our ability to utilize an outcome basedsurvey process as well as providing a defense for nursing homes to employanytime a deficiency is cited related to "understaffing."LOUISIANAStandard<strong>Appropriateness</strong> <strong>of</strong> <strong>Minimum</strong> <strong>Nurse</strong> <strong>Staffing</strong> <strong>Ratios</strong> in <strong>Nursing</strong> HomesReport to Congress−86
• A licensed nurse must be on duty 8 hours each evening• An additional licensed nurse shall be added for each 70 beds• <strong>In</strong> facilities with 100+ beds, one <strong>of</strong> the additional licensed nurses must be an RNNight Shift• A licensed nurse must be on duty 8 hours each evening• An additional licensed nurse shall be added for each 100 beds• <strong>In</strong> facilities with 100+ beds, an RN must be on dutyStaff Counted in Standard<strong>Nurse</strong> aides in training may not be counted in the ratioPrivate duty nurses shall have no effect on the nursing staff requirements.Sharing <strong>of</strong> nursing staff is permitted between the nursing facility and other levels <strong>of</strong> assistedliving on the same premises as long as there is a clear documented audit trail and the staffing inthe nursing facilities remains adequate to meet the needs <strong>of</strong> residents.MARYLANDStandardCode <strong>of</strong> Maryland Regulations, 10.07.02Comprehensive care facilities shall employ supervisory personnel and a sufficient number <strong>of</strong>supportive personnel to provide a minimum <strong>of</strong> 2 hours <strong>of</strong> bedside care per licensed bed per day,7 days per week.Comprehensive care facilities shall provide at least the following supervisory personnel:2-99 residents = 1 FT RN100-199 residents = 2 FT RNs200-299 residents = 3 FT RNs300-399 residents = 4 FT RNsThe ratio <strong>of</strong> nursing service personnel on duty to patients may not at any time be less than 1:25or fraction there<strong>of</strong>.Pr<strong>of</strong>essional <strong>Nurse</strong> CoverageExtended care facilities shall be staffed with an RN 24 hours a day, 7 days a week.<strong>Nursing</strong> WaiverFacilities with 40 or fewer beds which do not participate in a federal program may request for anexception to the above staffing pattern.Staff Counted in Standard<strong>Appropriateness</strong> <strong>of</strong> <strong>Minimum</strong> <strong>Nurse</strong> <strong>Staffing</strong> <strong>Ratios</strong> in <strong>Nursing</strong> HomesReport to Congress−88
Bedside hours include the care provided by RNs, LPNs, and supportive personnel, except thatward clerk's time shall be computed at 50% <strong>of</strong> the time provided on the nursing unit.Only those hours which the director <strong>of</strong> nursing spends in bedside care may be counted in the 2hour minimal requirement.MASSACHUSETTSStandard105 CMR 150.007Level I care shall provide, at a minimum, a total <strong>of</strong> 2.6 hours <strong>of</strong> nursing care per patient per day;at least 0.6 hours shall be provided by licensed nursing personnel and 2.0 hours by ancillarynursing personnel.Level II care shall provide, at a minimum, a total <strong>of</strong> 2.0 hours <strong>of</strong> nursing care per patient per day;at least 0.6 hours shall be provided by licensed nursing personnel and 1.4 hours by ancillarynursing personnel.Level III care shall provide, at a minimum, a total <strong>of</strong> 1.4 hours <strong>of</strong> nursing care per patient perday; at least 0.4 hours shall be provided by licensed nursing personnel and 1.0 hours byancillary nursing personnel.Level IV care shall provide:• facilities with less than 20 beds -- at least one "responsible person" on active duty duringwaking hours in the ratio <strong>of</strong> one per ten residents• facilities with more than 20 beds -- at least one "responsible person" on active duty at alltimes, 24 hours a day/ 7 days a week, per unit• If none <strong>of</strong> the responsible persons on duty are licensed nurses, then the facility shall providea licensed consultant nurse, four hours per month, per unit.Staff Counted in StandardThe supervisor <strong>of</strong> nurses and the charge nurse, but not the DoN, may be counted in thecalculation <strong>of</strong> licensed nursing personnel.The amount <strong>of</strong> nursing care time per patient shall be exclusive <strong>of</strong> non-nursing duties.MICHIGANStandardMichigan Compiled LawsMichigan Department <strong>of</strong> Public Health Rules sec. 333.21720a<strong>Appropriateness</strong> <strong>of</strong> <strong>Minimum</strong> <strong>Nurse</strong> <strong>Staffing</strong> <strong>Ratios</strong> in <strong>Nursing</strong> HomesReport to Congress−89
A nursing home shall maintain staff sufficient to provide not less than 2.25 hours <strong>of</strong> nursing careper resident per day.The ratio <strong>of</strong> residents to nursing care personnel:• Morning shift = 1:8• Afternoon shift = 1:12; and• Nighttime shift = 1:15Pr<strong>of</strong>essional <strong>Nurse</strong> CoverageEach nursing home must have an RN employed full-time as DoN.There must be an RN on duty at least 8 consecutive hours per day, 7 days per week.Each nursing home must have a licensed nurse on each shift to serve as charge nurse.Staff Counted in Standard<strong>In</strong> a nursing home having 30 or more beds, the director <strong>of</strong> nursing shall not be included incounting the minimum ratios <strong>of</strong> nursing personnel.An employee designated as nursing staff shall not be engaged in providing basic services suchas food preparation, housekeeping, laundry, or maintenance servicesMINNESOTAStandardMinnesota Statutes Annotated sec. 144A.04Minnesota Rules sec. 4658.0510The minimum number <strong>of</strong> hours <strong>of</strong> nursing personnel to be provided in a nursing home is thegreater <strong>of</strong> 2.0 hours per resident per 24 hours or 0.95 hours per standardized resident day.Regulations require that the minimum number <strong>of</strong> hours <strong>of</strong> nursing personnel to be provided is:• 2.0 hours <strong>of</strong> nursing personnel per resident per 24 hours (for nursing homes notcertified to participate in medical assistance)• the greater <strong>of</strong> 2.0 hours per resident per 24 hours or 0.95 hours per standardizedresident day (for nursing homes certified to participate in the medical assistanceprogram.)Pr<strong>of</strong>essional <strong>Nurse</strong> CoverageA nursing home must have a full time DoN who is an RN and is assigned full time to the nursingservices <strong>of</strong> the facility.A nurse must be employed so that on-site nursing coverage is provided 8 hours/day, 7days/week.<strong>Appropriateness</strong> <strong>of</strong> <strong>Minimum</strong> <strong>Nurse</strong> <strong>Staffing</strong> <strong>Ratios</strong> in <strong>Nursing</strong> HomesReport to Congress−90
Staff Counted in StandardThe non-productive hours <strong>of</strong> the in-service training director are not included in the abovestandard<strong>In</strong> homes with more than 60 licensed beds, the hours <strong>of</strong> the DoN are excluded.”Hours <strong>of</strong> <strong>Nursing</strong> Personnel” means the paid, on-duty, productive nursing hours <strong>of</strong> all nursesand nursing assistants, calculated on the basis <strong>of</strong> any given 24-hour period.MISSISSIPPIStandardMississippi Code Annotated, 43-11-201.1Currently 2.33 hours per patient day. Regulation effective January 2000, requirement increasedto 2.67 hppd.Pr<strong>of</strong>essional <strong>Nurse</strong> CoverageRN coverage on the day shift 7 days/week.Facilities with 180+ beds shall have an assistant DoN, who shall be an RN.<strong>In</strong> facilities with 60 beds or less, the DoN may serve as the charge nurse. <strong>In</strong> facilities with 60+beds, the DoN may not serve as charge nurse, nor as medication/treatment nurse.MISSOURINo additional state minimum staffing requirement. Follows federal rule. State standardrepealed in 1998.MONTANAStandardAdministrative Rules <strong>of</strong> Montana 16.32.361<strong>In</strong> Terms <strong>of</strong> Service Furnished by Each Category <strong>of</strong> PersonnelDay Shift Evening Shift Nig# Licensed RN Hours LPN Hours Aide Hours RN Hours LPN Hours Aide Hours RN Hours LPbeds4-8 8 0 0 0 8 0 0 8<strong>Appropriateness</strong> <strong>of</strong> <strong>Minimum</strong> <strong>Nurse</strong> <strong>Staffing</strong> <strong>Ratios</strong> in <strong>Nursing</strong> HomesReport to Congress−91
9-15 8 0 4 0 8 0 0 816-20 8 0 8 0 8 4 0 821-25 8 0 12 0 8 8 0 826-30 8 0 16 0 8 8 0 831-35 8 0 20 0 8 12 0 836-40 8 0 24 0 8 16 0 841-45 8 8 28 0 8 16 0 846-50 8 8 32 0 8 20 0 851-55 8 8 36 8 0 24 0 856-60 8 8 40 8 0 24 0 861-65 8 8 44 8 0 28 0 866-70 8 8 48 8 0 32 0 871-75 8 8 52 8 0 32 8 076-80 8 16 48 8 8 32 8 081-85 8 16 52 8 8 32 8 886-90 8 16 56 8 8 32 8 891-95 16 16 52 8 8 36 8 896-100 16 16 56 8 8 40 8 8<strong>Staffing</strong> <strong>of</strong> homes with more than 100 beds will be given individual consideration.NEBRASKANo additional state minimum staffing requirement. Follows federal rule.NEVADAStandardNevada Medicaid Services Manual, sec. 502.3<strong>Minimum</strong> HrsppdMaximum Hrs ppdSkilled <strong>Nursing</strong> Level 3 6.0010.75Skilled <strong>Nursing</strong> Level 2 4.005.75Skilled <strong>Nursing</strong> Level 1 3.003.75<strong>Appropriateness</strong> <strong>of</strong> <strong>Minimum</strong> <strong>Nurse</strong> <strong>Staffing</strong> <strong>Ratios</strong> in <strong>Nursing</strong> HomesReport to Congress−92
<strong>In</strong>termediate Care Level 3 2.502.75<strong>In</strong>termediate Care Level 2 1.501.75<strong>In</strong>termediate Care Level 1 0.75Staff Counted in StandardDirect care does not include: DoN; Assistant DoN; <strong>In</strong>service Coordinator; Patient CareCoordinator; Staff Development Coordinator; Ward Clerk; Medical Records Coordinator;Administrative Aide in-training; Orientees; Restorative Aides employed by Therapist; Volunteers;any RNs, LPNs or charge nurses classified as any <strong>of</strong> the above.1.00NEW HAMPSHIRE<strong>In</strong>formation unreported as <strong>of</strong> 10/99NEW JERSEYStandardNJAC 8:39-25.1 through 25.4RNs, LPNs, and NAs shall spend the following amounts <strong>of</strong> time on pr<strong>of</strong>essional duties:• Total number <strong>of</strong> residents multiplied by 2.5 hours/day; plus• Total number <strong>of</strong> residents receiving each service listed below, multiplied by thecorresponding number <strong>of</strong> hours per day:Tracheostomy1.25 hours/dayUse <strong>of</strong> respirator1.25 hours/dayHead trauma stimulation/Advanced neuromuscular/Orthopedic care1.50 hours/day<strong>In</strong>travenous therapy1.50 hours/dayWound care0.75 hours/dayOxygen therapy0.75 hours/dayNasogastric tube feedings and/or gastrostomy1.00 hours/day<strong>Appropriateness</strong> <strong>of</strong> <strong>Minimum</strong> <strong>Nurse</strong> <strong>Staffing</strong> <strong>Ratios</strong> in <strong>Nursing</strong> HomesReport to Congress−93
There shall be a visual observation by a member <strong>of</strong> the resident care staff <strong>of</strong> each resident atleast once per hour. These observations need not be documented.Pr<strong>of</strong>essional <strong>Nurse</strong> CoverageAt least 20% <strong>of</strong> the hours <strong>of</strong> care required shall be provided by RNs or LPNsAn RN shall be on duty at all times in facilities with 150+ beds.Facilities with 150+ beds shall have an assistant DoN who is an RNThere shall be at least one RN on duty in the facility during the day shift.NEW MEXICONo additional state minimum staffing requirement. Follows federal rule.NEW YORKNo additional state minimum staffing requirement. Follows federal rule.NORTH CAROLINAStandardNorth Carolina Administrative Code, Title 10, 03H.2303Except for designated units with higher staffing requirements noted elsewhere in thesubchapter, daily direct patient care nursing staff, licensed and unlicensed, shall equal orexceed 2.1 nursing hours per patient day. <strong>In</strong>clusive in these nursing hours is the requirementthat at least one licensed nurse is on duty for direct patient care at all times.Note: North Carolina regulations also contain staffing standards for adult care homes. And,legislation to improve staffing ratios for adult care homes was introduced in 1997 in the GeneralAssembly.Pr<strong>of</strong>essional <strong>Nurse</strong> CoverageAn RN shall be designated to serve as the DoN on a full time basis.The DoN shall serve as the charge nurse only if occupancy is less than 60.<strong>Nurse</strong> Waivers<strong>Appropriateness</strong> <strong>of</strong> <strong>Minimum</strong> <strong>Nurse</strong> <strong>Staffing</strong> <strong>Ratios</strong> in <strong>Nursing</strong> HomesReport to Congress−94
<strong>Staffing</strong> waivers granted by the federal government for Medicare and Medicaid certified bedsshall be accepted for licensure purposes.NORTH DAKOTANo additional state minimum staffing requirement. Follows federal rule.OHIOStandardORC 3701-17-08• Each nursing home shall have at least one attendant on duty at all times for each 15residents and one other person on duty at all times;• at least one person working 40 hours per week for each 4 residents;• and the following minimum nurse staffing which may be counted in determining theforegoing personnel requirements:• 10 or fewer residents = 1 nurse on duty at least 8 hours per day between 6 am and 5pm and a nurse on call at all other times.• 11- 25 residents = 1 nurse on duty at least 16 hours per day between 6 am and 12midnight and a nurse on call at all other times.• 26 - 50 residents = 1 nurse on duty at all times.• 51 - 75 residents = 2 nurses on duty at all times; provided, at least one nurse shallbe an RN on duty not less than 8 hours between 6 am and 5 pm.• 76 - 100 residents = at least 2 nurses; an RN shall be on duty not less than 8 hourseach day between 6 am and 5 pm.• 100+ residents = an RN on duty at all times and an additional nurse on duty at alltimes for every 50 residents<strong>Nursing</strong> WaiverYes if:• facility has made diligent efforts to recruit the required personnel• facility is <strong>of</strong>fering the prevailing wage for RNs and LPNs• facility and personnel policies are such as to <strong>of</strong>fer satisfactory working conditions toprospective employeesOKLAHOMAStandardOklahoma Regulations 310:675-13-12<strong>Appropriateness</strong> <strong>of</strong> <strong>Minimum</strong> <strong>Nurse</strong> <strong>Staffing</strong> <strong>Ratios</strong> in <strong>Nursing</strong> HomesReport to Congress−95
Day Shift = 1:10Evening Shift = 1:15Night Shift = 1:20Pr<strong>of</strong>essional <strong>Nurse</strong> CoverageA licensed nurse shall be on duty 8 hours a day, 7 days a week on the day shift.If the DoN is an LPN, an RN shall be employed for at least 8 hours per week as a consultant.<strong>Nursing</strong> WaiverYesOREGONStandardOregon Administrative Rules 411-86-100Day Shift = 1:10Evening Shift = 1:15Night Shift = 1:25Pr<strong>of</strong>essional <strong>Nurse</strong> CoverageLicensed nurse hours shall include no less than 1 RN per resident per week.The facility shall have a licensed charge nurse on each shift, 24 hours per day. The chargenurse must be an RN for no less than 8 consecutive hours between 7 am and 11 pm, 7 days perweek.The DoN may serve as charge nurse only when the facility has 60 or fewer residents.Staff Counted in StandardNo more than 25% <strong>of</strong> the nursing assistants assigned to residents pursuant to the above ratiomay be nursing assistants who are not yet certified.When an RN serves in the temporary absence <strong>of</strong> the administrator, his/her hours shall not beused to meet minimum nursing hours.<strong>In</strong> facilities with 41+ beds, the hours <strong>of</strong> a licensed nurse who serves as facility administratorshall not be included in any licensed nurse coverage.<strong>Nursing</strong> WaiversYes<strong>Appropriateness</strong> <strong>of</strong> <strong>Minimum</strong> <strong>Nurse</strong> <strong>Staffing</strong> <strong>Ratios</strong> in <strong>Nursing</strong> HomesReport to Congress−96
PENNSYLVANIAStandardPennsylvania Administrative Code, title 28, chapter 211Total number <strong>of</strong> hours <strong>of</strong> general nursing care in each 24 hour period shall be a minimum <strong>of</strong> 2.7hours for each skilled patient and 2.3 hours for each intermediate care patient.Pr<strong>of</strong>essional Staff CoverageThe following daily pr<strong>of</strong>essional staff shall be available:Census Day Evening Night59 and under 1 RN 1 RN 1 RN or 160/150 1 RN 1 RN 1 RN151/250 1 RN & 1 LPN 1 RN & 1 LPN 1 RN & 1251/500 2 RNs 2 RNs 2 RNs501/1000 4 RNs 3 RNs 3 RNs1001/up 8 RNs 6 RNs 6 RNsThere shall be a full time DoN who shall be a qualified RN.The DoN may also serve as the day pr<strong>of</strong>essional staff nurse in a facility with an average dailycensus <strong>of</strong> 59 patients or less.RHODE ISLAND<strong>In</strong>formation unreported as <strong>of</strong> 10/99SOUTH CAROLINAStandardSouth Carolina State LawSC Department <strong>of</strong> Health & Environmental Control Regulation 61-17Recently passed legislation requires:• <strong>In</strong> addition to the number <strong>of</strong> licensed nursing personnel required by regulation, a nursinghome must provide at a minimum the following resident-staff ratios:9:1 for shift 113:1 for shift 222:1 for shift 3<strong>Appropriateness</strong> <strong>of</strong> <strong>Minimum</strong> <strong>Nurse</strong> <strong>Staffing</strong> <strong>Ratios</strong> in <strong>Nursing</strong> HomesReport to Congress−97
Pr<strong>of</strong>essional <strong>Nurse</strong> CoverageRegulation states:• The required minimum number <strong>of</strong> licensed nurses for any nursing station which serves atleast 1 resident is one per station per shift. If a nursing station serves more than 44residents, then that station is required to have 2 licensed nurses on all shifts.The facility shall designate an RN as a full time DoNSOUTH DAKOTANo additional state minimum staffing requirement. Follows federal rule.TENNESSEEStandardTennessee Code, Chapter 1200-8-6-.04A minimum <strong>of</strong> 2.0 hours <strong>of</strong> direct care to each resident every day, including 0.4 hours <strong>of</strong>licensed nursing personnel time.The number <strong>of</strong> direct nursing hours required shall be calculated according to the followingformula:• # residents x # nursing hours required per resident day = total direct nursing hoursrequired• # residents x # licensed nursing hours required per resident day = total licensednursing hours required• divide the total hours required by the number <strong>of</strong> hours worked by a full-time person(usually 8)Pr<strong>of</strong>essional <strong>Nurse</strong> CoverageAt least 1 licensed nurse on duty at all times.If the nursing service is under the direction <strong>of</strong> an LPN, an RN must be available on the nursinghome premises to consult, review, and advise on the quality <strong>of</strong> nursing care for at least 48weeks in each calendar year. The RN consultant must be on the premises at least 8 hourseach week (12 hours/week in homes with 51+ beds).<strong>In</strong> facilities with 50 beds or less, the DoN, in addition to nursing administrative and supervisoryresponsibilities, may participate in general nursing duties and patient care activities not toexceed 50% <strong>of</strong> his/her working hours.<strong>Appropriateness</strong> <strong>of</strong> <strong>Minimum</strong> <strong>Nurse</strong> <strong>Staffing</strong> <strong>Ratios</strong> in <strong>Nursing</strong> HomesReport to Congress−98
TEXASStandardTexas Administrative Code, Title 25, Part I, Chapter 145Texas Dept <strong>of</strong> Human Services, sec. 19.1001,2Pr<strong>of</strong>essional <strong>Nurse</strong> CoverageAt a minimum, the facility must maintain a ratio <strong>of</strong> 1 licensed nursing staff person for each 20residents or a minimum <strong>of</strong> 0.4 licensed-care hours per resident day.The facility must designate an RN to serve as DoN on a full-time basis.There must be a licensed nurse to serve as charge nurse on each tour <strong>of</strong> duty.Facility must use the services <strong>of</strong> an RN for at least 8 consecutive hours per day, 7 days perweek.Staff Counted in StandardLicensed nurses who may be counted include, but are not limited to, DoN, Assistant DoN, StaffDevelopment Coordinators, Charge <strong>Nurse</strong>s, and Medication/Treatment <strong>Nurse</strong>s.Staff, who also have administrative duties not related to nursing, may be counted in thestandard only to the degree <strong>of</strong> hours spent in nursing related duties.<strong>Nursing</strong> WaiverYesUTAH<strong>In</strong>formation unreported as <strong>of</strong> 10/99VERMONTNo additional state minimum staffing requirement. Follows federal rule.VIRGINIANo additional state minimum staffing requirement. Follows federal rule.WASHINGTON<strong>Appropriateness</strong> <strong>of</strong> <strong>Minimum</strong> <strong>Nurse</strong> <strong>Staffing</strong> <strong>Ratios</strong> in <strong>Nursing</strong> HomesReport to Congress−99
StandardWashington Administrative Code Title 388-97-115Skilled Care = 2.25 hppd<strong>In</strong>termediate Care = 2.00 hppdLimited nursing care = 1.25 hppdA minimum <strong>of</strong> 20% <strong>of</strong> the above hppd must be provided by nurses.Pr<strong>of</strong>essional <strong>Nurse</strong> CoverageThe nursing home shall have an RN on duty directly supervising resident care a minimum <strong>of</strong> 16hours per day, 7 days per week.An RN or LPN must be on duty directly supervising resident care the remaining 8 hours per day.The nursing home shall designate an RN or LPN to serve as charge nurse and shall have a fulltime DoN who is an RN.An intermediate care facility with:• fewer than 60 residents shall have at least 1 RN or 1 LPN on duty during every daytime tour<strong>of</strong> duty. The RN may be the DoN.• 60 or more residents shall have at least 1 RN on duty during every daytime tour <strong>of</strong> duty.The RN may be the DoN in accordance with paragraph (a).A SNF shall have at least 1 charge nurse on duty at all times, and:• if fewer than 60 residents -- at least 1 RN who may be the DoN on duty as charge nurseduring daytime• if 60 - 74 residents -- in addition to the DoN, at least 1 RN on duty as charge nurse duringdaytime• if 75 - 99 residents -- in addition to the DoN, at least 1 RN on duty as charge nurse duringdaytime and at least 1 RN on duty as charge nurse on a non-daytime tour <strong>of</strong> duty• if 100+ residents -- in addition to the DoN, at least 1 RN on duty as charge nurse at all times.An intermediate care facility shall have a charge nurse during every daytime tour <strong>of</strong> duty, whomay be the DoN.WEST VIRGINIAStandard64 CSR 13<strong>Minimum</strong> <strong>of</strong> 2 hours nursing personnel time per resident per day. <strong>In</strong>cludes 0.4 hours <strong>of</strong> licensednurse time and 1.6 hours <strong>of</strong> nurse aide time.<strong>Appropriateness</strong> <strong>of</strong> <strong>Minimum</strong> <strong>Nurse</strong> <strong>Staffing</strong> <strong>Ratios</strong> in <strong>Nursing</strong> HomesReport to Congress−100
<strong>Minimum</strong> <strong>Ratios</strong> <strong>of</strong> Resident Care Personnel to ResidentsNumber <strong>of</strong>ResidentsLicensed <strong>Nurse</strong>s Aides Total Resident CNumber Per Day Hours Per Day Number PerDayHours Per DayNumber Per Day3-10 3 24 3 24 611-20 3 24 4 32 721-30 3 24 6 48 931-40 3 24 8 64 1141-50 3 24 10 80 1351-60 3 24 12 96 1561-70 3.5 28 14 112 17.571-80 4 32 16 128 2081-90 4.5 36 18 144 22.591-100 5 40 20 160 25101-110 5.5 44 22 176 27.5111-120 6 48 24 192 30121-130 6.5 52 26 208 32.5131-140 7 56 28 224 35141-150 7.5 60 30 240 37.5151-160 8 64 32 256 40161-170 8.5 68 34 272 42.5171-180 9 72 36 288 45181-190 9.5 76 38 304 47.5191-200 10 80 40 320 50Over 200Shall be calculated for each facilityPr<strong>of</strong>essional <strong>Nurse</strong> CoverageA nursing home shall provide licensed nursing services coverage 24 hours a day, 7 days aweek.Staff Counted in Standard<strong>In</strong> facilities with less than 60 beds, the DoN may be included in the staff:resident ratiocalculations.<strong>Appropriateness</strong> <strong>of</strong> <strong>Minimum</strong> <strong>Nurse</strong> <strong>Staffing</strong> <strong>Ratios</strong> in <strong>Nursing</strong> HomesReport to Congress−101
Employees, private duty nurses, volunteers or contracted nurses who are "available" or "on call"do not meet the requirements for minimum staffing.No individual shall be counted as meeting these numerical requirements on any 2 consecutiveshifts, unless the facility can demonstrate extenuating circumstances and only then as a nonroutineoccurrence.WISCONSINStandardWisconsin Statutes, Chapter 50.04Law requires that each nursing home shall provide at least the following hours <strong>of</strong> service byRNs, LPNs, or NAs:• For each resident needing intensive SNF care - 3.25 hours per day, <strong>of</strong> which a minimum <strong>of</strong>0.65 hours shall be provided by an RN or LPN.• For each resident needing SNF care - 2.5 hours per day, <strong>of</strong> which a minimum <strong>of</strong> 0.5 hoursshall be provided by an RN or LPN.• For each resident needing intermediate or limited nursing care - 2.0 hours per day, <strong>of</strong> whicha minimum <strong>of</strong> 0.4 hours shall be provided by an RN or LPN.HFS 132, the Wisconsin Administrative Code, is currently under revision and will bemade consistent with Chapter 50.04.Pr<strong>of</strong>essional <strong>Nurse</strong> CoverageEach nursing home must have a charge nurse -- can be either an LPN under the supervision <strong>of</strong>an RN or MD, or can be an RN.All facilities shall have at least one nursing staff person on duty at all times.<strong>Nurse</strong> WaiversAvailable, but rarely granted.WYOMINGStandardWyoming RegulationsRegulations require:• 2.25 hours for each resident classified for SNF services in each 24 hourperiod, 7 days/week<strong>Appropriateness</strong> <strong>of</strong> <strong>Minimum</strong> <strong>Nurse</strong> <strong>Staffing</strong> <strong>Ratios</strong> in <strong>Nursing</strong> HomesReport to Congress−102
• 1.5 hours for each resident classified for intermediate care in each 24 hourperiod, 7 days/weekPr<strong>of</strong>essional <strong>Nurse</strong> CoverageEach nursing station shall be staffed with an RN or LPN who is the charge nurse on the daytour, 7 days/week. All other tours <strong>of</strong> duty shall be staffed with an RN or LPN.If an LPN is in charge, there shall be a minimum <strong>of</strong> 4 hours consultation given to the facility perweek by an RN when the LPN is on duty.There shall be 24 hour nursing service with a sufficient number <strong>of</strong> qualified supervisory andsupportive personnel on duty at all times to meet the total needs <strong>of</strong> patients.Appendix A2State Activities in 1999 Related to <strong>Staffing</strong> Working UpdateNovember 1999Prepared by the Parapr<strong>of</strong>essional Healthcare <strong>In</strong>stitute<strong>Appropriateness</strong> <strong>of</strong> <strong>Minimum</strong> <strong>Nurse</strong> <strong>Staffing</strong> <strong>Ratios</strong> in <strong>Nursing</strong> HomesReport to Congress−103
STATE ACTIVITIES IN 1999 RELATED TO STAFFINGWORKING UPDATENOVEMBER 1999Prepared by the Parapr<strong>of</strong>essional Healthcare <strong>In</strong>stituteThis “working update” reports on state activities related to staffing. It is based on informationfrom the NCCNHR advocacy network, including State LTC Ombudsman Programs and CitizenAdvocacy Organizations, as well as information from SEIU and a September 1999 report by theNorth Carolina Division <strong>of</strong> Facility Services. Please send updates, additions, corrections to <strong>PHI</strong>.AK – workgroup on staffing; considering wage pass-through and increased trainingAL -- does not have any bills at this time but plan to get a work group together in the near future.AR -- passed legislation last year regarding minimum staffing. For more, see: www.aanhr.org.Wage pass-through also implementedAZ -- a long term care task force committee has sub-committees on Quality <strong>of</strong> Care; Regulationand Enforcement; Workforce Development and Retention; Funding, <strong>In</strong>surance andReimbursement. <strong>Staffing</strong> issues have been discussed in the relevant committees. The subcommitteereport is to be presented to the complete task force on November 22, 1999. A wagepass-throughis under consideration.CA – the budget increased total nursing hours per patient day to 3.2 and eliminated doublecounting <strong>of</strong> RN hrs, effective January 1, 2000. It also included a $36 million wage passthrough.The Governor vetoed legislation for additional increases to 3.5 hours by 2003. TheGovernor also is seeking to delay the January 1, 2000 implementation <strong>of</strong> the 3.2 hr. requirement.CO – working on a proposal for a staffing bill but still not sure if it will go ahead. Health deptreports that a voluntary wage pass-through for home care workers has been implemented.CT – a bill was raised to increase staffing ratios but it didn’t go forward. <strong>In</strong>stead, the Governoragreed to increase Medicaid reimbursement rates by 10% with an infusion <strong>of</strong> $200 million, to gotowards raising salaries and benefits, but not necessarily towards increased staff/resident ratios.The Select Committee on Aging will likely raise the issue again in the 2000 session.DC -- no new initiatives legislatively. Discussions have occurred within the state licensingdepartment, but nothing concrete has been decided upon.DE – ratios bill introduced this year but didn’t pass. Will be re-introduced next session. Taskforce looking at workforce availability issues, and whether problems stem from low staffinglevels or inadequate training. Legislation passed to double training hours from 75 to 150 hours.<strong>Appropriateness</strong> <strong>of</strong> <strong>Minimum</strong> <strong>Nurse</strong> <strong>Staffing</strong> <strong>Ratios</strong> in <strong>Nursing</strong> HomesReport to Congress−104
<strong>PHI</strong> – National Office<strong>PHI</strong> – Boston Office349 East 149 th Street, Suite 401 30 Winter Street, 10 th Fl.Bronx, NY, 10451 Boston, MA, 02108FL -- the Florida Legislature passed legislation this year giving the nursing homes $40 million touse to increase staffing and CNA wages in nursing homes. A more comprehensive piece <strong>of</strong>legislation requiring the homes to have specific staffing ratios did not pass out <strong>of</strong> committee.Another part <strong>of</strong> the legislation that the governor did sign requires the Department <strong>of</strong> ElderAffairs to examine the marketplace for CNAs, including their wage structure.GA -- advocates in Georgia are developing legislation for introduction for the 2000 GeneralAssembly to: (1) introduce staff/resident ratios (based largely on NCCNHR recommendedstandards; GA regulations currently require 2.0 nurse staffing hours per resident per day); and (2)develop a study committee to look at staffing issues in LTC broadly (i.e. not only nursing homes,but also home health, assisted living/personal care homes, etc.).HI – no activity reported.IA – no legislative action. Last year there was discussion <strong>of</strong> a wage pass-through but nothingmaterialized. Iowa funded a study through the Iowa Caregivers' Association that looked at nonwagefactors affecting retention <strong>of</strong> CNA staff. The Association has produced a preliminaryreport with recommendations.ID -- no activity reported.IL -- specific language to increase the ratio was introduced but did not make it out <strong>of</strong> thecommittee to be heard by any more than the committee members. Bill pending for 2000 – wouldestablish ratios <strong>of</strong> 1:5, 1:8, and 1:12 with additional acuity based staffing system. State agencyreports a wage pass-through for home care workers.IN -- advocates are discussing proposals for increased nurse/CNA ratio requirements andincreased CNA training requirements. Legislation was introduced last year that, in addition toother reforms, included minimum staffing ratios. The bill was amended and the final versionrecommended a study <strong>of</strong> staffing issues by a legislative study commission. The bill made it tojoint committee but failed to be brought up for vote in the closing moments <strong>of</strong> the session.KS -- legislature passed a voluntary wage pass-through last session (S.B. 126). Signed into lawby the Governor, it is “a quality enhancement wage pass-through program as part <strong>of</strong> the stateMedicaid plan to allow nursing facilities electing to participate in such program a paymentoption <strong>of</strong> not to exceed $4 per resident day designed to increase salaries or benefits, or both, forthose employees providing direct care and support services to residents <strong>of</strong> nursing facilities.”<strong>Appropriateness</strong> <strong>of</strong> <strong>Minimum</strong> <strong>Nurse</strong> <strong>Staffing</strong> <strong>Ratios</strong> in <strong>Nursing</strong> HomesReport to Congress−105
KY -- no legislation re: staffing issues and none proposed at this time for the 2000 legislativesession. Legislature doesn't meet until Jan and then for only 60 days and not again until 2002.Any real work will have to be done through the regulatory process. Grass roots efforts are beingtargeted there through a very active work group looking at the issues.LA -- in the ‘99 legislative session, a bill on ratios was introduced, but never made it out <strong>of</strong>Committee. There is still potential for passage <strong>of</strong> legislation for a pass-through for increasedreimbursement for staffing. Advocates hope to revive the staffing ratio bill for the 2001 session.MA – Bills introduced for staffing ratios <strong>of</strong> 1:5; 1:8; 1:12-15. Coalition <strong>of</strong> advocates, labor, andproviders have formed group to seek passage <strong>of</strong> ratios and 10% wage pass-through. Dept <strong>of</strong>Public Health is looking at staffing hours and training as part <strong>of</strong> its regulatory revision process.A wage pass-through was implemented for home care workers funded through the Elder Affairs.MD – Bill passed in March establishing a two-year study <strong>of</strong> staffing in nursing homes. <strong>Nursing</strong>Home Task Force is underway with workgroups looking at staffing/quality care and residents'rights. Recommendations <strong>of</strong> the Task Force are due to the Governor December 1. They will berecommending a higher staffing ratio.ME -- staffing bill was carried over. A state agency reports that a wage pass-through for CNA’swas implemented. A Task Force has been underway and has issued a report.MI – Bill passed House and is pending; would increase direct care hours from 2.25 to 3.0 perresident per day. A state agency reports that a CNA wage pass-through was implemented.MN -- in the most recent legislative session a bill passed that increases the wages for nonpr<strong>of</strong>essionaldirect care staff in nursing homes and home health care. A workgroup on workforceissues is underway.MO -- no legislation or budget items in 1999. <strong>In</strong>-home providers got a $1.00 per unit (hour)increase starting in July 1999. Silver Haired Legislature passed the NCCNHR staffing ratio inOctober as one <strong>of</strong> their top five priorities. The bill will be discussed in the upcoming legislativesession. A workgroup on workforce issues in underway.MS – through nursing home regulations effective Jan. 2000, increased from 2:33 hours <strong>of</strong>nursing care per resident per day to new ratios based on 2.67 hours <strong>of</strong> nursing care per residentper day. Revised Personal Care Homes (PCH) regulations to require one resident attendant per10 residents for the hours <strong>of</strong> 7:00 a.m. until 7:00 p.m. and one resident attendant per 20 or fewerresidents for the hours <strong>of</strong> 7:00 p.m. until 7:00 a.m., effective January 2000.MT – wage pass-through <strong>of</strong> $0.25/hr for all direct care workers in long term care.NC – advocacy action underway on staffing levels in nursing homes; got increases in staffing inadult care homes in 1997. Division <strong>of</strong> Facility Services is studying nurse aide recruitment and<strong>Appropriateness</strong> <strong>of</strong> <strong>Minimum</strong> <strong>Nurse</strong> <strong>Staffing</strong> <strong>Ratios</strong> in <strong>Nursing</strong> HomesReport to Congress−106
etention, looking at wages and staffing levels. Bill passed on minimum staffing and trainingrequirements for medication aides in Assisted Living facilities.ND -- a Task Force on Long Term Care Planning appointed by Governor was established in1995 to provide recommendations for improving the delivery <strong>of</strong> ltc services in the State. Onearea the Long Term Care Planning Task Force is providing recommendations on relates to"Examining the current <strong>Nursing</strong> Facility Rate equalization policy to determine if any changes tothe current law are appropriate." <strong>In</strong>dustry representatives want increases in <strong>Nursing</strong> Facilityrates to increase staff ratios/hours, wages and training. These issues are being studied and maybe submitted for proposed legislation in the next biennium.NE -- nothing has passed or is pending. A workgroup on workforce issues is underway.NH -- nothing pending to address the nh staffing shortage. Bill introduced to increase hourlywages for direct care providers for persons with disabilities.NJ – bill passed through committee – would establish ratios <strong>of</strong> 1:5; 1:8; 1:12 with additionalacuity based staffing.NM – minimum staffing bill passed House and Senate but vetoed by Governor. Will try again.NV – no legislative action. A workgroup on workforce issues is underway.NY -- a bill passed through House committee – would establish ratios <strong>of</strong> 1:5; 1:8; 1:12 withadditional acuity based staffing.OH -- a bill was introduced to establish staffing ratios <strong>of</strong> 1:5; 1:10; 1:15 for unlicensed nursingstaff; plus public right to staffing information. The state has a workgroup that's developingrecommendations to increase the labor pool.OK -- a couple <strong>of</strong> years ago there was a wage enhancement for nursing staff - a $1.00/hourincrease for nurse aides, which got swept away with the minimum wage increase that followed.An "ad hoc" committee <strong>of</strong> the LTC Facility Advisory Board is looking at enhancements to NAtraining, with special emphasis on Alzheimer’s/dementia care. Recommendations will then g<strong>of</strong>orward, perhaps on to the State Board <strong>of</strong> Health for changes. OK has had direct care staffingbills in the Silver Haired Legislature and the "real" legislature for the past several years. Bothwill hear bills again in their next sessions.OR – state agency reports a wage pass-through for home care workers has been implementedand that a workgroup on workforce issues is underway.PA -- as <strong>of</strong> July 1, 1999, new State licensure regulations set the total number <strong>of</strong> hours <strong>of</strong> generalnursing care provided in each 24-hour period, when totaled for the entire facility, be a minimum<strong>of</strong> 2.7 hours <strong>of</strong> direct resident care for each resident (up from 2.3 for intermediary) however, the<strong>Appropriateness</strong> <strong>of</strong> <strong>Minimum</strong> <strong>Nurse</strong> <strong>Staffing</strong> <strong>Ratios</strong> in <strong>Nursing</strong> HomesReport to Congress−107
nursing staff ratios remained the same (RN's & LPN's). Another bill has been introduced whichwould increase ratios to 1:5; 1:10; 1:15 with public right to staffing information. A workgroupon workforce issues is underway.PR – no activity reported.RI – a wage pass-through for home care workers was implemented. A workgroup on workforceissues is looking at issues related to low staff ratios and quality <strong>of</strong> care.SC -- passed a minimum patient to staff ratio bill last year. <strong>Ratios</strong> are 1:9; 1:13; 1:22. A wagepass-through for home care workers was implemented and a workgroup on workforce issues isunderway.SD – no activity reported.TN – no activity reported.TX -- nurse aide staffing ratios bill proposed the past two sessions, (4years). Thus far, no bill hassuccessful passed both houses. Advocates will try again next session and will use NCCNHR'srecommended ratios. The legislature did appropriate almost $12 million per year to increasereimbursement rates, with the implied purpose to improve staffing at all levels. Outcomemeasures and procedures are currently being developed by our Human Services Commission toassure the increases are appropriately used. A state agency reports that a wage pass-through forhome care workers has been implemented.UT -- a subcommittee reviewing staff to patient ratios and will report its recommendations to theHealth Facilities Committee.VA -- there is an effort underway by the Joint Commission on Health Care (a legislativecommission created by our General Assembly to examine health care issues in the state) to"review the staffing requirements for nursing home facilities and adult care residences to ensureadequate levels <strong>of</strong> care and adequate enforcement <strong>of</strong> these standards." The study is to determinewhether staffing standards currently in effect in the state are adequate to protect the health,safety, and welfare <strong>of</strong> nursing home ad adult care residents. Based on a study <strong>of</strong> the currentregulations, practices, and enforcement the commission is to come up with recommendations forenhanced staffing guidelines. The Commission’s legislative recommendations will not be outuntil December. They are examining both the option <strong>of</strong> phasing in some sort <strong>of</strong> ratio as well asthe option <strong>of</strong> creating (through the state's reimbursement system) substantial financial incentivesfor nursing facilities to reach and maintain targeted staffing levels for direct care staff.Last year's General Assembly also passed a dollar an hour increase for nursing assistants innursing facilities, which was effective July 1. A wage pass-through has also been implementedfor home care workers.<strong>Appropriateness</strong> <strong>of</strong> <strong>Minimum</strong> <strong>Nurse</strong> <strong>Staffing</strong> <strong>Ratios</strong> in <strong>Nursing</strong> HomesReport to Congress−108
VT -- nothing specific pending or under consideration this session. During the last session, thelegislature enacted a statute authorizing monthly wage supplements to all nursing homes. Thestate will use the nursing home bed tax to pay for the wage supplement. The state anticipatesthat the bed tax will generate about $4,000,000 per year. Each facility will receive a pro ratashare <strong>of</strong> the revenues based on the ratio <strong>of</strong> their reported nursing costs to the total reportednursing costs <strong>of</strong> all facilities. Facilities can spend the wage supplement on wages, salary orfringe benefits for any nursing homes employees other than owners and administrators. They arenot required to spend it on nursing or direct care staff. Facilities have been receiving monthlypayments since last July. The payments vary greatly depending on each facility's reportednursing costs.Facilities are not required to report on how they spend the supplement until September <strong>of</strong> '00.When the state rebases all the cost categories (It is my understanding that this will occur in 3-4years) it will determine if facilities have been spending their wage supplement correctly. If afacility's cumulative annual wage expenditure ( all employees minus owners and administrators)is less than the cumulative total <strong>of</strong> its wage supplement payments, then the state will determinethat the facility has been overpaid and the state will recoup the overpayment.WA -- currently looking at the whole LTC system via a Joint Legislative/Executive Long-TermCare Task Force. One sub group is looking at training issues. DSHS has also proposedlegislation for training requirements. A wage pass-through for home care workers has beenimplemented.WI -- amended our nursing home licensure statute slightly over two years ago. The changes tookeffect in January <strong>of</strong> this year and results are starting to come in although no formal analysis hasyet been done. The changes were in the form <strong>of</strong> increased required minimum staffing based onthe number <strong>of</strong> residents <strong>of</strong> specified acuity in a facility. Total number <strong>of</strong> staff hours per residentper day were raised from 1.25 to 2.00 hrs for limited nursing care; from 2.25 to 2.50 hrs forskilled care, and up to 3.25 hrs for intensive skilled care. As part <strong>of</strong> the Governor's "Year <strong>of</strong>the Long Term Care Worker," a taskforce is examining issues related to recruitment andretention <strong>of</strong> ALL long term care workers. Wage pass-throughs were enacted for nursing homeand home health workers.WV -- a bill was proposed in the legislature that would have resulted in requiring moreRegistered <strong>Nurse</strong>s in nursing homes. Another bill would have established staffing ratios <strong>of</strong> 1:5;1:8; 1:12 with public disclosure <strong>of</strong> staffing. The bills didn’t pass but will likely be reintroducedin the next session. The entire nursing home staffing issue is now being studied by a legislativesubcommittee.WY – Silver-Haired Legislature is supportive <strong>of</strong> staffing ratios and may bring proposals forwardfor 2001 session.<strong>Appropriateness</strong> <strong>of</strong> <strong>Minimum</strong> <strong>Nurse</strong> <strong>Staffing</strong> <strong>Ratios</strong> in <strong>Nursing</strong> HomesReport to Congress−109
Appendix A3<strong>Appropriateness</strong> <strong>of</strong> <strong>Minimum</strong> <strong>Nurse</strong> <strong>Staffing</strong> <strong>Ratios</strong> in <strong>Nursing</strong> HomesReport to Congress−110
Comparing State Efforts to Address the Recruitment andRetention <strong>of</strong><strong>Nurse</strong> Aide and Other Parapr<strong>of</strong>essional Aide WorkersPublished by theNorth Carolina Division <strong>of</strong> Facility ServicesSeptember 1999Background <strong>In</strong>formation<strong>Nurse</strong> aides and other parapr<strong>of</strong>essional aide workers are key players in thedelivery <strong>of</strong> health and long term care services. They provide most <strong>of</strong> the paidlong-term care needed by impaired persons whether at home or in a facility.This workforce tends to some <strong>of</strong> the most basic needs <strong>of</strong> patients such asdressing, bathing, toileting, eating, assisting with medications, monitoringblood pressure, changing bandages, housekeeping, etc. Their work isfundamental to quality <strong>of</strong> care and preserving the dignity <strong>of</strong> persons whomust rely on others to help meet many <strong>of</strong> the routine daily tasks most <strong>of</strong> ustake for granted.To illustrate the importance <strong>of</strong> this workforce, the US Bureau <strong>of</strong> Laborprojects that between 1996 and 2006, these workers will be among the top tenoccupations having the largest job growth. They are also among the top 10occupations projected to have the fastest job growth.Recruiting difficulties and turnover rates are reported to be a very seriousproblem for all major long-term care settings in North Carolina (home care,assisted living, and nursing homes). Our state’s low unemployment rate(2.7% in June ’99 compared to 4.3% nationally) is a cyclical factor thatcontributes to current worker shortages. However, there are an array <strong>of</strong> jobfactors that are structural in nature that also have a direct and significantbearing on worker shortages such as:• low wages and few, if any, benefits• no career path• physically demanding work<strong>In</strong> 1998 NC spent more than$1.4 billion for services thatrely heavily on aide workersincluding nursing home care;intermediate care for thementally retarded (ICF-MR);CAP-MR/DD; home healthaides; in-home aide servicesincluding Medicaid fundedPersonal Care Services(PCS) and CAP-DA; andPCS for adult care homes(does not include anyMedicare funds).NC will need approximately 21,000more nurse aides and other aideworkers over the next 5-6 years.This is well before 2011 when thefirst wave <strong>of</strong> baby boomers beginsreaching 65. We can expectcontinued growth in demand forthese workers long after 2030 whenthe last wave <strong>of</strong> boomers reachesage 65.<strong>Appropriateness</strong> <strong>of</strong> <strong>Minimum</strong> <strong>Nurse</strong> <strong>Staffing</strong> <strong>Ratios</strong> in <strong>Nursing</strong> HomesReport to Congress−111
• lack <strong>of</strong> opportunity for meaningful input into patient care• inadequate recognition and appreciation• inadequate exposure to “real life” job demands during training<strong>In</strong> 1997 NC’s median hourly wage for aide workers was $7.26 per hour($15,101 annually) or 65% <strong>of</strong> the state’s average annual per capita income <strong>of</strong>$23,168. The 1997 average annual income for aide workers equates to183% <strong>of</strong> the current poverty level for an individual, 136% <strong>of</strong> poverty for afamily <strong>of</strong> 2, and 109% for a family <strong>of</strong> 3.Background <strong>In</strong>formation -- ContinuedListed below are median hourly wages for North Carolina for several majorjob categories in the state likely to be a competing employment option foraide workers (1997 data).• food service -- $5.95 ($12,376 annually)• sales persons/retail -- $7.20 ($14,976 annually)• hand packers/packagers --$7.36 ($15,308 annually)• information clerks/receptionists -- $8.63 ($17,950 annually)• factory workers (unskilled) --$9.05 ($18,824 annually)Note: Attachment # 1 includes a state by state comparison <strong>of</strong> 1997hourly and annual wages for aide workers; annual aide wages as apercentage <strong>of</strong> the state’s average annual per capita income; whetheror not aide recruitment and retention is a major workforce issue instates; and state unemployment data for May 1999.2.7% is the lowest seasonallyadjusted unemployment ratethe state has seen in 20 years.Annual turnover rates for aides innursing homes exceed 100%. For1999, the industry projects theaverage hourly wage (wages onlynobenefits) for nurse aides to be$8.61.Annual turnover rates in adult carehomes are reported to be over140% annually. Based on costreports submitted to theDepartment <strong>of</strong> Health and HumanServices (DHHS), theaverage hourly wage foraides was $7.13(wages only)in 1998.The number <strong>of</strong> inactive nurseaides on NC’s nurse aideregistry is greater than thenumber <strong>of</strong> active nurse aides(approximately 104,000inactive and 85,000 active –as <strong>of</strong> September 21, 1999).PurposeThe purpose <strong>of</strong> this report is to:1. Determine the extent to which aide recruitment and retention is currentlya major workforce issue in other states.2. Compare unemployment and wage data for aide workers across statesand see how aide wages stack up as a percentage <strong>of</strong> per capita income.3. Compare wage data for aides with workers in several competingemployment fields.4. Identify any public policy trends among states with regard to stateactions to address aide wages and/or benefits for publicly fundedservices.This paper focuses primarily onwage and benefit issues associatedwith the aide workforce.<strong>Appropriateness</strong> <strong>of</strong> <strong>Minimum</strong> <strong>Nurse</strong> <strong>Staffing</strong> <strong>Ratios</strong> in <strong>Nursing</strong> HomesReport to Congress−112
5. Determine to what extent states use uniform reimbursement rates acrosspublic funding streams for in-home aide services – and examine how thismay impact a state’s ability to address wage issues for these workers.6. Identify major actions states are taking or considering to address aiderecruitment and retention issues, if any.MethodologyThe Division <strong>of</strong> Facility Services developed a survey to collect informationfrom all 50 states addressing several public policy issues related to aidewages and benefits and identification <strong>of</strong> any major actions underway or beingconsidered to address shortages <strong>of</strong> aide workers. Surveys were sent to bothstate Medicaid agencies and State Units on Aging. The survey wasconducted during May and June <strong>of</strong> 1999. As necessary, follow-up contactswere made with states to clarify information provided or solicit missinginformation. Based on self-reported responses provided by states, data forkey items was compiled and analyzed. Unemployment data, per capitapersonal income data and median wage data for selected employment sectors(i.e. aides, retail sales, factory, etc.) was obtained from the US Bureau <strong>of</strong>Labor Statistics. Other sources <strong>of</strong> data contained in this report are identifiedin the “Notes” section on page 12.46 states responded to thesurvey (either Medicaidagency, State Unit on Agingor both). No surveyresponses were received fromthe states <strong>of</strong> California,Wisconsin, Ohio, or Vermont.Non-state agency contactsprovided information forCalifornia and Wisconsin asto whether or not aiderecruitment and retention is amajor work force issue in thestate.Major Trends Among States1) Of the 48 states from whom information was obtained, 88% (42) said thataide recruitment and retention is currently a major workforce issue.• Both the state with the lowest unemployment rate (Minnesota at2.1%) and the highest unemployment rate (West Virginia at6.8%) indicated that aide retention and recruitment is a majorconcern.• 33 (79%) <strong>of</strong> the 42 states indicating this was a major work forceissue have either taken action (30 states) or are considering action(3 states) to address the issue.(See Attachment #2 for more detailed information on survey results.)Many states indicated that lowunemployment was a factor in poorrecruitment and retention.However, several specificallycommented that they now view thisissue as a more intractableproblem that will persist for anextended period regardless <strong>of</strong> thestate <strong>of</strong> the economy--due to theaging <strong>of</strong> the population.2) With regard to public policy actions to specifically address aide wagesand/or benefits, a recent but prevalent trend is the concept <strong>of</strong> a “passthrough” wage increase-- the result <strong>of</strong> a reimbursement increase toThe following quote captures theextent to which this workforceissue impacts the nation.“As a social scientist, I<strong>Appropriateness</strong> <strong>of</strong> <strong>Minimum</strong> <strong>Nurse</strong> <strong>Staffing</strong> <strong>Ratios</strong> in <strong>Nursing</strong> HomesReport to Congress−113
providers <strong>of</strong> which all or some specified portion <strong>of</strong> the increase isearmarked exclusively for aide salaries and/or benefits.Wage and Benefit Pass Throughs• 16 states have approved/implemented some form <strong>of</strong> a wage passthrough.• Most states implementing mandatory wage pass throughs have done soonly in the last year or two. Some states have been providingreimbursement increases that were intended to go to front line and/oraide wages specifically, but the requirement that the increase go tothese workers is a recent occurrence.• 1 state, Iowa, is considering implementation <strong>of</strong> a pass through.States have chosen two methods to implement wage pass throughs• 10 <strong>of</strong> the 16 states implement pass throughs based on a set dollaramount for workers per hour or patient day. The pass throughamounts ranged from $.50 per hour to $2.14 per hour and $4.93 perpatient day.Dollar Amount Pass ThroughArkansas*Rhode IslandColoradoSouth CarolinaMassachusetts TexasMissouriVirginiaOregonWashington* Arkansas indicated their pass through is pending HCFAapproval.• 6 <strong>of</strong> the 16 states established wage pass throughs as a percentage <strong>of</strong>the increased reimbursement rate. For example, 80% <strong>of</strong> Minnesota’srecent 40% rate increase was earmarked for wages and benefits,while Illinois has a law requiring 73% <strong>of</strong> all rate increases be usedfor wages and benefits.Major Trends Among States -- ContinuedPercentage Pass ThroughCaliforniaMichiganIllinoisMinnesotaMaineMontana• Of the states implementing wage pass throughs, 9 targeted only homecare aide workers (no facility based care); 4 targeted only direct serviceworkers in nursing facilities, and 3 targeted both home care andnursing facilities. At least one state which provided a wage passdon’t use the word“crisis” lightly, but I dothink that over the next 10years we face a true crisisregarding frontlineworkers in long-termcare”(Karl Pillemer, Director,AppliedGerontology Research<strong>In</strong>stitute –atCornell University)7 states are known to haveestablished minimum wage ratesthat are higher than the federalminimum wage. The amountabove the federal minimum wageranges from $.10 to $1.35 p/hour.Oregon has the highest minimumwage rate among these states at$6.50 p/hour.One administrator with astate Unit on Aging statedthat while he was pleasedthat the state legislature hadapproved a dollar wage passthrough for nurse aides, hequestioned the end results.He pointed out that withoutsetting up a structured passthrough system, perhaps apercentage <strong>of</strong> any annualincrease in reimbursementrates, the problem had notbeen permanently solved. <strong>In</strong>a few years wages in otherlow level jobs will catch upto aide wages, and the statewould once again face thesame recruitment andretention problem.<strong>Appropriateness</strong> <strong>of</strong> <strong>Minimum</strong> <strong>Nurse</strong> <strong>Staffing</strong> <strong>Ratios</strong> in <strong>Nursing</strong> HomesReport to Congress−114
through only to its home care workers stated that it was likely that theirnursing facility workers would receive a wage pass through in the nearfuture.Home care only: <strong>Nursing</strong> facilities only: Both/all LTC:Colorado Arkansas MinnesotaIllinois Maine MontanaMassachusetts Michigan VirginiaMissouriCaliforniaOregonRhode IslandSouth CarolinaTexasWashington• It is interesting to note that <strong>of</strong> the 9 states providing increases to onlyhome care aides over half had uniform reimbursement rates acrossmultiple funding streams. Of the 16 states implementing wage passthroughs, that provided information on the pass throughs fundingsource(s), 6 appear to use multiple funding streams (Medicaid plusadditional sources). Of the remaining 10 states, 6 appear to use onlyMedicaid or only non-Medicaid funding sources, and 4 did notprovide this information.• The majority <strong>of</strong> states who have a wage pass through in place statedthat monitoring providers’ compliance with the wage and benefitsrequirement has not been, or is not expected to be, an undue burdenfor their agencies. Some states have required/will require providers tosubmit an initial plan describing usage <strong>of</strong> the additional funds, andthen confirm compliance when the state audits providers. Other statesprovide additional funding to providers without an initial plan butensure compliance by reviewing fund usage during annual audits. Forsome states, implementing a wage pass through system is still verynew and they have not yet determined the most effective, low-costway to monitor providers and ensure compliance.The majority <strong>of</strong> wage passthroughs in place in statesare intended to be distributedequally to all nurse aides.However, some states allowthe long term carefacilities/agencies todetermine which front linestaff receive the additionalfunding and what percentageis used for wages versusbenefits.Sanctions against providerswho failed to use the fundsfor wages or benefits usuallyconsist <strong>of</strong> immediaterepayment by the provider <strong>of</strong>the inappropriately usedmonies. <strong>In</strong> Missouri,however, the state has linkedfailure to comply with thewage increase and reportingrequirements to the possiblerevocation <strong>of</strong> the provider’sMedicaid status.Major Trends Among States -- Continued3) Enhancement <strong>In</strong>centivesAnother trend closely related to the concept <strong>of</strong> a wage pass through is theeffort by states to tie increased reimbursement rates to increasedperformance by providers and staff. Rhode Island recently authorized a<strong>Appropriateness</strong> <strong>of</strong> <strong>Minimum</strong> <strong>Nurse</strong> <strong>Staffing</strong> <strong>Ratios</strong> in <strong>Nursing</strong> HomesReport to Congress−115
$1.50 hourly rate increase to be used for direct service staff wages, but inaddition to these monies, the state also authorized additional monies tobe used as an incentive to enhance standards. As <strong>of</strong> September 1999, thestate will <strong>of</strong>fer additional hourly reimbursement in seven primary areas:shift differentials, client satisfaction, level <strong>of</strong> patient acuity, level <strong>of</strong>provider accreditation, continuity <strong>of</strong> care, and level <strong>of</strong> workersatisfaction. Rhode Island currently has an enhancement system in placewith bonuses ranging from $.50 per hour to $2.00 per hour but this newsystem is more intricate with the possibility <strong>of</strong> up to $6.00 per hour inadditional reimbursement above the base rate.4) Higher State Reimbursement Rates for Shift DifferentialsLike Rhode Island, New Jersey has focused on the idea <strong>of</strong> establishinghigher reimbursement rates for in-home aide services provided at night,weekends and holidays. States focusing on shift differentials think thatthe increased reimbursement rates for certain time periods will helpprovider's recruit and retain aide staff.5) Transportation ReimbursementOne state, Washington, also indicated that they recently passedlegislation requiring home care providers to pay their aides for“windshield time.” Windshield time is the time spent by the stafftraveling from one site to another. At this time, the additional fundingfor the travel time is paid from the state reimbursement rate for personalcare services. Florida’s Department <strong>of</strong> Elder Affairs Work Group hasalso recommended that the state review transportation reimbursementsfor aide staff.6) <strong>Nurse</strong> Aide Career LaddersSeveral states noted that they had considered creating some form <strong>of</strong> acareer ladder for aide staff. Mississippi has established two separate sets<strong>of</strong> standards, one applying to homemaker and another to personal careaides, as a basic career ladder. Maine and Alaska are both consideringways to create some form <strong>of</strong> a career ladder, while Illinois has a billpending which would authorize the creation <strong>of</strong> a resident attendantcategory <strong>of</strong> worker for nursing homes. These workers will undergotraining to provide basic support services to fully trained nurse aides.Delaware’s State Legislative and Citizens <strong>In</strong>vestigative Panel on <strong>Nursing</strong>Home Reform has also recommended the development <strong>of</strong> a career ladderincluding at least three levels; intern, team member, and team-preceptor.Each level would result in an increased pay level.Major Trends Among States – Continued<strong>Appropriateness</strong> <strong>of</strong> <strong>Minimum</strong> <strong>Nurse</strong> <strong>Staffing</strong> <strong>Ratios</strong> in <strong>Nursing</strong> HomesReport to CongressRhode Island is still workingto find an effective means <strong>of</strong>operationalizing theseadditional incentives. Whilethe state, providers andassociations all see themeasures as a step in theright direction, state staffstated that it has beendifficult to get all parties toagree on the measures andsystems to be used.Home care aides in NewJersey are paid $14/hour forweekday services, whileaides working weekendhours are paid $16/hour.<strong>In</strong> NC, many individual−116
7) <strong>Nurse</strong> Aide Training<strong>In</strong> addition to the creation <strong>of</strong> a career ladder for nurse aides, states arefocusing on the training provided to this population. By providing orproposing different levels <strong>of</strong> training, states like Mississippi, Delawareand Maine hope to provide nurse aides with an incentive to continue inthe pr<strong>of</strong>ession. Virginia also recently increased the minimum traininghours for nurse aide programs from 80 to 120 hours.8) Training Former Welfare RecipientsMultiple states indicated that their welfare reform efforts have been seenas a potential source for nurse aide trainees. Workgroups in New Mexicoand Florida have recommended funneling welfare recipients into nurseaide training programs, while New Jersey’s welfare reform training hasresulted in some new home health aides.providers (home careagencies and facilities) payshift differentials. However,this initiative is different inthat the state reimbursementrates are stratified based onthe time that home careservices are provided.9) Training <strong>of</strong> Volunteer PopulationsAlong with the idea <strong>of</strong> tapping into new populations to increase thenumber <strong>of</strong> nurse aides, including former welfare recipients, is the trend toexpand the use <strong>of</strong> volunteers. State workgroups looking at the issue <strong>of</strong>recruitment and retention have suggested expanding the use <strong>of</strong>Americorps volunteers, local and state volunteer programs, studentvolunteers, and senior citizens. The Maine Health Care AssociationLong Term Care Task Force has also advocated modifying aspects <strong>of</strong> thenurse aide job in order to encourage seniors to become a part <strong>of</strong> thisworkforce.States indicating they wereconsidering or taking actionon the creation <strong>of</strong> a careerladder for nurse aidesinclude Mississippi, Maine,Alaska, Illinois, Delaware,and Michigan.10) Pilot ProgramsThree states discussed the implementation <strong>of</strong> pilot incentive programs toencourage aide recruitment and retention. Wisconsin, Iowa andOklahoma each have either funded or proposed pilot programs that focuson enhancing the quality <strong>of</strong> life for direct care workers and reducing staffturnover.11) Overall Labor Shortage AreaAt least one state, Florida, said it is looking at the nurse aide issue as part<strong>of</strong> an overall labor shortage in low-wage jobs. While Florida was theonly state to note that they were looking at the issue from this standpoint,several states did note that due to low levels <strong>of</strong> unemployment, they werefaced with a far tighter labor market than they have previouslyencountered.<strong>Appropriateness</strong> <strong>of</strong> <strong>Minimum</strong> <strong>Nurse</strong> <strong>Staffing</strong> <strong>Ratios</strong> in <strong>Nursing</strong> HomesReport to CongressNorth Carolina currentlyrequires a minimum <strong>of</strong> 75hours <strong>of</strong> training and acompetency test, or only thecompetency test in order tobe certified to work as a−117
Major Trends Among States -- Continued12) Work Groups / Task Forces / Data CollectionThough many states have not yet implemented specific programsfocusing on nurse aide recruitment and retention issues, Work Groups orTask Forces have been or will be established in the next fiscal year by31% (13) <strong>of</strong> the states that felt that this was an issue <strong>of</strong> concern.Participants in the Work Groups represented people from a wide range <strong>of</strong>groups, including representatives <strong>of</strong> the state Boards <strong>of</strong> <strong>Nursing</strong>, providergroups, state Departments <strong>of</strong> Health and Human Services and Aging,patient advocates, and certified nursing assistants. For the most part,these groups are charged with obtaining data and analyzing the situation,and then providing both short and long-term recommendations. Thelegislatures <strong>of</strong> an additional two states, Iowa and Virginia, haverequested the appropriate state agencies to collect data on the issue <strong>of</strong>nurse aide recruitment and retention in order to determine appropriatenext steps.<strong>Nurse</strong> Aide 1.States indicating they were makinga concerted effort to broaden thepool <strong>of</strong> potential aide workers bylooking at former welfarerecipients as potential nurse aidesinclude New Jersey, New Mexico,Florida and Arkansas.The NC Division <strong>of</strong> FacilityServices has receivedfunding from the Kate B.Reynolds Charitable Trust topilot an array <strong>of</strong> incentivesintended to improve aiderecruitment and retention inlong-term care settings.<strong>Appropriateness</strong> <strong>of</strong> <strong>Minimum</strong> <strong>Nurse</strong> <strong>Staffing</strong> <strong>Ratios</strong> in <strong>Nursing</strong> HomesReport to Congress−118
States that have establishedor plan to establish a WorkGroup or Task Forceinclude: AlaskaArizona RhodeIslandMaryland DelawareMinnesota FloridaNebraska MaineNevada OklahomaPennsylvania MissouriThe Legislatures <strong>of</strong> Iowa andVirginia have mandated datacollection efforts by stateagencies.Conclusion<strong>Nurse</strong> aide and parapr<strong>of</strong>essional worker shortages are a serious problem forNorth Carolina and the nation as a whole. Although low unemployment ratesboth in the state and nation increase competition for all workers, shortages andturnover rates among the aide workforce cannot be attributed solely to thestate <strong>of</strong> our booming economy. Structural job factors contribute heavily to theproblem and, in the absence <strong>of</strong> examining and alleviating these structural jobfactors, other employment opportunities <strong>of</strong> similar or even better pay orbenefits and perhaps less demanding work will drain an already shrinking pool<strong>of</strong> potential aide workers.Many states are taking action to address this workforce issue. They recognizethat demand for these workers will only increase as the population ages.Certainly North Carolina’s health and long-term care providers have a majorresponsibility to help address this workforce issue. However, given the level<strong>of</strong> the state’s financial investment in services that heavily rely on the aideworkforce, the state too shares in the responsibility for addressing thisworkforce issue. Confirmation <strong>of</strong> the public sector’s responsibility is evidentfrom the growing number <strong>of</strong> states that are taking action or considering actionsto alleviate worker shortages and turnover. Collaboration with various tradeassociations representing various health and long-term care providers will bekey to success both now and over the long haul.Ensuring an adequate andstable supply <strong>of</strong> nurse aideand other parapr<strong>of</strong>essionalworkers is essential tomeeting future health andlong-term care demands.This issue effects both publicand privately funded healthand long-term care. Manyfamily and informalcaregivers rely on thisworkforce so they cancontinue to work andsupport their families.<strong>Appropriateness</strong> <strong>of</strong> <strong>Minimum</strong> <strong>Nurse</strong> <strong>Staffing</strong> <strong>Ratios</strong> in <strong>Nursing</strong> HomesReport to Congress−119
The Department <strong>of</strong> Health and Human Services is already taking steps totackle this workforce issue. While current efforts can lead to major steps inthe right direction, additional action is needed now. Outlined below are anumber <strong>of</strong> actions North Carolina could consider in addition to those effortsalready underway with funding from the Kate B. Reynolds Charitable Trust.The potential <strong>of</strong> each <strong>of</strong> these possible actions will need to be fully assessed.They are provided as a starting point for further discussion and analysis.Because this paper focusesprimarily on wages and benefits,so, too, do the possible actionsconsidered in this paper.Obviously, there are other areasthat could be examined such aspossible actions to broaden theworkforce.Some Actions North Carolina Could ConsiderThe actions below focus primarily on wage and benefit issues. The Division<strong>of</strong> Facility Services is currently working on several grant funded initiativesintended to address other job factors that impact the recruitment andretention <strong>of</strong> a stable and qualified aide workforce. The actions below are inaddition to efforts already underway through a grant from the Kate B.Reynolds Charitable Trust.1) The Department <strong>of</strong> Health and Human Services (DHHS) could helpfacilitate a discussion among representatives <strong>of</strong> major state levelassociations that rely on aide workers to determine interest in, and thefeasibility <strong>of</strong>, leveraging their collective purchasing power (and broadenthe risk pool) for purposes <strong>of</strong> <strong>of</strong>fering one or more group healthinsurance plan(s) to member providers that do not currently <strong>of</strong>fer healthinsurance coverage to their employees or provider members who couldbenefit from either improved coverage or pricing as a result <strong>of</strong> such aneffort. This could potentially improve access to health care insurancecoverage for all employees <strong>of</strong> provider member organizations.2) The Division <strong>of</strong> Facility Services could include, with letters sent tonewly listed certified nurse aides, general information about NC’s HealthChoice for Children insurance program. Last year, the Division sentletters verifying listing on the nurse aide registry to approximately15,000 persons. This would enhance efforts taken by state level tradeassociations to inform member organizations about the availability <strong>of</strong> thisprogram. Similar action could be taken by other DHHS agencies thatsend correspondence to provider organizations as a way <strong>of</strong> remindingproviders to notify their employees <strong>of</strong> the availability <strong>of</strong> this program.3) Medicaid reimbursed providers have an avenue to increase wages forworkers in that calculations for inflationary increases awarded by theKey activities underway throughfunding from the Kate B. ReynoldsCharitable Trust include:• developing an automated datatracking system to track thisworkforce over time.• provide nurse aide I trainees withmore hands-on-care time so theyget a more realistic view <strong>of</strong> whatthis type <strong>of</strong> work entails.• pilot a variety <strong>of</strong> employeeincentives intended to improve jobskills, job satisfaction andperformance thus resulting inimproved recruitment andretention. (The results <strong>of</strong> theseincentives will not be known untillate 2001.)• conduct a public education andawareness campaign about theimportance <strong>of</strong> this workforce.The Division <strong>of</strong> Facility Services isworking with the <strong>In</strong>stitute on Aging,representatives <strong>of</strong> state level longtermcare related trade associationsand others to implement the grantactivities above.If inflationary increases do notreflect the actual annual inflationrate (i.e. increases are awarded lessthan annually and/or in amountsless than the overall inflationary<strong>Appropriateness</strong> <strong>of</strong> <strong>Minimum</strong> <strong>Nurse</strong> <strong>Staffing</strong> <strong>Ratios</strong> in <strong>Nursing</strong> HomesReport to Congress−120
Division <strong>of</strong> Medical Assistance assume that 75% <strong>of</strong> increases for PCSservices (in-home and adult care home) and 80% <strong>of</strong> the direct careportion <strong>of</strong> inflationary increases for nursing homes are to supportincreases in direct labor costs. Do providers use the same proportion <strong>of</strong>inflationary increases for direct labor costs as the calculation assumes?Examination is needed to determine whether those providers that payhigher wages also have retention rates that are better than those that paythe average or lower wages.4) Consider a wage pass through (an amount or percentage increase in thereimbursement rate in addition to any planned inflationary increase) forMedicaid funded Personal Care Services (PCS: in-home and adult carehomes) as well as for nursing home care. The wage pass through amountwould be built into the reimbursement rate.Some Actions North Carolina Could Consider --Continued• Recognizing that the state’s unemployment rate is 1 factor in theavailability <strong>of</strong> a stable and quality aide workforce, inclusion <strong>of</strong> thewage pass through in the base reimbursement rate in subsequentyears could be pegged to the state’s overall unemployment rate sothat when unemployment rates climb (to some predeterminedlevel) and competition for workers across various competingemployer types presumably would decline somewhat, thereimbursement rate could be correspondingly adjusted downwardto account for likely reductions in wage pressures for new hires.• The fiscal impact <strong>of</strong> a wage pass through (by care setting) andassociated compliance monitoring costs by the Division <strong>of</strong>Medical Assistance, if any, would be needed.• Action to implement a similar wage pass through for non-Medicaidfunded in-home aide services (e.g. Social Services Block Grant orHome and Community Care Block Grant) is impeded by the factthat there are not uniform reimbursement rates across multiplefunding streams for in-home aide services. As such, the impact <strong>of</strong>a wage pass through for providers who have considerable latitudein setting their own reimbursement rates is questionable(regardless <strong>of</strong> whether reimbursement rates are calculated in acompetitive or non-competitive environment). Monitoring effortsto verify compliance with any wage pass through would likely becomplicated by the fact that reimbursement rates vary so widelyacross providers.While it may appear that the following items do not directly relate toimproving aide recruitment and retention, they do relate to servicerate for the year) the direct laborcomponent <strong>of</strong> the calculation iseroded (as are the remainingcomponents <strong>of</strong> the inflationaryincrease) -- even if the provider usesthe entire 75% -80% allocated fordirect labor costs.As part <strong>of</strong> the Kate B. ReynoldsGrant, a survey <strong>of</strong> major providertypes (home care, adult care homes,nursing homes) will be doneto determine, among other things,whether facilities that pay higherwages also have better retentionrates. Generally, this type <strong>of</strong>information is not now availablefrom major state level long-termcare related associations.Things North Carolina needs toconsider with regard toconsideration <strong>of</strong> a wage passthrough:• this is a relatively new concept• NC doesn’t currently havesubstantial reliable dataavailable to confirm thathigher aide wages translateinto improved aide recruitmentand retention. (This is,however, one component <strong>of</strong> thedata collection activities beingundertaken through the aiderecruitment and retentiongrant made to DHHS by theKate B. Reynolds CharitableTrust.)• Compliance monitoringefforts by states vary. Giventhe short history <strong>of</strong> wage passthroughs, it is likely thatstates will need additionaltime to determine overallcompliance with wage passthrough requirements as wellas the administrative and costefficiency <strong>of</strong> compliancemonitoring efforts.<strong>Appropriateness</strong> <strong>of</strong> <strong>Minimum</strong> <strong>Nurse</strong> <strong>Staffing</strong> <strong>Ratios</strong> in <strong>Nursing</strong> HomesReport to Congress−121
access and making the most efficient use <strong>of</strong> public resources available forin-home aide services. Government is a major payor and by establishedrates can have a significant influence on wages and benefits paid to thelong-term care workforce. Outlined below are several issues that needfurther study to ensure that the public policy goal <strong>of</strong> strengthening thelong-term care workforce is met through public payors.1) Consider establishing a uniform reimbursement rate(s) across stateadministered funding sources for in-home aide type services. This isconsistent with other Department <strong>of</strong> Health and Human Services effortsto establish uniform reimbursement rates for like services funded bymultiple agencies or with multiple public funding sources.• The Department <strong>of</strong> Health and Human services recognizes 4 differentlevels <strong>of</strong> in-home aide services – Medicaid (in-home) Personal CareServices (PCS) pays for 2 <strong>of</strong> these levels -- the levels that includepersonal care tasks.• Having multiple rates that are tied to the different levels <strong>of</strong> in-homeaide services is one way the department could help to establish acareer ladder for workers in the home care setting.• Development <strong>of</strong> Medicaid PCS rates is based on cost informationsubmitted by providers. If a uniform rate(s) across stateSome Actions North Carolina Could Consider– Continuedadministered public funding streams were pursued, there may be aneed to have uniform cost information submitted by providers acrossthese public funding streams. Cost data submitted would need to bereviewed for accuracy and reasonableness for purposes <strong>of</strong>establishing a reasonable uniform rate(s) that would be paid acrosspublic funding streams for provision <strong>of</strong> in-home aide services.2) Consider requiring that all licensed home care agencies that receive stateadministered funds for in-home aide services or in-home respite services(i.e. SSBG, Home and Community Care Block Grant (HCCBG), etc.) beenrolled to provide Medicaid PCS services and serve some MedicaidPCS clients each year. The Division <strong>of</strong> Aging would need to monitorproviders for compliance with such a requirement.• For SFY 99, <strong>of</strong> the 112 agencies funded to provide level II and IIIin-home aide services through the Home and Community CareBlock Grant (levels that include personal care), 60 <strong>of</strong> the 112were either not currently enrolled to provide Medicaid fundedPCS or were enrolled but did not bill Medicaid for any PCSservices between January and May <strong>of</strong> 1999.• Of the 60 providers that did not bill Medicaid for any PCSservices between January and May 1999:⇒ Half (30) had reimbursement rates equal to or less thanthe current PCS reimbursement rate <strong>of</strong> $12.32.⇒ Half (30) had reimbursement rates higher than $12.32 and <strong>of</strong>The current Medicaidreimbursement rate for PersonalCare Services is $12.32 per hour.SFY 2000 average hourlyreimbursement rates for thetwo levels <strong>of</strong> in-home aideservices that include personalcare for agencies providingthese services through theHome and Community CareBlock Grant are as follows:Level II -- $13.04(includespersonal caretasks that do notrequire a nurseaide)Level III --$13.39(includespersonal caretasks that requirea nurse aide)Note: reimbursement ratesmay or may not reflect totalcost.Requiring HCCBGproviders to provide PCSservices could possibly helpalleviate an unexpected<strong>Appropriateness</strong> <strong>of</strong> <strong>Minimum</strong> <strong>Nurse</strong> <strong>Staffing</strong> <strong>Ratios</strong> in <strong>Nursing</strong> HomesReport to Congress−122
these:- 16 (53%) had reimbursement rates <strong>of</strong> $18 per hour or more- 5 (17%) had reimbursement rates within 60 cents <strong>of</strong> $12.32• The adequacy <strong>of</strong> the reimbursement rate for Medicaid PCS needsto be assessed prior to implementing such a requirement as someproviders have expressed concern about their inability to providethe service for the amount <strong>of</strong> reimbursement paid by Medicaid.This is directly related to aide wages/benefits as some <strong>of</strong> theseproviders indicate they pay aides better from other fundingsources that are not tied to the Medicaid rate for PCS. Forinstance, calls made to several HCCBG providers with rateshigher than the Medicaid PCS rate who were not enrolled inMedicaid as a PCS provider showed that generally, theseagencies were providing benefits such as retirement and healthinsurance (at least partial pay) as well as other group insurance<strong>of</strong>ferings on an employee pay all basis. Some <strong>of</strong> these sameagencies also indicated that they had a fairly stable aideworkforce. Further examination is needed to determine whetheragencies paying higher than average wages for both new hiresand/experienced aides and whether or not there is any correlationbetween higher wages and turnover. Further examination isneeded to determine why HCCBG providers with rates at/belowthe Medicaid PCS rate are either not enrolled as a PCS provideror not billing Medicaid for PCS services.Some Actions North Carolina Could Consider --ContinuedThis step could have multiple benefits including:• expanding the state’s capacity to meet the PCS needs <strong>of</strong> Medicaideligible persons-- particularly the elderly since persons 65+accounted for 71% <strong>of</strong> total PCS spending in SFY 97-98.• increasing the number <strong>of</strong> active PCS providers would beespecially beneficial in areas <strong>of</strong> the state where Medicaid clientscurrently have limited access to PCS services due to a limitednumber <strong>of</strong> providers.- For instance, in SFY 97-98 16 counties had total PCSexpenditures for the elderly <strong>of</strong> $50,000 or less. Based on anaverage per person cost <strong>of</strong> $4,387 for persons 60+ in SFY97-98, $50,000 in PCS expenditures would equate to 11persons served during the year.• increased numbers <strong>of</strong> PCS providers could help address waitinglists for the Community Alternatives Program for DisabledAdults (CAP-DA) – either as a gap filling service until a CAP-DA space is available or perhaps in some cases, provide anadequate and less costly alternative to CAP-DA -- since theoverwhelming majority <strong>of</strong> CAP-DA expenditures are for aideservices.• improving continuity <strong>of</strong> care and consumer satisfaction by<strong>Appropriateness</strong> <strong>of</strong> <strong>Minimum</strong> <strong>Nurse</strong> <strong>Staffing</strong> <strong>Ratios</strong> in <strong>Nursing</strong> HomesReport to Congresssituation that occurred in 42counties during SFY 97-98where more elderly (60+)CAP-DA clients were servedthan elderly personsreceiving PCS services. <strong>In</strong>homeaide is thepredominant serviceprovided to CAP-DA clients.As such, given the high level<strong>of</strong> impairment required forparticipation in CAP-DA(participants must neednursing home level care)and the average annual cost<strong>of</strong> waiver services per CAP-DA participant ($13,561 in97-98), one would certainlyexpect there to be moreelderly persons in need <strong>of</strong>(and receiving) PersonalCare Services in a countythan persons participatingin the highly targeted CAP-DA program. (CAP-DAprovides a package <strong>of</strong> homeand community basedservices for Medicaideligible persons 18+ whootherwise need nursinghome care.)Requiring HCCBGproviders to be enrolled asPCS providers in and <strong>of</strong>itself would not necessarilyresult in agencies servingmore in-home aide clients(including Medicaid PCS).The potential impact <strong>of</strong> thisaction would hinge, in part,on the ability <strong>of</strong> agencies to−123
avoiding having to shift clients from one agency to another basedon the public funding source used to provide care.• reducing the chances <strong>of</strong> inappropriately using non-Medicaid funds(which are capped) to meet the personal care service needs <strong>of</strong>Medicaid eligible clients.3) <strong>In</strong> lieu <strong>of</strong> establishing uniform rates for in-home aide services, considerlimiting the amount <strong>of</strong> indirect costs that can be included in thecalculation <strong>of</strong> reimbursement rates for non-Medicaid funded in-home aideservices. <strong>In</strong> fact, such a requirement may be appropriate for all servicesprovided under these auspices.• this would also help ensure that a minimum percentage <strong>of</strong> theprovider’s reimbursement rate is used for direct care costs.• this would also help to eliminate the possibility <strong>of</strong> some providersbeing paid reimbursement rates that exceed what an informedconsumer would be willing to pay for services on the private market.⇒ Shown below are the number and percentage <strong>of</strong> HCCBG inhomeaide provider contracts (by level) for SFY 2000 withreimbursement rates <strong>of</strong> $18 p/hour or higher. It is interestingto note that level I, the level requiring the lowest skill level(contains no personal care tasks), has the highest percentage <strong>of</strong>contracts exceeding $18 p/hour.Total Contracts Contracts Over $18 p/hr. PercentLevel I 88 14 16%Level II 111 14 13 %Level III 56 8 14%hire and retain enoughqualified aides to operateaide services at fullcapacity. However,given that the Medicaid PCSrate is fairly consistent withthe average reimbursementrate for agencies providingin-home aide servicesthrough the Home andCommunity Care BlockGrant ($12.92) manyproviders could conceivablybenefit positively fromaccessing this revenuestream.As mentioned earlier, theaverage reimbursement ratefor Home and CommunityCare Block Grant providersfor SFY 2000 is $12.92 perhour. There is, however, awide variation inreimbursement rates acrossproviders with contractreimbursement rates forSFY 2000 ranging from alow <strong>of</strong> $6.62 per hour to ahigh <strong>of</strong> $37.11 per hour.<strong>Appropriateness</strong> <strong>of</strong> <strong>Minimum</strong> <strong>Nurse</strong> <strong>Staffing</strong> <strong>Ratios</strong> in <strong>Nursing</strong> HomesReport to Congress−124
AcknowledgementsCalls randomly made to 7home care agencies in alarge urban area todetermine private pay ratesfor nurse aide servicesshowed that rates chargedby these 7 agencies rangedfrom $13 to $16 per hour.Fifteen dollars was the mostprevalent rate with4 <strong>of</strong> the 7 charging this rate.Some agencies noted thatthey required a minimumvisit time <strong>of</strong> 2 hours. Oneagency charged a shiftdifferential <strong>of</strong> $1.00 perhour for night and weekendwork increasing theirprivate pay rate to $16 fornight and weekend work.This paper was developed by:Bonnie Cramer -- Assistant Director, Division <strong>of</strong> Facility ServicesSusan Harmuth -- Health Systems Analyst, Division <strong>of</strong> Facility ServicesEmily Gamble, graduate student intern working in the Division <strong>of</strong> Facility Services through the Duke Long-Term Care Programs’ Leadership in an Aging Society internship programQuestions regarding this document should be directed to Susan Harmuth at 919-733-4130.Notes• Expenditures for aide related services were compiled based on expenditures reported by the Division <strong>of</strong> MedicalAssistance in their annual report for SFY 97-98 including Personal Care Services (in-home and adult carehomes) and nursing home care, ICF-MR, CAP-MR/DD and CAP-DA. CAP-DA calculated at 90% <strong>of</strong> MedicaidCAP-DA expenditures reported for SFY 97-98 which is consistent with the percentage <strong>of</strong> aide service costs forwaiver year 96-97. Aide related expenditures also include in-home aide service expenditures reported by theDivisions <strong>of</strong> Aging and Social Services.• Projected 1999 wages for nurse aides working in nursing homes were obtained from the NC Health CareFacilities Association.• 1998 average aide wages for aides in adult care homes were calculated by Financial Operations staff in theDivision <strong>of</strong> Medical Assistance. Calculations were based on data contained in audited cost reports for 1998submitted to the Department <strong>of</strong> Health and Human Services from adult care homes.• <strong>In</strong>formation about whether aide recruitment and retention is a workforce issue in the state <strong>of</strong> California wasobtained from staff with the Center for Health Pr<strong>of</strong>essions – University <strong>of</strong> California at San Francisco.• <strong>In</strong>formation about whether aide recruitment and retention is a workforce issue in Wisconsin based on efforts by<strong>Appropriateness</strong> <strong>of</strong> <strong>Minimum</strong> <strong>Nurse</strong> <strong>Staffing</strong> <strong>Ratios</strong> in <strong>Nursing</strong> HomesReport to Congress−125
Wisconsin’s Alzheimer’s <strong>In</strong>stitute and University <strong>of</strong> Wisconsin-Madison Medical School to obtain grant fundingto address aide recruitment and retention in the state.• Data regarding providers both billing Medicaid for PCS and providing Home and Community Care Block Grantproviders was determined by cross referencing active PCS providers from Medicaid’s “DRIVE” system withSFY 98-99 Home and Community Care Providers funded for level II and III in-home aide services through theDivision <strong>of</strong> Aging. The report on Medicaid PCS providers was created by staff in the Division <strong>of</strong> FacilityServices using NC Medicaid data.) Note: The Division <strong>of</strong> Medical Assistance has not reviewed the activeprovider report and, therefore, cannot validate the accuracy <strong>of</strong> the information contained in the report.• Average reimbursement rates and the range <strong>of</strong> contracted rates, by in-home aide level, for Home and CommunityCare Block Grant providers were calculated based on contract information for SFY 2000 (ZGA515 – run date:8/31/99) – average rates are not inclusive <strong>of</strong> any cost-sharing revenues collected.• Data regarding counties serving more Medicaid CAP-DA clients than PCS clients is based on county-by-countyexpenditure data for SFY 997-98 for persons 60+ as compiled by the Division <strong>of</strong> Aging.• State by state unemployment and compensation data for 1997 was obtained from the US Bureau <strong>of</strong> LaborStatistics.• Ratio’s <strong>of</strong> PCS expenditures (elderly vs. non-elderly) based on expenditure data reported in the Division <strong>of</strong>Medical Assistance’s annual report for SFY 97-98• The average annual PCS expenditure for persons 60+ is based on expenditure and service data (persons served)provided by the Division <strong>of</strong> Medical Assistance to the Division <strong>of</strong> Aging for SFY 97-98.• Average annual per participant expenditures for CAP-DA for 97-98 based on data reported in the Division <strong>of</strong>Medical Assistance’s annual report on CAP-DA for waiver year 97-98 (published April 30, 1999).The NC Department <strong>of</strong> Health and Human Services does not discriminate on the basis <strong>of</strong> race, color, national origin, sex, religion,age, or disability in employment or the provision <strong>of</strong> services.<strong>Appropriateness</strong> <strong>of</strong> <strong>Minimum</strong> <strong>Nurse</strong> <strong>Staffing</strong> <strong>Ratios</strong> in <strong>Nursing</strong> HomesReport to Congress−126
Appendix A4<strong>Appropriateness</strong> <strong>of</strong> <strong>Minimum</strong> <strong>Nurse</strong> <strong>Staffing</strong> <strong>Ratios</strong> in <strong>Nursing</strong> HomesReport to Congress−127
PROPOSED LEGISLATION IN STUDY STATESNew YorkStandard<strong>Staffing</strong> ratio = number <strong>of</strong> personnel on duty ÷ number <strong>of</strong> residents <strong>of</strong> the nursing home.<strong>Nursing</strong> homes are required to maintain the following ratios:Registered <strong>Nurse</strong>s:1:15 Day Shift1: 25 Evening shift1: 35 Night ShiftLicensed Care Givers: 1: 10 Day Shift1:15 Evening Shift1:20 Night ShiftCNAs:1:5 Day Shift1:8 Evening Shift1:12 Night ShiftPr<strong>of</strong>essionl <strong>Nurse</strong> CoverageA nursing home shall maintain• A full-time DON who is also a RN• A full-time nursing supervisor who is also a RN• A full-time Director <strong>of</strong> <strong>Nurse</strong> and nurse aide education who is alos a RNIf there are greater than 100 beds,• A full-time assistant director <strong>of</strong> nurses who is a RN• A full-time director <strong>of</strong> in-service educationStaff Counted in Standard<strong>In</strong>dividuals employed to provideservices such as food preparations, housekeepingk, laundry ormaintenence shall not be counted in determining the above staffing ratios.OhioStandard<strong>Nursing</strong> homes are required to maintain the following rations:Registered <strong>Nurse</strong>s:1:15 Day Shift1: 25 Evening shift1: 35 Night Shift<strong>Appropriateness</strong> <strong>of</strong> <strong>Minimum</strong> <strong>Nurse</strong> <strong>Staffing</strong> <strong>Ratios</strong> in <strong>Nursing</strong> HomesReport to Congress−128
<strong>Nurse</strong> Aides:1:5 Day Shift<strong>Appropriateness</strong> <strong>of</strong> <strong>Minimum</strong> <strong>Nurse</strong> <strong>Staffing</strong> <strong>Ratios</strong> in <strong>Nursing</strong> HomesReport to Congress−129
1:10 Evening Shift1:15 Night ShiftPr<strong>of</strong>essionl <strong>Nurse</strong> CoverageA nursing home shall maintain• A full-time DON who is also a RN• A full-time nursing supervisor who is also a RN• A full-time Director <strong>of</strong> <strong>Nurse</strong> and nurse aide education who is alos a RN• If there are less than 100 beds, one RN can fulfill the duties <strong>of</strong> assistant director <strong>of</strong>nurses and director <strong>of</strong> nurse and nurse-aide education.• A RN 24 hours per day, 7 days per weekStaff Counted in Standard<strong>In</strong>dividuals employed or contracted to provide services such as food preparations, housekeeping,laundry or maintenance shall not be counted in determining the abouve staffing rations.PostingThe nursing home administrator shall post, in a prominent location withing the nursing home,• the number <strong>of</strong> nurses and nurse aides scheduled to work,• the number <strong>of</strong> nurses and nurse aides who performed work,• the number <strong>of</strong> residents at the facility, and• the staffing rations.Continued StudiesA legislative committee will study the adequacy <strong>of</strong> staffing ratiosTexasStandard<strong>Nursing</strong> homes are required to maintain the following rations:<strong>Nurse</strong> Aide:1:8 Morning Shift1:10 Afternoon Shift1:14 Night Shift<strong>Appropriateness</strong> <strong>of</strong> <strong>Minimum</strong> <strong>Nurse</strong> <strong>Staffing</strong> <strong>Ratios</strong> in <strong>Nursing</strong> HomesReport to Congress−130
APPENDIX B<strong>Staffing</strong> Levels in U.S. <strong>Nursing</strong> Homes: 1996-1999<strong>Appropriateness</strong> <strong>of</strong> <strong>Minimum</strong> <strong>Nurse</strong> <strong>Staffing</strong> <strong>Ratios</strong> in <strong>Nursing</strong> HomesReport to Congress−131
APPENDIX B1: <strong>Staffing</strong> Levels in U.S. <strong>Nursing</strong> Homes: 1996-1999Table B.1a: <strong>Staffing</strong> levels in U.S. <strong>Nursing</strong> Homes:All Facilities, 1996-1999Mean hours per resident day (standard deviation)1996 1997 1998 1999_All facilities (n=14,335) (n=13,598) (n=13,005) (n=7,019)Total hours per resident day,including Directors <strong>of</strong> <strong>Nursing</strong>3.28(1.49)3.36(1.54)3.37(1.51)3.34(1.47)Total hours per resident day,excluding Directors <strong>of</strong> <strong>Nursing</strong>3.18(1.41)3.26(1.47)3.26(1.43)3.24(1.40)RN Director <strong>of</strong> <strong>Nursing</strong> Hours 0.11(0.17)0.11(0.13)0.11(0.15)0.11(0.13)RN hours per resident day 0.48(0.67)0.53(0.73)0.53(0.73)0.53(0.74)LPN hours per resident day 0.71(0.54)0.72(0.54)0.72(0.54)0.72(0.51)<strong>Nurse</strong>s aide hours per resident day 1.99(0.76)2.01(0.75)2.01(0.75)2.01(0.74)_: 1999 data were available only for assessments completed before July 1, 1999Source: OSCAR<strong>Appropriateness</strong> <strong>of</strong> <strong>Minimum</strong> <strong>Nurse</strong> <strong>Staffing</strong> <strong>Ratios</strong> in <strong>Nursing</strong> HomesReport to Congress−132
Table B.1b: <strong>Staffing</strong> levels in U.S. <strong>Nursing</strong> Homes:Freestanding and Hospital-Based Facilities, 1996-1999Mean hours per resident day(standard deviation)1996 1997 1998 1999_Freestanding facilities (n=12,536) (n=11,935) (n=11,295) (n=6,133)Total hours per resident day, includingDirectors <strong>of</strong> <strong>Nursing</strong>2.98(1.05)3.00(1.02)3.03(1.00)3.02(0.98)Total hours per resident day, excludingDirectors <strong>of</strong> <strong>Nursing</strong>2.89(1.02)2.92(0.99)2.95(0.97)2.93(0.95)RN Director <strong>of</strong> nursing hours perresident day0.09(0.16)0.08(0.09)0.08(0.11)0.08(0.08)RN hours per resident day 0.34(0.35)0.35(0.37)0.36(0.36)0.35(0.33)LPN hours per resident day 0.63(0.39)0.63(0.35)0.64(0.35)0.65(0.37)<strong>Nurse</strong>s aide hours per resident day 1.93(0.70)1.94(0.66)1.95(0.66)1.93(0.66)Hospital-based facilities (n=-1,799) (n=1,807) (n=1,710) (n=886)Total hours per resident day, includingDirectors <strong>of</strong> <strong>Nursing</strong>5.38(2.20)5.65(2.25)5.61(2.22)5.59(2.18)Total hours per resident day, excludingDirectors <strong>of</strong> <strong>Nursing</strong>5.13(2.06)5.39(2.11)5.36(2.07)5.33(2.05)RN Director <strong>of</strong> nursing hours perresident day0.25(0.25)0.26(0.24)0.26(0.24)0.26(0.24)RN hours per resident day 1.48(1.25)1.63(1.30)1.68(1.34)1.68(1.35)LPN hours per resident day 1.26(0.96)1.30(1.00)1.22(0.93)1.25(0.98)<strong>Nurse</strong>s aide hours per resident day 2.39(1.01)2.46(1.04)2.45(0.99)2.39(0.96)_: 1999 data were available only for assessments completed before July 1, 1999Source: OSCAR<strong>Appropriateness</strong> <strong>of</strong> <strong>Minimum</strong> <strong>Nurse</strong> <strong>Staffing</strong> <strong>Ratios</strong> in <strong>Nursing</strong> HomesReport to Congress−133
Table B.1c: <strong>Staffing</strong> levels in U.S. <strong>Nursing</strong> Homes:For-Pr<strong>of</strong>it, Non-Pr<strong>of</strong>it and Government Facilities, 1996-1999Mean hours per resident day (standard deviation)1996 1997 1998 1999_For-pr<strong>of</strong>it facilities (n=9,411) (n=8,847) (n=8,413) (n=4,572)Total hours per resident day, includingDirectors <strong>of</strong> <strong>Nursing</strong>2.98(1.23)3.03(1.24)3.03(1.17)3.00(1.13)Total hours per resident day, excludingDirectors <strong>of</strong> <strong>Nursing</strong>2.89(1.17)2.93(1.18)2.93(1.11)2.91(1.08)RN Director <strong>of</strong> <strong>Nursing</strong> hours perresident day0.10(0.18)0.09(0.12)0.09(0.15)0.09(0.10)RN hours per resident day 0.37(0.50)0.39(0.52)0.39(0.50)0.37(0.47)LPN hours per resident day 0.66(0.46)0.66(0.45)0.67(0.43)0.67(0.43)<strong>Nurse</strong>s aide hours per resident day 1.86(0.68)1.88(0.66)1.88(0.65)1.87(0.64)Non-pr<strong>of</strong>it facilities (n=3,956) (n=3,844) (n=3,720) (n=1,975)Total hours per resident day, includingDirectors <strong>of</strong> <strong>Nursing</strong>3.84(1.77)3.98(1.85)4.01(1.86)3.98(1.78)Total hours per resident day, excludingDirectors <strong>of</strong> <strong>Nursing</strong>3.72(1.67)3.84(1.75)3.88(1.75)3.84(1.68)RN Director <strong>of</strong> <strong>Nursing</strong> hours perresident day0.13(0.17)0.13(0.16)0.12(0.16)0.13(0.16)RN hours per resident day 0.73(0.89)0.80(0.97)0.84(1.03)0.83(1.00)LPN hours per resident day 0.78(0.63)0.80(0.66)0.81(0.63)0.81(0.64)<strong>Nurse</strong>s aide hours per resident day 2.21(0.85)2.23(0.82)2.23(0.82)2.20(0.78)Government facilities (n=968) (n=919) (n=883) (n=472)Total hours per resident day, includingDirectors <strong>of</strong> <strong>Nursing</strong>3.82(1.69)3.95(1.81)3.90(1.71)3.97(1.81)Total hours per resident day, excluding 3.70 3.83 3.78 3.85<strong>Appropriateness</strong> <strong>of</strong> <strong>Minimum</strong> <strong>Nurse</strong> <strong>Staffing</strong> <strong>Ratios</strong> in <strong>Nursing</strong> HomesReport to Congress−134
Table B.1c: <strong>Staffing</strong> levels in U.S. <strong>Nursing</strong> Homes:For-Pr<strong>of</strong>it, Non-Pr<strong>of</strong>it and Government Facilities, 1996-1999Mean hours per resident day (standard deviation)1996 1997 1998 1999_Directors <strong>of</strong> <strong>Nursing</strong> (1.61) (1.72) (1.61) (1.71)RN Director <strong>of</strong> <strong>Nursing</strong> hours perresident day0.11(0.14)0.12(0.15)0.12(0.16)0.12(0.15)RN hours per resident day 0.58(0.77)0.65(0.88)0.63(0.81)0.66(0.87)LPN hours per resident day 0.84(0.74)0.87(0.73)0.80(0.61)0.87(0.78)<strong>Nurse</strong>s aide hours per resident day 2.28(0.82)2.31(0.90)2.35(0.82)2.31(0.89)_: 1999 data were available only for assessments completed before July 1, 1999Source: OSCAR<strong>Appropriateness</strong> <strong>of</strong> <strong>Minimum</strong> <strong>Nurse</strong> <strong>Staffing</strong> <strong>Ratios</strong> in <strong>Nursing</strong> HomesReport to Congress−135
Table B.1d: <strong>Staffing</strong> levels in U.S. <strong>Nursing</strong> Homes:By Proportion <strong>of</strong> Medicare residents at facility, 1996-1999Mean hours per resident day (standard deviation)1996 1997 1998 1999_Less than 5 percent Medicareresidents(n=6,262) (n=5,446) (n=5,151) (n=2,922)Total hours per resident day, includingDirectors <strong>of</strong> <strong>Nursing</strong>2.91(1.07)2.93(1.02)2.95(1.04)2.96(1.05)Total hours per resident day, excludingDirectors <strong>of</strong> <strong>Nursing</strong>2.81(1.03)2.83(0.99)2.85(1.00)2.86(1.01)RN Director <strong>of</strong> <strong>Nursing</strong> hours perresident day0.10(0.11)0.10(0.11)0.10(0.11)0.10(0.10)RN hours per resident day 0.30(0.34)0.31(0.34)0.32(0.36)0.31(0.33)LPN hours per resident day 0.61(0.41)0.60(0.37)0.61(0.37)0.64(0.40)<strong>Nurse</strong>s aide hours per resident day 1.90(0.71)1.91(0.69)1.92(0.69)1.91(0.70)6-10 percent Medicare residents (n=3,545) (n=3,516) (n=3,540) (n=1,901)Total hours per resident day, includingDirectors <strong>of</strong> <strong>Nursing</strong>2.95(0.77)2.97(0.75)3.00(0.78)3.01(0.74)Total hours per resident day, excludingDirectors <strong>of</strong> <strong>Nursing</strong>2.88(0.77)2.91(0.74)2.93(0.76)2.94(0.73)RN Director <strong>of</strong> <strong>Nursing</strong> hours perresident day0.07(0.05)0.07(0.04)0.07(0.14)0.07(0.05)RN hours per resident day 0.34(0.25)0.34(0.25)0.34(0.25)0.34(0.25)LPN hours per resident day 0.62(0.33)0.63(0.29)0.64(0.32)0.65(0.31)<strong>Nurse</strong>s aide hours per resident day 1.93(0.57)1.94(0.55)1.95(0.57)1.94(0.55)11-15 percent Medicare residents (n=2,013) (n=2,011) (n=1,871) (n=984)Total hours per resident day, includingDirectors <strong>of</strong> <strong>Nursing</strong>3.05(0.89)3.06(0.84)3.07(0.80)3.10(0.85)<strong>Appropriateness</strong> <strong>of</strong> <strong>Minimum</strong> <strong>Nurse</strong> <strong>Staffing</strong> <strong>Ratios</strong> in <strong>Nursing</strong> HomesReport to Congress−136
Table B.1d: <strong>Staffing</strong> levels in U.S. <strong>Nursing</strong> Homes:By Proportion <strong>of</strong> Medicare residents at facility, 1996-1999Mean hours per resident day (standard deviation)Total hours per resident day, excludingDirectors <strong>of</strong> <strong>Nursing</strong>1996 1997 1998 1999_2.97(0.85)2.99(0.83)3.00(0.78)3.03(0.84)RN Director <strong>of</strong> <strong>Nursing</strong> hours perresident day0.07(0.26)0.07(0.06)0.07(0.11)0.07(0.05)RN hours per resident day 0.37(0.29)0.37(0.31)0.37(0.28)0.38(0.26)LPN hours per resident day 0.66(0.35)0.66(0.33)0.66(0.32)0.67(0.32)<strong>Nurse</strong>s aide hours per resident day 1.95(0.61)1.96(0.56)1.97(0.57)1.98(0.59)More than 15 percent Medicareresidents(n=2,515) (n=2,625) (n=2,443) (n=1,212)Total hours per resident day, includingDirectors <strong>of</strong> <strong>Nursing</strong>4.87(2.28)5.01(2.34)5.01(2.28)4.98(2.28)Total hours per resident day, excludingDirectors <strong>of</strong> <strong>Nursing</strong>4.67(2.14)4.81(2.20)4.81(2.13)4.78(2.14)RN Director <strong>of</strong> <strong>Nursing</strong> hours perresident day0.20(0.26)0.20(0.23)0.20(0.23)0.20(0.22)RN hours per resident day 1.24(1.18)1.34(1.24)1.37(1.28)1.40(1.29)LPN hours per resident day 1.11(0.88)1.12(0.92)1.09(0.85)1.10(0.92)<strong>Nurse</strong>s aide hours per resident day 2.31(1.06)2.35(1.06)2.35(1.00)2.28(0.97)_: 1999 data were available only for assessments completed before July 1, 1999Source: OSCAR<strong>Appropriateness</strong> <strong>of</strong> <strong>Minimum</strong> <strong>Nurse</strong> <strong>Staffing</strong> <strong>Ratios</strong> in <strong>Nursing</strong> HomesReport to Congress−137
APPENDIX B2: Distribution <strong>of</strong> <strong>Staffing</strong> by State, 1996-1999Table B2.a: <strong>Staffing</strong> levels in U.S. <strong>Nursing</strong> Homes: By State, 1996-1999StateMean hours per resident day1996 1997 1998 1999_RN LPN <strong>Nurse</strong> aide RN LPN <strong>Nurse</strong> aide RN LPN <strong>Nurse</strong> aide RN LPN <strong>Nurse</strong> aideAK 1.11 0.66 3.19 1.45 0.62 3.42 1.15 0.54 3.23 0.98 0.67 3.09AL 0.26 0.93 2.36 0.26 0.93 2.37 0.26 0.99 2.47 0.25 0.97 2.37AR 0.25 0.80 1.72 0.33 0.83 1.86 0.31 0.83 1.97 0.35 0.89 1.94AZ 0.68 0.77 2.07 0.84 0.85 2.01 0.78 0.80 2.16 0.56 0.72 1.97CA 0.58 0.74 2.20 0.62 0.73 2.22 0.58 0.73 2.21 0.55 0.72 2.14CO 0.74 0.70 1.83 0.74 0.76 1.90 0.64 0.70 1.96 0.60 0.69 1.93CT 0.53 0.47 2.00 0.53 0.48 2.10 0.57 0.50 2.09 0.52 0.52 2.11DE 0.71 0.67 2.35 0.77 0.68 2.37 1.03 0.65 2.73 0.75 0.66 2.47FL 0.58 0.88 2.14 0.65 0.87 2.12 0.64 0.88 2.06 0.59 0.84 2.06GA 0.21 0.82 2.00 0.21 0.82 2.06 0.24 0.84 2.01 0.24 0.85 1.97HI 0.83 0.67 2.43 0.90 0.63 2.61 0.88 0.55 2.68 0.78 0.82 2.24IA 0.49 0.48 1.70 0.47 0.49 1.69 0.52 0.51 1.66 0.53 0.55 1.66ID 0.62 0.81 2.54 0.72 0.96 2.59 0.65 0.75 2.65 0.57 0.86 2.84IL 0.57 0.53 1.76 0.62 0.53 1.78 0.65 0.54 1.83 0.67 0.54 1.88IN 0.41 0.84 1.55 0.45 0.85 1.53 0.46 0.87 1.54 0.49 0.87 1.58KS 0.40 0.54 1.62 0.44 0.57 1.61 0.48 0.57 1.59 0.50 0.53 1.66KY 0.49 0.96 2.05 0.58 0.98 2.16 0.56 0.92 2.11 0.58 0.96 2.06LA 0.34 0.87 1.87 0.39 0.91 1.91 0.34 0.85 1.96 0.37 0.94 1.83MA 0.62 0.59 2.24 0.69 0.56 2.21 0.74 0.58 2.24 0.70 0.58 2.18MD 0.51 0.60 1.96 0.57 0.64 1.99 0.62 0.63 2.08 0.73 0.60 2.10ME 0.53 0.47 2.62 0.65 0.47 2.60 0.71 0.49 2.68 0.57 0.48 2.65<strong>Appropriateness</strong> <strong>of</strong> <strong>Minimum</strong> <strong>Nurse</strong> <strong>Staffing</strong> <strong>Ratios</strong> in <strong>Nursing</strong> HomesReport to Congress−138
Table B2.a: <strong>Staffing</strong> levels in U.S. <strong>Nursing</strong> Homes: By State, 1996-1999StateMean hours per resident day1996 1997 1998 1999_RN LPN <strong>Nurse</strong> aide RN LPN <strong>Nurse</strong> aide RN LPN <strong>Nurse</strong> aide RN LPN <strong>Nurse</strong> aideMI 0.35 0.60 2.25 0.43 0.61 2.29 0.42 0.61 2.29 0.43 0.67 2.22MN 0.35 0.67 1.83 0.36 0.66 1.84 0.37 0.66 1.80 0.33 0.68 1.81MO 0.46 0.80 1.81 0.50 0.77 1.78 0.49 0.76 1.76 0.49 0.76 1.84MS 0.42 0.88 2.00 0.55 0.95 2.02 0.51 0.91 2.03 0.45 0.84 1.99MT 0.60 0.56 2.35 0.61 0.60 2.26 0.63 0.59 2.35 0.66 0.53 2.21NC 0.48 0.74 2.24 0.53 0.76 2.35 0.55 0.83 2.32 0.52 0.81 2.25ND 0.43 0.63 2.18 0.43 0.64 2.21 0.38 0.58 2.25 0.54 0.70 2.28NE 0.42 0.67 1.74 0.47 0.68 1.79 0.51 0.66 1.81 0.56 0.72 1.76NH 0.60 0.50 2.39 0.62 0.56 2.43 0.65 0.55 2.53 0.70 0.57 2.56NJ 0.55 0.56 2.05 0.56 0.55 2.08 0.62 0.57 2.08 0.66 0.66 2.05NM 0.59 0.59 2.09 0.76 0.56 2.08 0.59 0.55 2.09 0.46 0.53 2.05NV 1.01 0.91 1.98 1.04 0.75 1.91 1.14 0.74 1.94 1.67 0.55 2.52NY 0.38 0.64 1.99 0.36 0.65 1.99 0.37 0.66 2.03 0.38 0.66 2.02OH 0.52 0.81 2.10 0.57 0.82 2.09 0.55 0.80 2.05 0.58 0.85 2.09OK 0.22 0.64 1.45 0.28 0.78 1.59 0.30 0.75 1.57 0.21 0.73 1.53OR 0.55 0.40 2.24 0.55 0.42 2.18 0.57 0.42 2.11 0.54 0.42 2.11PA 0.67 0.71 2.05 0.75 0.75 2.07 0.80 0.78 2.11 0.75 0.76 2.08RI 0.51 0.35 2.01 0.60 0.31 2.09 0.65 0.32 2.06 0.73 0.31 2.07SC 0.41 0.89 2.26 0.46 0.88 2.31 0.50 0.92 2.25 0.59 0.84 2.23SD 0.48 0.31 1.86 0.49 0.34 1.89 0.53 0.34 1.90 0.49 0.32 1.85TN 0.33 0.80 1.80 0.34 0.79 1.89 0.44 0.87 1.90 0.37 0.85 1.84TX 0.43 0.87 1.83 0.45 0.90 1.86 0.40 0.88 1.83 0.34 0.89 1.78<strong>Appropriateness</strong> <strong>of</strong> <strong>Minimum</strong> <strong>Nurse</strong> <strong>Staffing</strong> <strong>Ratios</strong> in <strong>Nursing</strong> HomesReport to Congress−139
Table B2.a: <strong>Staffing</strong> levels in U.S. <strong>Nursing</strong> Homes: By State, 1996-1999StateMean hours per resident day1996 1997 1998 1999_RN LPN <strong>Nurse</strong> aide RN LPN <strong>Nurse</strong> aide RN LPN <strong>Nurse</strong> aide RN LPN <strong>Nurse</strong> aideUT 0.70 0.64 1.87 0.73 0.59 1.96 0.76 0.69 2.01 1.06 0.79 1.98VA 0.40 0.81 1.99 0.41 0.84 2.06 0.41 0.91 2.07 0.43 0.94 2.04VT 0.38 0.72 2.20 0.49 0.66 2.17 0.38 0.75 2.21 0.41 0.70 2.23WA 0.66 0.60 2.30 0.77 0.59 2.44 0.72 0.58 2.45 0.73 0.62 2.38WI 0.52 0.43 2.07 0.60 0.44 2.14 0.60 0.44 2.10 0.53 0.44 2.02WV 0.34 0.91 2.12 0.51 1.01 2.17 0.43 0.72 2.20 0.43 0.86 2.12WY 0.82 0.68 2.03 0.64 0.65 1.96 0.70 0.56 2.02 0.66 0.58 2.00_: 1999 data were available only for assessments completed before July 1, 1999Note: Sample sizes can be found in Table 3.7Source: OSCARAPPENDIX B.3: Cumulative distribution <strong>of</strong> <strong>Staffing</strong>Appendix B.3a: <strong>Staffing</strong> levels in U.S. <strong>Nursing</strong> Homes:Distribution <strong>of</strong> Total hours per resident day: All Facilities, 1998Total hours perresident dayNumber <strong>of</strong>facilitiesPercentage <strong>of</strong>facilitiesCumulative percentage0.5 2 0 00.55 5 0 0.10.6 3 0 0.1<strong>Appropriateness</strong> <strong>of</strong> <strong>Minimum</strong> <strong>Nurse</strong> <strong>Staffing</strong> <strong>Ratios</strong> in <strong>Nursing</strong> HomesReport to Congress−140
Appendix B.3a: <strong>Staffing</strong> levels in U.S. <strong>Nursing</strong> Homes:Distribution <strong>of</strong> Total hours per resident day: All Facilities, 1998Total hours perresident dayNumber <strong>of</strong>facilitiesPercentage <strong>of</strong>facilitiesCumulative percentage0.65 8 0.1 0.10.7 6 0 0.20.75 6 0 0.20.8 9 0.1 0.30.85 9 0.1 0.40.9 8 0.1 0.40.95 8 0.1 0.51 6 0 0.51.05 17 0.1 0.71.1 17 0.1 0.81.15 8 0.1 0.91.2 18 0.1 11.25 14 0.1 1.11.3 27 0.2 1.31.35 30 0.2 1.51.4 38 0.3 1.81.45 34 0.3 2.11.5 32 0.2 2.31.55 33 0.3 2.61.6 35 0.3 2.9<strong>Appropriateness</strong> <strong>of</strong> <strong>Minimum</strong> <strong>Nurse</strong> <strong>Staffing</strong> <strong>Ratios</strong> in <strong>Nursing</strong> HomesReport to Congress−141
Appendix B.3a: <strong>Staffing</strong> levels in U.S. <strong>Nursing</strong> Homes:Distribution <strong>of</strong> Total hours per resident day: All Facilities, 1998Total hours perresident dayNumber <strong>of</strong>facilitiesPercentage <strong>of</strong>facilitiesCumulative percentage1.65 58 0.4 3.31.7 48 0.4 3.71.75 61 0.5 4.21.8 99 0.8 4.91.85 94 0.7 5.61.9 110 0.8 6.51.95 101 0.8 7.32 136 1 8.32.05 161 1.2 9.52.1 165 1.3 10.82.15 178 1.4 12.22.2 192 1.5 13.72.25 217 1.7 15.32.3 232 1.8 17.12.35 272 2.1 19.22.4 272 2.1 21.32.45 328 2.5 23.82.5 309 2.4 26.22.55 356 2.7 28.92.6 339 2.6 31.5<strong>Appropriateness</strong> <strong>of</strong> <strong>Minimum</strong> <strong>Nurse</strong> <strong>Staffing</strong> <strong>Ratios</strong> in <strong>Nursing</strong> HomesReport to Congress−142
Appendix B.3a: <strong>Staffing</strong> levels in U.S. <strong>Nursing</strong> Homes:Distribution <strong>of</strong> Total hours per resident day: All Facilities, 1998Total hours perresident dayNumber <strong>of</strong>facilitiesPercentage <strong>of</strong>facilitiesCumulative percentage2.65 368 2.8 34.42.7 386 3 37.32.75 397 3.1 40.42.8 448 3.4 43.82.85 408 3.1 472.9 409 3.1 50.12.95 368 2.8 52.93 373 2.9 55.83.05 341 2.6 58.43.1 341 2.6 61.13.15 326 2.5 63.63.2 278 2.1 65.73.25 261 2 67.73.3 248 1.9 69.63.35 240 1.8 71.53.4 221 1.7 73.23.45 188 1.4 74.63.5 196 1.5 76.13.55 184 1.4 77.53.6 152 1.2 78.7<strong>Appropriateness</strong> <strong>of</strong> <strong>Minimum</strong> <strong>Nurse</strong> <strong>Staffing</strong> <strong>Ratios</strong> in <strong>Nursing</strong> HomesReport to Congress−143
Appendix B.3a: <strong>Staffing</strong> levels in U.S. <strong>Nursing</strong> Homes:Distribution <strong>of</strong> Total hours per resident day: All Facilities, 1998Total hours perresident dayNumber <strong>of</strong>facilitiesPercentage <strong>of</strong>facilitiesCumulative percentage3.65 125 1 79.73.7 112 0.9 80.53.75 123 0.9 81.53.8 113 0.9 82.33.85 94 0.7 83.13.9 82 0.6 83.73.95 76 0.6 84.34 78 0.6 84.94.05 66 0.5 85.44.1 61 0.5 85.84.15 58 0.4 86.34.2 48 0.4 86.74.25 47 0.4 874.3 32 0.2 87.34.35 42 0.3 87.64.4 56 0.4 884.45 26 0.2 88.24.5 31 0.2 88.54.55 44 0.3 88.84.6 33 0.3 89.1<strong>Appropriateness</strong> <strong>of</strong> <strong>Minimum</strong> <strong>Nurse</strong> <strong>Staffing</strong> <strong>Ratios</strong> in <strong>Nursing</strong> HomesReport to Congress−144
Appendix B.3a: <strong>Staffing</strong> levels in U.S. <strong>Nursing</strong> Homes:Distribution <strong>of</strong> Total hours per resident day: All Facilities, 1998Total hours perresident dayNumber <strong>of</strong>facilitiesPercentage <strong>of</strong>facilitiesCumulative percentage4.65 28 0.2 89.34.7 27 0.2 89.54.75 26 0.2 89.74.8 29 0.2 89.94.85 39 0.3 90.24.9 32 0.2 90.44.95 22 0.2 90.65 26 0.2 90.85.05 13 0.1 90.95.1 14 0.1 915.15 28 0.2 91.25.2 18 0.1 91.45.25 27 0.2 91.65.3 20 0.2 91.75.35 24 0.2 91.95.4 20 0.2 92.15.45 21 0.2 92.25.5 14 0.1 92.35.55 26 0.2 92.55.6 22 0.2 92.7<strong>Appropriateness</strong> <strong>of</strong> <strong>Minimum</strong> <strong>Nurse</strong> <strong>Staffing</strong> <strong>Ratios</strong> in <strong>Nursing</strong> HomesReport to Congress−145
Appendix B.3a: <strong>Staffing</strong> levels in U.S. <strong>Nursing</strong> Homes:Distribution <strong>of</strong> Total hours per resident day: All Facilities, 1998Total hours perresident dayNumber <strong>of</strong>facilitiesPercentage <strong>of</strong>facilitiesCumulative percentage5.65 20 0.2 92.95.7 28 0.2 93.15.75 18 0.1 93.25.8 15 0.1 93.35.85 28 0.2 93.55.9 20 0.2 93.75.95 17 0.1 93.86 19 0.1 946.05 20 0.2 94.16.1 19 0.1 94.36.15 16 0.1 94.46.2 16 0.1 94.56.25 14 0.1 94.66.3 20 0.2 94.86.35 18 0.1 94.96.4 16 0.1 956.45 15 0.1 95.26.5 20 0.2 95.36.55 13 0.1 95.46.6 12 0.1 95.5<strong>Appropriateness</strong> <strong>of</strong> <strong>Minimum</strong> <strong>Nurse</strong> <strong>Staffing</strong> <strong>Ratios</strong> in <strong>Nursing</strong> HomesReport to Congress−146
Appendix B.3a: <strong>Staffing</strong> levels in U.S. <strong>Nursing</strong> Homes:Distribution <strong>of</strong> Total hours per resident day: All Facilities, 1998Total hours perresident dayNumber <strong>of</strong>facilitiesPercentage <strong>of</strong>facilitiesCumulative percentage6.65 18 0.1 95.66.7 16 0.1 95.86.75 15 0.1 95.96.8 11 0.1 966.85 7 0.1 966.9 13 0.1 96.16.95 13 0.1 96.27 14 0.1 96.37.05 15 0.1 96.47.1 10 0.1 96.57.15 17 0.1 96.77.2 9 0.1 96.77.25 13 0.1 96.87.3 14 0.1 96.97.35 8 0.1 977.4 10 0.1 97.17.45 11 0.1 97.27.5 15 0.1 97.37.55 7 0.1 97.37.6 9 0.1 97.4<strong>Appropriateness</strong> <strong>of</strong> <strong>Minimum</strong> <strong>Nurse</strong> <strong>Staffing</strong> <strong>Ratios</strong> in <strong>Nursing</strong> HomesReport to Congress−147
Appendix B.3a: <strong>Staffing</strong> levels in U.S. <strong>Nursing</strong> Homes:Distribution <strong>of</strong> Total hours per resident day: All Facilities, 1998Total hours perresident dayNumber <strong>of</strong>facilitiesPercentage <strong>of</strong>facilitiesCumulative percentage7.65 11 0.1 97.57.7 13 0.1 97.67.75 3 0 97.67.8 8 0.1 97.77.85 8 0.1 97.77.9 10 0.1 97.87.95 8 0.1 97.98 16 0.1 988.05 9 0.1 98.18.1 6 0 98.18.15 7 0.1 98.28.2 9 0.1 98.28.25 9 0.1 98.38.3 6 0 98.38.35 1 0 98.38.4 8 0.1 98.48.45 3 0 98.48.5 7 0.1 98.58.55 7 0.1 98.58.6 8 0.1 98.6<strong>Appropriateness</strong> <strong>of</strong> <strong>Minimum</strong> <strong>Nurse</strong> <strong>Staffing</strong> <strong>Ratios</strong> in <strong>Nursing</strong> HomesReport to Congress−148
Appendix B.3a: <strong>Staffing</strong> levels in U.S. <strong>Nursing</strong> Homes:Distribution <strong>of</strong> Total hours per resident day: All Facilities, 1998Total hours perresident dayNumber <strong>of</strong>facilitiesPercentage <strong>of</strong>facilitiesCumulative percentage8.65 2 0 98.68.7 5 0 98.78.75 2 0 98.78.8 8 0.1 98.78.85 7 0.1 98.88.9 5 0 98.88.95 9 0.1 98.99 7 0.1 98.99.05 6 0 999.1 1 0 999.15 3 0 999.2 3 0 999.25 8 0.1 99.19.3 4 0 99.19.35 5 0 99.29.4 4 0 99.29.45 1 0 99.29.5 5 0 99.39.55 2 0 99.39.6 6 0 99.3<strong>Appropriateness</strong> <strong>of</strong> <strong>Minimum</strong> <strong>Nurse</strong> <strong>Staffing</strong> <strong>Ratios</strong> in <strong>Nursing</strong> HomesReport to Congress−149
Appendix B.3a: <strong>Staffing</strong> levels in U.S. <strong>Nursing</strong> Homes:Distribution <strong>of</strong> Total hours per resident day: All Facilities, 1998Total hours perresident dayNumber <strong>of</strong>facilitiesPercentage <strong>of</strong>facilitiesCumulative percentage9.7 6 0 99.49.75 1 0 99.49.8 2 0 99.49.85 2 0 99.49.9 3 0 99.49.95 6 0 99.510 4 0 99.510.05 2 0 99.510.1 5 0 99.610.15 2 0 99.610.2 1 0 99.610.25 2 0 99.610.35 1 0 99.610.45 1 0 99.610.5 4 0 99.610.55 1 0 99.610.6 1 0 99.710.65 8 0.1 99.710.7 6 0 99.810.75 4 0 99.8<strong>Appropriateness</strong> <strong>of</strong> <strong>Minimum</strong> <strong>Nurse</strong> <strong>Staffing</strong> <strong>Ratios</strong> in <strong>Nursing</strong> HomesReport to Congress−150
Appendix B.3a: <strong>Staffing</strong> levels in U.S. <strong>Nursing</strong> Homes:Distribution <strong>of</strong> Total hours per resident day: All Facilities, 1998Total hours perresident dayNumber <strong>of</strong>facilitiesPercentage <strong>of</strong>facilitiesCumulative percentage10.8 5 0 99.810.9 1 0 99.810.95 2 0 99.911 3 0 99.911.05 1 0 99.911.1 4 0 99.911.15 1 0 99.911.2 2 0 99.911.25 4 0 10011.3 1 0 10011.35 1 0 10011.45 1 0 10011.55 1 0 100Source: OSCAR<strong>Appropriateness</strong> <strong>of</strong> <strong>Minimum</strong> <strong>Nurse</strong> <strong>Staffing</strong> <strong>Ratios</strong> in <strong>Nursing</strong> HomesReport to Congress−151
Appendix B.3b: <strong>Staffing</strong> levels in U.S. <strong>Nursing</strong> Homes:Distribution <strong>of</strong> RN hours per resident day: All facilities, 1998RN hours perresident dayNumber <strong>of</strong>facilitiesPercentage <strong>of</strong>facilitiesCumulativepercentage0 311 2.4 2.40.05 1007 7.7 10.10.1 956 7.4 17.50.15 1129 8.7 26.20.2 1108 8.5 34.70.25 1101 8.5 43.20.3 1001 7.7 50.80.35 911 7 57.90.4 807 6.2 64.10.45 656 5 69.10.5 580 4.5 73.60.55 502 3.9 77.40.6 368 2.8 80.30.65 327 2.5 82.80.7 242 1.9 84.60.75 191 1.5 86.10.8 124 1 87.10.85 116 0.9 87.90.9 92 0.7 88.70.95 74 0.6 89.21 63 0.5 89.71.05 47 0.4 90.11.1 48 0.4 90.41.15 48 0.4 90.81.2 39 0.3 91.11.25 34 0.3 91.41.3 29 0.2 91.61.35 34 0.3 91.81.4 26 0.2 921.45 21 0.2 92.2<strong>Appropriateness</strong> <strong>of</strong> <strong>Minimum</strong> <strong>Nurse</strong> <strong>Staffing</strong> <strong>Ratios</strong> in <strong>Nursing</strong> HomesReport to Congress−152
Appendix B.3b: <strong>Staffing</strong> levels in U.S. <strong>Nursing</strong> Homes:Distribution <strong>of</strong> RN hours per resident day: All facilities, 1998RN hours perresident dayNumber <strong>of</strong>facilitiesPercentage <strong>of</strong>facilitiesCumulativepercentage1.5 30 0.2 92.41.55 21 0.2 92.61.6 31 0.2 92.81.65 27 0.2 931.7 32 0.2 93.31.75 19 0.1 93.41.8 28 0.2 93.71.85 24 0.2 93.81.9 26 0.2 941.95 19 0.1 94.22 20 0.2 94.32.05 29 0.2 94.62.1 21 0.2 94.72.15 18 0.1 94.92.2 19 0.1 952.25 18 0.1 95.12.3 33 0.3 95.42.35 24 0.2 95.62.4 32 0.2 95.82.45 29 0.2 96.12.5 20 0.2 96.22.55 19 0.1 96.42.6 15 0.1 96.52.65 31 0.2 96.72.7 20 0.2 96.92.75 11 0.1 96.92.8 15 0.1 97.12.85 21 0.2 97.22.9 15 0.1 97.32.95 17 0.1 97.53 18 0.1 97.6<strong>Appropriateness</strong> <strong>of</strong> <strong>Minimum</strong> <strong>Nurse</strong> <strong>Staffing</strong> <strong>Ratios</strong> in <strong>Nursing</strong> HomesReport to Congress−153
Appendix B.3b: <strong>Staffing</strong> levels in U.S. <strong>Nursing</strong> Homes:Distribution <strong>of</strong> RN hours per resident day: All facilities, 1998RN hours perresident dayNumber <strong>of</strong>facilitiesPercentage <strong>of</strong>facilitiesCumulativepercentage3.05 7 0.1 97.73.1 16 0.1 97.83.15 20 0.2 97.93.2 18 0.1 98.13.25 11 0.1 98.23.3 11 0.1 98.23.35 11 0.1 98.33.4 5 0 98.43.45 17 0.1 98.53.5 9 0.1 98.63.55 10 0.1 98.63.6 9 0.1 98.73.65 6 0 98.83.7 10 0.1 98.83.75 10 0.1 98.93.8 5 0 993.85 7 0.1 993.9 7 0.1 99.13.95 10 0.1 99.14 11 0.1 99.24.05 6 0 99.34.1 4 0 99.34.15 4 0 99.34.2 4 0 99.44.25 7 0.1 99.44.3 8 0.1 99.54.4 5 0 99.54.45 1 0 99.54.5 4 0 99.64.55 1 0 99.6<strong>Appropriateness</strong> <strong>of</strong> <strong>Minimum</strong> <strong>Nurse</strong> <strong>Staffing</strong> <strong>Ratios</strong> in <strong>Nursing</strong> HomesReport to Congress−154
Appendix B.3b: <strong>Staffing</strong> levels in U.S. <strong>Nursing</strong> Homes:Distribution <strong>of</strong> RN hours per resident day: All facilities, 1998RN hours perresident dayNumber <strong>of</strong>facilitiesPercentage <strong>of</strong>facilitiesCumulativepercentage4.65 4 0 99.64.7 4 0 99.64.75 3 0 99.64.8 9 0.1 99.74.9 3 0 99.75 2 0 99.85.05 3 0 99.85.1 2 0 99.85.2 1 0 99.85.3 2 0 99.85.35 4 0 99.85.4 2 0 99.95.45 1 0 99.95.5 1 0 99.95.55 1 0 99.95.6 1 0 99.95.65 1 0 99.95.7 1 0 99.95.75 1 0 99.95.85 1 0 99.95.95 2 0 99.96.05 1 0 99.96.35 1 0 1006.45 1 0 1006.8 1 0 1007.85 1 0 1008 1 0 1008.4 1 0 1009.05 1 0 100Source: OSCAR<strong>Appropriateness</strong> <strong>of</strong> <strong>Minimum</strong> <strong>Nurse</strong> <strong>Staffing</strong> <strong>Ratios</strong> in <strong>Nursing</strong> HomesReport to Congress−155
Appendix B.3c: <strong>Staffing</strong> levels in U.S. <strong>Nursing</strong> Homes:Distribution <strong>of</strong> RN+LPN hours per resident day: All Facilities, 1998RN+LPN hours perresident dayNumber <strong>of</strong>facilitiesPercentage <strong>of</strong>facilitiesCumulativepercentage0 1 0 00.05 1 0 00.1 3 0 00.15 5 0 0.10.2 8 0.1 0.10.25 11 0.1 0.20.3 28 0.2 0.40.35 47 0.4 0.80.4 82 0.6 1.40.45 139 1.1 2.50.5 214 1.6 4.10.55 317 2.4 6.60.6 465 3.6 10.20.65 554 4.3 14.40.7 733 5.6 20.10.75 794 6.1 26.20.8 908 7 33.10.85 918 7.1 40.20.9 878 6.8 470.95 844 6.5 53.41 788 6.1 59.51.05 653 5 64.51.1 605 4.7 69.21.15 460 3.5 72.71.2 403 3.1 75.81.25 315 2.4 78.21.3 259 2 80.21.35 210 1.6 81.81.4 174 1.3 83.21.45 137 1.1 84.2<strong>Appropriateness</strong> <strong>of</strong> <strong>Minimum</strong> <strong>Nurse</strong> <strong>Staffing</strong> <strong>Ratios</strong> in <strong>Nursing</strong> HomesReport to Congress−156
Appendix B.3c: <strong>Staffing</strong> levels in U.S. <strong>Nursing</strong> Homes:Distribution <strong>of</strong> RN+LPN hours per resident day: All Facilities, 1998RN+LPN hours perresident dayNumber <strong>of</strong>facilitiesPercentage <strong>of</strong>facilitiesCumulativepercentage1.5 105 0.8 851.55 91 0.7 85.71.6 84 0.6 86.41.65 59 0.5 86.81.7 63 0.5 87.31.75 58 0.4 87.81.8 50 0.4 88.21.85 38 0.3 88.41.9 39 0.3 88.71.95 39 0.3 892 33 0.3 89.32.05 28 0.2 89.52.1 18 0.1 89.72.15 26 0.2 89.92.2 32 0.2 90.12.25 24 0.2 90.32.3 23 0.2 90.52.35 18 0.1 90.62.4 27 0.2 90.82.45 18 0.1 90.92.5 28 0.2 91.22.55 20 0.2 91.32.6 16 0.1 91.42.65 27 0.2 91.62.7 17 0.1 91.82.75 26 0.2 922.8 27 0.2 92.22.85 29 0.2 92.42.9 19 0.1 92.52.95 16 0.1 92.73 34 0.3 92.9<strong>Appropriateness</strong> <strong>of</strong> <strong>Minimum</strong> <strong>Nurse</strong> <strong>Staffing</strong> <strong>Ratios</strong> in <strong>Nursing</strong> HomesReport to Congress−157
Appendix B.3c: <strong>Staffing</strong> levels in U.S. <strong>Nursing</strong> Homes:Distribution <strong>of</strong> RN+LPN hours per resident day: All Facilities, 1998RN+LPN hours perresident dayNumber <strong>of</strong>facilitiesPercentage <strong>of</strong>facilitiesCumulativepercentage3.05 24 0.2 93.13.1 16 0.1 93.23.15 22 0.2 93.43.2 25 0.2 93.63.25 17 0.1 93.73.3 19 0.1 93.93.35 20 0.2 943.4 21 0.2 94.23.45 25 0.2 94.43.5 21 0.2 94.53.55 21 0.2 94.73.6 24 0.2 94.93.65 25 0.2 95.13.7 24 0.2 95.33.75 15 0.1 95.43.8 21 0.2 95.53.85 15 0.1 95.73.9 15 0.1 95.83.95 17 0.1 95.94 23 0.2 96.14.05 21 0.2 96.24.1 19 0.1 96.44.15 21 0.2 96.64.2 17 0.1 96.74.25 12 0.1 96.84.3 15 0.1 96.94.35 17 0.1 974.4 15 0.1 97.14.45 9 0.1 97.24.5 16 0.1 97.3<strong>Appropriateness</strong> <strong>of</strong> <strong>Minimum</strong> <strong>Nurse</strong> <strong>Staffing</strong> <strong>Ratios</strong> in <strong>Nursing</strong> HomesReport to Congress−158
Appendix B.3c: <strong>Staffing</strong> levels in U.S. <strong>Nursing</strong> Homes:Distribution <strong>of</strong> RN+LPN hours per resident day: All Facilities, 1998RN+LPN hours perresident dayNumber <strong>of</strong>facilitiesPercentage <strong>of</strong>facilitiesCumulativepercentage4.55 12 0.1 97.44.6 10 0.1 97.54.65 7 0.1 97.64.7 17 0.1 97.74.75 12 0.1 97.84.8 24 0.2 984.85 5 0 984.9 11 0.1 98.14.95 7 0.1 98.15 13 0.1 98.25.05 11 0.1 98.35.1 13 0.1 98.45.15 11 0.1 98.55.2 9 0.1 98.65.25 11 0.1 98.75.3 6 0 98.75.35 13 0.1 98.85.4 6 0 98.95.45 5 0 98.95.5 8 0.1 995.55 6 0 995.6 4 0 995.65 4 0 99.15.7 6 0 99.15.75 2 0 99.15.8 3 0 99.15.85 4 0 99.25.9 2 0 99.25.95 5 0 99.26 8 0.1 99.36.05 6 0 99.3<strong>Appropriateness</strong> <strong>of</strong> <strong>Minimum</strong> <strong>Nurse</strong> <strong>Staffing</strong> <strong>Ratios</strong> in <strong>Nursing</strong> HomesReport to Congress−159
Appendix B.3c: <strong>Staffing</strong> levels in U.S. <strong>Nursing</strong> Homes:Distribution <strong>of</strong> RN+LPN hours per resident day: All Facilities, 1998RN+LPN hours perresident dayNumber <strong>of</strong>facilitiesPercentage <strong>of</strong>facilitiesCumulativepercentage6.1 6 0 99.46.15 1 0 99.46.2 3 0 99.46.25 3 0 99.46.3 3 0 99.56.35 3 0 99.56.4 5 0 99.56.45 2 0 99.56.5 2 0 99.66.55 1 0 99.66.6 4 0 99.66.7 3 0 99.66.75 4 0 99.66.8 3 0 99.76.85 3 0 99.76.95 2 0 99.77 2 0 99.77.05 2 0 99.77.1 1 0 99.77.15 1 0 99.87.2 3 0 99.87.25 3 0 99.87.35 2 0 99.87.4 2 0 99.87.5 1 0 99.87.55 1 0 99.87.6 1 0 99.97.65 1 0 99.97.7 2 0 99.97.95 1 0 99.9<strong>Appropriateness</strong> <strong>of</strong> <strong>Minimum</strong> <strong>Nurse</strong> <strong>Staffing</strong> <strong>Ratios</strong> in <strong>Nursing</strong> HomesReport to Congress−160
Appendix B.3c: <strong>Staffing</strong> levels in U.S. <strong>Nursing</strong> Homes:Distribution <strong>of</strong> RN+LPN hours per resident day: All Facilities, 1998RN+LPN hours perresident dayNumber <strong>of</strong>facilitiesPercentage <strong>of</strong>facilitiesCumulativepercentage8 2 0 99.98.15 1 0 99.98.25 1 0 99.98.3 1 0 99.98.55 1 0 99.98.75 1 0 99.98.8 1 0 99.98.95 2 0 1009 1 0 1009.2 1 0 1009.85 1 0 10010.4 1 0 10010.5 1 0 100Source: OSCAR<strong>Appropriateness</strong> <strong>of</strong> <strong>Minimum</strong> <strong>Nurse</strong> <strong>Staffing</strong> <strong>Ratios</strong> in <strong>Nursing</strong> HomesReport to Congress−161
Appendix B.3d: <strong>Staffing</strong> levels in U.S. <strong>Nursing</strong> Homes:Distribution <strong>of</strong> <strong>Nurse</strong>s Aide Hours per Resident Day: All Facilities, 1998Total hours perresident dayNumber <strong>of</strong>facilitiesPercentage <strong>of</strong>facilitiesCumulativepercentage0 113 0.9 0.90.05 5 0 0.90.1 3 0 0.90.15 5 0 10.2 10 0.1 10.25 15 0.1 1.20.3 8 0.1 1.20.35 10 0.1 1.30.4 11 0.1 1.40.45 10 0.1 1.50.5 10 0.1 1.50.55 17 0.1 1.70.6 24 0.2 1.90.65 27 0.2 2.10.7 26 0.2 2.30.75 37 0.3 2.50.8 36 0.3 2.80.85 55 0.4 3.20.9 66 0.5 3.80.95 79 0.6 4.41 72 0.6 4.91.05 97 0.7 5.71.1 107 0.8 6.51.15 136 1 7.51.2 130 1 8.51.25 183 1.4 9.91.3 192 1.5 11.41.35 226 1.7 13.11.4 245 1.9 151.45 261 2 17<strong>Appropriateness</strong> <strong>of</strong> <strong>Minimum</strong> <strong>Nurse</strong> <strong>Staffing</strong> <strong>Ratios</strong> in <strong>Nursing</strong> HomesReport to Congress−162
Appendix B.3d: <strong>Staffing</strong> levels in U.S. <strong>Nursing</strong> Homes:Distribution <strong>of</strong> <strong>Nurse</strong>s Aide Hours per Resident Day: All Facilities, 1998Total hours perresident dayNumber <strong>of</strong>facilitiesPercentage <strong>of</strong>facilitiesCumulativepercentage1.5 301 2.3 19.41.55 358 2.8 22.11.6 383 2.9 25.11.65 381 2.9 281.7 439 3.4 31.41.75 493 3.8 35.11.8 537 4.1 39.31.85 524 4 43.31.9 533 4.1 47.41.95 563 4.3 51.72 552 4.2 562.05 537 4.1 60.12.1 512 3.9 642.15 459 3.5 67.62.2 425 3.3 70.82.25 378 2.9 73.72.3 343 2.6 76.42.35 306 2.4 78.72.4 308 2.4 81.12.45 238 1.8 82.92.5 184 1.4 84.42.55 179 1.4 85.72.6 173 1.3 87.12.65 172 1.3 88.42.7 124 1 89.32.75 131 1 90.32.8 92 0.7 912.85 108 0.8 91.92.9 83 0.6 92.52.95 74 0.6 93.13 58 0.4 93.5<strong>Appropriateness</strong> <strong>of</strong> <strong>Minimum</strong> <strong>Nurse</strong> <strong>Staffing</strong> <strong>Ratios</strong> in <strong>Nursing</strong> HomesReport to Congress−163
Appendix B.3d: <strong>Staffing</strong> levels in U.S. <strong>Nursing</strong> Homes:Distribution <strong>of</strong> <strong>Nurse</strong>s Aide Hours per Resident Day: All Facilities, 1998Total hours perresident dayNumber <strong>of</strong>facilitiesPercentage <strong>of</strong>facilitiesCumulativepercentage3.05 65 0.5 943.1 51 0.4 94.43.15 45 0.3 94.83.2 48 0.4 95.13.25 45 0.3 95.53.3 34 0.3 95.73.35 34 0.3 963.4 26 0.2 96.23.45 42 0.3 96.53.5 19 0.1 96.73.55 27 0.2 96.93.6 18 0.1 973.65 13 0.1 97.13.7 14 0.1 97.23.75 16 0.1 97.43.8 20 0.2 97.53.85 17 0.1 97.63.9 13 0.1 97.73.95 14 0.1 97.84 23 0.2 984.05 9 0.1 98.14.1 14 0.1 98.24.15 13 0.1 98.34.2 9 0.1 98.44.25 11 0.1 98.54.3 10 0.1 98.54.35 9 0.1 98.64.4 8 0.1 98.74.45 7 0.1 98.74.5 14 0.1 98.8<strong>Appropriateness</strong> <strong>of</strong> <strong>Minimum</strong> <strong>Nurse</strong> <strong>Staffing</strong> <strong>Ratios</strong> in <strong>Nursing</strong> HomesReport to Congress−164
Appendix B.3d: <strong>Staffing</strong> levels in U.S. <strong>Nursing</strong> Homes:Distribution <strong>of</strong> <strong>Nurse</strong>s Aide Hours per Resident Day: All Facilities, 1998Total hours perresident dayNumber <strong>of</strong>facilitiesPercentage <strong>of</strong>facilitiesCumulativepercentage4.55 12 0.1 98.94.6 4 0 98.94.65 5 0 994.7 5 0 994.75 6 0 99.14.8 8 0.1 99.14.85 9 0.1 99.24.9 7 0.1 99.34.95 6 0 99.35 6 0 99.35.05 6 0 99.45.1 3 0 99.45.15 2 0 99.45.2 4 0 99.55.3 4 0 99.55.35 7 0.1 99.55.4 4 0 99.65.45 1 0 99.65.55 3 0 99.65.6 5 0 99.65.65 1 0 99.75.7 3 0 99.75.75 2 0 99.75.8 1 0 99.75.85 5 0 99.75.9 4 0 99.85.95 2 0 99.86 2 0 99.86.05 1 0 99.86.1 1 0 99.86.15 1 0 99.8<strong>Appropriateness</strong> <strong>of</strong> <strong>Minimum</strong> <strong>Nurse</strong> <strong>Staffing</strong> <strong>Ratios</strong> in <strong>Nursing</strong> HomesReport to Congress−165
Appendix B.3d: <strong>Staffing</strong> levels in U.S. <strong>Nursing</strong> Homes:Distribution <strong>of</strong> <strong>Nurse</strong>s Aide Hours per Resident Day: All Facilities, 1998Total hours perresident dayNumber <strong>of</strong>facilitiesPercentage <strong>of</strong>facilitiesCumulativepercentage6.3 1 0 99.86.35 1 0 99.86.4 2 0 99.96.6 2 0 99.96.65 1 0 99.96.8 1 0 99.96.85 2 0 99.96.9 1 0 99.97.05 1 0 99.97.1 1 0 99.97.15 1 0 99.97.2 1 0 99.97.3 1 0 99.97.4 1 0 1007.5 1 0 1007.55 1 0 1007.95 2 0 1008.05 1 0 1008.9 1 0 100Source: OSCAR<strong>Appropriateness</strong> <strong>of</strong> <strong>Minimum</strong> <strong>Nurse</strong> <strong>Staffing</strong> <strong>Ratios</strong> in <strong>Nursing</strong> HomesReport to Congress−166
APPENDIX C<strong>Appropriateness</strong> <strong>of</strong> <strong>Minimum</strong> <strong>Nurse</strong> <strong>Staffing</strong> <strong>Ratios</strong> in <strong>Nursing</strong> HomesReport to Congress−167
APPENDIX C1Survey Types and ProcessThe State Survey Agency (SA) is required to conduct annual unannounced surveys atLTC Facilities to determine compliance with Federal regulations. At 42 <strong>of</strong> the Code <strong>of</strong>Federal Regulations (CFR) 488.301 defines the type <strong>of</strong> surveys that SAs conduct, suchas Standard/Abbreviated Standard Surveys and Extended /Partial Extended Surveys.These survey types are as follows:1) The survey conducted by the SA annually begins as a resident-centered,outcome-oriented Standard Survey. This survey gathers information about thequality <strong>of</strong> services furnished and whether the facility complies with participationrequirements to meet the needs <strong>of</strong> each resident.2) An Abbreviated Standard Survey, which may be conducted as a result <strong>of</strong>complaints received, or as a result <strong>of</strong> change in ownership, management ordirector <strong>of</strong> nursing, focuses on a particular area <strong>of</strong> concern and may focus onstaffing.If during the course <strong>of</strong> either <strong>of</strong> these two types <strong>of</strong> surveys, the surveyors identifysubstandard quality <strong>of</strong> care, the survey agency must conduct an Extended or PartialExtended Survey.3) During an Extended/Partial Extended Survey, in addition to otherrequirements, nursing staffing must be reviewed.The statute and regulations require that a survey be conducted by a multidisciplinarygroup <strong>of</strong> health pr<strong>of</strong>essionals such as dieticians, pharmacists, and nurses. The surveyteam must include at least one registered pr<strong>of</strong>essional nurse. Depending upon thesurvey findings, complexity <strong>of</strong> the facility services and structure, distance and traveltime, a survey with three to four surveyors for a 100 bed facility, on the average, takesapproximately four days to complete.The Standard Survey process is predicated upon a holistic review <strong>of</strong> the care andservices required by an individual residing in the LTC facility. As an outcome basedsurvey process, the surveyors evaluate the care and services provided (e.g., assistancewith activities <strong>of</strong> daily living (ADLs), and appropriate interventions to prevent thedevelopment <strong>of</strong>: pressure ulcers, dehydration, malnutrition, decline or failure to maintainor improve ADLs, etc.). Surveyors must identify the potential for and actual negativeoutcomes and the facility’s culpability. If the surveyor identified an actual/potentialnegative outcome, emphasis was placed on identifying the specific requirement in theareas <strong>of</strong> quality <strong>of</strong> care or quality <strong>of</strong> life where the facility was deficient. 1717 Prior to the implementation <strong>of</strong> an <strong>In</strong>vestigative Protocol, surveyors were not given a direction inrelation to identifying how or why a residents’ written care plan was not being provided (e.g., such as<strong>Appropriateness</strong> <strong>of</strong> <strong>Minimum</strong> <strong>Nurse</strong> <strong>Staffing</strong> <strong>Ratios</strong> in <strong>Nursing</strong> HomesReport to Congress−168
investigating to determine if there was sufficient staff to develop an appropriate plan <strong>of</strong> care andimplement the plan <strong>of</strong> care as written).<strong>Appropriateness</strong> <strong>of</strong> <strong>Minimum</strong> <strong>Nurse</strong> <strong>Staffing</strong> <strong>Ratios</strong> in <strong>Nursing</strong> HomesReport to Congress−169
The Standard Survey process includes the use <strong>of</strong> the following information gatheringtechniques to complete the required survey tasks: observation <strong>of</strong> delivery <strong>of</strong> care;resident/family and staff interviews; and record review which provides evidence <strong>of</strong>whether staff evaluated resident’s needs and/or recognized, evaluated and intervenedwhen a resident experienced a change in condition.The required tasks for a Standard Survey prior to SOM changes in July 1999 includedthe following:• Offsite preparation for the survey (including review <strong>of</strong> a variety <strong>of</strong> reportsand documents);• An entrance conference with the facility staff and a posting <strong>of</strong> theavailability to meet with staff, visitors and residents;• A tour <strong>of</strong> the facility (primarily to identify concerns, confirm or invalidatepreviously identified concerns and to obtain an initial review <strong>of</strong> the facility,residents, staff, and environment);• Selection <strong>of</strong> a case-mix stratified sample <strong>of</strong> residents to use in subsequentfocused or comprehensive reviews <strong>of</strong> the care, quality <strong>of</strong> life and servicesfor those residents;• Resident, resident council, family, and staff interviews;• Medication pass observation;• An assessment <strong>of</strong> environmental safety and accommodation <strong>of</strong> residentspecific need;• Observation <strong>of</strong> meal service, evaluation <strong>of</strong> the dining experience anddetermination <strong>of</strong> whether the nutritional needs <strong>of</strong> residents are being met;and• A review for the presence <strong>of</strong> the facility’s quality assurance program;• A review <strong>of</strong> the Medicare requirement for Demand Billing; and• A review <strong>of</strong> Life Safety Code (which is done annually, but may becompleted by specialty inspectors, e.g., Fire Marshall, Engineer, etc. andnot necessarily concurrent with the standard health survey).<strong>Appropriateness</strong> <strong>of</strong> <strong>Minimum</strong> <strong>Nurse</strong> <strong>Staffing</strong> <strong>Ratios</strong> in <strong>Nursing</strong> HomesReport to Congress−170
A survey process provides a limited amount <strong>of</strong> time to complete the tasks required toevaluate a facility for compliance with the regulations. The survey process is complexand includes clarification <strong>of</strong> issues with facility staff, residents and/or their families orrepresentatives in a limited amount <strong>of</strong> time to complete all tasks. Prior to the end <strong>of</strong> thesurvey, the team must review and evaluate their findings to determine the facility’scompliance or non-compliance with the requirements for long term care facilities.APPENDIX C2Legislative Requirements in the Social Security Act§ 1819 REQUIREMENTS FOR, AND ASSURING QUALITY OF CARE IN, SKILLEDNURSING FACILITIES.(b) REQUIREMENTS RELATING TO PROVISION OF SERVICES.--(2) SCOPE OF SERVICES AND ACTIVITIES UNDER PLAN OF CARE--A skilled nursing facility must provide services to attain or maintain the highestpracticable physical, mental, and psychosocial well-being <strong>of</strong> each resident, in accordancewith a written plan <strong>of</strong> care which --(A) describes the medical, nursing and psychosocial needs <strong>of</strong> the resident andhow such needs will be met;(B) is initially prepared, with the participation to the extent practicable <strong>of</strong> theresident or the resident's family or legal representative, by a team which includesthe resident's attending physician and a registered pr<strong>of</strong>essional nurse withresponsibility for the resident; and(C) is periodically reviewed and revised by such team after each assessment underparagraph (3).(4) PROVISION OF SERVICES AND ACTIVITIES--(A) IN GENERAL: To the extent needed to fulfill all plans <strong>of</strong> care described inparagraph (2), a skilled nursing facility must provide, directly or underarrangements (or, with respect to dental services, under agreements) with othersfor the provision <strong>of</strong>(i) nursing services and specialized rehabilitative services to attain ormaintain the highest practicable physical, mental, and psychosocialwell-being <strong>of</strong> each resident.(B) QUALIFIED PERSONS PROVIDING SERVICES--Services described in clauses (i), (ii), (iii), (iv), and (vi) <strong>of</strong> subparagraph (A) mustbe provided by qualified persons in accordance with each resident's written plan<strong>of</strong> care.(C) REQUIRED NURSING CARE. --(I) IN GENERAL. -- Except as provided in clause (ii), a skilled nursing facilitymust provide 24-hour licensed nursing service which is sufficient to meet nursingneeds <strong>of</strong> its residents and must use the services <strong>of</strong> a registered pr<strong>of</strong>essional nurseat least 8 consecutive hours a day, 7 days a week.<strong>Appropriateness</strong> <strong>of</strong> <strong>Minimum</strong> <strong>Nurse</strong> <strong>Staffing</strong> <strong>Ratios</strong> in <strong>Nursing</strong> HomesReport to Congress−171
(d) REQUIREMENTS RELATING TO ADMINISTRATION AND OTHER MATTERS.---(1) ADMINISTRATION.--(A) IN GENERAL.--A skilled nursing facility must be administered in a mannerthat enables it to use its resources effectively and efficiently to attain or maintainthe highest practicable physical, mental, and psychosocial well-being <strong>of</strong> eachresident (consistent with requirements established under subsection (f)(5)).§ 1919 REQUIREMENTS FOR NURSING FACILITIES.(b) REQUIREMENTS RELATING TO PROVISION OF SERVICES.--(2) SCOPE OF SERVICES AND ACTIVITIES UNDER PLAN OF CARE--A nursing facility must provide services and activities to attain or maintain the highestpracticable physical, mental, and psychosocial well-being <strong>of</strong> each resident, in accordancewith a written plan <strong>of</strong> care which --(A) describes the medical, nursing and psychosocial needs <strong>of</strong> the resident andhow such needs will be met;(B) is initially prepared, with the participation to the extent practicable <strong>of</strong> theresident or the resident's family or legal representative, by a team which includesthe resident's attending physician and a registered pr<strong>of</strong>essional nurse withresponsibility for the resident; and(C) is periodically reviewed and revised by such team after each assessment underparagraph (3).(4) PROVISION OF SERVICES AND ACTIVITIES--(A) IN GENERAL: To the extent needed to fulfill all plans <strong>of</strong> care described inparagraph (2), a nursing facility must provide (or arrange for the provision <strong>of</strong>)--(i) nursing and related services and specialized rehabilitative services toattain or maintain the highest practicable physical, mental, andpsychosocial well-being <strong>of</strong> each resident.(B) QUALIFIED PERSONS PROVIDING SERVICES--Services described in clauses (i), (ii), (iii), (iv), and (vi) <strong>of</strong> subparagraph (A) mustbe provided by qualified persons in accordance with each resident's written plan<strong>of</strong> care.(C) REQUIRED NURSING CARE; FACILITY WAIVERS. --(i) GENERAL REQUIREMENTS.-- With respect to nursing facilityservices provided on or after October 1, 1990, a nursing facility --(I) except as provided in clause (ii), must provide 24-hourlicensed nursing services which are sufficient to meet thenursing needs <strong>of</strong> its residents, and(II) except as provided in clause (ii), must use the services<strong>of</strong> a registered pr<strong>of</strong>essional nurse for at least 8 consecutivehours a day, 7 days a week.(d) REQUIREMENTS RELATING TO ADMINISTRATION AND OTHER MATTERS.---(1) ADMINISTRATION.--(A) IN GENERAL.--A nursing facility must be administered in a manner thatenables it to use its resources effectively and efficiently to attain or maintain the<strong>Appropriateness</strong> <strong>of</strong> <strong>Minimum</strong> <strong>Nurse</strong> <strong>Staffing</strong> <strong>Ratios</strong> in <strong>Nursing</strong> HomesReport to Congress−172
highest practicable physical, mental, and psychosocial well-being <strong>of</strong> each resident(consistent with requirements established under subsection (f)(5)).<strong>Appropriateness</strong> <strong>of</strong> <strong>Minimum</strong> <strong>Nurse</strong> <strong>Staffing</strong> <strong>Ratios</strong> in <strong>Nursing</strong> HomesReport to Congress−173
APPENDIX C3INVESTIGATIVE PROTOCOLNURSING SERVICES, SUFFICIENT STAFFINGObjectives:To determine if the facility has sufficient nursing staff available to meet theresidents’ needs.To determine if the facility has licensed registered nurses and licensed nursingstaff available to provide and monitor the delivery <strong>of</strong> resident care.Task 5C: Use:NOTE: This protocol is not required during the standard survey, unless it is triggered inthe event <strong>of</strong> care concerns/problems which may be associated with sufficiency<strong>of</strong> nursing staff. It is required to be completed for an extended survey.This protocol is to be used when:Quality <strong>of</strong> care problems have been identified, such as: Residents not receivingthe care and services to prevent pressure sore/ulcer(s), unintended weight loss anddehydration, and to prevent declines in their condition as described in theircomprehensive plans <strong>of</strong> care, such as bathing, dressing, grooming, transferring,ambulating, toileting, and eating; andComplaints have been received from residents, families or other residentrepresentatives concerning services, such as: Care not being provided, call lights notbeing answered in a timely fashion, and residents not being assisted to eat.Procedures:Determine if the registered/licensed nursing staff are available to:- Supervise and monitor the delivery <strong>of</strong> care by nursing assistants accordingto residents' care plans;- Assess resident condition changes;- Monitor dining activities to identify concerns or changes in residents'needs;- Respond to nursing assistants' requests for assistance;- Correct inappropriate or unsafe nursing assistants techniques; and- Identify training needs for the nursing assistants.If problems were identified with care plans/services not provided as needed bythe resident, focus your discussion with supervisory staff on the situations which led tousing the protocol: how do they assure that there are adequate staff to meet the needs<strong>of</strong> the residents; how do they assure that staff are knowledgeable about the needs <strong>of</strong>the residents and are capable <strong>of</strong> delivering the care as planned; how do they assurethat staff are appropriately deployed to meet the needs <strong>of</strong> the residents; how do theyprovide orientation for new or temporary staff regarding the resident needs and theinterventions to meet those needs; and how do they assure that staff are advised <strong>of</strong>changes in the care plan?<strong>Appropriateness</strong> <strong>of</strong> <strong>Minimum</strong> <strong>Nurse</strong> <strong>Staffing</strong> <strong>Ratios</strong> in <strong>Nursing</strong> HomesReport to Congress−174
Determine if nursing assistants and other nursing staff are knowledgeableregarding the residents' care needs, such as: the provision <strong>of</strong> fluids and foods forresidents who are unable to provide these services for themselves; the provision <strong>of</strong>turning, positioning and skin care for those residents identified at risk for pressuresore/ulcers; and the provision <strong>of</strong> incontinence careas needed;If necessary, review nursing assistant assignments in relation to the care and orservices the resident requires to meet his/her needs;<strong>In</strong> interviews with residents, families and/or other resident representatives,inquire about the staff’s response to requests for assistance, and the timeliness <strong>of</strong> calllights being answered; andDetermine if the problems are facility-wide, cover all shifts or if they are limited tocertain units or shifts, or days <strong>of</strong> the week. This can be based on information alreadygathered by the team with additional interviews <strong>of</strong> residents, families and staff, asnecessary.Task 6: Determination <strong>of</strong> Compliance:NOTE: Meeting the State mandated staffing ratio, if any, does not preclude adeficiency <strong>of</strong> insufficient staff if the facility is not providing needed care andservices to residents.Compliance with 42 CFR 483.30(a), F353, Sufficient Staff:- The facility is compliant with this requirement if the facility hasprovided a sufficient number <strong>of</strong> licensed nurses and other nursing personnel to meet theneeds <strong>of</strong> the residents on a twenty-four hour basis. If not, cite F353.<strong>Appropriateness</strong> <strong>of</strong> <strong>Minimum</strong> <strong>Nurse</strong> <strong>Staffing</strong> <strong>Ratios</strong> in <strong>Nursing</strong> HomesReport to Congress−175
APPENDIX C4Example <strong>of</strong> a Well Written DeficiencyOne deficiency that was reviewed by HCFA staff was an excellent example <strong>of</strong> resident’sidentified needs, numbers <strong>of</strong> staff, interviews, record review, and observations. Thefollowing is the text from that deficiency.Facility #23:Based on observation, staff interview, resident interview, family interviewand record review, the facility failed to provide nursing staff for theresidents to attain and/or maintain the highest practicable physical, mentaland psychosocial well being.During an interview with the day Registered <strong>Nurse</strong> (RN) Supervisor on …at 2:05 p.m, she stated there were 25 residents on second floor and 24residents on third floor. The RN Supervisor was responsible for care <strong>of</strong>the residents on 2 nd and 3 rd floors and supervision <strong>of</strong> all floor staff. Therewere 9 residents on 2 nd floor on ventilator life support full time and anadditional resident on ventilator life support only at night. There were 17residents on 2 nd floor with diagnoses <strong>of</strong> persistent vegetative state. Shestated there were 22 residents on 2 nd floor received nutrition bygastrostomy tube (g-tube) feeding and 4 on 3 rd floor receiving nutrition byg-tube. On … there were 5 residents on 2 nd floor and 1 resident on thirdfloor receiving intravenous antibiotics that could only be administered by aRN.Resident interviews:1. <strong>In</strong>terviews were conducted with alert and oriented residents livingon both the 2 nd and 3 rd floors <strong>of</strong> the facility on… Residentsinterviewed were sample residents… (6 were identified).<strong>In</strong>terviewable resident… was interviewed at 2:35 p.m. in his room on 3 rdfloor. The resident stated he needed a 2-person transfer to get out <strong>of</strong> bedand into his wheelchair. The resident stated sometimes there weren’tenough staff to help him transfer. The resident state he had waited aslong as 20-30 minutes to get the assistance he needed to transfer frombed to his wheelchair. The resident stated that when this happened, hewould be late for meals and therapy. Therapy was very important to him,“I’m very annoyed when I don’t get therapy. Therapy is paramount to me.”The resident stated he lets staff know when he is annoyed.The resident went on to say there was a “chronic staff shortage <strong>of</strong> nursesand CNAs (certified nursing assistants). [The] nurses have to help theCNAs and everyone does a job they aren’t hired for.” The resident stated<strong>Appropriateness</strong> <strong>of</strong> <strong>Minimum</strong> <strong>Nurse</strong> <strong>Staffing</strong> <strong>Ratios</strong> in <strong>Nursing</strong> HomesReport to Congress−176
there were usually 2 CNAs on the floor, but <strong>of</strong>ten times at evening andnight, there is “only 1”. The resident stated there was 1 nurse to givemedications and he could get his medications as late as a “couple <strong>of</strong>hours.” The resident stated he liked hismorning medications 1 to 1½ hours before he gets up “so I am not jumping out <strong>of</strong> mychair [wheelchair] with muscle spasms. I need my muscle relaxants’ before getting out<strong>of</strong> bed. The above information given by resident … was confirmed by observing the8:00 a.m. medication pass on the 3 rd floor on …<strong>In</strong>terviewable resident …had a tracheostomy and was on a ventilator, butcould answer yes/no questions by head shakes and nods and couldmouth words. Resident…was interviewed on …at 9:25 a.m. in her roomon 2 nd floor. Resident … indicated she would sometimes lay wet in bed forsometimes an hour, 2 hours and/or 3 hours once or twice a day. Whenasked if staff come in and check on her, she made a face and shook herhead. When asked if she would like them to look in on her, she noddedher head. When asked if staff come quickly when she turned on her calllight she shook her head no. The resident indicated it could take up toone hour, but never 2 hours for the call light to be answered. The residentindicated the staff will come in, turn <strong>of</strong>f her call light, tell her they will beback and then not come back. Resident … indicated she did not alwaysget her medication on time. She indicated her medication was usually latein the evening and night, but not during the day. The information given by…regarding the mediation pass was confirmed by observing themedication pass the evening (6:00 p.m.) on second floor.<strong>In</strong>terviewable resident … was interviewed on …at 1:10 p.m. in his room on2 nd floor. Resident…has quadriplegia and is ventilator dependent. Hestated there was “no help.” He stated evenings were bad but nights wereworse, and the people they do have they ‘work them to death.” He statedhe did not get his medication on time 4-5 times a week and he would getmuscle spasms if his medication was not given on time. Resident… said itwas “scary at night”. He stated he didn’t “know if they are going to haveenough help to answer call lights or your alarms. I timed them one nightand it took them (staff) 28 minutes to answer my call light.” He stated thathe used his “call light at night” when he needed suctioning. “two minutesnot being able to breathe is scary”, resident … told the surveyor. Hestated Saturday and Sunday were the worst days for the facility not havingenough staff…<strong>In</strong>terviewable resident…lived on 2 nd floor and was interviewed on …at10:30 a.m. He indicated the facility did not have enough staff to help him.He indicated sometimes they have enough on day and evening and<strong>Appropriateness</strong> <strong>of</strong> <strong>Minimum</strong> <strong>Nurse</strong> <strong>Staffing</strong> <strong>Ratios</strong> in <strong>Nursing</strong> HomesReport to Congress−177
sometimes they do not. He could not indicate [about staff] on night shift.He indicated the staff don’t change his catheter <strong>of</strong>ten and he had gone formonths without it being changed. He shook his head when asked if it waschanged every two weeks or monthly. He also indicated by shaking hishead that the tube in his throat was not taken out and changed. Theinformation regarding resident…catheter was confirmed from recordreview and staff interview.<strong>In</strong>terviewable resident…lived on 3 rd floor. The resident was very mobileand was going to be discharged from the facility on … She stated thefacility needed more people, people meaning staff. She stated there wasonly 1 nurse per shift. She stated 1 nurse was not enough and that thingscould be very volatile. When asked what she meant by volatile, she statedvolatile meant emergencies and people (residents) being ill.<strong>In</strong>terviewable resident …communicated via computer and nodding hishead indicating yes or an affirmative answer, or shaking his headindicating no or a negative answer to question. When asked if staff helphim change his position when he is in bed, he shook his head. He alsoshook his head when asked if he could change his position by himself. Hestated through his computer that he lay on his back all night. When askedif he used his call light, he nodded his head and when asked how long ittook staff to answer his call light in the evening, he responded bycomputer, “usually they have only 1 aide, so it takes quite a while.” Whenasked if he thought the facility had enough staff, he shook his head. Theresident was asked why he thought that and he replied through computer,“very <strong>of</strong>ten there will be only 1 nurse <strong>of</strong> aide and they have to doeverybody alone.” He was asked, when that happens, did he get the carehe needed? He shook his head and responded, “I don’t expect to. I try tomake it easy because the others need help.” He was asked if he know <strong>of</strong>anyone on 2 nd or 3 rd floor that didn’t get the help they needed, he hesitatedand looked away. When asked if he would rather not answer thatquestion, he nodded and added by computer, “because all I know <strong>of</strong> iswhat I hear from my room. But when I hear somebody crying, I feel theyaren’t being cared for.”Family interviews:The family <strong>of</strong> resident …asked to speak to the surveyor and an interviewwas conducted on …at 4;30 P.M. The family member she visited theresident daily. She stated that 4-5 times a week she would find theresident’s incontinent pads “very saturated” with urine. She also statedthe pillows used for positioning were not being consistently used. The<strong>Appropriateness</strong> <strong>of</strong> <strong>Minimum</strong> <strong>Nurse</strong> <strong>Staffing</strong> <strong>Ratios</strong> in <strong>Nursing</strong> HomesReport to Congress−178
family member stated she bathed the resident daily. The family memberstated she was concerned about the positioning pillows because she didnot want the resident to develop pressure sores. The family memberstated sometimes in the evening the facility had 1 RN, 2 LicensedPractical <strong>Nurse</strong>s (LPN) and 2 CNAs. 1 CNA orienting the 2 nd CNA. Thefamily member stated if she wasn’t’ at the facility, the resident would notget care. The family member questioned why she had to provide carewhen the facility got paid to provide care.<strong>Appropriateness</strong> <strong>of</strong> <strong>Minimum</strong> <strong>Nurse</strong> <strong>Staffing</strong> <strong>Ratios</strong> in <strong>Nursing</strong> HomesReport to Congress−179
An interview with the family <strong>of</strong> a sample resident was held on …a t 12:00noon. The family member stated the staffing was “horrendous” on theweekends. The family member stated that members <strong>of</strong> the family visitedthe resident on a daily basis. The family member stated the 1 st weekendthe resident was in the facility, the family found the resident to be lying inurine and feces. The family member stated the resident’s perineal areawas “red with rash, just like a baby has”. The family continued that theareas was still red on … and was bleeding from the rash three weeksprior. The family member stated “I figured out right <strong>of</strong>f, I had to tell staffwhen to change [the resident}. The family member stated family had totell staff when to get the resident up, reposition the resident and when tocheck the resident’s pads for incontinent episodes. From …the familyfound on 4 week-ends the resident was without positioning devices for theextremities. The family member stated the family performed range <strong>of</strong>motion on the resident’ s feet because staff “won’t do it.” The familymember stated the family begged staff to perform range <strong>of</strong> motion on theresident’s feet, “I tell them I’ll pay them” to perform the range <strong>of</strong> motion.The family member stated “staff never reposition [the resident} in chair{wheelchair}, I do.’ The family member stated staff, “never come in androll the resident from side to side.” Occupational Therapy did an up-downschedule for the resident in the room and they have never followed it,never, not once. The family member stated the weekend <strong>of</strong> …, the familymember found the resident to be lying in feces in bed when the familyarrived for the visit at about 11:30 a.m. The family member asked howmany patients the licensed nursing staff had to take care <strong>of</strong>, the licensednursing staff staffed 28. The family member stated that during the 2 ndweek-end <strong>of</strong> …, family asked a staff person to change the resident and thestaff person told the family member he was too busy. The family statedthe family had taken their complaints to the <strong>Nursing</strong> Home Administrator(NHA) and had been told by the NHA to tell the staff they have to do it.The family interview was confirmed by record review.An interview was conducted with the family <strong>of</strong> a sample resident on … at10:30 a.m. The family member stated the facility was understaffed most<strong>of</strong> the time. The family member stated that family members have been inthe facility everyday. The family member stated the resident had beenoutside the facility with the family and when the family brought the residentback inside, the bandages on the resident’s wounds were dripping andwere wet with pus. The family could not remember the exact date, butstated she asked the licensed staff to change the bandages. The licensedstaff told the family he couldn’t change the dressing because he had topass medications. A family member stated on … at 3;30 p.m., that “I haveto ask to have it done” referring to wound care on weekends.<strong>Appropriateness</strong> <strong>of</strong> <strong>Minimum</strong> <strong>Nurse</strong> <strong>Staffing</strong> <strong>Ratios</strong> in <strong>Nursing</strong> HomesReport to Congress−180
APPENDIX D<strong>Appropriateness</strong> <strong>of</strong> <strong>Minimum</strong> <strong>Nurse</strong> <strong>Staffing</strong> <strong>Ratios</strong> in <strong>Nursing</strong> HomesReport to Congress−181
APPENDIX DTelephone <strong>In</strong>terview <strong>of</strong> DONs Regarding Facility <strong>Staffing</strong><strong>In</strong>troduction:My name isand I’m calling from Abt Associates, a private researchfirm based in Cambridge, Massachusetts. We currently have a contract with HCFA to help themto determine the need for a Federal minimum staffing requirement for nursing facilitiesparticipating in Medicare and Medicaid.Our project centers on a quantitative analysis <strong>of</strong> the relationship between staffing and outcomes,and the ability <strong>of</strong> this analysis to identify a staffing threshold below which nursing facilityresidents are at increased risk <strong>of</strong> poor outcomes. <strong>In</strong> addition to this quantitative analysis, we arealso conducting a series <strong>of</strong> focus groups among direct care staff (specifically, <strong>Nurse</strong> Aides) toask them about staffing in their facilities, for example, how they adapt their work when theirshift/unit is short staffed, and how they believe staffing impacts quality <strong>of</strong> care. We are alsoconducting a series <strong>of</strong> telephone interviews with DONs/ADONs to ask about the mechanics <strong>of</strong>staffing, i.e., how much time is devoted to staffing issues, how staffing schedules are determined,how short staffing is handled, etc.You were referred to us by _____________________________, who indicated that you might beinterested and willing to complete a telephone interview with us about the mechanics <strong>of</strong> staffingin your facility. If you are not the appropriate staff person to interview, can you refer me to theright person?The interview will last about 30 minutes, and if you are willing to participate, we can conduct theinterview now if you have time, or schedule some time within the next week. Which do youprefer? Now. Proceed with interview. Later. Scheduled date and time is:______________________________Please note that the interview will be confidential – your responses will be anonymous, andneither you nor your facility will be identified in our report to HCFA.<strong>In</strong>terviewee characteristics:Position: _________________________________________How long in that position? ___________________________How long at the facility? _____________________________<strong>Appropriateness</strong> <strong>of</strong> <strong>Minimum</strong> <strong>Nurse</strong> <strong>Staffing</strong> <strong>Ratios</strong> in <strong>Nursing</strong> HomesReport to Congress−182
Facility Characteristics:Total number <strong>of</strong> Beds:Number and type <strong>of</strong> Units:Number <strong>of</strong> beds/unit:Resident population:(% Medicare, %Medicaid, % private pay)Location:(urban/suburban/rural)Ownership:(chain/independent)Pr<strong>of</strong>it status:(for-pr<strong>of</strong>it/non-pr<strong>of</strong>it)Responsibility for and <strong>In</strong>volvement in <strong>Staffing</strong>1) <strong>In</strong> your current position as DON or ADON, how much <strong>of</strong> your time is devoted to dealingwith staffing issues in general?A lot – at least 50 % <strong>of</strong> my timeSome –25-49 % <strong>of</strong> my timeLittle – 10-24% <strong>of</strong> my timeVery Little – Less than 10% <strong>of</strong> my time.1a). How much <strong>of</strong> your time is devoted to the following staffing-related tasks?<strong>Staffing</strong> Issue:<strong>Staffing</strong> budget developmentDetermination <strong>of</strong> vacantpositionsAdvertising positions<strong>In</strong>terviewing candidates50% ormore25- 49% 10-24%
Checking referencesHiring processOrientation/TrainingScheduling and re-schedulingDealing with sick calls, etc.2) Which <strong>of</strong> these specific activities takes the most <strong>of</strong> your time? Why?Development <strong>of</strong> <strong>Staffing</strong> Schedules3) How is scheduling conducted at your facility?3a).3c).Does the facility employ a scheduler? Yes 3b). How many hours per week does thisperson work? NoWho is responsible for scheduling licensed staff? For scheduling unlicensed staff?4) How do you decide how many staff per shift to schedule (ask for information for all 3 shifts)?5) What factors are taken into consideration when making the schedules?6) Do staff have any input into the schedules? If yes, at what level and how much input do they have?7) Do you currently have any vacant positions? Yes 7a.) How many vacancies and for what positions?<strong>Appropriateness</strong> <strong>of</strong> <strong>Minimum</strong> <strong>Nurse</strong> <strong>Staffing</strong> <strong>Ratios</strong> in <strong>Nursing</strong> HomesReport to Congress−184
7b).How are these vacancies being covered? through use <strong>of</strong> temporary/agency staff over-time by facility staff voluntary OT mandatory OT through use <strong>of</strong> per diem staffNo positions are currently vacantNumbers <strong>of</strong> Staff and Adequacy <strong>of</strong> <strong>Staffing</strong> Level8) Consider the numbers <strong>of</strong> nursing staff in your building. When everyone reports for his/herscheduled shift, would you describe your facility’s staffing as: Excellent Adequate – not necessarily short staffed, but not heavily staffed either Light – slightly short staffed Poor – definitely short staffed8a).Would you answer this question differently for different shifts? If so, describe.9) What percent <strong>of</strong> the time would you estimate that all scheduled staff report for work?75% <strong>of</strong> the time9) Consider, in general terms, the current staffing situation in your facility. Please describe how thecurrent situation came to be. What factors within the facility or from outside the facility impact yourability to staff the facility?Probes (check all that apply): Current rates <strong>of</strong> unemployment in your area uncertainty about the financial impact <strong>of</strong> PPS administration/corporate limits on staffing Aging licensed nursing population, decreased enrollment in nursing schools Low wages, few benefits for nursing facility staff Little chance for advancement for NAs Physically and emotionally demanding work Poor image <strong>of</strong> nursing homes in the media Other ___________________________________<strong>Appropriateness</strong> <strong>of</strong> <strong>Minimum</strong> <strong>Nurse</strong> <strong>Staffing</strong> <strong>Ratios</strong> in <strong>Nursing</strong> HomesReport to Congress−185
10) Describe the “ideal” staffing ratios (staff to residents) for your facility, by shift. This ideal should notbe constrained by budgetary limits, availability <strong>of</strong> staff, etc. The ideal should be based on what youthink is needed to provide quality care.ShiftIdeal ratio for RNs toresidentsIdeal ratio for LPNs toresidentsIdeal ratio for NAs toresidents7-33-1111-711) Do these ideals differ from your actual staffing?1) No2) Yes 11a). How do they differ?12) Does your state have minimum staffing requirements for licensed and unlicensed staff in nursing facilities? No Yes 12a). Do you know what those minimums are? No Yes 12b). Do you think these minimums are adequate? Yes 12c). Are they enforced? Yes No No 12d). What do you think theyshould be?13) Do you think the Federal government should mandate minimum staffing requirements? Yes. Please explain why. No. Please explain why.14) Do you currently use, or have you in the past, used an acuity scale to determine staffing needs? Ifso, what measure did you use? Please also comment on its usefulness.<strong>Appropriateness</strong> <strong>of</strong> <strong>Minimum</strong> <strong>Nurse</strong> <strong>Staffing</strong> <strong>Ratios</strong> in <strong>Nursing</strong> HomesReport to Congress−186
Problems & Solutions: Absenteeism15) To what extent do last minute sick calls and no call/no shows affect staffing in your facility (onaverage)? BIG part <strong>of</strong> the problem part <strong>of</strong> the problem Small part <strong>of</strong> the problem not part <strong>of</strong> the problem16) What methods/strategies do you currently employ to reduce absenteeism? Check all that apply. Rewards, bonuses, recognition for good attendance. Progressive discipline measures for excessive absenteeism. Requiring MD notes for sick calls Requiring staff to “make up” lost time, especially re: weekend sick calls Sick time buy-back programs Other16a).How effective have these been? Do you plan any changes in the future?17) How are sick calls handled?17a).Who in the facility is responsible for receiving the calls and making any necessary staffingdecisions?17b).What kinds <strong>of</strong> options are available to this person for filling the slot? How does this vary byshift, by unit?17c).Are all sick calls replaced or only those in excess <strong>of</strong> a certain number or on certain units,certain shifts?17d).What number <strong>of</strong> sick calls, or below what ratio <strong>of</strong> residents to staff is considered critical?17e).Do you currently use temporary help to replace sick calls?Recruitment and Retention<strong>Appropriateness</strong> <strong>of</strong> <strong>Minimum</strong> <strong>Nurse</strong> <strong>Staffing</strong> <strong>Ratios</strong> in <strong>Nursing</strong> HomesReport to Congress−187
18) To what extent is any existing or potential staffing shortage in your facility related to recruitment and/orretention problems? Most <strong>of</strong> the problem Some <strong>of</strong> the problem Small part <strong>of</strong> the problem Not part <strong>of</strong> the problem19) What strategies do you currently employ to improve recruitment and retention? Check all that apply. Hiring bonuses for new employees Recruitment bonuses for current employees Recognition, rewards, bonuses for long term employees Generous benefits programs (vacation, sick time, health insurance, retirement plans) for long termemployees Career ladders Free training programs for NA’s Cooperative programs with vocational schools, nursing schools to provide clinical learning sites andopportunities for recruitment Special pay rates Shift and weekend differentials Benefit programs for part time employees Job fairs Offering special educational programs, ESL classes Other20) How effective have these strategies been? Do you plan any changes in the near future?Creative Solutions to Stretch StaffDoes you currently employ any <strong>of</strong> the following ways to “stretch” your existing staff? Check all that apply. Volunteers. If yes, how many and on what shifts? Family members. If yes, on average how many residents have family members who visit1-2 times/week3-5 times/week5 or more times/week Bed Makers, Bathers, etc. If yes, how many hours per week Assistance at mealtimes from licensed staff, administrator staff, social services, activity staff. Paid companions/private duty nursing for residents. If yes, how many residents have this? Overlapping shifts at critical times when more staff are neededConclusion:I want to thank you very much for your time and assistance with our project. If there is anything else you wouldlike to tell me about staffing as a general issue or about staffing in your facility, please feel free to do so. If thereis something I didn’t ask you that you wished I had, please also let me know that.If upon further reflection, there is something you would like to add to the interview, I may be reached at (617)349-XXXX.<strong>Appropriateness</strong> <strong>of</strong> <strong>Minimum</strong> <strong>Nurse</strong> <strong>Staffing</strong> <strong>Ratios</strong> in <strong>Nursing</strong> HomesReport to Congress−188
Thank you again for your time.<strong>Appropriateness</strong> <strong>of</strong> <strong>Minimum</strong> <strong>Nurse</strong> <strong>Staffing</strong> <strong>Ratios</strong> in <strong>Nursing</strong> HomesReport to Congress−189
APPENDIX D<strong>Nurse</strong> Aide Focus GroupsModerator=s GuideMy name is Allison Walker and this is my colleague Karen Toll. We=re from Abt Associates,a private research firm, specializing in health policy research for the Federal government. Ourmain <strong>of</strong>fices are located in Cambridge, MA, and Washington, DC.We currently have a contract with the Health Care Financing Administration (HCFA) toprovide them with research that will help determine whether or not they should require aminimum number <strong>of</strong> nursing staff to residents in nursing facilities that have Medicare andMedicaid residents. Our project will utilize a great deal <strong>of</strong> data and information related tostaffing and quality <strong>of</strong> care/quality <strong>of</strong> life. <strong>In</strong> addition to these data, the study will also collectinformation from the front line nursing facility staff (i.e., the direct care workers) who are themost qualified to tell us about how staffing affects quality <strong>of</strong> care and quality <strong>of</strong> life B you arethe experts, which is why we want to talk to you about this important issue.To that end, we are conducting a series <strong>of</strong> focus groups to talk to <strong>Nurse</strong> Aides about the issue<strong>of</strong> staffing. Focus groups are really just group discussions with everyone participating and<strong>of</strong>fering their opinions on the topics being discussed. There are no right or wrong answers.Topics include how staffing decisions are made, how facility management responds to shortstaffing, the consequences <strong>of</strong> short staffing, how long it takes you to conduct certain activitiessuch as feeding, and unique staffing practices you have experienced.We ask that you be as open and honest as possible, and provide us with responses based onyour entire experience as a <strong>Nurse</strong> Aide. Your name (or the name <strong>of</strong> your facility) will not beassociated in any way with your responses to our questions, and you will not be identified inany report being submitted to HCFA. This discussion will be held confidential.This session will last approximately 12 to 2 hours, and we greatly appreciate your willingnessto give us your time and provide us with this valuable input to our study. We are providingyou with $40 in return for your participation in this discussion group. So before you leave, wewill need to fill out the form to receive your money, which we will give you in cash at the end<strong>of</strong> the session.Opening warm-up question (10 minutes)I would like us to go around the table and have each person tell us your name, where you arefrom (city/state) and how long you=ve have been at your current facility. Please also tell ushow long you=ve been a NA and why you decided to become a NA.@<strong>Appropriateness</strong> <strong>of</strong> <strong>Minimum</strong> <strong>Nurse</strong> <strong>Staffing</strong> <strong>Ratios</strong> in <strong>Nursing</strong> HomesReport to Congress−190
Ask if anyone has a job title other than <strong>Nurse</strong> Aide, such as Resident Aide/ResidentAssistant or <strong>Nurse</strong> Assistant. Follow-up by asking what the different job title means tothem.<strong>Staffing</strong> Schedule Determinations (20 minutes)How is staffing determined in your nursing facility? Do you think this process is adequate?@Probes:Who determines staffing, i.e., # <strong>of</strong> staff on a shift, # <strong>of</strong> NAs, where eachstaff member will work, etc. (DON, NA Team Leader, etc.)When is the schedule determined?What is the schedule based on (i.e., previous week=s schedule, facilitystandards, employee input, etc.)?What kind <strong>of</strong> flexibility do you have in determining your schedule (i.e., how much control doyou have over your own schedule?).@What if you need to make a change in the schedule?@Probes:What must you do to get the schedule changed?How easy is it to change the schedule?What if the facility needs to make a change in the schedule? How is this handled at yourfacility?@Probes:management asks for volunteers to work additional/different shiftslowest seniority is required to work additional shiftsuse agency staff if no employees available to cover changeOffer incentives to employees to work extra shiftsWhat happens when staff call in sick, i.e., how does facility management deal with being shortstaffed?@ How do they staff up to a normal/usual level?@Probes:use agency/per diem staffHave employees work double shiftsContinue the day being short staffedWhen do you usually find out that your shift/unit is presently short staffed?@Probes:when you show up for workPrior to coming to workIs absenteesim a problem in your facility?@<strong>Appropriateness</strong> <strong>of</strong> <strong>Minimum</strong> <strong>Nurse</strong> <strong>Staffing</strong> <strong>Ratios</strong> in <strong>Nursing</strong> HomesReport to Congress−191
If yes, AWhy do you think NAs are absent?@Probes:too tired from previous shift to workNo input into the schedule so can=t <strong>of</strong>ten work when scheduledTransportation problems to/from workHome/family situation is problematicWhat do you think facility management could do to reduce absenteeism?@Probes:<strong>of</strong>fer financial incentivesBonuses for not using sick leaveAllow staff more input into the schedule<strong>In</strong>volve NAs in care planningCareer laddersGeneral <strong>Staffing</strong> Questions (20 minutes)What shift do you currently work? How many residents are you (typically) responsible for onthat shift? Do you think that is too many, just enough, or could you care for more? Are youable to do what is needed in the time available?Are staffing assignments (i.e., shift, unit, etc.) consistent/permanent?What things do you differently when working a short staffed shift or unit (i.e., what givesfirst)?Probes: bathing, grooming, etc.spending time with residentsdocumentationinteraction with other staffattending care planning conferencesWhich aspects <strong>of</strong> care/quality <strong>of</strong> life suffer the most from short staffing?Probes:residents are not turned and positionedResidents don=t get waterresidents are not toileted frequently enoughresidents are not fed properly and with careresidents are not ambulatedresidents do not have their hygiene needs metresidents miss their bathsresidents miss activities, opportunities for recreation/socialization<strong>Appropriateness</strong> <strong>of</strong> <strong>Minimum</strong> <strong>Nurse</strong> <strong>Staffing</strong> <strong>Ratios</strong> in <strong>Nursing</strong> HomesReport to Congress−192
Which types <strong>of</strong> residents are most likely to receive less care when the shift/unit is shortstaffed?Probes:demanding residentsConfused residentsBedfast residentsYoung residentsElderly residentsResidents with complex care needsWhat happens to residents when the facility is short staffed? What do you see?Probes:weight lossmalnutritiondehydrationbed soresincontinencedecreased range <strong>of</strong> motionless communicative/more withdrawn/appatheticdeathHow is this lack <strong>of</strong> care reported, i.e., how is this discussed bewteen NAs and theirsupervisors? Is a plan developed to address these problems?Unique <strong>Staffing</strong> Practices (10 minutes)Is there anything your current facility does that is unique regarding staffing?Probes:overlapping shiftsmore staff on at mealtimesUse <strong>of</strong> volunteersIf yes, how do these things affect quality <strong>of</strong> care? How do they affect your job or the way youfeel about your job?Have you experienced any staffing practices that make providing care more difficult?Time it Takes to Feed Residents (20 minutes)The following series <strong>of</strong> questions focus on how long it takes to feed residents. And while wecould ask similar questions for activities such as bathing, dressing toileting, transferring andgrooming, we really only have time to discuss one activity. As such, we decided to focus onfeeding since it is such an important and time consuming part <strong>of</strong> the <strong>Nurse</strong> Aide=s day.<strong>Appropriateness</strong> <strong>of</strong> <strong>Minimum</strong> <strong>Nurse</strong> <strong>Staffing</strong> <strong>Ratios</strong> in <strong>Nursing</strong> HomesReport to Congress−193
How many residents do you typically have to feed at mealtimes? Is that workable? Are thereresidents you feel need assistance but don=t get it?How much time do you get to feed residents?<strong>Appropriateness</strong> <strong>of</strong> <strong>Minimum</strong> <strong>Nurse</strong> <strong>Staffing</strong> <strong>Ratios</strong> in <strong>Nursing</strong> HomesReport to Congress−194
Probe for differences between types <strong>of</strong> residents, i.e., those without feeding/swallowingproblems but needing some assistance, those with feeding problems and needing someassistance, those who need total assistance, etc.How is your helping residents eat their meals affected by procedures in your facility?Probes:NAs have to deliver trays to resident roomsAll residents must be fed in the dining roomDo you feel the time you get to feed the residents is adequate? If not, how much time would you(reasonably) like to have?Probe for differences among types <strong>of</strong> residents (i.e., minimal assistance, full assistance,feeding/swallowing problems, etc.)Changes in Resident Acuity and <strong>Staffing</strong> (5 minutes)Has the acuity <strong>of</strong> residents in your facility changed over the last three years? If yes, how are theresidents different now?How has this change in acuity affected the way you do your job and/or the way you feel aboutyour job?Has staffing changed since the acuity changed? <strong>In</strong> what ways?Do you feel you and the other <strong>Nurse</strong> Aides have the time and training necessary to care for thesesicker residents? What training do you need, i.e., what do you need to know that you don=t nowknow?Concluding Question (5 minutes)What do you like best about being a NA? What is the most difficult aspect <strong>of</strong> being a NA?*** At the end <strong>of</strong> the session before everyone leaves, ask the participants if they have anyquestions for Allison or Karen.<strong>Appropriateness</strong> <strong>of</strong> <strong>Minimum</strong> <strong>Nurse</strong> <strong>Staffing</strong> <strong>Ratios</strong> in <strong>Nursing</strong> HomesReport to Congress−195
APPENDIX E<strong>Appropriateness</strong> <strong>of</strong> <strong>Minimum</strong> <strong>Nurse</strong> <strong>Staffing</strong> <strong>Ratios</strong> in <strong>Nursing</strong> HomesReport to Congress−196
Medicaid Cost Report DataMedicaid Cost Report data were obtained directly from New York, Texas, and Ohio for the years1995, 1996 and 1997. Because the Medicaid Cost Report data for these three states reportedhours for Directors <strong>of</strong> <strong>Nursing</strong>, RNs, LPNs, and nurses aides hours, it was relativelystraightforward to create measures <strong>of</strong> nursing hours <strong>of</strong> resident day. The tables below show howmeasures <strong>of</strong> nursing hours per resident day were created using the Medicaid Cost Report datafrom the three states.Facilities report their costs annually to their state reimbursement agency, and states may usepenalties against facilities misreporting data. Because the cost reports are desk audited andassociated with facility reimbursement and because there are punitive measures associated withmisrepresenting information, the Medicaid cost report data are considered quite accurate.New YorkNew York Medicaid(T19) dataNYRNPRDNYLPNPRDNYAIDPRDNYTOTPRDGeneral conversion: convert facility level staff time to staffing hours per resident dayNumber <strong>of</strong> RN hours worked per year at the residential health care facility(A0146051) divided by the patient days for the year in the residential health carefacility (A0094051)Number <strong>of</strong> LPN hours worked per year at the residential health care facility(A0148051) divided by the patient days for the year in the residential health carefacility (A0094051)Number <strong>of</strong> Aide hours worked per year at the residential health care facility(A0150051) divided by the patient days for the year in the residential health carefacility (A0094051)Sum NYRNPRD, NYLPNPRD and NYAIDPRDOhioOhio Medicaid(T19) dataOHRNPRDOHLPNPRDOHAIDPRDGeneral conversion: convert facility level staff time to staffing hours per resident dayNumber <strong>of</strong> RN hours worked for the year at the nursing facility divided by the patient days forthe year (DE_10440). Not including RN DON hours. Variables are RN charge nurses,DE_54140 and DE_54150, and other RNs DE_54220 and DE_54230.Number <strong>of</strong> LPN hours worked per year at the nursing facility divided by the patient days for theyear (DE_10440). Not including LPN DONs. Variables are LPN charge nurses, DE_54180 andDE_54190, and other LPNs, DE_54260 and DE_54270.Number <strong>of</strong> Aide hours worked per year at the nursing facility divided by the patient days for theyear (DE_10440). Aide Variables are DE_54300 and DE_54310.OHTOTPRDSum OHRNPRD, OHLPNPRD and OHAIDPRD<strong>Appropriateness</strong> <strong>of</strong> <strong>Minimum</strong> <strong>Nurse</strong> <strong>Staffing</strong> <strong>Ratios</strong> in <strong>Nursing</strong> HomesReport to Congress−197
TexasTexas Medicaid(T19) dataGeneral conversion: convert facility level staff time to staffing hours per resident dayTXRNPRD Number <strong>of</strong> RN hours worked per pay period at the nursing facility (1995/96: r355; 1997:r367) divided by the patient days for that pay period (1995/96: r385 1997: r364)TXLPNPRD Number <strong>of</strong> LPN hours worked per pay period at the nursing facility (1995/96: r359; 1997:r369) divided by the patient days for that pay perios (1995/96: r385; 1997: r364)TXAIDPRD Number <strong>of</strong> Aide hours worked per pay period at the nursing facility (1995/96: r363; 1997:r373) divided by the patient days for that pay perios (1995/96: r385; 1997: r364)TXTOTPRDSum TXRNPRD, TXLPNPRD and TXAIDPRD<strong>Appropriateness</strong> <strong>of</strong> <strong>Minimum</strong> <strong>Nurse</strong> <strong>Staffing</strong> <strong>Ratios</strong> in <strong>Nursing</strong> HomesReport to Congress−198
APPENDIX F<strong>Appropriateness</strong> <strong>of</strong> <strong>Minimum</strong> <strong>Nurse</strong> <strong>Staffing</strong> <strong>Ratios</strong> in <strong>Nursing</strong> HomesReport to Congress−199
APPENDIX FTable F1 Diagnoses and covariates used for hospital transfer measuresQualityMeasure ICD-9-CM Covariate ICD-9-CMRespiratoryinfections466.0; 480.0-487.8;507.0COPD; Chronic asthmaticbronchitis; Emphysema;Asthma; Bronchiectasis;Dysphagia491.0-492.8; 493.0-494; 496;787.2Sepsis 038.0-038.9 Diabetes; Cancer; HIV 250.00-250.91;140-208.9;042; 795.71UTI 590.00-590.9; 595.89;595.0-595.4+; 595.89;595.9; 597.0; 598.00; 598.01;599.0; 601.0-604Diabetes; Quadriplegia;Paraplegia; Coma;Urinary retention250.00-250.91;344.0; 344.1; 780.0; 788.2Electrolyteimbalance276.0-276.9 CHF; RF; HTN with RFand/or CHF428.0-428.9;398.91;584.5-586;402.01-402.11; 402.91;403.01; 403.11; 403.91;404.01-404.03; 404.11-404.13; 404.91-404.93CHF 428.0-428.9; 398.91 Diabetes;Chronic respiratory disease250.00-250.91;491.0-492.8; 493.0-494; 496<strong>Appropriateness</strong> <strong>of</strong> <strong>Minimum</strong> <strong>Nurse</strong> <strong>Staffing</strong> <strong>Ratios</strong> in <strong>Nursing</strong> HomesReport to Congress−200
Table F2 Distributional characteristics <strong>of</strong> staffing and quality measures for 1997FirstMeasure<strong>Minimum</strong> Quartile MedianThirdQuartileMaximumNew York<strong>Staffing</strong> (in hours per resident day)Aide 0.18 1.82 2.08 2.27 3.01LPN 0.03 0.45 0.61 0.77 1.42RN
Table F3 Barthel index matched to MDS + (version 12/90 B and 92)ADLBarthel ScoreMDS + 90BVariableMDS + 92VariableFeeding 10 <strong>In</strong>dependent h1e = 0 h1e = 05 Some help h1e = 1,2 h1e = 1,20 Dependent h1e = 3,4,8 h1e = 3,4,8Transfer 15 <strong>In</strong>dependent h1b = 0,1 h1b = 0,110 Minimal assistance or stand-by assistance h1b = 2 h1b = 25 Moderate to maximum h1b = 3 h1b = 30 Dependent h1b = 4,8 h1b = 4,8Grooming 5 <strong>In</strong>dependent h1g = 0,1 h1g = 0,10 Assistance h1g = 2,3,4,8 h1g = 2,3,4,8Toileting 10 <strong>In</strong>dependent h1f = 0,1 h1f = 0,15 Some help h1f = 2 h1f = 20 Assistance h1f = 3,4,8 h1f = 3,4,8Bathing 5 <strong>In</strong>dependent h3a1 = 0,1 h4a1 = 0,10 Assistance h3a1 = 2,3,4,8 h4a1 = 2,3,4,8Walking 15 <strong>In</strong>dependent for 50 yards h1c = 0 and h6c= 0 h1c = 0and h8c = 010 Minimal assistance for 50 yards h1c = 1,2 h1c = 1,25 <strong>In</strong>dependent in wheel chair h1c = 0,3,4,8and h6c = 10 Dependent h1c = 3,4,8and h6c = 0h1c = 0,3,4,8and h8c = 1h1c = 3,4,8and h8c = 0Dressing 10 <strong>In</strong>dependent h1d = 0,1 h1d = 0,15 Some help h1d = 2 h1d = 20 Dependent h1d = 3,4,8 h1d = 3,4,8Bowel 10 <strong>In</strong>dependent i1a = 0 i1a = 0Continence 5 Help with suppository i1a = 1,2 i1a = 1,20 Dependent i1a = 3,4 i1a = 3,4Bladder 10 <strong>In</strong>dependent i1b = 0 i1b = 0Continence 5 Occasional incontinence/some assistance i1b = 1,2 i1b = 1,20 Dependent i1b = 3,4 i1b = 3,4<strong>Appropriateness</strong> <strong>of</strong> <strong>Minimum</strong> <strong>Nurse</strong> <strong>Staffing</strong> <strong>Ratios</strong> in <strong>Nursing</strong> HomesReport to Congress−202
Table F4 Distributional characteristics <strong>of</strong> staffing and quality measures for 1996FirstQuality Measure<strong>Minimum</strong> Quartile MedianThirdQuartileMaximumNew York<strong>Staffing</strong> (in hours per resident day)Aide 0.19 1.81 2.05 2.23 3.23LPN 0.02 0.43 0.59 0.74 1.17RN 0.01 0.19 0.30 0.43 1.43RN+LPN 0.11 0.76 0.90 1.06 1.65Quality Measures (% <strong>of</strong> residents with each outcome)<strong>In</strong>cident pressure ulcers0 3.24 4.89 6.48 14.63(Stage 2-4)Functional improvement 0 6.83 11.13 18.10 66.67Resisting care improvement 0 11.11 28.57 50.00 100.00Ohio<strong>Staffing</strong> (in hours per resident day)Aide 0.55 1.89 2.17 2.47 4.97LPN 0 0.59 0.73 0.93 2.48RN 0 0.34 0.46 0.61 3.73RN+LPN 0 1.04 1.22 1.43 5.41Quality Measures (% <strong>of</strong> residents with each outcome)<strong>In</strong>cident pressure ulcers0 2.02 3.52 5.37 15.22(Stage 2-4)Functional improvement 0 4.76 7.33 10.71 38.46Resisting care improvement 0 8.33 20.00 37.50 100.00Table F5 Distributional characteristics <strong>of</strong> staffing and quality measures for primary dataMeasure<strong>Minimum</strong>FirstQuartile MedianThirdQuartileMaximum<strong>Staffing</strong> (in hours per resident day)Aide 0.71 1.55 1.92 2.42 3.96LPN 0.09 0.41 0.62 0.80 1.75RN 0.06 0.28 0.48 0.67 1.04RN+LPN 0.52 0.84 1.09 1.29 2.33Quality Measures (% <strong>of</strong> admissions hospitalized due to each condition)Significant weight loss 0 5.13 8.33 14.71 28.95Unclean and/or ungroomed 0 2.50 5.26 10.00 45.00<strong>Appropriateness</strong> <strong>of</strong> <strong>Minimum</strong> <strong>Nurse</strong> <strong>Staffing</strong> <strong>Ratios</strong> in <strong>Nursing</strong> HomesReport to Congress−203
APPENDIX G<strong>Appropriateness</strong> <strong>of</strong> <strong>Minimum</strong> <strong>Nurse</strong> <strong>Staffing</strong> <strong>Ratios</strong> in <strong>Nursing</strong> HomesReport to Congress−204
DEPARTMENT OF HEALTH & HUMAN SERVICESHealth Care Financing AdministrationDecember 6, 1999Center for Medicaid and State Operations7500 Security BoulevardBaltimore, MD 21244-18502349 S. Four St.Fort Lewis, WA. 98433Dear Lt. Col. Richard Harper,You will find enclosed a very brief description <strong>of</strong> a study we are conducting for a Report toCongress on the appropriateness <strong>of</strong> nursing home minimum nurse staffing ratios. As part <strong>of</strong> thisstudy, we are reviewing the relevance <strong>of</strong> already developed nurse staffing systems. You havebeen referred to us as someone who is familiar with one such system, the US Army WorkloadManagement System for <strong>Nursing</strong> (WMSN). As part <strong>of</strong> our review, we would like to receivefrom you a written response to three fundamental questions about the WMSN. After we receiveyour response, we would like to call you and ask a few follow-up questions. The questions are:1. What is your position, role, or function with respect to the WMSN? How familiar areyou with this system?2. What is the evidence supporting this system? Most important, can you send or referus to a key article, report, or document that provides the supporting evidence?3. Do you think the WMSN is applicable to the impaired population typically found inU.S. nursing homes?As you may know from recent newspaper articles and television reports, there is heightenconcern about staffing problems in nursing homes. Although we do not make any presumptionsabout the study’s conclusions and possible recommendations, we expect it will lead toimprovement in this area. To that end, your assistance in providing information on the WMSN isimportant for completing a truly comprehensive study.We are on a tight schedule with the various sections <strong>of</strong> our report and hope to receive yourresponse to our three questions sometime before January 7, 2000. A brief letter should not takemuch time. If more convenient, an e-mail message would also be sufficient. Should you haveany questions or concerns that you would like to discuss with us, we may be reached at thenumbers listed below. Thank you in advance for your assistance.Sincerely,Marvin Feuerberg, Ph. D.Susan Joslin, RN, MSNAnalyst<strong>Nurse</strong> Consultant(410) 768-6520; mfeuerberg@hcfa.gov (410) 786-3516; sjoslin@hcfa.gov<strong>Appropriateness</strong> <strong>of</strong> <strong>Minimum</strong> <strong>Nurse</strong> <strong>Staffing</strong> <strong>Ratios</strong> in <strong>Nursing</strong> HomesReport to Congress−205
December 7, 199997 Main StreetNew Ipswich, NH 03071DEPARTMENT OF HEALTH & HUMAN SERVICESHealth Care Financing AdministrationCenter for Medicaid and State Operations7500 Security BoulevardBaltimore, MD 21244-1850Dear Mr. Thoms,You will find enclosed a very brief description <strong>of</strong> a study we are conducting for a Report toCongress on the appropriateness <strong>of</strong> nursing home minimum nurse staffing ratios. As part <strong>of</strong> thisstudy, we are reviewing the relevance <strong>of</strong> already developed nurse staffing systems. You havebeen referred to us as someone who is familiar with one such system, a ΑManagement Minutes≅system. As part <strong>of</strong> our review, we would like to receive from you a written response to threefundamental questions about this system. After we receive your response, we would like to callyou and ask a few follow-up questions.The questions are:1. What is your position, role, or function with respect to the development andutilization <strong>of</strong> the Management Minutes system?2. What is the evidence supporting this system? Most important, can you send orrefer us to a key article, report, or document that provides the supportingevidence?3. Do you think the Management Minutes system is applicable to the impairedpopulation typically found in U.S. nursing homes?As you may know from recent newspaper articles and television reports, there is heightenconcern about staffing problems in nursing homes. Although we do not make anypresumptions about the study=s conclusions and possible recommendations, we expect itwill lead to improvement in this area. To that end, your assistance in providing information onthe Management Minutes system is important for completing a truly comprehensive study.We are on a tight schedule with the various sections <strong>of</strong> our report and hope to receive yourresponse to our three questions sometime before January 7, 2000. A brief letter should not takemuch time. If more convenient, an e-mail message would also be sufficient. Should you haveany questions or concerns that you would like to discuss with us, we may be reached at thenumbers listed below. Thank you in advance for your assistance.Sincerely,Marvin Feuerberg, Ph.D.Susan Joslin, MSN<strong>Appropriateness</strong> <strong>of</strong> <strong>Minimum</strong> <strong>Nurse</strong> <strong>Staffing</strong> <strong>Ratios</strong> in <strong>Nursing</strong> HomesReport to Congress−206
AnalystHealth<strong>In</strong>surance Specialist(410) 786-6520; mfeuerberg@hcfa.gov (410) 786-3516; sjoslin@hcfa.gov<strong>Appropriateness</strong> <strong>of</strong> <strong>Minimum</strong> <strong>Nurse</strong> <strong>Staffing</strong> <strong>Ratios</strong> in <strong>Nursing</strong> HomesReport to Congress−207