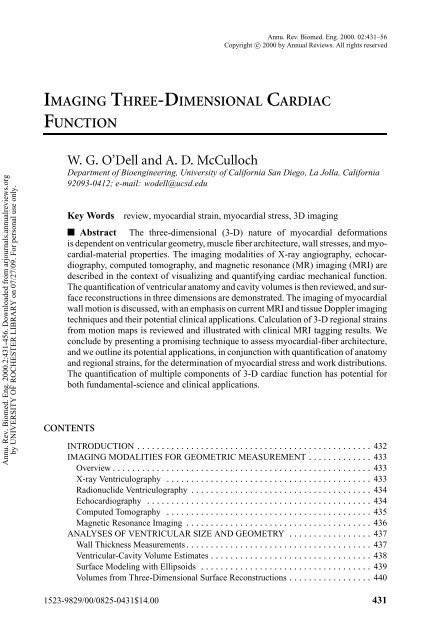
imaging three-dimensional cardiac function - Walter G. O'Dell, PhD
imaging three-dimensional cardiac function - Walter G. O'Dell, PhD
imaging three-dimensional cardiac function - Walter G. O'Dell, PhD

You also want an ePaper? Increase the reach of your titles
YUMPU automatically turns print PDFs into web optimized ePapers that Google loves.
432 O’DELL MCCULLOCHAnnu. Rev. Biomed. Eng. 2000.2:431-456. Downloaded from arjournals.annualreviews.orgby UNIVERSITY OF ROCHESTER LIBRARY on 07/27/09. For personal use only.?INTRODUCTIONDEFORMATION ANALYSIS ....................................... 441Implanted Markers .............................................. 443Magnetic Resonance Imaging Tagging ................................ 443Strain Rate Analysis ............................................. 444Slice Motion Correction .......................................... 445Model-Based Deformation Analysis ................................. 446Limitations of the Reconstructions ................................... 446REGIONAL STRAINS IN DISEASE .................................. 447MEASUREMENT OF THREE-DIMENSIONAL TISSUE ARCHITECTURE ..... 448FUTURE DIRECTIONS ........................................... 449The <strong>three</strong>-<strong>dimensional</strong> (3-D) nature of heart deformation is well appreciated anda subject of great interest both to cardiovascular scientists and clinical cardiologists.The application of clinical <strong>imaging</strong> to <strong>cardiac</strong> <strong>function</strong> has traditionally beenlimited to global geometric measurements, including left ventricular (LV) wallmass, ventricular volume, stroke volume, ejection fraction, and wall thickness(1). These measures of heart <strong>function</strong> provide invaluable diagnostic informationto the clinician regarding the severity of disease and the long-term prognosis(2). The ability to measure regional myocardial deformation provides additionalinformation that is valuable for identifying the location and extent of affectedareas, quantifying the degree of mechanical dys<strong>function</strong>, and differentiating between<strong>function</strong>ally distinct disease states. Among the investigational tools available,visualization and quantification of regional <strong>cardiac</strong> mechanical <strong>function</strong> areperhaps the most direct and reliable indicators of <strong>cardiac</strong> health (3). For example,although quantification of coronary artery patency is important in directingtreatment of regional myocardial ischemia, the existence of severe vessel occlusionis not necessarily associated with insufficient mechanical <strong>function</strong>, owingto myocardial revascularization and ventricular wall remodeling. The realm of3-D <strong>cardiac</strong> mechanical analysis encompasses global and regional myocardial<strong>function</strong>s, 3-D fiber tissue architecture, electrical propagation of activation, thegeneration of internal wall stresses by the contracting myocytes, and the distributionof those stresses by the surrounding tissue matrix. This article describes andcontrasts the prevailing modalities for monitoring 3-D heart <strong>function</strong>, describesthe current techniques for manipulating image data to model <strong>cardiac</strong> anatomyand deformation, and outlines what lies ahead for the field of <strong>function</strong>al <strong>cardiac</strong><strong>imaging</strong>. Length constraints preclude coverage of other areas of <strong>cardiac</strong> <strong>imaging</strong> researchand applications, such as metabolic <strong>imaging</strong> [positron emission tomography(PET) and magnetic resonance spectroscopy (MRS)], electric- and magnetic-field<strong>imaging</strong>, electrical propagation and mechanoelectrical feedback, and perfusion<strong>imaging</strong>.
Annu. Rev. Biomed. Eng. 2000.2:431-456. Downloaded from arjournals.annualreviews.orgby UNIVERSITY OF ROCHESTER LIBRARY on 07/27/09. For personal use only.?IMAGING 3-D CARDIAC FUNCTION 433Various <strong>imaging</strong> modalities exist to measure heart wall geometry. These can becompared objectively by the following criteria: signal quality [indicated by thesignal to noise ratio (SNR)], discrimination between myocardial and neighboringtissue [indicated by the contrast to noise ratio (CNR)], temporal and spatial resolution,susceptibility to image blurring and artifact, acquisition and analysis time,ease of use, relative cost, and availability. For accurate quantification of heart wallgeometry and ventricular volumes, CNR is often the more informative measurebecause it governs the ability to discern tissue boundaries. Spatial resolution is typicallygiven by the pixel dimensions in the two-<strong>dimensional</strong> (2-D) image (voxeldimensions for 3-D); however, for some modalities, such as MR <strong>imaging</strong> (MRI)and computed tomography (CT), the image slice thickness can be comparativelylarge, leading to partial-volume artifacts that diminish the effective in-plane resolution.Temporal resolution relates to both the time interval between successiveimages (temporal sampling rate) and the time over which the data for each imageare acquired (acquisition window). In X-ray <strong>imaging</strong>, motion while the shutter isopen leads to blurring and loss of image quality. In MRI, motion during acquisitioncauses a phase dispersion across the image, creating a characteristic artifact.Generally one needs to acquire data on a time scale that is smaller than thefastest motions of interest. For a typical heart rate of 1 Hz, the duration of isovolumicrelaxation or isovolumic contraction is ∼100 ms; hence a temporal samplingrate of
434 O’DELL MCCULLOCHAnnu. Rev. Biomed. Eng. 2000.2:431-456. Downloaded from arjournals.annualreviews.orgby UNIVERSITY OF ROCHESTER LIBRARY on 07/27/09. For personal use only.?Radionuclide VentriculographyThe theoretical resolution of a film image is dependent on the film grain; however,the effective resolution depends on the relative opacity of neighboring objects, thedispersion of the X-ray beam, and the distances of objects from the X-ray tube focalspot and film. Projection images in orthogonal views depict major heart long- andshort-axis dimensions. X-ray projection <strong>imaging</strong> with contrast is considered to bemildly invasive because of both the contrast injection and the ionizing radiation. Forwall geometry measurements, there are the problems of limited CNR at the cavityboundaries, silhouette hiding of concavities in the ventricular surface, and variousprojection and registration artifacts. In biplanar cineradiographic <strong>imaging</strong>, thereare also technical concerns about temporally and spatially registering the imagesfrom the two cameras. As an example of the potential accuracy of biplanar X-ray<strong>imaging</strong>, when implanted bead markers are imaged in canine subjects, singleplaneviews can distinguish and locate the centers of even partially overlapping1-mm-diameter beads to an accuracy of 0.2 mm (5). However, a typical beadregistration error between two cameras that are oriented perpendicularly to eachother is 0.1 mm (6, 7). Movie film acquisition rates of 60–90 Hz are common. X-rayprojection systems are relatively inexpensive, easy to use, and widely available,and they can provide real-time feedback, but the accumulated radiation dose is aconcern for repeated measurements.Blood-pool or equilibrium radionuclide ventriculography is another commonmodality for estimating ventricular volumes. Erythrocytes are labeled in vivo withthe radioactive tracer technetium-99m. A large-field gamma camera equipped witha low-energy collimator records the number of radio-decay counts, which is proportionalto the number of erythrocytes and, hence, the blood volume. The resultingtime-activity curves are often filtered in time, normalized by the end-diastolic volumecount, and used to compute ejection fraction, peak filling/ejection rates, timeto peak filling/ejection rates, and related indices (8). This technique is easy to useand measures relative volumes without the need for geometric assumptions, but itis susceptible to background signal sources, has relatively low spatial resolution,and is susceptible to variable attenuation during respiration. Long acquisition timesof ∼5 min require a regular <strong>cardiac</strong> rhythm and/or post-processor elimination ofdata from premature beats and temporal and spatial smoothing.Tomographic radionuclide <strong>imaging</strong> or gated blood pool single photon emissionCT (SPECT), was first demonstrated in 1980 (9) but so far has had only limitedclinical application. The SPECT acquisition is accomplished within 30 min, witha rotating gamma camera and 60 projection angles (10). The 3-D images can thenbe reconstructed with conventional CT back-projection algorithms.EchocardiographyAmong the current <strong>cardiac</strong> <strong>imaging</strong> modalities, echocardiography (ECG) is perhapsthe most prevalent because of its cost effectiveness, ease of use, real-time
Annu. Rev. Biomed. Eng. 2000.2:431-456. Downloaded from arjournals.annualreviews.orgby UNIVERSITY OF ROCHESTER LIBRARY on 07/27/09. For personal use only.?IMAGING 3-D CARDIAC FUNCTION 435feedback, portability, and widespread availability. Echocardiographic <strong>imaging</strong> isbased on the partial reflection of acoustic waves at tissue boundaries and echocardiographicimage contrast is governed by the difference in acoustic propertiesbetween adjacent tissues. A pencil-shaped beam (M-mode) is swept though an arcof ∼80 ◦ to create a 2-D image at 16–38 frames/s. Transthoracic <strong>imaging</strong> (in whichthe echocardiographic transducer is manually placed on the skin) can be used toobtain multiple long-axis, short-axis, and oblique-image views, but it is limited toparasternal and apical windows. Transesophageal <strong>imaging</strong> (in which an echocardiographictransducer is inserted into the esophagus) overcomes the windowingconstraints and places the transducer in close proximity to the heart.Many of the limitations of 2-D and M-mode ECG are overcome by 3-D ECG,including limited viewing angles and <strong>imaging</strong> obliquely through the LV wall, andthis method is quickly approaching clinical use (11, 12). In 1990, von Ramm &Smith (13) introduced the first fully 3-D, phased-array <strong>cardiac</strong> ultrasound imager.Currently, 3-D ECG in patients is generally applied by one of two methods:transthoracic <strong>imaging</strong> in multiple views with transducer position registration[with either a mechanical arm or an acoustic spatial-location system (14)]; ortransesophageal <strong>imaging</strong> with either incremental rotation of the transducer at variouslong-axis <strong>imaging</strong> planes or translation of the transducer at various short-axis<strong>imaging</strong> planes (11). A typical transthoracic 3-D ECG <strong>imaging</strong> set, as described byGopal et al (14), is composed of 7–10 short-axis images and is acquired in 6–8 min.Analogous long-axis 3-D image sets acquired from rotated apical views are alsofeasible; a method introduced by Ghosh et al (15) in 1982. 3-D ECG can also beused to assess right ventricular (RV) geometry (16).ECG image quality is limited by relatively low contrast between myocardialand adjacent tissues, fading of the endocardial boundaries (typically, ∼25% ofthe total boundary in a time-elapsed M-mode recording is indiscernible) (17),noise, and related artifacts. With a contracting LV phantom, Lange et al (17)found that the error in volume estimation with multiple parallel ECG slices andSimpson’s rule was 3% at the larger volume (simulating end-diastole) and 4% atthe smaller volume (end-systole). CNR differences account for a discrepancy of9% for the end-diastolic volume and 11% for the end-systolic volume betweenthe ECG-estimated LV volumes and those produced by the more reliable tissueDoppler <strong>imaging</strong> (TDI) method for contour detection (17). Without the additionof contrast agents, ECG CNRs generally tend to be lower than those for MRI andcontrast-enhanced CT.Computed TomographyThe conventional CT scanner consists of an array of detectors and a single X-raysource, which is rotated about the sample. The transmitted fan-shaped X-ray beamis recorded at several angles, and a 2-D image is reconstructed by using a backprojectionalgorithm. Radiographic contrast injection and rapid scanning are commonlyused to improve image quality. CT with contrast offers very good CNR with
436 O’DELL MCCULLOCHAnnu. Rev. Biomed. Eng. 2000.2:431-456. Downloaded from arjournals.annualreviews.orgby UNIVERSITY OF ROCHESTER LIBRARY on 07/27/09. For personal use only.?Magnetic Resonance Imaginghigh spatial resolution (typically 2- × 2- × 5-mm voxel dimensions), high temporalresolution (∼1 s), and the ability to acquire axial images at arbitrary locationsthrough the chest. CT scanners, however, are more expensive and less availablethan ECG imagers. The simultaneous acquisition of multiple 2-D CT images for3-D–image reconstruction was initially demonstrated in 1980, with the dynamicspatial reconstructor [DSR (18)]. The DSR uses multiple X-ray sources with coneshapedbeams and a hemicylindrical fluorescent screen to acquire volumetric datawith high temporal resolution. Whereas the DSR has remained primarily a researchtool, electron-beam CT (EBCT) (19) has become increasingly popular forclinical use. In EBCT, X-rays are produced by scanning a single-source electronbeam onto a tungsten target that is positioned in a semicircle below the patient(20). Mechanical motion in the gantry is eliminated (bypassing the typical 1-sinterscan delay), and exposure times of 50–100 ms are possible. In typical multislicemode, four tungsten target rings and two detector rings are used to acquireup to eight image slices without movement of the patient table, reducing motionartifact. Spiral CT (also known as helical CT) is another emerging techniquefor very rapid acquisition of 3-D image data; with higher spatial but lower temporalresolution than EBCT. Spiral CT <strong>imaging</strong> uses a conventional fan-shapedbeam source, which rotates continuously about the patient, and a fixed array ofreceivers. Contiguous 2-D axial images are acquired as the sample moves alongthe scanner bore. Multiple receivers are often used to acquire four slices simultaneously.Retrospective gating is commonly used in EBCT and spiral CT to reducemotion artifact (21). With both multislice EBCT and multislice spiral CT, 3-Dimage data sets can be acquired in times on the order of seconds—quickly enoughthat susceptibility to remaining motion artifact is significantly reduced. On-linereconstruction algorithms have been developed to aid in the graphical display of3-D CT <strong>cardiac</strong> data sets and in simulating views from obliquely oriented crosssections (22).Magnetic resonance (MR) <strong>imaging</strong> (MRI) both provides high CNRs between softtissues and blood without the injection of contrast agents and enables <strong>imaging</strong> atarbitrary image angles. MRI scans are relatively expensive and time consuming,and they require a certain amount of patient cooperation. In-plane spatial resolutioncan be high (1 × 1 mm); however, the slice thickness is typically 5–10 mm; thusthe images are highly susceptible to partial-volume artifacts. This is problematicespecially towards the heart apex, where the wall slope is high. The quality andresolution of MR <strong>cardiac</strong> images have steadily improved with the inclusion ofbreath holding, black-blood saturation (which improves the contrast between themyocardium and blood in the cavity), rapid <strong>imaging</strong> techniques (i.e. gradient echoand echo-planar <strong>imaging</strong> for quicker acquisition), k-space segmentation (for improvedtemporal resolution), and dedicated <strong>cardiac</strong> radiofrequency receiver coils(for improved SNR) (23). With prospective gating and gradient echo sequences,
Annu. Rev. Biomed. Eng. 2000.2:431-456. Downloaded from arjournals.annualreviews.orgby UNIVERSITY OF ROCHESTER LIBRARY on 07/27/09. For personal use only.?IMAGING 3-D CARDIAC FUNCTION 437the image data for 10–14 temporal images at a single slice location in the heartcan be acquired within a 16- to 20-s breath hold. Breath holds of this duration arefeasible in <strong>cardiac</strong> patients, even those with acute myocardial infarction (3). Theacquisition of cine data for 8–10 short-axis slices thus requires ∼10–15 min, allowingfor patient recovery after each breath hold. Newer sequences, using SMASH(simultaneous acquisition of spatial harmonics) for example (24), can cut this timeby a factor of 2 or 3. MRI can also be used to perform retrospective respiratorygating with navigator echo signals from the diaphragm, although the implementationof this technique is difficult (25). A recent review of MRI applied to <strong>cardiac</strong>motion analysis by McVeigh (25) is highly recommended.LV volume, ejection fraction, and wall thickness are perhaps the most frequentlyused indices of <strong>cardiac</strong> performance and patient prognosis (26, 27). However, thepertinent geometric information must first be extracted from the images before 3-Dsurface reconstruction. The challenge is to detect, within the image, heart contourfeatures that are irregular in shape and position, changing with time, and varying incontrast and whose image intensity gradient profile can change in both magnitudeand sign. Contour segmentation is the most laborious and error-prone part of mostanalysis schemes. Real-time clinical application of modern 3-D <strong>cardiac</strong> mechanicstechniques is going to require faster and better automated segmentation. We referthe reader to the article in this volume of Annual Review of Biomedical Engineeringthat pertains to image segmentation, by Pham et al (27a).LV wall thickness measurements have been linked to regional ischemia (27) andlead to estimates of mean wall stress (28) and mean wall stiffness. Wall thicknessmeasurements were made as early as 1964, by X-ray angiography (4), but morerecently Jakob et al (29) improved the technique by using injected-contrast anddigital-subtraction angiography. In comparison with the more commonly used M-mode ECG, the Jakob method showed good agreement towards end-diastole butpoorer agreement at end-systole.Although wall thickness changes are often the most apparent geometric indicatorof altered mechanical <strong>function</strong> (30), the relationship between wall thickness and<strong>cardiac</strong> health is not as clear. Significant correlations were found by Lawson et al(31) between thallium uptake and systolic wall thickness in ischemic hearts, but notwith diastolic wall thickness and thallium uptake (31, 32). Similarly, Curiel et al(33) found that the magnitude of inotropic reserve is not related to diastolic wallthickness or to basal systolic wall thickening. Heupler et al (34) showed that theLV end-diastolic cavity diameter, not wall thickness, was associated with thalliumperfusion defects and therefore myocardial ischemia. Dong et al (35) concludedANALYSES OF VENTRICULAR SIZE AND GEOMETRYWall Thickness Measurements
438 O’DELL MCCULLOCHAnnu. Rev. Biomed. Eng. 2000.2:431-456. Downloaded from arjournals.annualreviews.orgby UNIVERSITY OF ROCHESTER LIBRARY on 07/27/09. For personal use only.?Ventricular-Cavity Volume Estimatesthat regional and interindividual heterogeneity in wall thickness in diseases suchas hypertrophic cardiomyopathy make meaningful comparisons difficult. Finally,acute changes in wall thickness do not necessarily indicate chronic dys<strong>function</strong>because long-term wall remodeling may act to compensate for mild injury byrestoring wall thickness to normal values, as described by Pouleur et al (36) withLV dilation.The relationship between wall thickening and fiber shortening is also not clear.Wall thickening at various wall depths was shown by Hexeberg et al (30) to correlatenot with fiber shortening or myocardial perfusion in those layers, but withthickening of the entire wall and local wall geometry. McCulloch et al (37) supportedthis conclusion for fiber strains but found that transmural location did havea significant effect on cross-fiber strains.The estimate of the contour location in an image is accurate to within 1–2 mm,typically, with MRI (38). For a 10-mm-thick wall, this error leads to a 10%–20%uncertainty in the thickness estimation. The apparent wall thickness is increasedin planar images that intersect the heart wall at oblique angles to the local surfacenormal, creating a bias in the thickness measurement. Through-plane motion introducesadditional error because the same piece of myocardial tissue is not imagedover time at a fixed cross-sectional location. Both the bias and the through-planemotion artifact can be corrected with 3-D ventricular surface reconstruction byusing data from orthogonal views (see below).Traditionally, the measurement of LV volume by thermodilution techniques (39),projection ventriculography (40), or radionuclide techniques has been subject tosubstantial error, that is, ∼20% (39). Despite many innovations in <strong>imaging</strong> techniquesand computerized analyses, substantial errors of this order remain in clinicalmeasurements of LV volume. Currently, the task of estimating the volume of theventricular cavity often reduces to defining the cavity boundaries and integratingover the enclosed space. Significant, common sources of error are poorly definedbasal and apical limits of the ventricle, oversimplified geometric models, and uncompensated<strong>imaging</strong> artifacts.A common convention is to model the base of the heart as a planar surfacepassing through the mitral valve ring. However, the entirety of the valve planeis not easily imaged with ECG or 2-D CT <strong>imaging</strong> because the mitral valve isobliquely oriented in the chest cavity. With MRI, it is possible to orient the <strong>imaging</strong>plane to encompass the entire mitral valve ring, but, because the slice thicknessis typically 5–7 mm, there is a ±2.5- to 3.5-mm discrepancy in the plane’s exactlocation within the slice. Even if accurately imaged at one time, the mitral valvering translates apically ∼10 mm (41) from end-diastole to end-systole; henceit does not remain within a single, fixed short-axis image volume. For a mitralvalve ring that is 25 mm in diameter (area, 491 mm 2 ), a jump from one slicelocation to the next represents an estimated volume change, using Simpson’s rule,
Annu. Rev. Biomed. Eng. 2000.2:431-456. Downloaded from arjournals.annualreviews.orgby UNIVERSITY OF ROCHESTER LIBRARY on 07/27/09. For personal use only.?IMAGING 3-D CARDIAC FUNCTION 439of 2.5–3.4 ml or ∼6.2%–8.5% of the total end-systolic volume (for a representativeend-systolic volume of 40 ml). Similarly, it is difficult to detect the most apicalintracavitary point by using only short-axis images. Both of these sources of errorcan be overcome by incorporating planar image data from the orthogonal, long-axisview.When referenced to 3-D ECG and equilibrium radionuclide angiography,limited-plane 2-D ECG methods were no better than subjective visual estimationfor determining the LV ejection fraction (14). To compensate for the inherentlimitations, some applications use correction factors that are calibrated to match theknown volume errors as tested on postmortem or experimental heart models (40).However, these correction factors are computed for a “typical” heart geometry thatmay not necessarily be appropriate for abnormal or diseased hearts.Poor CNRs and partial-volume effects both contribute to errors in the segmentationof heart contour data, which are magnified in the LV volume estimate. Fora sphere of radius 25 mm, a typical LV minor-axis radius dimension, an error of1 mm (4%) in the estimated radius leads to a volume estimation error of ∼12%.All <strong>imaging</strong> modalities suffer misregistration of the heart contour data when theimage data are acquired over many heartbeats or different times, as a result ofbeat-to-beat variations in the heart contraction and uncorrected respiration-derivedmotions. With projection images, the contrast silhouette obscures most of the indentationsin the wall (i.e. at the papillary muscle sites), creating an overestimationof the true ventricular dimensions. A comparison between cross-sectional ECG andX-ray ventriculography found that projection <strong>imaging</strong> leads to an overestimationin ejection fraction of 22% (42).When only a few ventricular surface measurements are available, it is convenientto model the LV surface geometry as an ellipsoid. This simplification allows forrapid calculation of volume but disregards the asymmetry of the actual ventricularsurface, the complexity of the mitral valve plane, and the existence of the papillarymuscles. Elliptical models were initially used with projection ventriculography(40), but are now also used commonly with 2-D ECG data (43). The volume of anellipse is given by:V = 4 3 πab2Surface Modeling with Ellipsoidswhere a is the radius along the major axis and b is the radius of the minor axis.For single-plane projections, Dodge (40) used the formulab = A projπawhere b is the minor axis dimension and A proj is the area of the long-axis projection(making V = 4A2 proj). An analogous formula exists for biplanar data. Ellipsoidal3πa
440 O’DELL MCCULLOCHAnnu. Rev. Biomed. Eng. 2000.2:431-456. Downloaded from arjournals.annualreviews.orgby UNIVERSITY OF ROCHESTER LIBRARY on 07/27/09. For personal use only.?Volumes from Three-Dimensional Surface Reconstructionsmodels cannot as readily approximate RV volumes, because their geometry doesnot possess such symmetry (44).The Simpson’s-rule method computes the cavity volume by summing the areasof 2-D planar slices, scaled by the slice separation. The implied geometric assumptionfor this method is that the area of the measured cross-section remains constantover the distance between slices (or at least is representative of the average area),which becomes increasingly error-prone as the slice separation increases. Thereare also the previously mentioned errors associated with the identification of themitral-valve plane, through-plane motion, and registration artifacts. A commonmodification to the volume equation involves reducing the volume contributionof the most apical and/or most basal slices by 50%. Many other variations arecommonly used.Regardless of the modality used to acquire the anatomical data, once these areattained, 3-D surface reconstructions allow more exact descriptions of the heart geometrythan simple elliptical models. Many 3-D surface reconstruction techniquesare also able to incorporate anatomical data from multiple views/projections. Manyrecent advances in 3-D surface reconstruction have been driven by computer visionresearch (45, 46). Piecewise mathematical constructs have also been proposed, including3-D splines and finite-element basis <strong>function</strong>s (47, 48). Deformable sheetor balloon models (3-D extensions of “snakes”) are able to interact directly withfeatures of the images to satisfy both the need to match image data and to smoothout noisy image data. The smoothing is accomplished by incorporating energies associatedwith stretching and bending into the deformable sheet or balloon (49–51).Global polynomial representations are also applicable (52, 53). For example, wehave used a surface model expressed as a polynomial series in prolate spheroidalcoordinates. Here the base geometry is an ellipsoid, to which are superposed spatialmodulations as a <strong>function</strong> of angular position, analogous to spherical harmonics.Mathematically, the radial coordinate λ is represented as a <strong>function</strong> of the circumferentialand longitudinal angles (θ,φ):Here P mlλ =L∑l∑l=0 m=−la j P ml (cos(θ))e imφ (1)are the associated Legendre polynomials. The coefficients a i in the polynomialare fit, in a least-squares sense, simultaneously to contour data pointsfrom multiple views. The goodness/smoothness of the reconstruction can be adjustedto match the expected uncertainty in the contour data, by admitting oromitting higher-order terms in the series, which is achieved by adjusting the serieslimit “L.”Figure 1A (see color insert) shows the fitted endocardial surfaces for a zerothorderfit, that is, the best-fit prolate spheroid. From left to right in the figure,
Annu. Rev. Biomed. Eng. 2000.2:431-456. Downloaded from arjournals.annualreviews.orgby UNIVERSITY OF ROCHESTER LIBRARY on 07/27/09. For personal use only.?Left ventricular endocardial surface-fitted data sets for canine heart. The light lines areFigure 1the raw contour data, and the dark lines are generated from the fitting equation (Equation 1). Top:Top view; bottom: side view. The order of fitting goes from zero-th to third, sixth, and tenth fromleft to right.
Annu. Rev. Biomed. Eng. 2000.2:431-456. Downloaded from arjournals.annualreviews.orgby UNIVERSITY OF ROCHESTER LIBRARY on 07/27/09. For personal use only.?IMAGING 3-D CARDIAC FUNCTION 441additional polynomial terms are added, giving the model increased spatial modulation(for deformable sheets and balloons, this is analogous to decreasing thebending energy). The error between the fitted surface and the original contour datacan be computed as a <strong>function</strong> of the number of fitting parameters. The error willgenerally decrease as the number of fitting parameters increases, but there is apoint at which the inclusion of additional high-order terms would fit the noise tothe data rather than to the actual heart geometry. The combination of data frommultiple views and the spatial and temporal smoothing will filter out noise andmisregistration errors, creating a more accurate representation of the 3-D heartsurfaces.Once the 3-D surface is mathematically reconstructed, the cavity volume andLV mass can be computed numerically. The time required to compute volume estimatesfrom contour data from multiple views and multiple locations is negligiblecompared with the time required for the acquisition and segmentation steps. Inthe example shown in Figure 1D (see color insert), the 49 polynomial coefficientswere fit to >1800 contour points in
442 O’DELL MCCULLOCHAnnu. Rev. Biomed. Eng. 2000.2:431-456. Downloaded from arjournals.annualreviews.orgby UNIVERSITY OF ROCHESTER LIBRARY on 07/27/09. For personal use only.?a nonsymmetric 2-D displacement gradient tensor:by u x , then the displacement gradient is u x /x. The infinitesimal displacementgradient is δu x /δx. If a second degree of motion is added, along a y-axis, then thereis a potential for stretch or compression along this second axis and for rotationand/or shearing in the plane of motion. The complete 2-D motion is described by⎡∂u x∇U = ⎢ ∂x⎣ ∂u y∂x⎤∂u x∂y⎥∂u y⎦∂yAt least <strong>three</strong> points are required to fully describe all of these potential motions inthe neighborhood of a material point. Rigid-body rotations alter the displacementgradient component values, and therefore a rotation-invariant measure of deformationis generally preferred. One such measure is the Lagrangian strain tensor,E, computed asE = 1 2 [(∇U)T × (∇U) {+} (∇U) T {+} (∇U)]Chen et al (52) and Young & Hunter (48) incorporated both surface geometrydata and coronary tree bifurcation points to model epicardial motion and strains.McEachen & Duncan (54) used points of curvature extrema similarly. These methodsused the tracking of these identifiable surface points along with smoothingconstraints to estimate surface point trajectories. For investigational use, Arts et al(55) implanted a total of 14 radiopaque surface markers around the heart and computedcoefficients in a 14-parameter kinematic model of heart motion. Clinically,similar studies with transplanted hearts embedded with tantalum helices have beenperformed by Moon et al (56) and Hansen et al (57), yielding similar results. Thesparseness of the material markers in these studies severely limited the accuracyand application of these methods for strain calculation (6), yet they provided novelshape and shape-change information (50, 58). In canine hearts, Hashima et al (59)achieved much greater material point density by sewing 25 lead beads into theLV free wall. The resulting finite element-derived, nonhomogeneous epicardialstrains showed substantial alteration during occlusion of the left anterior descending(LAD) coronary artery, compared with the nonoccluded state. Nevertheless,the absence of material points within the myocardium limits the conclusions thatcan be drawn from such surface analyses.To compute a local 3-D displacement gradient tensor requires a minimum offour noncoplanar material points (60). The magnitude and rate of change of thesedeformations vary regionally around the heart and throughout the <strong>cardiac</strong> cycle. Toaccurately assess 3-D <strong>cardiac</strong> <strong>function</strong>, one must first be able to define and track asufficient number of material points with adequate spatial and temporal resolution.Spatially, a complete description of the local strain requires a sampling intervalthat is sufficiently small to recover the smallest fluctuations in the motion field.Douglas et al (61) estimated, using spherical models and wall motion data from
Annu. Rev. Biomed. Eng. 2000.2:431-456. Downloaded from arjournals.annualreviews.orgby UNIVERSITY OF ROCHESTER LIBRARY on 07/27/09. For personal use only.?IMAGING 3-D CARDIAC FUNCTION 443canine hearts, that a 3-mm sampling interval through the wall is needed to modeltransmural wall motion in a healthy subject. Less stringent sampling intervals of5–6 mm are needed in the circumferential and longitudinal directions. However, indiseased hearts, in which strong gradients in motion may occur in the border zonebetween healthy and ischemic regions, a higher density of points may be needed.Temporally, some purposes require strain patterns at only a single time point, thatis, from end-diastole to end-systole, to evaluate the strains in the fully contractedstate. However, the evolution of strain may also be critical for clinical diagnosis(62). Strain evolution may give information on the pattern of contraction and revealelectrical conduction pathway abnormalities. This requires the acquisition of dataon a time scale that is smaller than the fastest motions of interest. As suggestedearlier, a temporal resolution limit of 50 ms seems reasonable.One investigational method that has provided valuable research data is the embeddingof arrays of radiopaque markers into the heart wall, which are then imaged byusing biplanar cineradiography. Combining the projection data from two orthogonalviews, one is able to reconstruct the 3-D location of each bead in the array ateach time frame (7). The motion of <strong>three</strong> or more planar beads that are attachedto the surface of the heart give an estimate of the local 2-D surface strain (63, 64).Additional markers at various depths in the heart wall provide the additionalinformation necessary for a complete 3-D motion analysis (65–67). Beads arecommonly arranged in stacks of planar triangles, ∼5 mm on a side, with 4 mm ofseparation between stacks. Imaging a density of beads becomes difficult, but arrayswith 2- to 3-mm separations have been successfully reconstructed. Implanted arraysof sonomicrometers have been used similarly, although their use is generallylimited to 2-D surface studies. The disadvantage of these approaches is the invasivenessof the procedure, which precludes its routine use on human subjects. The implantationsurgery may damage the tissue, the chest wall and pericardium are oftenresected, and the mere presence of several 0.5- to 1-mm-diameter beads through awall 10–15 mm thick may alter the normal mechanical deformations in the subject.An MRI tag is a region of the tissue where the net magnetization has been alteredwith carefully designed radio frequency pulses (3, 68). Upon <strong>imaging</strong>, these alteredregions show good signal contrast compared with neighboring untagged regions.Each tag is created as a 3-D plane that extends through the entire subject, and itis seen as a tag line when imaged in an orthogonal view. Various tag generationschemes have been invented for creating numerous tags in a short amount oftime. The more popular tagging schemes include stacks of parallel lines (69, 70),grids (71), and radial stripes (72). Because the tags result from alterations of themagnetization of the tissue itself, the motion of the tags matches the motion of theunderlying tissue (73, 74).Implanted MarkersMagnetic Resonance Imaging Tagging
444 O’DELL MCCULLOCHAnnu. Rev. Biomed. Eng. 2000.2:431-456. Downloaded from arjournals.annualreviews.orgby UNIVERSITY OF ROCHESTER LIBRARY on 07/27/09. For personal use only.?Strain Rate AnalysisTypically, tags are created at end-diastole when the cavity volumes are largest,and the image data are acquired at 30- to 50-ms intervals as the heart contracts.The altered magnetization persists for ∼0.5 s, based on the T1 magnetizationrelaxation constant of <strong>cardiac</strong> tissue. Therefore, 10–12 images can be acquiredduring the ejection or filling phase of the <strong>cardiac</strong> cycle. The segmentation of tagsis far more easily automated than is the segmentation of the heart contours, becausethe tags are human-made features of the image, for which the location and imageintensity profile can be well predicted (75). The optimal image intensity profileand in-plane separation of tag planes can be computed analytically and have beenvalidated experimentally. For parallel tag data, a tag width of 1–2 pixels with a tagcenter-to-center separation of 6 pixels gives an optimal tag centerline detectionaccuracy (76), which, for a typical image SNR of 15, is
Annu. Rev. Biomed. Eng. 2000.2:431-456. Downloaded from arjournals.annualreviews.orgby UNIVERSITY OF ROCHESTER LIBRARY on 07/27/09. For personal use only.?IMAGING 3-D CARDIAC FUNCTION 445gradient. This method has the advantage over tagging in that each pixel provides aunique motion measurement, and MR phase-contrast <strong>imaging</strong> has great potentialfor reconstructing 3-D motion (80). However, current implementation of phasecontrast<strong>imaging</strong> for 3-D motion measurement is hampered by low SNRs, highsusceptibility to motion artifacts, and, hence, limited accuracy of the reconstructedvelocity profiles.Tissue Doppler Imaging The Doppler shift of the reflected echocardiographicwave also contains velocity information that is analogous to that obtained withMR phase-contrast <strong>imaging</strong>. Doppler ultrasound provides real-time velocity (81)and velocity gradient (82) information about blood and tissue. The frequency shiftspectrum vs time information, presented as a sonogram, reveals the velocity rangeand distribution. The additional motion information from TDI has been shown toimprove, over transthoracic ECG, detection of anomalous conduction pathwaysin patients with Wolff-Parkinson-White syndrome (83). However, velocity informationis obtained only in the direction parallel to the echo beam and CNR noise(Doppler speckle), and the number of available viewing angles limit the imagequality. Tessler et al (84), using a calibrated 1-D flow phantom, found that theDoppler-measured velocity had a baseline error of 6.8 cm/s (9%–17%) for peakflows that range from 40.5 to 75.3 cm/s. This error was independent of inter- orintraobserver variability or variability that is attributable to different flow probesor the flow phantom. Fleming et al (82) also used a test phantom and showed that3 mm by 3 mm was the smallest region of tissue from which a measurable changein velocity could be detected with Doppler <strong>imaging</strong>.Velocity vector mapping in two and <strong>three</strong> dimensions is theoretically possibleby using additional ECG receivers or by electronically separating a linear arrayreceiver into spatially separate subapertures (85, 86). The unidirectional velocitymagnitudes and the angle difference between the subapertures and the source echoare used to derive the direction and true magnitude of the velocity.Accounting for the full 3-D motion of the heart, particularly the motion throughthe fixed short-axis image plane locations, is crucial for 3-D deformation analysis.The approaches mentioned above can accommodate this need by acquiring3-D tagging or velocity data sets. However, alternatives, such as the slice isolationpresented by Rogers et al (41), can also be used. A related technique involvingsubtraction of positive and negative tagged images has been shown byFischer et al (87). In another approach, WeDeen et al (88) implemented a motionlessmovie scheme, in which the same slice was imaged at the same timein the <strong>cardiac</strong> cycle (to be certain that the same chunk of tissue was always imaged),but the tagging grid (or phase-encoding step) was imparted to the tissueat a sequence of preceding time increments. From this they were able to computethe 2-D Eulerian strain (or strain rate) at that slice location. Hybrid tagging/Slice Motion Correction
446 O’DELL MCCULLOCHAnnu. Rev. Biomed. Eng. 2000.2:431-456. Downloaded from arjournals.annualreviews.orgby UNIVERSITY OF ROCHESTER LIBRARY on 07/27/09. For personal use only.?Model-Based Deformation Analysisvelocity-encoding methods are inherently difficult because the tagged regions oftissue contain no velocity information (are a signal void), and the velocity encodingstep requires a reference and a phase-encoding image; thus it does notoffer an overall time advantage compared with 3-D tagging or 3-D phase-contrast<strong>imaging</strong>.Reconstruction of the 3-D strain field from discrete samples of displacement requiresan interpolation scheme to describe the motion between samples in space, tocorrect for noise in the sampling, and to compute the local displacement gradientsthat are used for strain calculation (unless explicitly stated, considerations for velocityfield and strain rate reconstruction can be assumed to be analogous to thosedescribed here for displacement field and strain reconstruction). The interpolationmethod usually includes a model of the 3-D displacement field. A priori assumptionsof the displacement field can be used to generate a model that contains theexpected modes of motion, and the displacement or velocity samples can be usedto optimize the magnitude and direction of those modes (55).A more general formulation is to use 3-D basis <strong>function</strong>s to describe the localmotion within each element of a finite element model of the heart (89), increasingthe number of degrees of freedom in the reconstruction to the number of localbasis <strong>function</strong>s per element times the number of elements. Taking this globally, amodel containing hundreds of candidate modes can be formulated, and the sampledmotion can be used to solve for the magnitude of those modes over the entireheart. This removes the requirement for a priori assumptions about the modesof motion, useful for reconstructing motions in regions of altered mechanicalstate, such as sites of ischemia. O’Dell et al (53) use a displacement field fittedto a polynomial series in prolate spheroidal coordinates (a 3-D analogy to the2-D surface reconstruction presented earlier) to reconstruct 3-D material pointtrajectories from parallel-tag data sets. As shown in Figure 2 (see color insert), thecontribution of each mode to the overall motion of the heart can be quantified andinterpreted independently by using computer models of the heart (90).Another interesting approach, presented by Denney et al (91), uses samplesof motion along with energy minimization equations that penalize large gradientsin deformation to estimate the motion at each point in a rectangular grid thatencompasses the entire heart. This approach is related to optical-flow techniquesand is a powerful model-free method of computational analysis.Limitations of the ReconstructionsUltimately, the resolution and accuracy of the results from a reconstruction schemeare determined by the deformations of the heart tissue and the density and quality oforiginal motion sampling. First, if the motion is simple, for example, the translationof a solid body, only a few simple parameters and a few samples of motions
Annu. Rev. Biomed. Eng. 2000.2:431-456. Downloaded from arjournals.annualreviews.orgby UNIVERSITY OF ROCHESTER LIBRARY on 07/27/09. For personal use only.?Top six deformation modes from high-density healthy human left ventricular data set,Figure 2demonstrated on a computer-generated model. λ is the radial coordinate, φ is the longitudinalangle–coordinate,and θ is the circumferential angle. (1) ∂φ = constant; longitudinal contraction ofthe base of the heart toward apex. (2) ∂λ=constant; concentric contraction without wall thickening.(3) ∂θ = cos(φ); clockwise twist of the apex with respect to the base. (4) ∂θ =sin(θ)sin(φ);circumferential contraction toward lateral wall. (5) ∂φ =cos(φ); longitudinal contraction towardthe equator. (6) ∂λ=sin(φ)cos(θ); bulging of the lateral free-wall.
Annu. Rev. Biomed. Eng. 2000.2:431-456. Downloaded from arjournals.annualreviews.orgby UNIVERSITY OF ROCHESTER LIBRARY on 07/27/09. For personal use only.?IMAGING 3-D CARDIAC FUNCTION 447are needed. However, for the complex, 3-D heart wall motion, with high-ordertransmural gradients in the displacement field and spatial heterogeneity (i.e. fromseptum to free wall and base to apex), many global degrees of freedom are requiredto describe the motion around a given material point.To describe the trajectory and strain environment of a given material point (e.g.to within 0.3-mm 3-D tracking accuracy) requires many parameters in a localdeformation model or perhaps >100 in a global model. However, the resolutionand accuracy one actually needs for a given purpose may be considerably lessstringent. Models based on a priori assumptions and a few simple expected modesmay give sufficient information in an efficient manner.Upon successful image segmentation, a typical MRI parallel-tagging data setgenerates 3000–10,000 samples of 1-D displacement. Points along tag lines areobtained typically at 1- or 2-mm intervals. In the clinical setting, the separationbetween tags is typically 6–7 mm, the distance between contiguous image slicesis often 7–10 mm, and hence the 3-mm sampling criterion estimated by Douglaset al (61) is not met in all directions. Experimental conditions, however, can affordgreater image quality and spatial resolution and can overcome these limitations.The ultimate clinical goal of 3-D <strong>cardiac</strong> deformation analysis is to quantify andcharacterize regions of altered mechanical <strong>function</strong>. Figure 3 (see color insert)compares subendocardial and subepicardial circumferential strains at end-systole(referenced to end-diastole) in a patient with LV anterior-wall dys<strong>function</strong> thatis secondary to ischemia. This region is typically supplied by the LAD coronaryartery; therefore, we can postulate that there is a critical occlusion of that artery.In the central ischemic zone, the circumferential strain is positive, indicating thatthe region is undergoing stretch or bulging in response to the contraction of theneighboring healthy tissue and the imposed cavity pressure.For clinical application, the primary concern is whether the tissue is viable. Ifthe tissue were necrotic, then an aggressive and expensive treatment paradigm,e.g. open-chest coronary graft surgery, would not be beneficial. However, if it canbe shown that the tissue is yet viable, then restoration of normal circulation willpresumably restore normal <strong>cardiac</strong> <strong>function</strong>. The secondary issue is to quantify thedegree of dys<strong>function</strong>. A patient exhibiting only a 20% loss of contractile <strong>function</strong>can perhaps be treated with a less aggressive, less expensive pharmacologicregimen, whereas a patient with an 80% loss of regional <strong>function</strong> will perhapsneed more immediate aggressive therapy, such as balloon angioplasty, to restorevascular patency.Dobutamine or adenosine stress testing has been suggested for noninvasive detectionof viable but noncontracting (hibernating) myocardium in conjunction withMRI motion tracking. Croisille et al (92) found improved <strong>function</strong> in response toREGIONAL STRAINS IN DISEASE
Annu. Rev. Biomed. Eng. 2000.2:431-456. Downloaded from arjournals.annualreviews.orgby UNIVERSITY OF ROCHESTER LIBRARY on 07/27/09. For personal use only.?Three-<strong>dimensional</strong> rendering of end-systolic circumferential strain derived from mag-Figure 3netic resonance <strong>imaging</strong> tagging in a patient with left anterior descending coronary arteryassociatedischemia. Sub-endocardial (left) and sub-epicardial (right) strains are shown. Positivestrain (stretching) is indicated by dark blue, and negative strain is rendered in bright yellow. Range,0.2 to −0.2. MRI data provided by E McVeigh, Johns Hopkins University School of Medicine.
448 O’DELL MCCULLOCHAnnu. Rev. Biomed. Eng. 2000.2:431-456. Downloaded from arjournals.annualreviews.orgby UNIVERSITY OF ROCHESTER LIBRARY on 07/27/09. For personal use only.inotropic stimulation in at-risk regions of canine hearts subject to LAD occlusionand reperfusion. Regions of unchanged <strong>function</strong> after dobutamine infusionwere shown to correlate with areas of infarction as evidenced by TTC staining.?Hopefully, conclusive clinical test results will soon be forthcoming.MEASUREMENT OF THREE-DIMENSIONAL TISSUEARCHITECTUREThe heart has a complex 3-D anatomy that plays a significant role in the generationof 3-D wall deformation (93). There exists a predominant fiber directionthat is nearly completely confined to a circumferential-longitudinal plane, with anin-plane angle with respect to the heart long-axis that varies nearly linearly withwall depth. However, conflicting theories remain as to the tertiary structure of thefibers. The dissections and histological findings of LeGrice et al (94) suggest alaminar structure of the fiber bundles, with loose collagen connections betweenbundles of 4–5 fibrils. They found that the laminar or sheet arrangement is consistentamong canine subjects and hypothesized that the sheets facilitate largewall shears and increased wall thickening during contraction. A dilemma for anyanatomical study is that intervention distorts the underlying 3-D fiber structure,and, hence, conclusions about the intact structure are suspect. Yet, dissection andhistological sectioning remain the gold standards for elucidating the 3-D fiberarchitecture.Considerable data on fiber structure in canines have been presented by Streeter& Hanna (93) and LeGrice et al (94), but these findings do not necessarily applyto the human heart. Owing to difficulties in obtaining suitable human hearts andin performing the histological sectioning, detailed 3-D fiber structure analysis fora human heart has yet to be performed.A recent application of MR phase-sensitive <strong>imaging</strong> is now finding use formeasurement of myocardial fiber architecture. MR diffusion-sensitive <strong>imaging</strong>uses phase-contrast <strong>imaging</strong> techniques, but these are tailored to motions on thescale of free-water diffusion. The tissue sample is spatially marked by applyinga magnetic field gradient for a short period of time, creating a linear dispersionof the phase of the tissue magnetization across the sample along the direction ofthe applied gradient field. Nuclei that subsequently move will carry their phaseinformation to the new location. A refocusing gradient then resets the stationaryspins to their original phase state.In a population of nuclei, random motion that is parallel to the applied gradientfield will cause a dispersion of phase around the stationary-phase value and a correspondingdecrease in pixel intensity that varies exponentially with the square ofthe magnitude of the applied gradient (assuming that restricted diffusion effectscan be ignored). The coefficient of that exponential is the diffusion coefficient. Thelonger the average displacement of the population, the greater the spread in thephase, the greater the signal attenuation, and the larger the diffusion coefficient.
Annu. Rev. Biomed. Eng. 2000.2:431-456. Downloaded from arjournals.annualreviews.orgby UNIVERSITY OF ROCHESTER LIBRARY on 07/27/09. For personal use only.?IMAGING 3-D CARDIAC FUNCTION 449For many biological tissues, the diffusion coefficient is different for different directions.In <strong>three</strong> dimensions, this is described fully by the local diffusion tensor.Phase dispersion mapping with measured diffusion coefficients in six nonparalleldirections (the diffusion tensor is symmetric) can be used to estimate the local 3-Ddiffusion tensor (95).From a tissue standpoint, the free diffusion of water is hypothesized to occurmore readily in a direction more parallel to the local fibers than perpendicular.Studies by Hsu et al (96) in dogs and Scollan et al (97) in rabbits have shown thatthe principal direction of maximal diffusion is related to the local myocardial fiberdirection, with a 12 ◦ uncertainty, using histological sectioning as a guide. Scollanet al (97) go on to describe a qualitative relationship between the laminar fiberarchitecture and the remaining diffusion eigen components. Reese et al (98) haveapplied such techniques to in vivo canine and human subjects. With this technology,it should be possible to noninvasively measure the 3-D fiber architecture in the samehearts that are used for mechanical testing. This will be especially enlightening incertain disease states where interindividual variation in fiber architecture can belarge and unpredictable.The 3-D nature of heart deformation is dependent on the 3-D ventricular geometry,regional myocardial strain, 3-D fiber tissue architecture, and internal wall stresses.We have shown examples of promising techniques to independently assess heartanatomy, regional strains, and fiber architecture. The additional measurements ofmyocardial stresses would enable analysis of the myocardial work output, whichrelates to the metabolic requirements of the tissue, including oxygen consumption(99). It is not yet possible to directly measure myocardial stresses in vivo withoutdestroying the tissue or significantly altering the measurement (100). However,it has been shown that pulsed Doppler ultrasound (101) can provide an estimateof tissue stiffness because the speed of propagation (and hence wavelength) ofthe ultrasonic beam varies with stiffness. This approach, however, suffers fromthe typical limitations of TDI. The promising method of MR elastography, introducedby Muthupillai et al (102), combines ultrasonic oscillating mechanicalsurface stress waves (at 10–1100 Hz) with MR phase-sensitive <strong>imaging</strong> to monitorthe propagation of the ultrasonic beam through tissue, with increased sensitivityand clarity compared with Doppler ultrasound. These techniques have yet to besuccessfully applied to the in vivo heart.The approach that has seen some success is to estimate the stress-strain behaviorof heart tissue by computational modeling (103). It is conceivable to use an inverseapproach to fit constitutive law parameters from measured strains. Moulton et al(104) have shown the potential of such an approach by using a simplified constitutivelaw and finite element modeling of a 2-D cross section of tissue. The finiteelement model was loaded with approximated 2-D surface tractions and allowedFUTURE DIRECTIONS
450 O’DELL MCCULLOCHAnnu. Rev. Biomed. Eng. 2000.2:431-456. Downloaded from arjournals.annualreviews.orgby UNIVERSITY OF ROCHESTER LIBRARY on 07/27/09. For personal use only.to deform by the laws of equilibrium. The error was computed between the finiteelement-predicted strain field and that measured with an MRI tagging grid over thatslice, and the constitutive law parameters were varied to achieve a minimal strain?error. This approach is analogous to that used by Guccione et al (105), who usedan axisymmetric 3-D finite-element model and transversely isotropic constitutivelaw to match 3-D strains measured at a single site, using radiopaque markers andcineradiography. When fully 3-D geometric representations are considered, includingfiber anatomy and material anisotropy, compressibility, and heterogeneity,this approach still involves substantial computational time. It is also conceivableto design an inverse approach based on matching measured surface tractions andstress equilibrium constraints (106), but this is highly susceptible to uncertaintiesin the strain field and all of the 3-D properties.Just as new modalities for <strong>imaging</strong> <strong>cardiac</strong> structure and <strong>function</strong> are aiding thecomputational estimation of myocardial stress and work, a priori knowledge ofmyocardial mechanics can be used to improve image segmentation and analysis.Duncan et al (107) described the general theory in a recent review, and it could beapplied directly to the finite element-based strain reconstruction methods for MRItagging data by Kraitchman & Young (77) and Young & Axel (89).Apart from improvement in <strong>imaging</strong> individual components of 3-D <strong>cardiac</strong> deformation,the assessment of multiple components during a single <strong>imaging</strong> session(and within a reasonable time frame) is likely to become of increasing interest.Very recently, WeDeen et al (108) have shown preliminary data for measuringboth myocardial strains and fiber direction in hearts from human volunteers andpatients using MRI phase-sensitive <strong>imaging</strong> and MR diffusion tensor <strong>imaging</strong>.Despite the capabilities available currently, the use of 3-D <strong>cardiac</strong> <strong>function</strong>alanalysis in the clinical setting remains limited. As outlined by the National Institutesof Health Cardiac MRI Work Group (109), the principal reasons for this includelong <strong>imaging</strong> times (compared with single-plane/projection <strong>imaging</strong>), timeconsumingand labor-intensive post-processing requirements (primarily in imagesegmentation), and lack of understanding of benefits by clinicians. To this list canbe added the difficulty in reducing and presenting the resulting voluminous andcomplex 3-D data sets into simple, informative parameters that can be readily usedby the clinician. The challenges are for commercial, academic, and governmentagencies to improve the efficiency of 3-D image acquisition, to bring near real-time3-D display of the processed image data into the examination room, and to performthe necessary clinical studies to demonstrate the capabilities of 3-D <strong>cardiac</strong><strong>function</strong>al <strong>imaging</strong>.ACKNOWLEDGMENTSThe authors acknowledge the many informative discussions and contributions fromPaul Friedman, Sabrina Au, and Elliot McVeigh, and funding support from theAHA and NIH grant HL41603. W. G. O. is supported by an American HeartAssociation Post-Doctoral Fellowship.
Annu. Rev. Biomed. Eng. 2000.2:431-456. Downloaded from arjournals.annualreviews.orgby UNIVERSITY OF ROCHESTER LIBRARY on 07/27/09. For personal use only.?IMAGING 3-D CARDIAC FUNCTION 451Visit the Annual Reviews home page at www.AnnualReviews.orgLITERATURE CITED1. Lamb HJ, Singleton RR, Vandergeest RJ, technology whose time has come. Semin.Pohost GM, Deroos A. 1995. MR <strong>imaging</strong> Nucl. Med. 19:13–21of regional <strong>cardiac</strong> <strong>function</strong>—low-pass filteringof wall thickness curves. Magn. Re-and four-<strong>dimensional</strong> echocardiography.11. Ofili E, Nanda N. 1994. Three-<strong>dimensional</strong>son. Med. 34:498–502Ultrasound Med. Biol. 20:669–752. Levy D, Murabito J, Anderson K, ChristiansenJ, Castelli W. 1992. Echocar<strong>dimensional</strong>echocardiography: clinical12. DeCastro S, Yao J, Pandian N. 1998. Threediographicleft ventricular hypertrophy— relevance and application. Am. J. Cardiol.clinical characteristics—the Framingham 81:G96–102Heart Study. Clin. Exp. Hypertens. A 14: 13. von Ramm O, Smith S. 1990. Real-time85–97volumetric ultrasound <strong>imaging</strong> system. J.3. Reichek N. 1999. MRI myocardial tagging. Digit. Imaging 3:261–66J. Magn. Reson. Imaging 10(5):734–40 14. Gopal A, Shen Z, Sapin P, Keller A,4. Rackley C, Dodge H, Coble Y, Hay R. Schnellbaecher M, et al. 1995. Assessment1964. A method for determining left ventricularmass in man. Circulation 29:666– echocardiography compared with conven-of <strong>cardiac</strong> <strong>function</strong> by <strong>three</strong>-<strong>dimensional</strong>71tional noninvasive methods. Circulation5. Waldman LK, McCulloch AD. 1993. Nonhomogeneousventricular wall strain— 15. Ghosh A, Nanda N, Maurer G. 1982.92:842–53analysis of errors and accuracy. J. Biomechan.Eng. 115:497–502cardiographic images using the rotationThree-<strong>dimensional</strong> reconstruction of echo-6. Hunter W, Zerhouni E. 1989. Imagingdistinct points in the left ventricular 16. Shiota T, Jones M, Chikada M, Fleish-method. Ultrasound Med. Biol. 8:655–61myocardium to study regional wall deformation.In Innovations in Diagnostic Raditime<strong>three</strong>-<strong>dimensional</strong> echocardiographyman C, Castellucci J, et al. 1998. Realology,ed. JH Anderson, pp. 169–90. New for determining right ventricular strokeYork: Springer-Verlagvolume in an animal model of chronic right7. Garrison J, Ebert W, Jenkins R, Yionoulis ventricular volume overload. CirculationS, Malcom H, et al. 1982. Measurement 97:1897–900of <strong>three</strong>-<strong>dimensional</strong> positions and motionsof large numbers of spherical raszewskiR, et al. 1997. Doppler myocardial17. Lange A, Palka P, Caso P, Fenn L, Oldiopaquemarkers from biplane cineradiograms.Comput. Biomed. Res. 15:76–96 a comparative in vitro and in vivo study<strong>imaging</strong> vs. B-mode grey-scale <strong>imaging</strong>:8. Clements I, Sinak L, Gibbons R, Brown M, into their relative efficacy in endocardialO’Connor M. 1990. Determination of diastolicboundary detection. Ultrasound Med. Biol.<strong>function</strong> by radionuclide ventriculog-raphy. Mayo Clin. Proc. 65:1007–199. Moore M, Murphy P, Burdine J. 1980.ECG-gated emission computed tomographyof the <strong>cardiac</strong> blood pool. Radiology134:233–3510. Fischman A, Moore R, Gill J, Strauss H.23:69–7518. Ritman E, Kinsey J, Robb R, GilbertB, Harris L, Wood E. 1980. Three<strong>dimensional</strong><strong>imaging</strong> of heart, lungs, andcirculation. Science 210:273–8019. Hsu T. 1981. Ultra-high-speed tomography:scanning electron beam CT systems.1989. Gated blood pool tomography: a Appl. Radiol. 10:86–88
452 O’DELL MCCULLOCHAnnu. Rev. Biomed. Eng. 2000.2:431-456. Downloaded from arjournals.annualreviews.orgby UNIVERSITY OF ROCHESTER LIBRARY on 07/27/09. For personal use only.?25. McVeigh E. 1996. MRI of myocardial20. McCollough C, Kanal K, Lannutti N,Ryan K. 1999. Experimental determinationof section sensitivity profiles and imagenoise in electron beam computed tomography.Med. Phys. 26:287–9521. Woodhouse C, Tanowitz W, Viamonte M.1997. Retrospective <strong>cardiac</strong> gating techniqueto reduce <strong>cardiac</strong> motion artifact atspiral CT. Radiology 204:566–6922. Sinak L, Hoffman E, Schwartz R, SmithH, Holmes DJ, et al. 1985. Three-<strong>dimensional</strong><strong>cardiac</strong> anatomy and <strong>function</strong> inheart disease in adults: initial results withthe dynamic spatial reconstructor. MayoClin. Proc. 60:383–9223. McVeigh E, Atalar E. 1993. BalancingContrast, Resolution and Signal-to-NoiseRatio. The Physics of MRI, ed. MJ Bronskill,P Sprawls. New York: Am. Assoc.Physicists Med.24. Pettigrew R, Oshinski J, ChatzimavroudisG, Dixon W. 1999. MRI techniques forcardiovascular <strong>imaging</strong>. J. Magn. Reson.Imaging 10(5):590–601<strong>function</strong>: motion tracking techniques.Magn. Reson. Imaging 14:137–5026. D’Cruz IA. 1996. EchocardiographicAnatomy: Understanding Normal andAbnormal Echocardiograms, pp. 312–34.Stamford, CT: Appleton & Lange27. Lieberman A, Weiss J, Jugdutt B,Becker L, Bulkley B, et al. 1981. Two<strong>dimensional</strong>echocardiography and infarctsize: relationship of regional wallmotion and thickening to the extent of myocardialinfarction in the dog. Circulation63:739–4627a. Pham DL, Xu C, Prince JL. 2000. Currentmethods in medical image segmentation.Annu. Rev. Biomed. Eng. 2:315–3728. Mirsky I, Pasipoularides A. 1990. Clinicalassessment of diastolic performance.Prog. Cardiovasc. Dis. V32(N4)291–31829. Jakob M, Hess O, Jenni R, Heywood J,Grimm J, Krayenbuehl H. 1991. Determinationof left ventricular systolic wallthickness by digital subtraction angiography.Eur. Heart J. 12:573–8230. Hexeberg E, Homans D, Bache R. 1995.Interpretation of systolic wall thickening.Can thickening of a discrete layer reflectfibre performance? Cardiovasc. Res. 29:16–2131. Lawson M, Johnson L, Coghlan L, AlamiM, Tauxe E, et al. 1997. Correlationof thallium uptake with left ventricularwall thickness by cine magnetic resonance<strong>imaging</strong> in patients with acute andhealed myocardial infarcts. Am. J. Cardiol.80:434–4132. Perrone-Filardi P, Bacharach S, DilsizianV, Maurea S, Marinneto J, et al.1992. Metabolic evidence of viable myocardiumin regions with reduced wallthickness and absent wall thickening inpatients with chronic ischemic left ventriculardys<strong>function</strong>. J. Am. Coll. Cardiol.20:161–6833. Curiel R, Laurienzo J, Unger E, Panza J.1997. The magnitude of inotropic reserveis unrelated to basal systolic <strong>function</strong> orwall thickness in patients with chronic ischemicleft ventricular dys<strong>function</strong>. Am.J. Cardiol. 80:783–8634. Heupler S, Lauer M, Williams M, Shan K,Marwick T. 1997. Increased left ventricularcavity size, not wall thickness, potentiatesmyocardial ischemia. Am. Heart J.133:691–9735. Dong S, Macgregor J, Crawley A,McVeigh E, Belenkie I, et al. 1994.Left ventricular wall thickness and regionalsystolic <strong>function</strong> in patients withhypertrophic cardiomyopathy—a <strong>three</strong><strong>dimensional</strong>tagged magnetic resonance<strong>imaging</strong> study. Circulation 90:1200–936. Pouleur H, Konstam M, Udelson J,Rousseau M. 1993. Changes in ventricularvolume, wall thickness and wall stressduring progression of left ventricular dys<strong>function</strong>.J. Am. Coll. Cardiol. 22:A43–A48
Annu. Rev. Biomed. Eng. 2000.2:431-456. Downloaded from arjournals.annualreviews.orgby UNIVERSITY OF ROCHESTER LIBRARY on 07/27/09. For personal use only.?IMAGING 3-D CARDIAC FUNCTION 45337. McCulloch A, Sung D, Wilson J, Pavelec 46. Ranganath S. 1995. Contour extractionR, Omens J. 1998. Flow-<strong>function</strong> relations from <strong>cardiac</strong> MRI studies using snakes.during graded coronary occlusions in the IEEE Trans. Med. Imaging 14:328–38dog: effects of transmural location and 47. Costa K, Hunter P, Wayne J, Waldmansegment orientation. Cardiovasc. Res. 37: L, Guccione J, McCulloch A. 1996. A636–45<strong>three</strong>-<strong>dimensional</strong> finite element method38. Bazille A, Guttman M, McVeigh E, ZerhouniE. 1994. Impact of semi-automated myocardium. II. Prolate spheroidal coor-for large elastic deformations of ventricularversus manual image segmentation errors dinates. ASME J. Biomech. Eng. 118:464–on myocardial strain calculation by MR 72tagging. Invest. Radiol. 29:427–33 48. Young A, Hunter P. 1989. Epicardial surfaceestimation from coronary angiograms.39. Levett J, Replogle R. 1979. Thermodilution<strong>cardiac</strong> output: a critical analysis and Comput. Vis. Graph. Image Proc. 47:111–review of the literature. J. Surg. Res. 27(6): 27392–40449. Cohen L, Cohen I. 1993. Finite-element40. Dodge H. 1971. Determination of left ventricularvolume and mass. Radiol. Clin. N. loons for 2-D and 3-D images. IEEE Trans.methods for active contour models and bal-Am. 9(3):459–67Pattern Anal. Mach. Intell. 15:1131–4741. Rogers W, Shapiro E, Weiss J, Buchalter 50. Duncan J, Lee F, Smeulders A, Zaret B.M, Rademakers F, et al. 1991. Quantificationof and correction for left ventricular surement of <strong>cardiac</strong> shape deformity. IEEE1991. A bending energy model for mea-systolic long-axis shortening by magnetic Trans. Med. Imaging 10(3):307–20resonance tissue tagging and slice isolation.Circulation 84:721–31namic finite element surface model for51. McInerney T, Terzopoulos D. 1995. A dy-42. Carr K, Engler R, Forsythe J, Johnson segmentation and tracking in multi<strong>dimensional</strong>medical images with application toA, Gosink B. 1979. Measurement of leftventricular ejection fraction by mechanicalcross-sectional echocardiography. Cir-Imaging Graph. 19:69–83<strong>cardiac</strong> 4D image analysis. Comput. Med.culation 59(6):1196–20652. Chen C, Huang T, Arrott M. 1994. Modeling,analysis, and visualization of left43. Lawson M, Blackwell G, Davis N, RoneyM, Dell’Italia L, Pohost G. 1996. Accuracyof biplane long-axis left ventricular decomposition. IEEE Trans. Pattern Anal.ventricle shape and motion by hierarchicalvolume determined by cine magnetic resonance<strong>imaging</strong> in patients with regional 53. O’Dell WG, Moore CC, Hunter WC, Zer-Mach. Intell. 16(4):342–56and global dys<strong>function</strong>. Am. J. Cardiol. hourni EA, McVeigh ER. 1995. Three<strong>dimensional</strong>myocardial deformations: cal-77:1098–10444. Mogelvang J, Tokholm K, Saunamaki K, culation with displacement field fittingReimer A, Stubgaard M, et al. 1992. Assessmentof left ventricular volumes by 35to tagged MR images. Radiology 195:829–magnetic resonance in comparison with radionuclideangiography, contrast angiog-tracking of left ventricular wall motion.54. McEachen J, Duncan J. 1997. Shape-basedraphy and echocardiography. Eur. Heart J. IEEE Trans. Med. Imaging 16(3):270–8313:1677–8355. Arts T, Hunter W, Douglas A, Muijtjens45. Amini A, Weymouth T, Jain R. 1990. Using A, Reneman R, Corday E. 1992. Descriptionof the deformation of the left ventricledynamic programming for solving variationalproblems in vision. IEEE Trans. PatternAnal. Mach. Intell. 12(9):855–67by a kinematic model. J. Biomech. 25(10):1119–27
454 O’DELL MCCULLOCHAnnu. Rev. Biomed. Eng. 2000.2:431-456. Downloaded from arjournals.annualreviews.orgby UNIVERSITY OF ROCHESTER LIBRARY on 07/27/09. For personal use only.?56. Moon M, Ingels N, Daughters G, StinsonB, Hansen D, Miller D. 1994. Alterationsin left ventricular twist mechanics with inotropicstimulation and volume loading inhuman subjects. Circulation 89:142–5057. Hansen D, Daughters G, Alderman E, IngelsNJ, Miller D. 1988. Torsional deformationof the left ventricular midwall inhuman hearts with intramyocardial markers:regional heterogeneity and sensitivityto the inotropic effects of abrupt ratechanges. Circulation Res. 62:941–5258. Walley K, Grover M, Raff G, Benge J, HannafordB, Glantz S. 1982. Left ventriculardynamic geometry in the intact and openchest dog. Circulation Res. 50:573–8959. Hashima A, Young A, McCulloch A, WaldmanL. 1993. Nonhomogeneous analysisof epicardial strain distributions duringacute myocardial ischemia in the dog. J.Biomech. 26:19–3560. Smaill B, Hunter P. 1991. Material propertiesof passive myocardium. In Theoryof Heath: Biomechanics, Biophysics, andNonlinear Dynamics of Cardiac Function,pp. 1–30. New York: Springer-Verlag61. Douglas A, Hunter W, Wiseman M. 1990.Inhomogeneous deformation as a source oferror in strain measurements derived fromimplanted markers in the canine left ventricle.J. Biomech. 23:331–4162. Lugo-Olivieri C, Moore C, Poon E, LimaJ, McVeigh E, Zerhouni E. 1994. Temporalevolution of <strong>three</strong> <strong>dimensional</strong> deformationin the ischemic human left ventricle:assessment by MR tagging. Proc. Soc.Magn. Reson. 1:148263. MacKey S, Potel M, Rubin J. 1982. Graphicsmethods for tracking <strong>three</strong>-<strong>dimensional</strong>heart wall motion. Comput. Biomed. Res.15:455–7364. McCulloch A, Smaill B, Hunter P. 1989.Regional left ventricular epicardial deformationin the passive dog heart. CirculationRes. 64:721–3365. Douglas A, Rodriguez E, O’Dell W, HunterW. 1991. Unique strain history during ejectionin canine left ventricle. Am. J. Physiol.Heart Circ. Physiol. 260:H1596–61166. Waldman L, Fung Y, Covell J. 1985. Transmuralmyocardial deformation in the canineleft ventricle. Circulation Res. 57:152–6367. Omens J, May K, McCulloch A.1991. Transmural distribution of <strong>three</strong><strong>dimensional</strong>strain in the isolated arrestedcanine left ventricle. Am. J. Physiol. HeartCirc. Physiol. 261:H918–2868. Zerhouni E, Parish D, Rogers W, Yang A,Shapiro E. 1988. Human heart: taggingwith MR <strong>imaging</strong>—a method for noninvasiveassessment of myocardial motion.Radiology 169:59–6369. Mosher T, Smith M. 1990. A DANTE taggingsequence for the evaluation of translationalsample motion. Magn. Reson. Med.15:334–3970. Fischer S, McKinnon G, Maier S, BoesigerP. 1993. Improved myocardial tagging contrast.Magn. Reson. Med. 30:191–20071. Axel L, Dougherty L. 1989. MR <strong>imaging</strong>of motion with spatial modulation of magnetization.Radiology 171:841–4572. Bolster B, McVeigh E, Zerhouni E. 1990.Myocardial tagging in polar coordinateswith striped tags. Radiology 177:769–7273. Moore C, Reeder S, McVeigh E. 1994.Tagged MR <strong>imaging</strong> in a deforming phantom:photographic validation. Radiology190:765–6974. Young A, Axel L, Dougherty L, Bogen D,Parenteau C. 1993. Validation of taggingwith MR <strong>imaging</strong> to estimate material deformation.Radiology 188:101–875. Guttman M, Prince J, McVeigh E. 1994.Tag and contour detection in tagged MRimages of the left ventricle. IEEE Trans.Med. Imaging 13:74–8876. Atalar E, McVeigh E. 1994. Optimum tagthickness for the measurement of motionby MRI. IEEE Trans. Med. Imaging 13:152–6077. Kraitchman D, Young A. 1995. Semiautomatictracking of myocardial motion
Annu. Rev. Biomed. Eng. 2000.2:431-456. Downloaded from arjournals.annualreviews.orgby UNIVERSITY OF ROCHESTER LIBRARY on 07/27/09. For personal use only.?IMAGING 3-D CARDIAC FUNCTION 455in MR tagged images. IEEE Trans. Med. stimulated echoes. Magn. Reson. Med. 33:Imaging 14:422–33401–878. Spencer A. 1980. Continuous Mechanics. 89. Young A, Axel L. 1992. Three-<strong>dimensional</strong>London/New York: Longmanmotion and deformation of the heart79. Pelc NJ, Dragnova M, Pelc LR. 1995. wall: estimation with spatial modulation ofTracking of cyclic motion with phasecontrastcine MR velocity data. J. Magn. Radiology 185(1):241–47magnetization—a model-based approach.Reson. Imaging 5:339–4590. O’Dell WG, McVeigh ER. 1998. A modal80. Drangova M, Zhu Y, Bowman B, Pelc N. description of LV motion during ejection.1998. In vitro validation of myocardial motiontracking from phase-contrast veloc-91. Denney TJ, McVeigh E. 1997. Model-freeProc. Int. Soc. Magn. Reson. Med. 2:876ity data. Magn. Reson. Imaging 16:863– reconstruction of <strong>three</strong>-<strong>dimensional</strong> myocardialstrain from planar tagged MR im-7081. McDicken W, Hoskins P, Moran C, SutherlandG. 1996. New technology in echocar-92. Croisille P, Moore C, Judd R, Lima J, Araiages. J. Magn. Reson. 7(5):799–810diography. 1. Doppler techniques. Heart M, et al. 1999. Differentiation of viable75:2–8and nonviable myocardium by the use of82. Fleming A, Xia X, McDicken W, SutherlandG, Fenn L. 1994. Myocardial velocity old reperfused canine infarcts. Circulation<strong>three</strong>-<strong>dimensional</strong> tagged MRI in 2-day-gradients detected by Doppler <strong>imaging</strong>. Br. 99:284–91J. Radiol. 67:679–8893. Streeter D, Hanna W. 1973. Engineering83. Fedele F, Trambaiolo P, Magni G, DeCastroS, Cacciotti L. 1998. New modalities of left ventricular myocardium. II: Fiber anglemechanics for successive states in canineregional and global left ventricular <strong>function</strong>analysis: state of the art. Am. J. Car-64and sarcomere length. Circ. Res. 33:656–diol. 81:49G–57G94. LeGrice I, Smaill B, Chai L, Edgar S, Gavin84. Tessler F, Kimmesmith C, Sutherland M, J, Hunter P. 1995. Laminar structure of theSchiller V, Perrella R, Grant E. 1990. Interobserverand intra-observer variability of and connective tissue architecture in theheart: ventricular myocyte arrangementDoppler peak velocity measurements— dog. Am. J. Physiol. Heart Circ. Physiol.an in vitro study. Ultrasound Med. Biol. 38:H571–8216:653–5795. Basser P, Mattiello J, LeBihan D. 1994. Estimationof the effective self-diffusion ten-85. Phillips P, Kadi A, von Ramm O. 1995.Feasibility study for a two-<strong>dimensional</strong> diagnosticultrasound velocity mapping sysson.Ser. B 103:247–54sor from the NMR spin echo. J. Magn. Retem.Ultrasound Med. Biol. 21:217–29 96. Hsu E, Muzikant A, Matulevicius S, PenlandR, Henriquez C. 1998. Magnetic res-86. Picot P, Rickey D, Mitchell R, RankinR, Fenster A. 1993. 3-Dimensional colour onance myocardial fiber-orientation mappingwith direct histological correlation.doppler <strong>imaging</strong>. Ultrasound Med. Biol.19:95–104Am. J. Physiol. Heart Circ. Physiol. 43:87. Fischer S, McKinnon G, Scheidegger M, H1627–34Prins W, Maier S, Boesiger P. 1994. True 97. Scollan D, Holmes, A, Winslow R, Fordermyocardial motion tracking. Magn. Reson. J. 1998. Histological validation of myocardialmicrostructure obtained from diffusionMed. 31:401–1388. Wedeen V, Weisskoff R, Reese T, Beache tensor magnetic resonance <strong>imaging</strong>. Am. J.G, Poncelet B, et al. 1995. Motionless Physiol. Heart Circ. Physiol. 44:H2308–movies of myocardial strain-rates using 18
456 O’DELL MCCULLOCHAnnu. Rev. Biomed. Eng. 2000.2:431-456. Downloaded from arjournals.annualreviews.orgby UNIVERSITY OF ROCHESTER LIBRARY on 07/27/09. For personal use only.?98. Reese T, Weisskoff R, Smith R, RosenB, Dinsmore R, WeDeen V. 1995. Imagingmyocardial fiber architechture in vivowith magnetic resonance. Magn. Reson.Med. 34:786–9199. Suga H. 1990. Ventricular energetics.Physiol. Rev. 70:247–77100. McCulloch A. 1995. In Cardiac Biomechanics,ed. JD Bronzino, pp. 418–439.Boca Raton, FL: CRC Press101. Krouskop T, Doughtery D, Vinson F.1987. A pulsed Doppler ultrasonic systemfor making non-invasive measurements ofthe mechanical properties of soft tissue. J.Rehabil. Res. Dev. 24:1–8102. Muthupillai R, Lomas D, Rossman P,Greenleaf J, Manduca A, Ehman R.1995. Magnetic resonance elastographyby direct visualization of propagatingacoustic strain waves. Science 269:1854–57103. McCulloch A, Waldman L, Rogers J,Guccione J. 1992. Large-scale finite elementanalysis of the beating heart. Crit.Rev. Biomed. Eng. 20:427–49104. Moulton M, Creswell L, Downing S, ActisR, Szabo B, Pasque M. 1996. Myocardialmaterial property determinationin the in vivo heart using magnetic resonance<strong>imaging</strong>. Int. J. Cardiol. Imaging12:153–67105. Guccione J, McCulloch A, Waldman L.1991. Passive material properties of intactventricular myocardium determined froma cylindrical model. ASME J. Biomech.Eng. 113:42–55106. O’Dell WG, Hunter WC, McVeigh ER,McCulloch AD. 1997. Determination ofmaterial properties for the passively fillingcanine left ventricle. Ann. Biomed.Eng. 25:(Suppl. 1):S-27107. Duncan J, Shi P, Constable T, Sinusas A.1998. Physical and geometrical modelingfor image-based recovery of left ventriculardeformation. Prog. Biophys. Mol. Biol.69:333–51108. WeDeen V, Tseng W, Reese T, Kantor H,Weisskoff R. 1998. Magnetic resonance<strong>imaging</strong> finds myocardial fiber shorteningand reduced cross-fiber shortening in hypertrophiccardiomyopathy. Circulation98(17):I514 (Suppl.)109. Budinger TF, Berson A, McVeigh ER,Pettigrew RI, Pohost GM, et al. 1998. CardiacMR <strong>imaging</strong>: report of a workinggroup sponsored by the National Heart,Lung, and Blood Institute. Radiology208:573–76
Annual Review of Bimedical EngineeringVolume 2, 2000CONTENTSPIERRE M. GALLETTI: A Personal Reflection, Robert M. Nerem 1PHYSICOCHEMICAL FOUNDATIONS AND STRUCTURALDESIGN OF HYDROGELS IN MEDICINE AND BIOLOGY, N. A.Peppas, Y. Huang, M. Torres-Lugo, J. H. Ward, J. Zhang 9BIOENGINEERING MODELS OF CELL SIGNALING, Anand R.Asthagiri, Douglas A. Lauffenburger 31Annu. Rev. Biomed. Eng. 2000.2:431-456. Downloaded from arjournals.annualreviews.orgby UNIVERSITY OF ROCHESTER LIBRARY on 07/27/09. For personal use only.FUNDAMENTALS OF IMPACT BIOMECHANICS: Part I -Biomechanics of the Head, Neck, and Thorax, Albert I. King 55INJURY AND REPAIR OF LIGAMENTS AND TENDONS, Savio L.-Y.Woo, Richard E. Debski, Jennifer Zeminski, Steven D. Abramowitch,Serena S. Chan Saw, MS, James A. Fenwick 83ELECTROPHYSIOLOGICAL MODELING OF CARDIACVENTRICULAR FUNCTION: From Cell to Organ, R. L. Winslow, D. F.Scollan, A. Holmes, C. K. Yung, J. Zhang, M. S. Jafri 119CRYOSURGERY, Boris Rubinsky 157CELL MECHANICS: Mechanical Response, Cell Adhesion, andMolecular Deformation, Cheng Zhu, Gang Bao, Ning Wang 189MICROENGINEERING OF CELLULAR INTERACTIONS, AlbertFolch, Mehmet Toner227QUANTITATIVE MEASUREMENT AND PREDICTION OFBIOPHYSICAL RESPONSE DURING FREEZING IN TISSUES, JohnC. Bischof 257MICROFABRICATED MICRONEEDLES FOR GENE AND DRUGDELIVERY, Devin V. McAllister, Mark G. Allen, Mark R. Prausnitz 289CURRENT METHODS IN MEDICAL IMAGE SEGMENTATION,Dzung L. Pham, Chenyang Xu, Jerry L. Prince 315ANTIBODY ENGINEERING, Jennifer Maynard, George Georgiou 339NEW CURRENTS IN ELECTRICAL STIMULATION OF EXCITABLETISSUES, Peter J. Basser, Bradley J. Roth 377TWO-PHOTON EXCITATION FLUORESCENCE MICROSCOPY,Peter T. C. So, Chen Y. Dong, Barry R. Masters, Keith M. Berland 399IMAGING THREE-DIMENSIONAL CARDIAC FUNCTION, W. G.<strong>O'Dell</strong>, A. D. McCulloch 431THREE-DIMENSIONAL ULTRASOUND IMAGING, Aaron Fenster,Donal B. Downey 457BIOPHYSICAL INJURY MECHANISMS IN ELECTRICAL SHOCKTRAUMA, Raphael C. Lee, Dajun Zhang, Jurgen Hannig 477WAVELETS IN TEMPORAL AND SPATIAL PROCESSING OFBIOMEDICAL IMAGES, Andrew F. Laine 511
MICRODEVICES IN MEDICINE, Dennis L. Polla, Arthur G. Erdman,William P. Robbins, David T. Markus, Jorge Diaz-Diaz, Raed Rizq,Yunwoo Nam, Hui Tao Brickner, Amy Wang, Peter Krulevitch 551NEUROENGINEERING MODELS OF BRAIN DISEASE, Leif H.Finkel 577EXTRACORPOREAL TISSUE ENGINEERED LIVER-ASSISTDEVICES, Emmanouhl S. Tzanakakis, Donavon J. Hess, Timothy D.Sielaff, Wei-Shou Hu 607Annu. Rev. Biomed. Eng. 2000.2:431-456. Downloaded from arjournals.annualreviews.orgby UNIVERSITY OF ROCHESTER LIBRARY on 07/27/09. For personal use only.MAGNETIC RESONANCE STUDIES OF BRAIN FUNCTION ANDNEUROCHEMISTRY, Kâmil Ugurbil, Gregor Adriany, Peter Andersen,Wei Chen, Rolf Gruetter, Xiaoping Hu, Hellmut Merkle, Dae-Shik Kim,Seong-Gi Kim, John Strupp, Xiao Hong Zhu, Seiji Ogawa 633INTERVENTIONAL AND INTRAOPERATIVE MAGNETICRESONANCE IMAGING, J. Kettenbach, D. F. Kacher, S. K. Koskinen,Stuart G. Silverman, A. Nabavi, Dave Gering, Clare M. C. Tempany, R.B. Schwartz, R. Kikinis, P. M. Black, F. A. Jolesz 661CARTILAGE TISSUE REMODELING IN RESPONSE TOMECHANICAL FORCES, Alan J. Grodzinsky, Marc E. Levenston,Moonsoo Jin, Eliot H. Frank 691IN VIVO NEAR-INFRARED SPECTROSCOPY, Peter Rolfe 715