temperature effects on dissolved oxygen in water - Westminster
temperature effects on dissolved oxygen in water - Westminster
temperature effects on dissolved oxygen in water - Westminster

You also want an ePaper? Increase the reach of your titles
YUMPU automatically turns print PDFs into web optimized ePapers that Google loves.
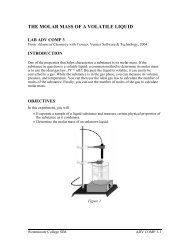
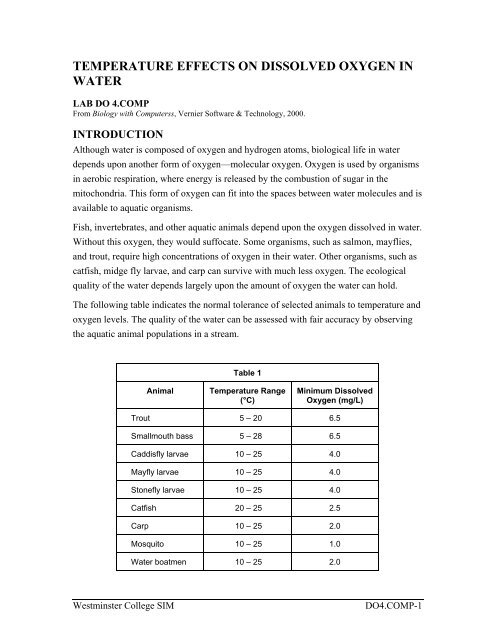
TEMPERATURE EFFECTS ON DISSOLVED OXYGEN INWATERLAB DO 4.COMPFrom Biology with Computerss, Vernier Software & Technology, 2000.INTRODUCTIONAlthough <strong>water</strong> is composed of <strong>oxygen</strong> and hydrogen atoms, biological life <strong>in</strong> <strong>water</strong>depends up<strong>on</strong> another form of <strong>oxygen</strong>—molecular <strong>oxygen</strong>. Oxygen is used by organisms<strong>in</strong> aerobic respirati<strong>on</strong>, where energy is released by the combusti<strong>on</strong> of sugar <strong>in</strong> themitoch<strong>on</strong>dria. This form of <strong>oxygen</strong> can fit <strong>in</strong>to the spaces between <strong>water</strong> molecules and isavailable to aquatic organisms.Fish, <strong>in</strong>vertebrates, and other aquatic animals depend up<strong>on</strong> the <strong>oxygen</strong> <strong>dissolved</strong> <strong>in</strong> <strong>water</strong>.Without this <strong>oxygen</strong>, they would suffocate. Some organisms, such as salm<strong>on</strong>, mayflies,and trout, require high c<strong>on</strong>centrati<strong>on</strong>s of <strong>oxygen</strong> <strong>in</strong> their <strong>water</strong>. Other organisms, such ascatfish, midge fly larvae, and carp can survive with much less <strong>oxygen</strong>. The ecologicalquality of the <strong>water</strong> depends largely up<strong>on</strong> the amount of <strong>oxygen</strong> the <strong>water</strong> can hold.The follow<strong>in</strong>g table <strong>in</strong>dicates the normal tolerance of selected animals to <str<strong>on</strong>g>temperature</str<strong>on</strong>g> and<strong>oxygen</strong> levels. The quality of the <strong>water</strong> can be assessed with fair accuracy by observ<strong>in</strong>gthe aquatic animal populati<strong>on</strong>s <strong>in</strong> a stream.Table 1AnimalTemperature Range(°C)M<strong>in</strong>imum DissolvedOxygen (mg/L)Trout 5 – 20 6.5Smallmouth bass 5 – 28 6.5Caddisfly larvae 10 – 25 4.0Mayfly larvae 10 – 25 4.0St<strong>on</strong>efly larvae 10 – 25 4.0Catfish 20 – 25 2.5Carp 10 – 25 2.0Mosquito 10 – 25 1.0Water boatmen 10 – 25 2.0Westm<strong>in</strong>ster College SIMDO4.COMP-1
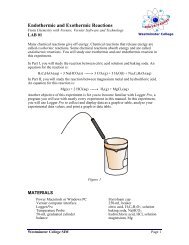
Temperature Effects <strong>on</strong> Dissolved Oxygen <strong>in</strong> WaterPURPOSEThe purpose of this experiment is to study the effect of <str<strong>on</strong>g>temperature</str<strong>on</strong>g> <strong>on</strong> the amount of<strong>dissolved</strong> <strong>oxygen</strong> <strong>in</strong> <strong>water</strong> and to predict the effect of <strong>water</strong> <str<strong>on</strong>g>temperature</str<strong>on</strong>g> <strong>on</strong> aquatic life.MATERIALSLaptop computerVernier computer <strong>in</strong>terfaceVernier Dissolved Oxygen ProbeVernier Temperature ProbeLogger Proice100-mL beaker3, 250-mL beakershot and cold <strong>water</strong>1 gall<strong>on</strong> plastic milk c<strong>on</strong>ta<strong>in</strong>erStyrofoam cupPRE-LAB PROCEDUREImportant: Prior to each use, the Dissolved Oxygen Probe must warm up for a period of10 m<strong>in</strong>utes as described below. If the probe is not warmed up properly, <strong>in</strong>accurateread<strong>in</strong>gs will result. Perform the follow<strong>in</strong>g steps to prepare the Dissolved Oxygen Probe.1. Prepare the Dissolved Oxygen Probe for use.a. Unscrew the membrane cap from the tip of the probe.b. Us<strong>in</strong>g a pipet, fill the membrane cap with 1 mL of DO Electrode Fill<strong>in</strong>gSoluti<strong>on</strong>.c. Carefully thread the membrane cap back <strong>on</strong>to the electrode.d. Place the probe <strong>in</strong>to a c<strong>on</strong>ta<strong>in</strong>er of <strong>water</strong>.Remove membrane cap Add electrode fill<strong>in</strong>g soluti<strong>on</strong> Replace membrane capFigure 12. Plug the Dissolved Oxygen Probe <strong>in</strong>to Channel 1 of the Vernier <strong>in</strong>terface. C<strong>on</strong>nectthe Temperature Probe to Channel 2.Westm<strong>in</strong>ster College SIMDO4.COMP-2
Temperature Effects <strong>on</strong> Dissolved Oxygen <strong>in</strong> Water3. Prepare the computer for data collecti<strong>on</strong> by open<strong>in</strong>g the Experiment 19 folder fromthe Biology with Computers folder of Logger Pro. Then open the experiment filethat matches the probe you are us<strong>in</strong>g. The vertical axis of the graph has <strong>dissolved</strong><strong>oxygen</strong> scaled from 0 to 14 mg/L. The horiz<strong>on</strong>tal axis of the graph has <str<strong>on</strong>g>temperature</str<strong>on</strong>g>scaled from 0 to 50°C. The Meter w<strong>in</strong>dow displays the <strong>dissolved</strong> <strong>oxygen</strong> and<str<strong>on</strong>g>temperature</str<strong>on</strong>g> read<strong>in</strong>gs.4. It is necessary to warm up the Dissolved Oxygen Probe for 10 m<strong>in</strong>utes beforetak<strong>in</strong>g read<strong>in</strong>gs. To warm up the probe, leave it c<strong>on</strong>nected to the <strong>in</strong>terface, withLogger Pro runn<strong>in</strong>g, for 10 m<strong>in</strong>utes. The probe must stay c<strong>on</strong>nected at all times tokeep it warmed up. If disc<strong>on</strong>nected for a few m<strong>in</strong>utes, it will be necessary to warmup the probe aga<strong>in</strong>.5. You are now ready to calibrate the Dissolved Oxygen Probe.• If your <strong>in</strong>structor directs you to use the calibrati<strong>on</strong> stored <strong>in</strong> the experiment file,then proceed to Step 6.• If your <strong>in</strong>structor directs you to perform a new calibrati<strong>on</strong> for the DissolvedOxygen Probe, follow this procedure.Zero-Oxygen Calibrati<strong>on</strong> Po<strong>in</strong>ta. Choose Calibrate from the Experiment menu andthen click .b. Remove the probe from the <strong>water</strong> and place the tipof the probe <strong>in</strong>to the Sodium Sulfite Calibrati<strong>on</strong>Soluti<strong>on</strong>. Important: No air bubbles can betrapped below the tip of the probe or the probe willsense an <strong>in</strong>accurate <strong>dissolved</strong> <strong>oxygen</strong> level. If thevoltage does not rapidly decrease, tap the side ofthe bottle with the probe to dislodge any bubbles.The read<strong>in</strong>gs should be <strong>in</strong> the 0.2- to 0.5-V range.Insert probe atan angleFigure 2c. Type “0” (the known value <strong>in</strong> mg/L) <strong>in</strong> the editbox.d. When the displayed voltage read<strong>in</strong>g for Input 1 stabilizes, click Keep .Submerge probetip 1-2 cmWestm<strong>in</strong>ster College SIMDO4.COMP-3
Temperature Effects <strong>on</strong> Dissolved Oxygen <strong>in</strong> WaterSaturated DO Calibrati<strong>on</strong> Po<strong>in</strong>ta. R<strong>in</strong>se the probe with distilled <strong>water</strong> and gently blot dry.b. Unscrew the lid of the calibrati<strong>on</strong> bottle provided with the probe. Slide the lidand the grommet about 1/2 <strong>in</strong>ch <strong>on</strong>to the probe body.Insert probe <strong>in</strong>tohole <strong>in</strong> grommetScrew lid andprobe back <strong>on</strong>tobottle1/4” of <strong>water</strong><strong>in</strong> bottomFigure 3c. Add <strong>water</strong> to the bottle to a depth of about 1/4 <strong>in</strong>ch and screw the bottle <strong>in</strong>to thecap, as shown. Important: Do not touch the membrane or get it wet dur<strong>in</strong>g thisstep. Keep the probe <strong>in</strong> this positi<strong>on</strong> for about a m<strong>in</strong>ute.d. Type the correct saturated <strong>dissolved</strong>-<strong>oxygen</strong> value (<strong>in</strong> mg/L) from Table 3 (forexample, “8.66”) us<strong>in</strong>g the current barometric pressure and air <str<strong>on</strong>g>temperature</str<strong>on</strong>g>values. If you do not have the current air pressure, use Table 4 to estimate theair pressure at your altitude.e. When the displayed voltage read<strong>in</strong>g for Input 1 stabilizes (read<strong>in</strong>gs should beabove 2.0 V), click Keep and then click OK .f. From the File menu, select Save As and save the current experiment file.PROCEDURE1. Prepare for data collecti<strong>on</strong> by click<strong>in</strong>g Collect .2. Obta<strong>in</strong> two 250-mL beakers. Fill <strong>on</strong>e beaker with ice and cold <strong>water</strong>. Fill the sec<strong>on</strong>dbeaker with warm <strong>water</strong> about 40 – 50°C.Westm<strong>in</strong>ster College SIMDO4.COMP-4
Temperature Effects <strong>on</strong> Dissolved Oxygen <strong>in</strong> Water3. Place approximately 100 mL of cold <strong>water</strong> and a couple small pieces of ice, fromthe beaker filled with ice, <strong>in</strong>to a clean plastic <strong>on</strong>e-gall<strong>on</strong> milk c<strong>on</strong>ta<strong>in</strong>er. Seal thec<strong>on</strong>ta<strong>in</strong>er and vigorously shake the <strong>water</strong> for a period of 2 m<strong>in</strong>utes. This will allowthe air <strong>in</strong>side the c<strong>on</strong>ta<strong>in</strong>er to dissolve <strong>in</strong>to the <strong>water</strong>sample.4. Place the Temperature Probe <strong>in</strong> the Styrofoam cupas shown <strong>in</strong> Figure 4. Place the shaft of theDissolved Oxygen Probe <strong>in</strong>to the <strong>water</strong> and gentlystir. Avoid hitt<strong>in</strong>g the edge of the cup with theprobe.5. M<strong>on</strong>itor the <strong>dissolved</strong> <strong>oxygen</strong> read<strong>in</strong>gs <strong>in</strong> the Meterw<strong>in</strong>dow. Give the <strong>dissolved</strong> <strong>oxygen</strong> read<strong>in</strong>gs ampletime to stabilize (90 – 120 sec<strong>on</strong>ds). At colder<str<strong>on</strong>g>temperature</str<strong>on</strong>g>s the probe will require a greater amountof time to stabilize. When the read<strong>in</strong>gs havestabilized, click Keep .Figure 46. Remove the probes from the <strong>water</strong> sample and place the Dissolved Oxygen Probe<strong>in</strong>to a beaker filled with distilled <strong>water</strong>.7. Pour the <strong>water</strong> from the Styrofoam cup back <strong>in</strong>to the milk c<strong>on</strong>ta<strong>in</strong>er. Seal thec<strong>on</strong>ta<strong>in</strong>er and shake the <strong>water</strong> vigorously for 1 m<strong>in</strong>ute.8. Repeat Steps 4 –7 until the <strong>water</strong> sample reaches room <str<strong>on</strong>g>temperature</str<strong>on</strong>g>. When room<str<strong>on</strong>g>temperature</str<strong>on</strong>g> has been reached then beg<strong>in</strong> add<strong>in</strong>g about 25 mL of warm <strong>water</strong> (40°C– 50°C) prior to shak<strong>in</strong>g the <strong>water</strong> sample. This will allow you to take warmer<strong>water</strong> read<strong>in</strong>gs. Take <strong>dissolved</strong> <strong>oxygen</strong> read<strong>in</strong>gs until the <strong>water</strong> <str<strong>on</strong>g>temperature</str<strong>on</strong>g> reaches35°C.9. When all read<strong>in</strong>gs have been taken click Stop .10. In Table 2, record the <strong>dissolved</strong> <strong>oxygen</strong> and <str<strong>on</strong>g>temperature</str<strong>on</strong>g> read<strong>in</strong>gs from the Tablew<strong>in</strong>dow.11. Pr<strong>in</strong>t the graph of <strong>dissolved</strong> <strong>oxygen</strong> vs. <str<strong>on</strong>g>temperature</str<strong>on</strong>g>. Enter your name(s) and thenumber of copies of the graph.Westm<strong>in</strong>ster College SIMDO4.COMP-5
Temperature Effects <strong>on</strong> Dissolved Oxygen <strong>in</strong> WaterDATA SHEETName ________________________Name ________________________Period _______ Class ___________Date ___________TEMPERATURE EFFECTS ON DISSOLVED OXYGEN IN WATERDATA TABLETable 2Temperature(°C)Dissolved Oxygen(mg/L)QUESTIONS1. At what <str<strong>on</strong>g>temperature</str<strong>on</strong>g> was the <strong>dissolved</strong> <strong>oxygen</strong> c<strong>on</strong>centrati<strong>on</strong> the highest? Lowest?2. Does your data <strong>in</strong>dicate how the amount of <strong>dissolved</strong> <strong>oxygen</strong> <strong>in</strong> the <strong>water</strong> isaffected by the <str<strong>on</strong>g>temperature</str<strong>on</strong>g> of <strong>water</strong>? Expla<strong>in</strong>.Westm<strong>in</strong>ster College SIMDO4.COMP-6
Temperature Effects <strong>on</strong> Dissolved Oxygen <strong>in</strong> Water3. If you analyzed the <strong>in</strong>vertebrates <strong>in</strong> a stream and found an abundant supply ofcaddisflies, mayflies, drag<strong>on</strong>fly larvae, and trout, what m<strong>in</strong>imum c<strong>on</strong>centrati<strong>on</strong> of<strong>dissolved</strong> <strong>oxygen</strong> would be present <strong>in</strong> the stream? What maximum <str<strong>on</strong>g>temperature</str<strong>on</strong>g>would you expect the stream to susta<strong>in</strong>?4. Mosquito larvae can tolerate extremely low <strong>dissolved</strong> <strong>oxygen</strong> c<strong>on</strong>centrati<strong>on</strong>s, yetcannot survive at <str<strong>on</strong>g>temperature</str<strong>on</strong>g>s above approximately 25°C. How might you accountfor <strong>dissolved</strong> <strong>oxygen</strong> c<strong>on</strong>centrati<strong>on</strong>s of such a low value at a <str<strong>on</strong>g>temperature</str<strong>on</strong>g> of 25°C?Expla<strong>in</strong>.5. Why might trout be found <strong>in</strong> pools of <strong>water</strong> shaded by trees and shrubs morecomm<strong>on</strong>ly than <strong>in</strong> <strong>water</strong> where the trees have been cleared?Westm<strong>in</strong>ster College SIMDO4.COMP-7
Temperature Effects <strong>on</strong> Dissolved Oxygen <strong>in</strong> WaterCALIBRATION TABLESTable 3: 100% Dissolved Oxygen Capacity (mg/L)770 mm 760 mm 750 mm 740 mm 730 mm 720 mm 710 mm 700 mm 690 mm 680 mm 670 mm 660 mm0°C 14.76 14.57 14.38 14.19 13.99 13.80 13.61 13.42 13.23 13.04 12.84 12.651°C 14.38 14.19 14.00 13.82 13.63 13.44 13.26 13.07 12.88 12.70 12.51 12.322°C 14.01 13.82 13.64 13.46 13.28 13.10 12.92 12.73 12.55 12.37 12.19 12.013°C 13.65 13.47 13.29 13.12 12.94 12.76 12.59 12.41 12.23 12.05 11.88 11.704°C 13.31 13.13 12.96 12.79 12.61 12.44 12.27 12.10 11.92 11.75 11.58 11.405°C 12.97 12.81 12.64 12.47 12.30 12.13 11.96 11.80 11.63 11.46 11.29 11.126°C 12.66 12.49 12.33 12.16 12.00 11.83 11.67 11.51 11.34 11.18 11.01 10.857°C 12.35 12.19 12.03 11.87 11.71 11.55 11.39 11.23 11.07 10.91 10.75 10.598°C 12.05 11.90 11.74 11.58 11.43 11.27 11.11 10.96 10.80 10.65 10.49 10.339°C 11.77 11.62 11.46 11.31 11.16 11.01 10.85 10.70 10.55 10.39 10.24 10.0910°C 11.50 11.35 11.20 11.05 10.90 10.75 10.60 10.45 10.30 10.15 10.00 9.8611°C 11.24 11.09 10.94 10.80 10.65 10.51 10.36 10.21 10.07 9.92 9.78 9.6312°C 10.98 10.84 10.70 10.56 10.41 10.27 10.13 9.99 9.84 9.70 9.56 9.4113°C 10.74 10.60 10.46 10.32 10.18 10.04 9.90 9.77 9.63 9.49 9.35 9.2114°C 10.51 10.37 10.24 10.10 9.96 9.83 9.69 9.55 9.42 9.28 9.14 9.0115°C 10.29 10.15 10.02 9.88 9.75 9.62 9.48 9.35 9.22 9.08 8.95 8.8216°C 10.07 9.94 9.81 9.68 9.55 9.42 9.29 9.15 9.02 8.89 8.76 8.6317°C 9.86 9.74 9.61 9.48 9.35 9.22 9.10 8.97 8.84 8.71 8.58 8.4518°C 9.67 9.54 9.41 9.29 9.16 9.04 8.91 8.79 8.66 8.54 8.41 8.2819°C 9.47 9.35 9.23 9.11 8.98 8.86 8.74 8.61 8.49 8.37 8.24 8.1220°C 9.29 9.17 9.05 8.93 8.81 8.69 8.57 8.45 8.33 8.20 8.08 7.9621°C 9.11 9.00 8.88 8.76 8.64 8.52 8.40 8.28 8.17 8.05 7.93 7.8122°C 8.94 8.83 8.71 8.59 8.48 8.36 8.25 8.13 8.01 7.90 7.78 7.6723°C 8.78 8.66 8.55 8.44 8.32 8.21 8.09 7.98 7.87 7.75 7.64 7.5224°C 8.62 8.51 8.40 8.28 8.17 8.06 7.95 7.84 7.72 7.61 7.50 7.3925°C 8.47 8.36 8.25 8.14 8.03 7.92 7.81 7.70 7.59 7.48 7.37 7.2626°C 8.32 8.21 8.10 7.99 7.89 7.78 7.67 7.56 7.45 7.35 7.24 7.1327°C 8.17 8.07 7.96 7.86 7.75 7.64 7.54 7.43 7.33 7.22 7.11 7.0128°C 8.04 7.93 7.83 7.72 7.62 7.51 7.41 7.30 7.20 7.10 6.99 6.8929°C 7.90 7.80 7.69 7.59 7.49 7.39 7.28 7.18 7.08 6.98 6.87 6.7730°C 7.77 7.67 7.57 7.47 7.36 7.26 7.16 7.06 6.96 6.86 6.76 6.66Table 4: Approximate Barometric Pressure at Different Elevati<strong>on</strong>sElevati<strong>on</strong>(feet)Pressure(mm Hg)Elevati<strong>on</strong>(feet)Pressure(mm Hg)Elevati<strong>on</strong>(feet)Pressure(mm Hg)0 760 2000 708 4000 659250 753 2250 702 4250 653500 746 2500 695 4500 647750 739 2750 689 4750 6411000 733 3000 683 5000 6351250 727 3250 677 5250 6291500 720 3500 671 5500 6241750 714 3750 665 5750 618Westm<strong>in</strong>ster College SIMDO4.COMP-8