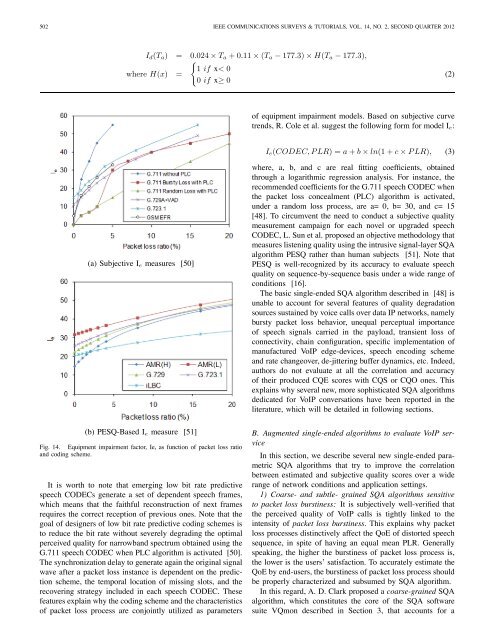
502 <strong>IEEE</strong> COMMUNICATIONS SURVEYS & TUTORIALS, VOL. 14, NO. 2, SECOND QUARTER 2012I d (T a ) = 0.024 × T a +0.11 × (T a − 177.3) × H(T a − 177.3),{where H(x) =1 if x< 00 if x≥ 0(2)<strong>of</strong> equipment impairment models. Based on subjective curvetrends, R. Cole et al. suggest the following form for model I e :I e (CODEC,PLR)=a + b × ln(1 + c × PLR), (3)(a) Subjective I e measures [50](b) PESQ-Based I e measure [51]Fig. 14. Equipment impairment factor, Ie, as function <strong>of</strong> packet loss ratioand coding scheme.It is worth to note that emerging low bit rate predictivespeech CODECs generate a set <strong>of</strong> dependent speech frames,which means that the faithful reconstruction <strong>of</strong> next framesrequires the correct reception <strong>of</strong> previous ones. Note that thegoal <strong>of</strong> designers <strong>of</strong> low bit rate predictive coding schemes isto reduce the bit rate without severely degrading the optimalperceived quality for narrowband spectrum obtained using theG.711 speech CODEC when PLC algorithm is activated [50].The synchronization delay to generate again the original signalwave after a packet loss instance is dependent on the predictionscheme, the temporal location <strong>of</strong> missing slots, and therecovering strategy included in each speech CODEC. Thesefeatures explain why the coding scheme and the characteristics<strong>of</strong> packet loss process are conjointly utilized as parameterswhere, a, b, and c are real fitting coefficients, obtainedthrough a logarithmic regression analysis. For instance, therecommended coefficients for the G.711 speech CODEC whenthe packet loss concealment (PLC) algorithm is activated,under a random loss process, are a= 0, b= 30, and c= 15[48]. To circumvent the need to conduct a subjective qualitymeasurement campaign for each novel or upgraded speechCODEC, L. Sun et al. proposed an objective methodology thatmeasures listening quality using the intrusive signal-layer SQAalgorithm PESQ rather than human subjects [51]. Note thatPESQ is well-recognized by its accuracy to evaluate speechquality on sequence-by-sequence basis under a wide range <strong>of</strong>conditions [16].The basic single-ended SQA algorithm described in [48] isunable to account for several features <strong>of</strong> quality degradationsources sustained by voice calls over data IP networks, namelybursty packet loss behavior, unequal perceptual importance<strong>of</strong> speech signals carried in the payload, transient loss <strong>of</strong>connectivity, chain configuration, specific implementation <strong>of</strong>manufactured <strong>VoIP</strong> edge-devices, speech encoding schemeand rate changeover, de-jittering buffer dynamics, etc. Indeed,authors do not evaluate at all the correlation and accuracy<strong>of</strong> their produced CQE scores with CQS or CQO ones. Thisexplains why several new, more sophisticated SQA algorithmsdedicated for <strong>VoIP</strong> conversations have been reported in theliterature, which will be detailed in following sections.B. Augmented single-ended algorithms to evaluate <strong>VoIP</strong> serviceIn this section, we describe several new single-ended parametricSQA algorithms that try to improve the correlationbetween estimated and subjective quality scores over a widerange <strong>of</strong> network conditions and application settings.1) Coarse- and subtle- grained SQA algorithms sensitiveto packet loss burstiness: It is subjectively well-verified thatthe perceived quality <strong>of</strong> <strong>VoIP</strong> calls is tightly linked to theintensity <strong>of</strong> packet loss burstiness. This explains why packetloss processes distinctively affect the QoE <strong>of</strong> distorted speechsequence, in spite <strong>of</strong> having an equal mean PLR. Generallyspeaking, the higher the burstiness <strong>of</strong> packet loss process is,the lower is the users’ satisfaction. To accurately estimate theQoE by end-users, the burstiness <strong>of</strong> packet loss process shouldbe properly characterized and subsumed by SQA algorithm.In this regard, A. D. Clark proposed a coarse-grained SQAalgorithm, which constitutes the core <strong>of</strong> the SQA s<strong>of</strong>twaresuite VQmon described in Section 3, that accounts for a
JELASSI et al.: QUALITY OF EXPERIENCE OF VOIP SERVICE: A SURVEY OF ASSESSMENT APPROACHES AND OPEN ISSUES 503limited range <strong>of</strong> packet loss burstiness [42]. This signifiesthat the SQA algorithm is unable to properly discern betweenvarious distributions <strong>of</strong> bursty packet losses. The classification<strong>of</strong> loss instances either as isolated or bursty is performedthrough the monitoring <strong>of</strong> inter-loss gap and loss run durations.Precisely, a loss instance is considered as isolated ifand only if its length is exactly equal to one speech frameand the duration since the former loss event is greater thangmin. The recommended value <strong>of</strong> gmin is equal to 320 msthat has been selected through subjective tuning process. Thisenables to subsume sparse loss distribution under high packetloss ratio. The coarse-grained features <strong>of</strong> packet loss processare captured using a 4-state Markov chain, rather than theclassical 2-state Gilbert-Elliot model (see Figure 15a). Thechain is calibrated at run-time using an efficient packet lossevent driven algorithm. At the end <strong>of</strong> a monitoring period (8s -20s), suitable parameters, such as average packet loss ratios forisolated and bursty packet loss periods and the correspondentdurations are properly extracted. The value <strong>of</strong> Ie is separatelycalculated according to the average PLR under isolated andbursty packet loss periods, which are subsequently integratedover time to finally derive an average value <strong>of</strong> I e . Noticethat the integration subsumes users’ behavior at the transitionfrom isolated to bursty loss periods, and conversely. Moreover,the recency effect related to the temporal location <strong>of</strong> the lastvery poor quality period has been considered by VQmon tocalculate the overall degradation at the end <strong>of</strong> a monitoringperiod. Notice that the VQmon assessment methodology hasbeen used to fill extended RTCP reports described in the RFC3611.As indicated previously, VQmon is unable to subtly capturethe perceived effect <strong>of</strong> a specific bursty packet loss pattern.For example, it is unable to discern between a situation wherethree packets are consecutively dropped and another wherethree packets are dropped with an inter-loss gap <strong>of</strong> 1 or morepackets. These two loss patterns inherently lead to distinct listeningqualities. To overcome this shortage, L. Roychoudhuriet al. proposed a subtle-grained SQA algorithm, denoted asGenome that more accurately subsumes the pattern <strong>of</strong> droppedspeech frames [52]. To do that, a set <strong>of</strong> ”base” quality estimatemodels which quantify the perceived quality entailed by theapplication <strong>of</strong> a periodic packet loss process 6 are developed,following a simple logarithmic regression analysis. The basequality estimate models are parameterized using the inter-lossgap and burst loss sizes. Specifically, for a packet loss runequal to 1, 2, 3, or 4 packets, a dedicated base quality estimatemodel, which has as input parameters the inter-loss gap size,has been built.At run-time, Genome probes and records the effectiveexperienced inter-loss gap and the following burst loss size. Atthe end <strong>of</strong> a monitoring period, the overall listening quality iscomputed as the weighted average <strong>of</strong> the ”base” quality score<strong>of</strong> each pair, where the weights are calculated as a function<strong>of</strong> inter-loss gap durations (see Figure 15b). Notice that thecombination formula <strong>of</strong> Genome implies that the larger theinter-loss gap size <strong>of</strong> a given pair, the greater the influence on6 A packet loss process that periodically drops a static number <strong>of</strong> consecutivespeech frames preceded by a given inter-loss gap size.the overall perceived quality. Moreover, a high frequency <strong>of</strong>a given pair entails more influence on the overall perceivedquality. These statistical properties <strong>of</strong> Genome can result ina biased behavior rating. Moreover, the subtle granularity<strong>of</strong> Genome considerably disables its ability to subsume thecontext in which a given loss instance happens. This perhapsexplains why authors confined the performance evaluation <strong>of</strong>Genome to randomly dropped speech packets.Notice finally that an extended version <strong>of</strong> ITU-T E-Modelhas been released in 2005 that includes packet loss burstinessin the calculation <strong>of</strong> the equipment impairment factor, I e[53]. In short, the designers <strong>of</strong> ITU-T E-Model introduce anadditional parameter referred to as BurstR that is used toquantify the degree <strong>of</strong> packet loss burstiness and hence theamount <strong>of</strong> quality degradation. Moreover, an efficient windowbasedmethodology, denoted as Q-Model, has been reported inthe literature [54]. Q-Model maps a given bursty packet lossprocess to its equivalent random one with respect to qualitydegradation. As such, legacy quality models established fortemporally-independent packet loss process can be reliablyused to measure quality degradation.In [55], S. Jelassi et al. compare the performance <strong>of</strong>previously described bursty-loss-aware SQA algorithms undera wide range <strong>of</strong> packet loss burstiness. The metrics used tojudge the performance <strong>of</strong> examined SQA algorithms were thePearson correlation coefficient and average absolute deviationbetween measured and estimated rating factors, denoted hereafterrespectively as ρ and Δ. Thevalue<strong>of</strong>Δ is obtainedusing the following expression:Δ= 1 ∑√ N (RM i N− Ri E )2 (4)i=1where, R M and R E refer, respectively, to measured andestimated rating factors and N is the number <strong>of</strong> measures. Thehistograms given in Figure 16 give a recap <strong>of</strong> obtained results,where E-Model(1) and E-Model(2) denote, respectively, E-Model designed to subsume independent and bursty removedvoice packets [53]. Q-Model(1) and Q-Model(2) refer, respectively,to two variants <strong>of</strong> Q-Model [54]. The value <strong>of</strong>ρ and Δ are calculated on sequence-by-sequence basis. Werefer interested reader to [55] for further explanation aboutthe empirical study and additional results.As we can see in Figure 16a, all bursty-loss-aware SQAachieve a good correlation coefficient greater than 0.85. Thisobservation is somehow expected, as a significant increase <strong>of</strong>PLR values induces a considerable decrease <strong>of</strong> MOS scores,and conversely. All existing SQA algorithms are designedusing monotonic quality models as function <strong>of</strong> PLR values,which explains the observed good correlation coefficients.As we can see, Q-Model(1) and Q-Model(2) slightly outperformother SQA approaches. Moreover, we see that VQmonachieves the minimum correlation coefficient following ourmeasurements.Histograms given in Fig. 16b summarize the obtained values<strong>of</strong> Δ <strong>of</strong> examined bursty-loss-aware SQA algorithms. Aswe can see, examined SQA algorithms induce significantdeviation between measured and estimated scores. E-Model(1)