The Carbon Cycle and Atmospheric Carbon Dioxide
The Carbon Cycle and Atmospheric Carbon Dioxide
The Carbon Cycle and Atmospheric Carbon Dioxide

Create successful ePaper yourself
Turn your PDF publications into a flip-book with our unique Google optimized e-Paper software.
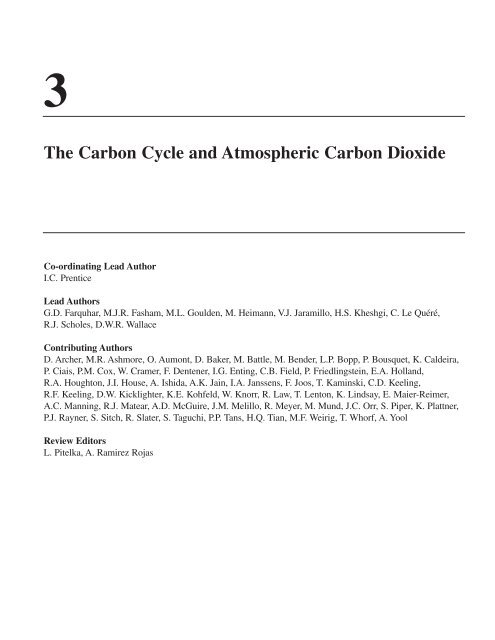
3<br />
<strong>The</strong> <strong>Carbon</strong> <strong>Cycle</strong> <strong>and</strong> <strong>Atmospheric</strong> <strong>Carbon</strong> <strong>Dioxide</strong><br />
Co-ordinating Lead Author<br />
I.C. Prentice<br />
Lead Authors<br />
G.D. Farquhar, M.J.R. Fasham, M.L. Goulden, M. Heimann, V.J. Jaramillo, H.S. Kheshgi, C. Le Quéré,<br />
R.J. Scholes, D.W.R. Wallace<br />
Contributing Authors<br />
D. Archer, M.R. Ashmore, O. Aumont, D. Baker, M. Battle, M. Bender, L.P. Bopp, P. Bousquet, K. Caldeira,<br />
P. Ciais, P.M. Cox, W. Cramer, F. Dentener, I.G. Enting, C.B. Field, P. Friedlingstein, E.A. Holl<strong>and</strong>,<br />
R.A. Houghton, J.I. House, A. Ishida, A.K. Jain, I.A. Janssens, F. Joos, T. Kaminski, C.D. Keeling,<br />
R.F. Keeling, D.W. Kicklighter, K.E. Kohfeld, W. Knorr, R. Law, T. Lenton, K. Lindsay, E. Maier-Reimer,<br />
A.C. Manning, R.J. Matear, A.D. McGuire, J.M. Melillo, R. Meyer, M. Mund, J.C. Orr, S. Piper, K. Plattner,<br />
P.J. Rayner, S. Sitch, R. Slater, S. Taguchi, P.P. Tans, H.Q. Tian, M.F. Weirig, T. Whorf, A. Yool<br />
Review Editors<br />
L. Pitelka, A. Ramirez Rojas
Contents<br />
Executive Summary 185<br />
3.1 Introduction 187<br />
3.2 Terrestrial <strong>and</strong> Ocean Biogeochemistry:<br />
Update on Processes 191<br />
3.2.1 Overview of the <strong>Carbon</strong> <strong>Cycle</strong> 191<br />
3.2.2 Terrestrial <strong>Carbon</strong> Processes 191<br />
3.2.2.1 Background<br />
3.2.2.2 Effects of changes in l<strong>and</strong> use <strong>and</strong><br />
191<br />
l<strong>and</strong> management 193<br />
3.2.2.3 Effects of climate<br />
3.2.2.4 Effects of increasing atmospheric<br />
194<br />
CO 2<br />
195<br />
3.2.2.5 Effects of anthropogenic nitrogen<br />
deposition<br />
3.2.2.6 Additional impacts of changing<br />
196<br />
atmospheric chemistry 197<br />
3.2.2.7 Additional constraints on terrestrial<br />
CO2 uptake 197<br />
3.2.3 Ocean <strong>Carbon</strong> Processes 197<br />
3.2.3.1 Background 197<br />
3.2.3.2 Uptake of anthropogenic CO 2<br />
199<br />
3.2.3.3 Future changes in ocean CO 2<br />
uptake 199<br />
3.3 Palaeo CO 2 <strong>and</strong> Natural Changes in the <strong>Carbon</strong><br />
<strong>Cycle</strong> 201<br />
3.3.1 Geological History of <strong>Atmospheric</strong> CO 2 201<br />
3.3.2 Variations in <strong>Atmospheric</strong> CO 2 during<br />
Glacial/inter-glacial <strong>Cycle</strong>s 202<br />
3.3.3 Variations in <strong>Atmospheric</strong> CO 2 during the<br />
Past 11,000 Years 203<br />
3.3.4 Implications 203<br />
3.4 Anthropogenic Sources of CO 2 204<br />
3.4.1 Emissions from Fossil Fuel Burning <strong>and</strong><br />
Cement Production 204<br />
3.4.2 Consequences of L<strong>and</strong>-use Change 204<br />
3.5 Observations, Trends <strong>and</strong> Budgets 205<br />
3.5.1 <strong>Atmospheric</strong> Measurements <strong>and</strong> Global<br />
CO 2 Budgets 205<br />
3.5.2 Interannual Variability in the Rate of<br />
<strong>Atmospheric</strong> CO 2 Increase 208<br />
3.5.3 Inverse Modelling of <strong>Carbon</strong> Sources <strong>and</strong><br />
Sinks 210<br />
3.5.4 Terrestrial Biomass Inventories 212<br />
3.6 <strong>Carbon</strong> <strong>Cycle</strong> Model Evaluation 213<br />
3.6.1 Terrestrial <strong>and</strong> Ocean Biogeochemistry<br />
Models 213<br />
3.6.2 Evaluation of Terrestrial Models 214<br />
3.6.2.1 Natural carbon cycling on l<strong>and</strong> 214<br />
3.6.2.2 Uptake <strong>and</strong> release of<br />
anthropogenic CO 2 by the l<strong>and</strong> 215<br />
3.6.3 Evaluation of Ocean Models 216<br />
3.6.3.1 Natural carbon cycling in the<br />
ocean 216<br />
3.6.3.2 Uptake of anthropogenic CO 2 by<br />
the ocean 216<br />
3.7 Projections of CO 2 Concentration <strong>and</strong> their<br />
Implications 219<br />
3.7.1 Terrestrial <strong>Carbon</strong> Model Responses to<br />
Scenarios of Change in CO 2 <strong>and</strong> Climate 219<br />
3.7.2 Ocean <strong>Carbon</strong> Model Responses to Scenarios<br />
of Change in CO 2 <strong>and</strong> Climate 219<br />
3.7.3 Coupled Model Responses <strong>and</strong> Implications<br />
for Future CO 2 Concentrations 221<br />
3.7.3.1 Methods for assessing the response<br />
of atmospheric CO 2 to different<br />
emissions pathways <strong>and</strong> model<br />
sensitivities 221<br />
3.7.3.2 Concentration projections based on<br />
IS92a, for comparison with previous<br />
studies 222<br />
3.7.3.3 SRES scenarios <strong>and</strong> their implications<br />
for future CO 2 concentration 223<br />
3.7.3.4 Stabilisation scenarios <strong>and</strong> their<br />
implications for future CO 2<br />
emissions 224<br />
3.7.4 Conclusions 224<br />
References 225
<strong>The</strong> <strong>Carbon</strong> <strong>Cycle</strong> <strong>and</strong> <strong>Atmospheric</strong> <strong>Carbon</strong> <strong>Dioxide</strong><br />
Executive Summary<br />
CO 2 concentration trends <strong>and</strong> budgets<br />
Before the Industrial Era, circa 1750, atmospheric carbon dioxide<br />
(CO 2) concentration was 280 ± 10 ppm for several thous<strong>and</strong> years.<br />
It has risen continuously since then, reaching 367 ppm in 1999.<br />
<strong>The</strong> present atmospheric CO 2 concentration has not been<br />
exceeded during the past 420,000 years, <strong>and</strong> likely not during the<br />
past 20 million years. <strong>The</strong> rate of increase over the past century<br />
is unprecedented, at least during the past 20,000 years.<br />
<strong>The</strong> present atmospheric CO 2 increase is caused by anthropogenic<br />
emissions of CO 2. About three-quarters of these<br />
emissions are due to fossil fuel burning. Fossil fuel burning (plus<br />
a small contribution from cement production) released on<br />
average 5.4 ± 0.3 PgC/yr during 1980 to 1989, <strong>and</strong> 6.3 ± 0.4<br />
PgC/yr during 1990 to 1999. L<strong>and</strong> use change is responsible for<br />
the rest of the emissions.<br />
<strong>The</strong> rate of increase of atmospheric CO 2 content was 3.3 ±<br />
0.1 PgC/yr during 1980 to 1989 <strong>and</strong> 3.2 ± 0.1 PgC/yr during 1990<br />
to 1999. <strong>The</strong>se rates are less than the emissions, because some of<br />
the emitted CO 2 dissolves in the oceans, <strong>and</strong> some is taken up by<br />
terrestrial ecosystems. Individual years show different rates of<br />
increase. For example, 1992 was low (1.9 PgC/yr), <strong>and</strong> 1998 was<br />
the highest (6.0 PgC/yr) since direct measurements began in<br />
1957. This variability is mainly caused by variations in l<strong>and</strong> <strong>and</strong><br />
ocean uptake.<br />
Statistically, high rates of increase in atmospheric CO 2 have<br />
occurred in most El Niño years, although low rates occurred<br />
during the extended El Niño of 1991 to 1994. Surface water CO 2<br />
measurements from the equatorial Pacific show that the natural<br />
source of CO 2 from this region is reduced by between 0.2 <strong>and</strong> 1.0<br />
PgC/yr during El Niño events, counter to the atmospheric<br />
increase. It is likely that the high rates of CO 2 increase during<br />
most El Niño events are explained by reductions in l<strong>and</strong> uptake,<br />
caused in part by the effects of high temperatures, drought <strong>and</strong><br />
fire on terrestrial ecosystems in the tropics.<br />
L<strong>and</strong> <strong>and</strong> ocean uptake of CO 2 can now be separated using<br />
atmospheric measurements (CO 2, oxygen (O 2) <strong>and</strong> 13 CO 2). For<br />
1980 to 1989, the ocean-atmosphere flux is estimated as −1.9 ±<br />
0.6 PgC/yr <strong>and</strong> the l<strong>and</strong>-atmosphere flux as −0.2 ± 0.7 PgC/yr<br />
based on CO 2 <strong>and</strong> O 2 measurements (negative signs denote net<br />
uptake). For 1990 to 1999, the ocean-atmosphere flux is<br />
estimated as −1.7 ± 0.5 PgC/yr <strong>and</strong> the l<strong>and</strong>-atmosphere flux as<br />
−1.4 ± 0.7 PgC/yr. <strong>The</strong>se figures are consistent with alternative<br />
budgets based on CO 2 <strong>and</strong> 13 CO 2 measurements, <strong>and</strong> with<br />
independent estimates based on measurements of CO 2 <strong>and</strong> 13 CO 2<br />
in sea water. <strong>The</strong> new 1980s estimates are also consistent with the<br />
ocean-model based carbon budget of the IPCC WGI Second<br />
Assessment Report (IPCC, 1996a) (hereafter SAR). <strong>The</strong> new<br />
1990s estimates update the budget derived using SAR methodologies<br />
for the IPCC Special Report on L<strong>and</strong> Use, L<strong>and</strong> Use<br />
Change <strong>and</strong> Forestry (IPCC, 2000a).<br />
<strong>The</strong> net CO 2 release due to l<strong>and</strong>-use change during the 1980s<br />
has been estimated as 0.6 to 2.5 PgC/yr (central estimate 1.7<br />
PgC/yr). This net CO 2 release is mainly due to deforestation in<br />
the tropics. Uncertainties about l<strong>and</strong>-use changes limit the<br />
185<br />
accuracy of these estimates. Comparable data for the 1990s are<br />
not yet available.<br />
<strong>The</strong> l<strong>and</strong>-atmosphere flux estimated from atmospheric<br />
observations comprises the balance of net CO 2 release due to<br />
l<strong>and</strong>-use changes <strong>and</strong> CO 2 uptake by terrestrial systems (the<br />
“residual terrestrial sink”). <strong>The</strong> residual terrestrial sink is<br />
estimated as −1.9 PgC/yr (range −3.8 to +0.3 PgC/yr) during the<br />
1980s. It has several likely causes, including changes in l<strong>and</strong><br />
management practices <strong>and</strong> fertilisation effects of increased<br />
atmospheric CO 2 <strong>and</strong> nitrogen (N) deposition, leading to<br />
increased vegetation <strong>and</strong> soil carbon.<br />
Modelling based on atmospheric observations (inverse<br />
modelling) enables the l<strong>and</strong>-atmosphere <strong>and</strong> ocean-atmosphere<br />
fluxes to be partitioned between broad latitudinal b<strong>and</strong>s. <strong>The</strong> sites<br />
of anthropogenic CO 2 uptake in the ocean are not resolved by<br />
inverse modelling because of the large, natural background airsea<br />
fluxes (outgassing in the tropics <strong>and</strong> uptake in high latitudes).<br />
Estimates of the l<strong>and</strong>-atmosphere flux north of 30°N during 1980<br />
to 1989 range from −2.3 to −0.6 PgC/yr; for the tropics, −1.0 to<br />
+1.5 PgC/yr. <strong>The</strong>se results imply substantial terrestrial sinks for<br />
anthropogenic CO 2 in the northern extra-tropics, <strong>and</strong> in the<br />
tropics (to balance deforestation). <strong>The</strong> pattern for the 1980s<br />
persisted into the 1990s.<br />
Terrestrial carbon inventory data indicate carbon sinks in<br />
northern <strong>and</strong> tropical forests, consistent with the results of inverse<br />
modelling.<br />
East-west gradients of atmospheric CO 2 concentration are an<br />
order of magnitude smaller than north-south gradients. Estimates<br />
of continental-scale CO 2 balance are possible in principle but are<br />
poorly constrained because there are too few well-calibrated CO 2<br />
monitoring sites, especially in the interior of continents, <strong>and</strong><br />
insufficient data on air-sea fluxes <strong>and</strong> vertical transport in the<br />
atmosphere.<br />
<strong>The</strong> global carbon cycle <strong>and</strong> anthropogenic CO2 <strong>The</strong> global carbon cycle operates through a variety of response<br />
<strong>and</strong> feedback mechanisms. <strong>The</strong> most relevant for decade to<br />
century time-scales are listed here.<br />
Responses of the carbon cycle to changing CO 2 concentrations<br />
• Uptake of anthropogenic CO 2 by the ocean is primarily<br />
governed by ocean circulation <strong>and</strong> carbonate chemistry. So<br />
long as atmospheric CO 2 concentration is increasing there is net<br />
uptake of carbon by the ocean, driven by the atmosphere-ocean<br />
difference in partial pressure of CO 2. <strong>The</strong> fraction of anthropogenic<br />
CO 2 that is taken up by the ocean declines with<br />
increasing CO 2 concentration, due to reduced buffer capacity of<br />
the carbonate system. <strong>The</strong> fraction taken up by the ocean also<br />
declines with the rate of increase of atmospheric CO 2, because<br />
the rate of mixing between deep water <strong>and</strong> surface water limits<br />
CO 2 uptake.<br />
• Increasing atmospheric CO 2 has no significant fertilisation<br />
effect on marine biological productivity, but it decreases pH.<br />
Over a century, changes in marine biology brought about by<br />
changes in calcification at low pH could increase the ocean<br />
uptake of CO 2 by a few percentage points.
186 <strong>The</strong> <strong>Carbon</strong> <strong>Cycle</strong> <strong>and</strong> <strong>Atmospheric</strong> <strong>Carbon</strong> <strong>Dioxide</strong><br />
• Terrestrial uptake of CO 2 is governed by net biome production<br />
(NBP), which is the balance of net primary production<br />
(NPP) <strong>and</strong> carbon losses due to heterotrophic respiration<br />
(decomposition <strong>and</strong> herbivory) <strong>and</strong> fire, including the fate of<br />
harvested biomass. NPP increases when atmospheric CO 2<br />
concentration is increased above present levels (the “fertilisation”<br />
effect occurs directly through enhanced photosynthesis,<br />
<strong>and</strong> indirectly through effects such as increased<br />
water use efficiency). At high CO 2 concentration (800 to<br />
1,000 ppm) any further direct CO 2 fertilisation effect is likely<br />
to be small. <strong>The</strong> effectiveness of terrestrial uptake as a carbon<br />
sink depends on the transfer of carbon to forms with long<br />
residence times (wood or modified soil organic matter).<br />
Management practices can enhance the carbon sink because<br />
of the inertia of these “slow” carbon pools.<br />
Feedbacks in the carbon cycle due to climate change<br />
• Warming reduces the solubility of CO 2 <strong>and</strong> therefore reduces<br />
uptake of CO 2 by the ocean.<br />
• Increased vertical stratification in the ocean is likely to<br />
accompany increasing global temperature. <strong>The</strong> likely<br />
consequences include reduced outgassing of upwelled CO 2,<br />
reduced transport of excess carbon to the deep ocean, <strong>and</strong><br />
changes in biological productivity.<br />
• On short time-scales, warming increases the rate of<br />
heterotrophic respiration on l<strong>and</strong>, but the extent to which this<br />
effect can alter l<strong>and</strong>-atmosphere fluxes over longer timescales<br />
is not yet clear. Warming, <strong>and</strong> regional changes in<br />
precipitation patterns <strong>and</strong> cloudiness, are also likely to bring<br />
about changes in terrestrial ecosystem structure, geographic<br />
distribution <strong>and</strong> primary production. <strong>The</strong> net effect of climate<br />
on NBP depends on regional patterns of climate change.<br />
Other impacts on the carbon cycle<br />
• Changes in management practices are very likely to have<br />
significant effects on the terrestrial carbon cycle. In addition<br />
to deforestation <strong>and</strong> afforestation/reforestation, more subtle<br />
management effects can be important. For example, fire<br />
suppression (e.g., in savannas) reduces CO 2 emissions from<br />
burning, <strong>and</strong> encourages woody plant biomass to increase.<br />
On agricultural l<strong>and</strong>s, some of the soil carbon lost when l<strong>and</strong><br />
was cleared <strong>and</strong> tilled can be regained through adoption of<br />
low-tillage agriculture.<br />
• Anthropogenic N deposition is increasing terrestrial NPP in<br />
some regions; excess tropospheric ozone (O 3) is likely to be<br />
reducing NPP.<br />
• Anthropogenic inputs of nutrients to the oceans by rivers <strong>and</strong><br />
atmospheric dust may influence marine biological productivity,<br />
although such effects are poorly quantified.<br />
Modelling <strong>and</strong> projection of CO 2 concentration<br />
Process-based models of oceanic <strong>and</strong> terrestrial carbon cycling<br />
have been developed, compared <strong>and</strong> tested against in situ<br />
measurements <strong>and</strong> atmospheric measurements. <strong>The</strong> following<br />
are consistent results based on several models.<br />
• Modelled ocean-atmosphere flux during 1980 to 1989 was in<br />
the range −1.5 to −2.2 PgC/yr for the 1980s, consistent with<br />
earlier model estimates <strong>and</strong> consistent with the atmospheric<br />
budget.<br />
• Modelled l<strong>and</strong>-atmosphere flux during 1980 to 1989 was in<br />
the range −0.3 to −1.5 PgC/yr, consistent with or slightly<br />
more negative than the l<strong>and</strong>-atmosphere flux as indicated by<br />
the atmospheric budget. CO 2 fertilisation <strong>and</strong> anthropogenic<br />
N deposition effects contributed significantly: their<br />
combined effect was estimated as −1.5 to −3.1 PgC/yr.<br />
Effects of climate change during the 1980s were small, <strong>and</strong><br />
of uncertain sign.<br />
• In future projections with ocean models, driven by CO 2<br />
concentrations derived from the IS92a scenario (for illustration<br />
<strong>and</strong> comparison with earlier work), ocean uptake<br />
becomes progressively larger towards the end of the century,<br />
but represents a smaller fraction of emissions than today.<br />
When climate change feedbacks are included, ocean uptake<br />
becomes less in all models, when compared with the<br />
situation without climate feedbacks.<br />
• In analogous projections with terrestrial models, the rate of<br />
uptake by the l<strong>and</strong> due to CO 2 fertilisation increases until<br />
mid-century, but the models project smaller increases, or no<br />
increase, after that time. When climate change feedbacks are<br />
included, l<strong>and</strong> uptake becomes less in all models, when<br />
compared with the situation without climate feedbacks.<br />
Some models have shown a rapid decline in carbon uptake<br />
after the mid-century.<br />
Two simplified, fast models (ISAM <strong>and</strong> Bern-CC) were used to<br />
project future CO 2 concentrations under IS92a <strong>and</strong> six SRES<br />
scenarios, <strong>and</strong> to project future emissions under five CO 2<br />
stabilisation scenarios. Both models represent ocean <strong>and</strong><br />
terrestrial climate feedbacks, in a way consistent with processbased<br />
models, <strong>and</strong> allow for uncertainties in climate sensitivity<br />
<strong>and</strong> in ocean <strong>and</strong> terrestrial responses to CO 2 <strong>and</strong> climate.<br />
• <strong>The</strong> reference case projections (which include climate<br />
feedbacks) of both models under IS92a are, by coincidence,<br />
close to those made in the SAR (which neglected feedbacks).<br />
• <strong>The</strong> SRES scenarios lead to divergent CO 2 concentration<br />
trajectories. Among the six emissions scenarios considered,<br />
the projected range of CO 2 concentrations at the end of the<br />
century is 550 to 970 ppm (ISAM model) or 540 to 960 ppm<br />
(Bern-CC model).<br />
• Variations in climate sensitivity <strong>and</strong> ocean <strong>and</strong> terrestrial<br />
model responses add at least −10 to +30% uncertainty to<br />
these values, <strong>and</strong> to the emissions implied by the stabilisation<br />
scenarios.<br />
• <strong>The</strong> net effect of l<strong>and</strong> <strong>and</strong> ocean climate feedbacks is always<br />
to increase projected atmospheric CO 2 concentrations. This<br />
is equivalent to reducing the allowable emissions for stabilisation<br />
at any one CO 2 concentration.<br />
• New studies with general circulation models including<br />
interactive l<strong>and</strong> <strong>and</strong> ocean carbon cycle components also<br />
indicate that climate feedbacks have the potential to increase<br />
atmospheric CO 2 but with large uncertainty about the<br />
magnitude of the terrestrial biosphere feedback.
<strong>The</strong> <strong>Carbon</strong> <strong>Cycle</strong> <strong>and</strong> <strong>Atmospheric</strong> <strong>Carbon</strong> <strong>Dioxide</strong><br />
Implications<br />
CO 2 emissions from fossil fuel burning are virtually certain<br />
to be the dominant factor determining CO 2 concentrations<br />
during the 21st century. <strong>The</strong>re is scope for l<strong>and</strong>-use changes<br />
to increase or decrease CO 2 concentrations on this time-scale.<br />
If all of the carbon so far released by l<strong>and</strong>-use changes could<br />
be restored to the terrestrial biosphere, CO 2 at the end of the<br />
century would be 40 to 70 ppm less than it would be if no<br />
such intervention had occurred. By comparison, global<br />
deforestation would add two to four times more CO 2 to the<br />
atmosphere than reforestation of all cleared areas would<br />
subtract.<br />
3.1 Introduction<br />
<strong>The</strong> concentration of CO 2 in the atmosphere has risen from close<br />
to 280 parts per million (ppm) in 1800, at first slowly <strong>and</strong> then<br />
progressively faster to a value of 367 ppm in 1999, echoing the<br />
increasing pace of global agricultural <strong>and</strong> industrial development.<br />
This is known from numerous, well-replicated measurements<br />
of the composition of air bubbles trapped in Antarctic ice.<br />
<strong>Atmospheric</strong> CO 2 concentrations have been measured directly<br />
with high precision since 1957; these measurements agree with<br />
ice-core measurements, <strong>and</strong> show a continuation of the<br />
increasing trend up to the present.<br />
Several additional lines of evidence confirm that the recent<br />
<strong>and</strong> continuing increase of atmospheric CO 2 content is caused<br />
by anthropogenic CO 2 emissions – most importantly fossil fuel<br />
burning. First, atmospheric O 2 is declining at a rate comparable<br />
with fossil fuel emissions of CO 2 (combustion consumes O 2).<br />
Second, the characteristic isotopic signatures of fossil fuel (its<br />
lack of 14 C, <strong>and</strong> depleted content of 13 C) leave their mark in the<br />
atmosphere. Third, the increase in observed CO 2 concentration<br />
has been faster in the northern hemisphere, where most fossil<br />
fuel burning occurs.<br />
<strong>Atmospheric</strong> CO 2 is, however, increasing only at about half<br />
the rate of fossil fuel emissions; the rest of the CO 2 emitted<br />
either dissolves in sea water <strong>and</strong> mixes into the deep ocean, or is<br />
taken up by terrestrial ecosystems. Uptake by terrestrial ecosystems<br />
is due to an excess of primary production (photosynthesis)<br />
over respiration <strong>and</strong> other oxidative processes (decomposition or<br />
combustion of organic material). Terrestrial systems are also an<br />
187<br />
<strong>The</strong>re is sufficient uptake capacity in the ocean to incorporate<br />
70 to 80% of foreseeable anthropogenic CO 2 emissions to the<br />
atmosphere, this process takes centuries due to the rate of ocean<br />
mixing. As a result, even several centuries after emissions<br />
occurred, about a quarter of the increase in concentration caused<br />
by these emissions is still present in the atmosphere.<br />
CO 2 stabilisation at 450, 650 or 1,000 ppm would require<br />
global anthropogenic CO 2 emissions to drop below 1990 levels,<br />
within a few decades, about a century, or about two centuries<br />
respectively, <strong>and</strong> continue to steadily decrease thereafter.<br />
Stabilisation requires that net anthropogenic CO 2 emissions<br />
ultimately decline to the level of persistent natural l<strong>and</strong> <strong>and</strong> ocean<br />
sinks, which are expected to be small (
188 <strong>The</strong> <strong>Carbon</strong> <strong>Cycle</strong> <strong>and</strong> <strong>Atmospheric</strong> <strong>Carbon</strong> <strong>Dioxide</strong><br />
ATMOSPHERE<br />
b) <strong>The</strong> human perturbation<br />
a) Main components of the natural carbon cycle<br />
ATMOSPHERE<br />
[730]<br />
vulcanism < 0.1<br />
5.4<br />
ocean uptake<br />
1.9<br />
l<strong>and</strong>-use change 1.7<br />
l<strong>and</strong> uptake 1.9<br />
120<br />
90<br />
0.4<br />
LAND<br />
cement production 0.1<br />
fossil fuel burning 5.3<br />
weathering<br />
0.2<br />
Plants<br />
[500]<br />
0.4<br />
LAND<br />
DOC export 0.4<br />
Soil<br />
[1500]<br />
0.6<br />
OCEAN<br />
OCEAN<br />
Rock<br />
carbonates<br />
Fossil<br />
organic<br />
carbon<br />
[38,000]<br />
river transport<br />
0.8<br />
burial<br />
0.2<br />
weathering<br />
0.2<br />
SEDIMENT<br />
GEOLOGICAL<br />
RESERVOIRS<br />
SEDIMENT<br />
Rock<br />
carbonates<br />
Fossil<br />
organic<br />
carbon<br />
GEOLOGICAL<br />
RESERVOIRS<br />
d) <strong>Carbon</strong> cycling on l<strong>and</strong><br />
c) <strong>Carbon</strong> cycling in the ocean<br />
90<br />
88<br />
4<br />
heterotrophic<br />
respiration<br />
55<br />
autotrophic<br />
respiration<br />
GPP<br />
120<br />
60<br />
GPP NPP<br />
103 45<br />
zooplankton<br />
phytoplankton<br />
autotrophic respiration 58<br />
CO + H O + CO 2HCO 2 2<br />
3 3<br />
–<br />
2–<br />
heterotrophic respiration 34<br />
DIC in surface water<br />
NPP<br />
60<br />
detritus<br />
0.7<br />
3<br />
CaCO<br />
0.1<br />
0.1<br />
0.3<br />
Animals<br />
thermocline<br />
100 m<br />
combustion<br />
export of<br />
soft tissue<br />
physical<br />
transport<br />
33<br />
42<br />
11<br />
0.4<br />
export of<br />
CaCO 3<br />
< 0.1<br />
coastal<br />
sediment<br />
DOC/POC<br />
DETRITUS<br />
1000yr<br />
[150]<br />
CaCO3<br />
0.2<br />
dissolution<br />
0.2<br />
lysocline<br />
3,500 m<br />
0.01<br />
sediment<br />
MODIFIED<br />
SOIL CARBON<br />
=10 to 1000yr<br />
[1050]<br />
DOC<br />
export<br />
0.4
<strong>The</strong> <strong>Carbon</strong> <strong>Cycle</strong> <strong>and</strong> <strong>Atmospheric</strong> <strong>Carbon</strong> <strong>Dioxide</strong><br />
driven a great deal of research during the years since the IPCC<br />
WGI Second Assessment report (IPCC, 1996) (hereafter SAR)<br />
(Schimel et al., 1996; Melillo et al., 1996; Denman et al., 1996).<br />
Some major areas where advances have been made since the SAR<br />
are as follows:<br />
• Observational research (atmospheric, marine <strong>and</strong> terrestrial)<br />
aimed at a better quantification of carbon fluxes on local,<br />
regional <strong>and</strong> global scales. For example, improved precision <strong>and</strong><br />
repeatability in atmospheric CO 2 <strong>and</strong> stable isotope measurements;<br />
the development of highly precise methods to measure<br />
changes in atmospheric O 2 concentrations; local terrestrial CO 2<br />
flux measurements from towers, which are now being<br />
performed continuously in many terrestrial ecosystems; satellite<br />
observations of global l<strong>and</strong> cover <strong>and</strong> change; <strong>and</strong> enhanced<br />
monitoring of geographical, seasonal <strong>and</strong> interannual variations<br />
of biogeochemical parameters in the sea, including measurements<br />
of the partial pressure of CO 2 (pCO 2) in surface waters.<br />
• Experimental manipulations, for example: laboratory <strong>and</strong><br />
greenhouse experiments with raised <strong>and</strong> lowered CO 2 concentrations;<br />
field experiments on ecosystems using free-air carbon<br />
dioxide enrichment (FACE) <strong>and</strong> open-top chamber studies of<br />
raised CO 2 effects, studies of soil warming <strong>and</strong> nutrient enrichment<br />
effects; <strong>and</strong> in situ fertilisation experiments on marine<br />
ecosystems <strong>and</strong> associated pCO 2 measurements.<br />
189<br />
• <strong>The</strong>ory <strong>and</strong> modelling, especially applications of atmospheric<br />
transport models to link atmospheric observations to surface<br />
fluxes (inverse modelling); the development of process-based<br />
models of terrestrial <strong>and</strong> marine carbon cycling <strong>and</strong><br />
programmes to compare <strong>and</strong> test these models against observations;<br />
<strong>and</strong> the use of such models to project climate feedbacks<br />
on the uptake of CO 2 by the oceans <strong>and</strong> l<strong>and</strong>.<br />
As a result of this research, there is now a more firmly based<br />
knowledge of several central features of the carbon cycle. For<br />
example:<br />
• Time series of atmospheric CO 2,O 2 <strong>and</strong> 13 CO 2 measurements<br />
have made it possible to observationally constrain the<br />
partitioning of CO 2 between terrestrial <strong>and</strong> oceanic uptake <strong>and</strong><br />
to confirm earlier budgets, which were partly based on model<br />
results.<br />
• In situ experiments have explored the nature <strong>and</strong> extent of CO 2<br />
responses in a variety of terrestrial ecosystems (including<br />
forests), <strong>and</strong> have confirmed the existence of iron limitations on<br />
marine productivity.<br />
• Process-based models of terrestrial <strong>and</strong> marine biogeochemical<br />
processes have been used to represent a complex array of<br />
feedbacks in the carbon cycle, allowing the net effects of these<br />
processes to be estimated for the recent past <strong>and</strong> for future<br />
scenarios.<br />
Figure 3.1: <strong>The</strong> global carbon cycle: storages (PgC) <strong>and</strong> fluxes (PgC/yr) estimated for the 1980s. (a) Main components of the natural cycle. <strong>The</strong><br />
thick arrows denote the most important fluxes from the point of view of the contemporary CO 2 balance of the atmosphere: gross primary production<br />
<strong>and</strong> respiration by the l<strong>and</strong> biosphere, <strong>and</strong> physical air-sea exchange. <strong>The</strong>se fluxes are approximately balanced each year, but imbalances can<br />
affect atmospheric CO 2 concentration significantly over years to centuries. <strong>The</strong> thin arrows denote additional natural fluxes (dashed lines for<br />
fluxes of carbon as CaCO 3), which are important on longer time-scales. <strong>The</strong> flux of 0.4 PgC/yr from atmospheric CO 2 via plants to inert soil<br />
carbon is approximately balanced on a time-scale of several millenia by export of dissolved organic carbon (DOC) in rivers (Schlesinger, 1990). A<br />
further 0.4 PgC/yr flux of dissolved inorganic carbon (DIC) is derived from the weathering of CaCO 3, which takes up CO 2 from the atmosphere in<br />
a 1:1 ratio. <strong>The</strong>se fluxes of DOC <strong>and</strong> DIC together comprise the river transport of 0.8 PgC/yr. In the ocean, the DOC from rivers is respired <strong>and</strong><br />
released to the atmosphere, while CaCO 3 production by marine organisms results in half of the DIC from rivers being returned to the atmosphere<br />
<strong>and</strong> half being buried in deep-sea sediments − which are the precursor of carbonate rocks. Also shown are processes with even longer time-scales:<br />
burial of organic matter as fossil organic carbon (including fossil fuels), <strong>and</strong> outgassing of CO 2 through tectonic processes (vulcanism). Emissions<br />
due to vulcanism are estimated as 0.02 to 0.05 PgC/yr (Williams et al., 1992; Bickle, 1994). (b) <strong>The</strong> human perturbation (data from Table 3.1).<br />
Fossil fuel burning <strong>and</strong> l<strong>and</strong>-use change are the main anthropogenic processes that release CO 2 to the atmosphere. Only a part of this CO 2 stays in<br />
the atmosphere; the rest is taken up by the l<strong>and</strong> (plants <strong>and</strong> soil) or by the ocean. <strong>The</strong>se uptake components represent imbalances in the large<br />
natural two-way fluxes between atmosphere <strong>and</strong> ocean <strong>and</strong> between atmosphere <strong>and</strong> l<strong>and</strong>. (c) <strong>Carbon</strong> cycling in the ocean. CO 2 that dissolves in<br />
the ocean is found in three main forms (CO 2,CO 3 2− ,HCO3 − , the sum of which is DIC). DIC is transported in the ocean by physical <strong>and</strong> biological<br />
processes. Gross primary production (GPP) is the total amount of organic carbon produced by photosynthesis (estimate from Bender et al., 1994);<br />
net primary production (NPP) is what is what remains after autotrophic respiration, i.e., respiration by photosynthetic organisms (estimate from<br />
Falkowski et al., 1998). Sinking of DOC <strong>and</strong> particulate organic matter (POC) of biological origin results in a downward flux known as export<br />
production (estimate from Schlitzer, 2000). This organic matter is tranported <strong>and</strong> respired by non-photosynthetic organisms (heterotrophic respiration)<br />
<strong>and</strong> ultimately upwelled <strong>and</strong> returned to the atmosphere. Only a tiny fraction is buried in deep-sea sediments. Export of CaCO 3 to the deep<br />
ocean is a smaller flux than total export production (0.4 PgC/yr) but about half of this carbon is buried as CaCO 3 in sediments; the other half is<br />
dissolved at depth, <strong>and</strong> joins the pool of DIC (Milliman, 1993). Also shown are approximate fluxes for the shorter-term burial of organic carbon<br />
<strong>and</strong> CaCO 3 in coastal sediments <strong>and</strong> the re-dissolution of a part of the buried CaCO 3 from these sediments. (d) <strong>Carbon</strong> cycling on l<strong>and</strong>. By<br />
contrast with the ocean, most carbon cycling through the l<strong>and</strong> takes place locally within ecosystems. About half of GPP is respired by plants. <strong>The</strong><br />
remainer (NPP) is approximately balanced by heterotrophic respiration with a smaller component of direct oxidation in fires (combustion).<br />
Through senescence of plant tissues, most of NPP joins the detritus pool; some detritus decomposes (i.e., is respired <strong>and</strong> returned to the<br />
atmosphere as CO 2) quickly while some is converted to modified soil carbon, which decomposes more slowly. <strong>The</strong> small fraction of modified soil<br />
carbon that is further converted to compounds resistant to decomposition, <strong>and</strong> the small amount of black carbon produced in fires, constitute the<br />
“inert” carbon pool. It is likely that biological processes also consume much of the “inert” carbon as well but little is currently known about these<br />
processes. Estimates for soil carbon amounts are from Batjes (1996) <strong>and</strong> partitioning from Schimel et al. (1994) <strong>and</strong> Falloon et al. (1998). <strong>The</strong><br />
estimate for the combustion flux is from Scholes <strong>and</strong> Andreae (2000). ‘τ’ denotes the turnover time for different components of soil organic matter.
190 <strong>The</strong> <strong>Carbon</strong> <strong>Cycle</strong> <strong>and</strong> <strong>Atmospheric</strong> <strong>Carbon</strong> <strong>Dioxide</strong><br />
Box 3.1: Measuring terrestrial carbon stocks <strong>and</strong> fluxes.<br />
Estimating the carbon stocks in terrestrial ecosystems <strong>and</strong> accounting for changes in these stocks requires adequate information<br />
on l<strong>and</strong> cover, carbon density in vegetation <strong>and</strong> soils, <strong>and</strong> the fate of carbon (burning, removals, decomposition). Accounting for<br />
changes in all carbon stocks in all areas would yield the net carbon exchange between terrestrial ecosystems <strong>and</strong> the atmosphere<br />
(NBP).<br />
Global l<strong>and</strong> cover maps show poor agreement due to different definitions of cover types <strong>and</strong> inconsistent sources of data (de<br />
Fries <strong>and</strong> Townshend, 1994). L<strong>and</strong> cover changes are difficult to document, uncertainties are large, <strong>and</strong> historical data are sparse.<br />
Satellite imagery is a valuable tool for estimating l<strong>and</strong> cover, despite problems with cloud cover, changes at fine spatial scales,<br />
<strong>and</strong> interpretation (for example, difficulties in distinguishing primary <strong>and</strong> secondary forest). Aerial photography <strong>and</strong> ground<br />
measurements can be used to validate satellite-based observations.<br />
<strong>The</strong> carbon density of vegetation <strong>and</strong> soils has been measured in numerous ecological field studies that have been aggregated<br />
to a global scale to assess carbon stocks <strong>and</strong> NPP (e.g., Atjay et al., 1979; Olson et al., 1983; Saugier <strong>and</strong> Roy, 2001; Table 3.2),<br />
although high spatial <strong>and</strong> temporal heterogeneity <strong>and</strong> methodological differences introduce large uncertainties. L<strong>and</strong> inventory<br />
studies tend to measure the carbon stocks in vegetation <strong>and</strong> soils over larger areas <strong>and</strong>/or longer time periods. For example, the<br />
United Nations Food <strong>and</strong> Agricultural Organisation (FAO) has been compiling forest inventories since 1946 providing detailed<br />
data on carbon stocks, often based on commercial wood production data. Inventory studies include managed forests with mixed<br />
age st<strong>and</strong>s, thus average carbon stock values are often lower than those based on ecological site studies, which have generally<br />
been carried out in relatively undisturbed, mature ecosystems. Fluxes of carbon can be estimated from changes in inventoried<br />
carbon stocks (e.g., UN-ECE/FAO, 2000), or from combining data on l<strong>and</strong>-use change with methods to calculate changes in<br />
carbon stock (e.g., Houghton, 1999). <strong>The</strong> greatest uncertainty in both methods is in estimating the fate of the carbon: the fraction<br />
which is burned, rates of decomposition, the effect of burning <strong>and</strong> harvesting on soil carbon, <strong>and</strong> subsequent l<strong>and</strong> management.<br />
Ecosystem-atmosphere CO 2 exchange on short time-scales can be measured using micrometeorological techniques such as<br />
eddy covariance, which relies on rapidly responding sensors mounted on towers to resolve the net flux of CO 2 between a patch<br />
of l<strong>and</strong> <strong>and</strong> the atmosphere (Baldocchi et al., 1988). <strong>The</strong> annual integral of the measured CO 2 exchange is approximately equivalent<br />
to NEP (Wofsy et al., 1993; Goulden et. al, 1996; Aubinet et al., 2000). This innovation has led to the establishment of a<br />
rapidly exp<strong>and</strong>ing network of long-term monitoring sites (FLUXNET) with many sites now operating for several years,<br />
improving the underst<strong>and</strong>ing of the physiological <strong>and</strong> ecological processes that control NEP (e.g., Valentini et al., 2000). <strong>The</strong><br />
distribution of sites is currently biased toward regrowing forests in the Northern Hemisphere, <strong>and</strong> there are still technical<br />
problems <strong>and</strong> uncertainties, although these are being tackled. Current flux measurement techniques typically integrate processes<br />
at a scale less than 1 km 2 .<br />
Table 3.1: Global CO 2 budgets (in PgC/yr) based on intra-decadal trends in atmospheric CO 2 <strong>and</strong> O 2. Positive values are fluxes to the atmosphere;<br />
negative values represent uptake from the atmosphere. <strong>The</strong> fossil fuel emissions term for the 1980s (Marl<strong>and</strong> et al., 2000) has been slightly revised<br />
downward since the SAR. Error bars denote uncertainty (± 1σ), not interannual variability, which is substantially greater.<br />
1980s 1990s<br />
<strong>Atmospheric</strong> increase 3.3 ± 0.1 3.2 ± 0.1<br />
Emissions (fossil fuel, cement) 5.4 ± 0.3 6.3 ± 0.4<br />
Ocean-atmosphere flux −1.9 ± 0.6 −1.7 ± 0.5<br />
L<strong>and</strong>-atmosphere flux *<br />
*partitioned as follows :<br />
−0.2 ± 0.7 −1.4 ± 0.7<br />
L<strong>and</strong>-use change 1.7 (0.6 to 2.5) NA<br />
Residual terrestrial sink −1.9 (−3.8 to 0.3) NA<br />
* <strong>The</strong> l<strong>and</strong>-atmosphere flux represents the balance of a positive term due to l<strong>and</strong>-use change <strong>and</strong> a residual terrestrial sink. <strong>The</strong> two terms cannot<br />
be separated on the basis of current atmospheric measurements. Using independent analyses to estimate the l<strong>and</strong>-use change component for the<br />
1980s based on Houghton (1999), Houghton <strong>and</strong> Hackler (1999), Houghton et al. (2000), <strong>and</strong> the CCMLP (McGuire et al., 2001) the residual<br />
terrestrial sink can be inferred for the 1980s. Comparable global data on l<strong>and</strong>-use changes through the 1990s are not yet available.
<strong>The</strong> <strong>Carbon</strong> <strong>Cycle</strong> <strong>and</strong> <strong>Atmospheric</strong> <strong>Carbon</strong> <strong>Dioxide</strong><br />
3.2 Terrestrial <strong>and</strong> Ocean Biogeochemistry: Update on<br />
Processes<br />
3.2.1 Overview of the <strong>Carbon</strong> <strong>Cycle</strong><br />
<strong>The</strong> first panel of Figure 3.1 shows the major components of the<br />
carbon cycle, estimates of the current storage in the active<br />
compartments, <strong>and</strong> estimates of the gross fluxes between<br />
compartments. <strong>The</strong> second panel shows best estimates of the<br />
additional flux (release to the atmosphere – positive; uptake –<br />
negative) associated with the human perturbation of the carbon<br />
cycle during the 1980s. Note that the gross amounts of carbon<br />
annually exchanged between the ocean <strong>and</strong> atmosphere, <strong>and</strong><br />
between the l<strong>and</strong> <strong>and</strong> atmosphere, represent a sizeable fraction of<br />
the atmospheric CO 2 content – <strong>and</strong> are many times larger than the<br />
total anthropogenic CO 2 input. In consequence, an imbalance in<br />
these exchanges could easily lead to an anomaly of comparable<br />
magnitude to the direct anthropogenic perturbation. This implies<br />
that it is important to consider how these fluxes may be changing<br />
in response to human activities.<br />
To underst<strong>and</strong> how the changing global environment may<br />
alter the carbon cycle, it is necessary to further analyse the fluxes<br />
<strong>and</strong> examine the physicochemical <strong>and</strong> biological processes that<br />
determine them. <strong>The</strong> remaining two panels of Figure 3.1 indicate<br />
the main constituent fluxes in the terrestrial <strong>and</strong> marine systems,<br />
with current estimates of their magnitude. <strong>The</strong> following sections<br />
explain the controls on these fluxes, with special reference to<br />
processes by which anthropogenic changes may influence the<br />
overall carbon balance of the l<strong>and</strong> <strong>and</strong> oceans on time-scales<br />
from years to centuries.<br />
3.2.2 Terrestrial <strong>Carbon</strong> Processes<br />
3.2.2.1 Background<br />
Higher plants acquire CO 2 by diffusion through tiny pores<br />
(stomata) into leaves <strong>and</strong> thus to the sites of photosynthesis. <strong>The</strong><br />
total amount of CO 2 that dissolves in leaf water amounts to<br />
about 270 PgC/yr, i.e., more than one-third of all the CO 2 in the<br />
atmosphere (Farquhar et al., 1993; Ciais et al., 1997). This<br />
quantity is measurable because this CO 2 has time to exchange<br />
oxygen atoms with the leaf water <strong>and</strong> is imprinted with the<br />
corresponding 18 O “signature” (Francey <strong>and</strong> Tans, 1987;<br />
Farquhar et al., 1993). Most of this CO 2 diffuses out again<br />
without participating in photosynthesis. <strong>The</strong> amount that is<br />
“fixed” from the atmosphere, i.e., converted from CO 2 to<br />
carbohydrate during photosynthesis, is known as gross primary<br />
production (GPP). Terrestrial GPP has been estimated as about<br />
120 PgC/yr based on 18 O measurements of atmospheric CO 2<br />
(Ciais et al., 1997). This is also the approximate value necessary<br />
to support observed plant growth, assuming that about half of<br />
GPP is incorporated into new plant tissues such as leaves, roots<br />
<strong>and</strong> wood, <strong>and</strong> the other half is converted back to atmospheric<br />
CO 2 by autotrophic respiration (respiration by plant tissues)<br />
(Lloyd <strong>and</strong> Farquhar, 1996; Waring et al., 1998).<br />
Annual plant growth is the difference between photosynthesis<br />
<strong>and</strong> autotrophic respiration, <strong>and</strong> is referred to as net<br />
primary production (NPP). NPP has been measured in all major<br />
191<br />
ecosystem types by sequential harvesting or by measuring plant<br />
biomass (Hall et al., 1993). Global terrestrial NPP has been<br />
estimated at about 60 PgC/yr through integration of field<br />
measurements (Table 3.2) (Atjay et al., 1979; Saugier <strong>and</strong> Roy,<br />
2001). Estimates from remote sensing <strong>and</strong> atmospheric CO 2 data<br />
(Ruimy et al., 1994; Knorr <strong>and</strong> Heimann, 1995) concur with this<br />
value, although there are large uncertainties in all methods.<br />
Eventually, virtually all of the carbon fixed in NPP is returned to<br />
the atmospheric CO 2 pool through two processes: heterotrophic<br />
respiration (Rh) by decomposers (bacteria <strong>and</strong> fungi feeding on<br />
dead tissue <strong>and</strong> exudates) <strong>and</strong> herbivores; <strong>and</strong> combustion in<br />
natural or human-set fires (Figure 3.1d).<br />
Most dead biomass enters the detritus <strong>and</strong> soil organic matter<br />
pools where it is respired at a rate that depends on the chemical<br />
composition of the dead tissues <strong>and</strong> on environmental conditions<br />
(for example, low temperatures, dry conditions <strong>and</strong> flooding slow<br />
down decomposition). Conceptually, several soil carbon pools<br />
are distinguished. Detritus <strong>and</strong> microbial biomass have a short<br />
turnover time (
192 <strong>The</strong> <strong>Carbon</strong> <strong>Cycle</strong> <strong>and</strong> <strong>Atmospheric</strong> <strong>Carbon</strong> <strong>Dioxide</strong><br />
Box 3.2: Maximum impacts of reforestation <strong>and</strong> deforestation on atmospheric CO 2.<br />
Rough upper bounds for the impact of reforestation on atmospheric CO 2 concentration over a century time-scale can be calculated<br />
as follows. Cumulative carbon losses to the atmosphere due to l<strong>and</strong>-use change during the past 1 to 2 centuries are estimated as<br />
180 to 200 PgC (de Fries et al., 1999) <strong>and</strong> cumulative fossil fuel emissions to year 2000 as 280 PgC (Marl<strong>and</strong> et al., 2000), giving<br />
cumulative anthropogenic emissions of 480 to 500 PgC. <strong>Atmospheric</strong> CO 2 content has increased by 90 ppm (190 PgC).<br />
Approximately 40% of anthropogenic CO 2 emissions has thus remained in the atmosphere; the rest has been taken up by the l<strong>and</strong><br />
<strong>and</strong> oceans in roughly equal proportions (see main text). Conversely, if l<strong>and</strong>-use change were completely reversed over the 21st<br />
century, a CO 2 reduction of 0.40 × 200 = 80 PgC (about 40 ppm) might be expected. This calculation assumes that future ecosystems<br />
will not store more carbon than pre-industrial ecosystems, <strong>and</strong> that ocean uptake will be less because of lower CO 2 concentration<br />
in the atmosphere (see Section 3.2.3.1) .<br />
A higher bound can be obtained by assuming that the carbon taken up by the l<strong>and</strong> during the past 1 to 2 centuries, i.e. about<br />
half of the carbon taken up by the l<strong>and</strong> <strong>and</strong> ocean combined, will be retained there. This calculation yields a CO 2 reduction of<br />
0.70 × 200 = 140 PgC (about 70 ppm). <strong>The</strong>se calculations are not greatly influenced by the choice of reference period. Both<br />
calculations require the extreme assumption that a large proportion of today’s agricultural l<strong>and</strong> is returned to forest.<br />
<strong>The</strong> maximum impact of total deforestation can be calculated in a similar way. Depending on different assumptions about<br />
vegetation <strong>and</strong> soil carbon density in different ecosystem types (Table 3.2) <strong>and</strong> the proportion of soil carbon lost during deforestation<br />
(20 to 50%; IPCC, 1997), complete conversion of forests to climatically equivalent grassl<strong>and</strong>s would add 400 to 800 PgC to<br />
the atmosphere. Thus, global deforestation could theoretically add two to four times more CO 2 to the atmosphere than could be<br />
subtracted by reforestation of cleared areas.<br />
Table 3.2: Estimates of terrestrial carbon stocks <strong>and</strong> NPP (global aggregated values by biome).<br />
Biome Area (10 9 ha) Global <strong>Carbon</strong> Stocks (PgC) f<br />
WBGU a MRS b<br />
WBGU a<br />
<strong>Carbon</strong> density (MgC/ha) NPP (PgC/yr)<br />
a WBGU (1988): forest data from Dixon et al. (1994); other data from Atjay et al. (1979).<br />
b MRS: Mooney, Roy <strong>and</strong> Saugier (MRS) (2001). Temperate grassl<strong>and</strong> <strong>and</strong> Mediterranean shrubl<strong>and</strong> categories combined.<br />
c IGBP-DIS (International Geosphere-Biosphere Programme – Data Information Service) soil carbon layer (Carter <strong>and</strong> Scholes, 2000) overlaid<br />
with De Fries et al. (1999) current vegetation map to give average ecosystem soil carbon.<br />
d WBGU boreal forest vegetation estimate is likely to be to high, due to high Russian forest density estimates including st<strong>and</strong>ing dead biomass.<br />
e MRS temperate forest estimate is likely to be too high, being based on mature st<strong>and</strong> density.<br />
f Soil carbon values are for the top 1 m, although stores are also high below this depth in peatl<strong>and</strong>s <strong>and</strong> tropical forests.<br />
g Variations in classification of ecosystems can lead to inconsistencies. In particular, wetl<strong>and</strong>s are not recognised in the MRS classification.<br />
h Total l<strong>and</strong> area of 14.93 × 10⁹ ha in MRS includes 1.55 × 10⁹ ha ice cover not listed in this table. InWBGU, ice is included in deserts <strong>and</strong> semideserts<br />
category.<br />
MRS b<br />
IGBP c<br />
WBGU a<br />
MRS b<br />
Plants Soil Total Plants Soil Total Plants Soil Plants Soil<br />
IGBP c Atjay a MRS b<br />
Tropical forests 1.76 1.75 212 216 428 340 213 553 120 123 194 122 13.7 21.9<br />
Temperate forests 1.04 1.04 59 100 159 139 e<br />
Boreal forests 1.37 1.37 88 d<br />
153 292 57 96 134 147 6.5 8.1<br />
471 559 57 338 395 64 344 42 247 3.2 2.6<br />
Tropical savannas & grassl<strong>and</strong>s 2.25 2.76 66 264 330 79 247 326 29 117 29 90 17.7 14.9<br />
Temperate grassl<strong>and</strong>s & shrubl<strong>and</strong>s 1.25 1.78 9 295 304 23 176 199 7 236 13 99 5.3 7.0<br />
Deserts <strong>and</strong> semi deserts 4.55 2.77 8 191 199 10 159 169 2 42 4 57 1.4 3.5<br />
Tundra 0.95 0.56 6 121 127 2 115 117 6 127 4 206 1.0 0.5<br />
Cropl<strong>and</strong>s 1.60 1.35 3 128 131 4 165 169 2 80 3 122 6.8 4.1<br />
Wetl<strong>and</strong>s g<br />
Total 15.12 14.93 h<br />
h<br />
0.35 − 15 225 240 − − − 43 643 − − 4.3 −<br />
466 2011 2477 654 1567 2221 59.9 62.6
<strong>The</strong> <strong>Carbon</strong> <strong>Cycle</strong> <strong>and</strong> <strong>Atmospheric</strong> <strong>Carbon</strong> <strong>Dioxide</strong><br />
By definition, for an ecosystem in steady state, Rh <strong>and</strong> other<br />
carbon losses would just balance NPP, <strong>and</strong> NBP would be zero.<br />
In reality, human activities, natural disturbances <strong>and</strong> climate<br />
variability alter NPP <strong>and</strong> Rh, causing transient changes in the<br />
terrestrial carbon pool <strong>and</strong> thus non-zero NBP. If the rate of<br />
carbon input (NPP) changes, the rate of carbon output (Rh) also<br />
changes, in proportion to the altered carbon content; but there is<br />
a time lag between changes in NPP <strong>and</strong> changes in the slower<br />
responding carbon pools. For a step increase in NPP, NBP is<br />
expected to increase at first but to relax towards zero over a<br />
period of years to decades as the respiring pool “catches up”.<br />
<strong>The</strong> globally averaged lag required for Rh to catch up with a<br />
change in NPP has been estimated to be of the order of 10 to 30<br />
years (Raich <strong>and</strong> Schlesinger, 1992). A continuous increase in<br />
NPP is expected to produce a sustained positive NBP, so long as<br />
NPP is still increasing, so that the increased terrestrial carbon<br />
has not been processed through the respiring carbon pools<br />
(Taylor <strong>and</strong> Lloyd, 1992; Friedlingstein et al., 1995a; Thompson<br />
et al., 1996; Kicklighter et al., 1999), <strong>and</strong> provided that the<br />
increase is not outweighed by compensating increases in<br />
mortality or disturbance.<br />
<strong>The</strong> terrestrial system is currently acting as a global sink for<br />
carbon (Table 3.1) despite large releases of carbon due to<br />
deforestation in some regions. Likely mechanisms for the sink<br />
are known, but their relative contribution is uncertain. Natural<br />
climate variability <strong>and</strong> disturbance regimes (including fire <strong>and</strong><br />
herbivory) affect NBP through their impacts on NPP, allocation<br />
to long- versus short-lived tissues, chemical <strong>and</strong> physical properties<br />
of litter, stocks of living biomass, stocks of detritus <strong>and</strong> soil<br />
carbon, environmental controls on decomposition <strong>and</strong> rates of<br />
biomass removal. Human impacts occur through changes in l<strong>and</strong><br />
use <strong>and</strong> l<strong>and</strong> management, <strong>and</strong> through indirect mechanisms<br />
including climate change, <strong>and</strong> fertilisation due to elevated CO 2<br />
<strong>and</strong> deposition of nutrients (most importantly, reactive nitrogen).<br />
<strong>The</strong>se mechanisms are discussed individually in the following<br />
sections.<br />
3.2.2.2 Effects of changes in l<strong>and</strong> use <strong>and</strong> l<strong>and</strong> management<br />
Changes in l<strong>and</strong> use <strong>and</strong> management affect the amount of<br />
carbon in plant biomass <strong>and</strong> soils. Historical cumulative carbon<br />
losses due to changes in l<strong>and</strong> use have been estimated to be 180<br />
to 200 PgC by comparing maps of “natural” vegetation in the<br />
absence of human disturbance (derived from ground-based<br />
information (Matthews, 1983) or from modelled potential vegetation<br />
based on climate (Leemans, 1990)) to a map of current<br />
vegetation derived from 1987 satellite data (de Fries et al., 1999).<br />
Houghton (1999, 2000) estimated emissions of 121 PgC (approximately<br />
60% in tropical areas <strong>and</strong> 40% in temperate areas) for the<br />
period 1850 to 1990 from statistics on l<strong>and</strong>-use change, <strong>and</strong> a<br />
simple model tracking rates of decomposition from different<br />
pools <strong>and</strong> rates of regrowth on ab<strong>and</strong>oned or reforested l<strong>and</strong>.<br />
<strong>The</strong>re was substantial deforestation in temperate areas prior to<br />
1850, <strong>and</strong> this may be partially reflected in the difference<br />
between these two analyses. <strong>The</strong> estimated l<strong>and</strong>-use emissions<br />
during 1850 to 1990 of 121 PgC (Houghton, 1999, 2000) can be<br />
compared to estimated net terrestrial flux of 39 PgC to the<br />
atmosphere over the same period inferred from an atmospheric<br />
193<br />
increase of 144 PgC (Etheridge et al., 1996; Keeling <strong>and</strong> Whorf,<br />
2000), a release of 212 PgC due to fossil fuel burning (Marl<strong>and</strong> et<br />
al., 2000), <strong>and</strong> a modelled ocean-atmosphere flux of about −107<br />
PgC (Gruber, 1998, Sabine et al., 1999, Feely et al., 1999a). <strong>The</strong><br />
difference between the net terrestrial flux <strong>and</strong> estimated l<strong>and</strong>-use<br />
change emissions implies a residual l<strong>and</strong>-atmosphere flux of −82<br />
PgC (i.e., a terrestrial sink) over the same period. Box 3.2<br />
indicates the theoretical upper bounds for additional carbon<br />
storage due to l<strong>and</strong>-use change, similar bounds for carbon loss by<br />
continuing deforestation, <strong>and</strong> the implications of these calculations<br />
for atmospheric CO 2.<br />
L<strong>and</strong> use responds to social <strong>and</strong> economic pressures to<br />
provide food, fuel <strong>and</strong> wood products, for subsistence use or for<br />
export. L<strong>and</strong> clearing can lead to soil degradation, erosion <strong>and</strong><br />
leaching of nutrients, <strong>and</strong> may therefore reduce the subsequent<br />
ability of the ecosystem to act as a carbon sink (Taylor <strong>and</strong> Lloyd,<br />
1992). Ecosystem conservation <strong>and</strong> management practices can<br />
restore, maintain <strong>and</strong> enlarge carbon stocks (IPCC, 2000a). Fire<br />
is important in the carbon budget of some ecosystems (e.g.,<br />
boreal forests, grassl<strong>and</strong>s, tropical savannas <strong>and</strong> woodl<strong>and</strong>s) <strong>and</strong><br />
is affected directly by management <strong>and</strong> indirectly by l<strong>and</strong>-use<br />
change (Apps et al., 1993). Fire is a major short-term source of<br />
carbon, but adds to a small longer-term sink (
194 <strong>The</strong> <strong>Carbon</strong> <strong>Cycle</strong> <strong>and</strong> <strong>Atmospheric</strong> <strong>Carbon</strong> <strong>Dioxide</strong><br />
other areas, fire suppression, eradication of indigenous browsers<br />
<strong>and</strong> the introduction of intensive grazing <strong>and</strong> exotic trees <strong>and</strong><br />
shrubs have caused an increase in woody plant density known as<br />
woody encroachment or tree thickening (Archer et al., 2001).<br />
This process has been estimated to result in a CO 2 sink of up to<br />
0.17 PgC/yr in the USA during the 1980s (Houghton et al., 1999)<br />
<strong>and</strong> at least 0.03 PgC/yr in Australia (Burrows, 1998). Grassl<strong>and</strong><br />
ecosystems have high root production <strong>and</strong> store most of their<br />
carbon in soils where turnover is relatively slow, allowing the<br />
possibility of enhancement through management (e.g., Fisher et<br />
al., 1994).<br />
Peatl<strong>and</strong>s/wetl<strong>and</strong>s<br />
Peatl<strong>and</strong>s/wetl<strong>and</strong>s are large reserves of carbon, because<br />
anaerobic soil conditions <strong>and</strong> (in northern peatl<strong>and</strong>s) low temperatures<br />
reduce decomposition <strong>and</strong> promote accumulation of<br />
organic matter. Total carbon stored in northern peatl<strong>and</strong>s has been<br />
estimated as about 455 PgC (Gorham, 1991) with a current<br />
uptake rate in extant northern peatl<strong>and</strong>s of 0.07 PgC/yr (Clymo et<br />
al., 1998). Anaerobic decomposition releases methane (CH 4)<br />
which has a global warming potential (GWP) about 23 times that<br />
of CO 2 (Chapter 6). <strong>The</strong> balance between CH 4 release <strong>and</strong> CO 2<br />
uptake <strong>and</strong> release is highly variable <strong>and</strong> poorly understood.<br />
Draining peatl<strong>and</strong>s for agriculture increases total carbon released<br />
by decomposition, although less is in the form of CH 4. Forests<br />
grown on drained peatl<strong>and</strong>s may be sources or sinks of CO 2<br />
depending on the balance of decomposition <strong>and</strong> tree growth<br />
(Minkkinen <strong>and</strong> Laine, 1998).<br />
Agricultural l<strong>and</strong><br />
Conversion of natural vegetation to agriculture is a major source<br />
of CO 2, not only due to losses of plant biomass but also, increased<br />
decomposition of soil organic matter caused by disturbance <strong>and</strong><br />
energy costs of various agricultural practices (e.g., fertilisation<br />
<strong>and</strong> irrigation; Schlesinger, 2000). Conversely, the use of highyielding<br />
plant varieties, fertilisers, irrigation, residue management<br />
<strong>and</strong> reduced tillage can reduce losses <strong>and</strong> enhance uptake within<br />
managed areas (Cole et al., 1996; Blume et al., 1998). <strong>The</strong>se<br />
processes have led to an estimated increase of soil carbon in<br />
agricultural soils in the USA of 0.14 PgC/yr during the 1980s<br />
(Houghton et al., 1999). IPCC (1996b) estimated that appropriate<br />
management practices could increase carbon sinks by 0.4 to 0.9<br />
PgC/yr , or a cumulative carbon storage of 24 to 43 PgC over 50<br />
years; energy efficiency improvements <strong>and</strong> production of energy<br />
from dedicated crops <strong>and</strong> residues would result in a further<br />
mitigation potential of 0.3 to 1.4 PgC/yr, or a cumulative carbon<br />
storage of 16 to 68 PgC over 50 years (Cole et al., 1996).<br />
Scenarios<br />
<strong>The</strong> IPCC Special Report on L<strong>and</strong> Use, L<strong>and</strong>-Use Change <strong>and</strong><br />
Forestry (IPCC, 2000a) (hereafter SRLULUCF) derived<br />
scenarios of l<strong>and</strong>-use emissions for the period 2008 to 2012. It<br />
was estimated that a deforestation flux of 1.79 PgC/yr is likely to<br />
be offset by reforestation <strong>and</strong> afforestation flux of −0.20 to −0.58<br />
PgC/yr, yielding a net release of 1.59 to 1.20 PgC/yr<br />
(Schlamadinger et al., 2000). <strong>The</strong> potential for net carbon storage<br />
from several “additional activities” such as improved l<strong>and</strong><br />
management <strong>and</strong> other l<strong>and</strong>-use changes was estimated to<br />
amount to a global l<strong>and</strong>-atmosphere flux in the region of −1.3<br />
PgC/yr in 2010 <strong>and</strong> −2.5 PgC/yr in 2040, not including wood<br />
products <strong>and</strong> bioenergy (Sampson et al., 2000).<br />
3.2.2.3 Effects of climate<br />
Solar radiation, temperature <strong>and</strong> available water affect photosynthesis,<br />
plant respiration <strong>and</strong> decomposition, thus climate<br />
change can lead to changes in NEP. A substantial part of the<br />
interannual variability in the rate of increase of CO 2 is likely to<br />
reflect terrestrial biosphere responses to climate variability<br />
(Section 3.5.3). Warming may increase NPP in temperate <strong>and</strong><br />
arctic ecosystems where it can increase the length of the seasonal<br />
<strong>and</strong> daily growing cycles, but it may decrease NPP in waterstressed<br />
ecosystems as it increases water loss. Respiratory<br />
processes are sensitive to temperature; soil <strong>and</strong> root respiration<br />
have generally been shown to increase with warming in the short<br />
term (Lloyd <strong>and</strong> Taylor, 1994; Boone et al., 1998) although<br />
evidence on longer-term impacts is conflicting (Trumbore, 2000;<br />
Giardina <strong>and</strong> Ryan, 2000; Jarvis <strong>and</strong> Linder, 2000). Changes in<br />
rainfall pattern affect plant water availability <strong>and</strong> the length of the<br />
growing season, particularly in arid <strong>and</strong> semi-arid regions. Cloud<br />
cover can be beneficial to NPP in dry areas with high solar<br />
radiation, but detrimental in areas with low solar radiation.<br />
Changing climate can also affect the distribution of plants <strong>and</strong> the<br />
incidence of disturbances such as fire (which could increase or<br />
decrease depending on warming <strong>and</strong> precipitation patterns,<br />
possibly resulting under some circumstances in rapid losses of<br />
carbon), wind, <strong>and</strong> insect <strong>and</strong> pathogen attacks, leading to<br />
changes in NBP. <strong>The</strong> global balance of these positive <strong>and</strong><br />
negative effects of climate on NBP depends strongly on regional<br />
aspects of climate change.<br />
<strong>The</strong> climatic sensitivity of high northern latitude ecosystems<br />
(tundra <strong>and</strong> taiga) has received particular attention as a<br />
consequence of their expanse, high carbon density, <strong>and</strong> observations<br />
of disproportionate warming in these regions (Chapman <strong>and</strong><br />
Walsh, 1993; Overpeck et al., 1997). High-latitude ecosystems<br />
contain about 25% of the total world soil carbon pool in the<br />
permafrost <strong>and</strong> the seasonally-thawed soil layer. This carbon<br />
storage may be affected by changes in temperature <strong>and</strong> water<br />
table depth. High latitude ecosystems have low NPP, in part due<br />
to short growing seasons, <strong>and</strong> slow nutrient cycling because of<br />
low rates of decomposition in waterlogged <strong>and</strong> cold soils.<br />
Remotely sensed data (Myneni et al., 1997) <strong>and</strong> phenological<br />
observations (Menzel <strong>and</strong> Fabian, 1999) independently indicate a<br />
recent trend to longer growing seasons in the boreal zone <strong>and</strong><br />
temperate Europe. Such a trend might be expected to have<br />
increased annual NPP. A shift towards earlier <strong>and</strong> stronger spring<br />
depletion of atmospheric CO 2 has also been observed at northern<br />
stations, consistent with earlier onset of growth at mid- to high<br />
northern latitudes (Manning, 1992; Keeling et al., 1996a;<br />
R<strong>and</strong>erson, 1999). However, recent flux measurements at<br />
individual high-latitude sites have generally failed to find<br />
appreciable NEP (Oechel et al., 1993; Goulden et al., 1998;<br />
Schulze et al., 1999; Oechel et al., 2000). <strong>The</strong>se studies suggest<br />
that, at least in the short term, any direct effect of warming on<br />
NPP may be more than offset by an increased respiration of soil
<strong>The</strong> <strong>Carbon</strong> <strong>Cycle</strong> <strong>and</strong> <strong>Atmospheric</strong> <strong>Carbon</strong> <strong>Dioxide</strong><br />
carbon caused by the effects of increased depth of soil thaw.<br />
Increased decomposition, may, however also increase nutrient<br />
mineralisation <strong>and</strong> thereby indirectly stimulate NPP (Melillo et<br />
al., 1993; Jarvis <strong>and</strong> Linder, 2000; Oechel et al., 2000).<br />
Large areas of the tropics are arid <strong>and</strong> semi-arid, <strong>and</strong> plant<br />
production is limited by water availability. <strong>The</strong>re is evidence that<br />
even evergreen tropical moist forests show reduced GPP during<br />
the dry season (Malhi et al., 1998) <strong>and</strong> may become a carbon<br />
source under the hot, dry conditions of typical El Niño years.<br />
With a warmer ocean surface, <strong>and</strong> consequently generally<br />
increased precipitation, the global trend in the tropics might be<br />
expected to be towards increased NPP, but changing precipitation<br />
patterns could lead to drought, reducing NPP <strong>and</strong> increasing fire<br />
frequency in the affected regions.<br />
3.2.2.4 Effects of increasing atmospheric CO 2<br />
CO 2 <strong>and</strong> O 2 compete for the reaction sites on the photosynthetic<br />
carbon-fixing enzyme, Rubisco. Increasing the concentration of<br />
CO 2 in the atmosphere has two effects on the Rubisco reactions:<br />
increasing the rate of reaction with CO 2 (carboxylation) <strong>and</strong><br />
decreasing the rate of oxygenation. Both effects increase the<br />
rate of photosynthesis, since oxygenation is followed by<br />
photorespiration which releases CO 2 (Farquhar et al., 1980).<br />
With increased photsynthesis, plants can develop faster,<br />
attaining the same final size in less time, or can increase their<br />
final mass. In the first case, the overall rate of litter production<br />
increases <strong>and</strong> so the soil carbon stock increases; in the second<br />
case, both the below-ground <strong>and</strong> above-ground carbon stocks<br />
increase. Both types of growth response to elevated CO 2 have<br />
been observed (Masle, 2000).<br />
<strong>The</strong> strength of the response of photosynthesis to an<br />
increase in CO 2 concentration depends on the photosynthetic<br />
pathway used by the plant. Plants with a photosynthetic<br />
pathway known as C 3 (all trees, nearly all plants of cold<br />
climates, <strong>and</strong> most agricultural crops including wheat <strong>and</strong> rice)<br />
generally show an increased rate of photosynthesis in response<br />
to increases in CO 2 concentration above the present level (Koch<br />
<strong>and</strong> Mooney, 1996; Curtis, 1996; Mooney et al., 1999). Plants<br />
with the C 4 photosynthetic pathway (tropical <strong>and</strong> many<br />
temperate grasses, some desert shrubs, <strong>and</strong> some crops<br />
including maize <strong>and</strong> sugar cane) already have a mechanism to<br />
concentrate CO 2 <strong>and</strong> therefore show either no direct photosynthetic<br />
response, or less response than C 3 plants (W<strong>and</strong> et al.,<br />
1999). Increased CO 2 has also been reported to reduce plant<br />
respiration under some conditions (Drake et al., 1999),<br />
although this effect has been questioned.<br />
Increased CO 2 concentration allows the partial closure of<br />
stomata, restricting water loss during transpiration <strong>and</strong><br />
producing an increase in the ratio of carbon gain to water loss<br />
(“water-use efficiency”, WUE) (Field et al., 1995a; Drake et al.,<br />
1997; Farquhar, 1997; Körner, 2000). This effect can lengthen<br />
the duration of the growing season in seasonally dry ecosystems<br />
<strong>and</strong> can increase NPP in both C 3 <strong>and</strong> C 4 plants.<br />
Nitrogen-use efficiency also generally improves as carbon<br />
input increases, because plants can vary the ratio between<br />
carbon <strong>and</strong> nitrogen in tissues <strong>and</strong> require lower concentrations<br />
of photosynthetic enzymes in order to carry out photosynthesis<br />
195<br />
at a given rate; for this reason, low nitrogen availability does not<br />
consistently limit plant responses to increased atmospheric CO 2<br />
(McGuire et al., 1995; Lloyd <strong>and</strong> Farquhar, 1996; Curtis <strong>and</strong><br />
Wang, 1998; Norby et al., 1999; Körner, 2000). Increased CO 2<br />
concentration may also stimulate nitrogen fixation (Hungate et<br />
al., 1999; Vitousek <strong>and</strong> Field, 1999). Changes in tissue nutrient<br />
concentration may affect herbivory <strong>and</strong> decomposition,<br />
although long-term decomposition studies have shown that the<br />
effect of elevated CO 2 in this respect is likely to be small<br />
(Norby <strong>and</strong> Cortufo, 1998) because changes in the C:N ratio of<br />
leaves are not consistently reflected in the C:N ratio of leaf litter<br />
due to nitrogen retranslocation (Norby et al., 1999).<br />
<strong>The</strong> process of CO 2 “fertilisation” thus involves direct effects<br />
on carbon assimilation <strong>and</strong> indirect effects such as those via<br />
water saving <strong>and</strong> interactions between the carbon <strong>and</strong> nitrogen<br />
cycles. Increasing CO 2 can therefore lead to structural <strong>and</strong><br />
physiological changes in plants (Pritchard et al., 1999) <strong>and</strong> can<br />
further affect plant competition <strong>and</strong> distribution patterns due to<br />
responses of different species. Field studies show that the relative<br />
stimulation of NPP tends to be greater in low-productivity years,<br />
suggesting that improvements in water- <strong>and</strong> nutrient-use<br />
efficiency can be more important than direct NPP stimulation<br />
(Luo et al., 1999).<br />
Although NPP stimulation is not automatically reflected in<br />
increased plant biomass, additional carbon is expected to enter<br />
the soil, via accelerated ontogeny, which reduces lifespan <strong>and</strong><br />
results in more rapid shoot death, or by enhanced root turnover<br />
or exudation (Koch <strong>and</strong> Mooney, 1996; Allen et al., 2000).<br />
Because the soil microbial community is generally limited by<br />
the availability of organic substrates, enhanced addition of<br />
labile carbon to the soil tends to increase heterotrophic respiration<br />
unless inhibited by other factors such as low temperature<br />
(Hungate et al., 1997; Schlesinger <strong>and</strong> Andrews, 2000). Field<br />
studies have indicated increases in soil organic matter, <strong>and</strong><br />
increases in soil respiration of about 30%, under elevated CO 2<br />
(Schlesinger <strong>and</strong> Andrews, 2000). <strong>The</strong> potential role of the soil<br />
as a carbon sink under elevated CO 2 is crucial to underst<strong>and</strong>ing<br />
NEP <strong>and</strong> long-term carbon dynamics, but remains insufficiently<br />
well understood (Trumbore, 2000).<br />
C 3 crops show an average increase in NPP of around 33% for<br />
a doubling of atmospheric CO 2 (Koch <strong>and</strong> Mooney, 1996).<br />
Grassl<strong>and</strong> <strong>and</strong> crop studies combined show an average biomass<br />
increase of 14%, with a wide range of responses among<br />
individual studies (Mooney et al., 1999). In cold climates, low<br />
temperatures restrict the photosynthetic response to elevated<br />
CO 2. In tropical grassl<strong>and</strong>s <strong>and</strong> savannas, C 4 grasses are<br />
dominant, so it has been assumed that trees <strong>and</strong> C 3 grasses<br />
would gain a competitive advantage at high CO 2 (Gifford, 1992;<br />
Collatz et al., 1998). This is supported by carbon isotope<br />
evidence from the last glacial maximum, which suggests that<br />
low CO 2 favours C 4 plants (Street-Perrott et al., 1998). However,<br />
field experiments suggest a more complex picture with C 4 plants<br />
sometimes doing better than C 3 under elevated CO 2 due to<br />
improved WUE at the ecosystem level (Owensby et al., 1993;<br />
Polley et al., 1996). Highly productive forest ecosystems have<br />
the greatest potential for absolute increases in productivity due<br />
to CO 2 effects. Long-term field studies on young trees have
196 <strong>The</strong> <strong>Carbon</strong> <strong>Cycle</strong> <strong>and</strong> <strong>Atmospheric</strong> <strong>Carbon</strong> <strong>Dioxide</strong><br />
typically shown a stimulation of photosynthesis of about 60%<br />
for a doubling of CO 2 (Saxe et al., 1998; Norby et al., 1999). A<br />
FACE experiment in a fast growing young pine forest showed<br />
an increase of 25% in NPP for an increase in atmospheric CO 2<br />
to 560 ppm (DeLucia et al., 1999). Some of this additional NPP<br />
is allocated to root metabolism <strong>and</strong> associated microbes; soil<br />
CO 2 efflux increases, returning a part (but not all) of the extra<br />
NPP to the atmosphere (Allen et al., 2000). <strong>The</strong> response of<br />
mature forests to increases in atmospheric CO 2 concentration<br />
has not been shown experimentally; it may be different from<br />
that of young forests for various reasons, including changes in<br />
leaf C:N ratios <strong>and</strong> stomatal responses to water vapour deficits<br />
as trees mature (Curtis <strong>and</strong> Wang, 1998; Norby et al., 1999).<br />
At high CO 2 concentrations there can be no further increase<br />
in photosynthesis with increasing CO 2 (Farquhar et al., 1980),<br />
except through further stomatal closure, which may produce<br />
continued increases in WUE in water-limited environments. <strong>The</strong><br />
shape of the response curve of global NPP at higher CO 2 concentrations<br />
than present is uncertain because the response at the level<br />
of gas exchange is modified by incompletely understood plant<strong>and</strong><br />
ecosystem-level processes (Luo et al., 1999). Based on<br />
photosynthetic physiology, it is likely that the additional carbon<br />
that could be taken up globally by enhanced photosynthsis as a<br />
direct consequence of rising atmospheric CO 2 concentration is<br />
small at atmospheric concentrations above 800 to 1,000 ppm.<br />
Experimental studies indicate that some ecosystems show greatly<br />
reduced CO 2 fertilisation at lower concentrations than this<br />
(Körner, 2000).<br />
3.2.2.5 Effects of anthropogenic nitrogen deposition<br />
Nitrogen availability is an important constraint on NPP<br />
(Vitousek et al., 1997), although phosphorus <strong>and</strong> calcium may<br />
be more important limiting nutrients in many tropical <strong>and</strong> subtropical<br />
regions (Matson, 1999). Reactive nitrogen is released<br />
into the atmosphere in the form of nitrogen oxides (NO x) during<br />
fossil fuel <strong>and</strong> biomass combustion <strong>and</strong> ammonia emitted by<br />
industrial regions, animal husb<strong>and</strong>ry <strong>and</strong> fertiliser use (Chapter<br />
4). This nitrogen is then deposited fairly near to the source, <strong>and</strong><br />
can act as a fertiliser for terrestrial plants. <strong>The</strong>re has been a<br />
rapid increase in reactive nitrogen deposition over the last 150<br />
years (Vitousek et al., 1997; Holl<strong>and</strong> et al., 1999). Much field<br />
evidence on nitrogen fertilisation effects on plants (e.g.,<br />
Chapin, 1980; Vitousek <strong>and</strong> Howarth, 1991; Bergh et al., 1999)<br />
supports the hypothesis that additional nitrogen deposition will<br />
result in increased NPP, including the growth of trees in Europe<br />
(Spiecker et al., 1996). <strong>The</strong>re is also evidence (Fog, 1988;<br />
Bryant et al., 1998) that N fertilisation enhances the formation<br />
of modified soil organic matter <strong>and</strong> thus increases the residence<br />
time of carbon in soils.<br />
Tracer experiments with addition of the stable isotope 15 N<br />
provide insight into the short-term fate of deposited reactive<br />
nitrogen (Gundersen et al., 1998). It is clear from these<br />
experiments that most of the added N added to the soil<br />
surface is retained in the ecosystem rather than being leached<br />
out via water transport or returned to the atmosphere in<br />
gaseous form (as N 2, NO, N 2O or NH 3). Studies have also<br />
shown that the tracer is found initially in the soil<br />
(Nadelhoffer et al., 1999), but that it enters the vegetation<br />
after a few years (Clark 1977; Schimel <strong>and</strong> Chapin, 1996;<br />
Delgado et al., 1996; Schulze, 2000).<br />
<strong>The</strong>re is an upper limit to the amount of added N that can<br />
fertilise plant growth. This limit is thought to have been reached<br />
in highly polluted regions of Europe. With nitrogen saturation,<br />
ecosystems are no longer able to process the incoming nitrogen<br />
deposition, <strong>and</strong> may also suffer from deleterious effects of associated<br />
pollutants such as ozone (O 3), nutrient imbalance, <strong>and</strong><br />
aluminium toxicity (Schulze et al., 1989; Aber et al., 1998).<br />
3.2.2.6 Additional impacts of changing atmospheric chemistry<br />
Current tropospheric O 3 concentrations in Europe <strong>and</strong> North<br />
America cause visible leaf injury on a range of crop <strong>and</strong> tree<br />
species <strong>and</strong> have been shown to reduce the growth <strong>and</strong> yield of<br />
crops <strong>and</strong> young trees in experimental studies. <strong>The</strong> longer-term<br />
effects of O 3 on forest productivity are less certain, although<br />
significant negative associations between ozone exposure <strong>and</strong><br />
forest growth have been reported in North America (Mclaughlin<br />
<strong>and</strong> Percy, 2000) <strong>and</strong> in central Europe (Braun et al., 2000). O 3<br />
is taken up through stomata, so decreased stomatal conductance<br />
at elevated CO 2 may reduce the effects of O 3 (Semenov et al.,<br />
1998, 1999). <strong>The</strong>re is also evidence of significant interactions<br />
between O 3 <strong>and</strong> soil water availability in effects on stem growth<br />
or NPP from field studies (e.g., Mclaughlin <strong>and</strong> Downing,<br />
1995) <strong>and</strong> from modelling studies (e.g., Ollinger et al., 1997).<br />
<strong>The</strong> regional impacts of O 3 on NPP elsewhere in the world are<br />
uncertain, although significant impacts on forests have been<br />
reported close to major cities. Fowler et al. (2000) estimate that<br />
the proportion of global forests exposed to potentially<br />
damaging ozone concentrations will increase from about 25%<br />
in 1990 to about 50% in 2100.<br />
Other possible negative effects of industrially generated<br />
pollution on plant growth include effects of soil acidification<br />
due to deposition of NO 3 − <strong>and</strong> SO4 2− . Severe forest decline has<br />
been observed in regions with high sulphate deposition, for<br />
instance in parts of eastern Europe <strong>and</strong> southern China. <strong>The</strong><br />
wider effects are less certain <strong>and</strong> depend on soil sensitivity.<br />
Fowler et al. (2000) estimate that 8% of global forest cover<br />
received an annual sulphate deposition above an estimated<br />
threshold for effects on acid sensitive soils, <strong>and</strong> that this will<br />
increase to 17% in 2050. <strong>The</strong> most significant long-term effect<br />
of continued acid deposition for forest productivity may be<br />
through depletion of base cations, with evidence of both<br />
increased leaching rates <strong>and</strong> decreased foliar concentrations<br />
(Mclaughlin <strong>and</strong> Percy, 2000), although the link between these<br />
changes in nutrient cycles <strong>and</strong> NPP needs to be quantified.<br />
3.2.2.7 Additional constraints on terrestrial CO 2 uptake<br />
It is very likely that there are upper limits to carbon storage in<br />
ecosystems due to mechanical <strong>and</strong> resource constraints on the<br />
amount of above ground biomass <strong>and</strong> physical limits to the<br />
amount of organic carbon that can be held in soils (Scholes et al.,<br />
1999). It is also generally expected that increased above-ground<br />
NPP (production of leaves <strong>and</strong> stem) will to some extent be<br />
counterbalanced by an increased rate of turnover of the biomass<br />
as upper limits are approached.
<strong>The</strong> <strong>Carbon</strong> <strong>Cycle</strong> <strong>and</strong> <strong>Atmospheric</strong> <strong>Carbon</strong> <strong>Dioxide</strong><br />
3.2.3 Ocean <strong>Carbon</strong> Processes<br />
3.2.3.1 Background<br />
<strong>The</strong> total amount of carbon in the ocean is about 50 times<br />
greater than the amount in the atmosphere, <strong>and</strong> is exchanged<br />
with the atmosphere on a time-scale of several hundred years.<br />
Dissolution in the oceans provides a large sink for anthropogenic<br />
CO 2, due in part to its high solubility, but above all<br />
because of its dissociation into ions <strong>and</strong> interactions with sea<br />
water constituents (see Box 3.3).<br />
<strong>The</strong> annual two-way gross exchange of CO 2 between the<br />
atmosphere <strong>and</strong> surface ocean is about 90 PgC/yr, mediated by<br />
molecular diffusion across the air-sea interface. Net CO 2<br />
transfer can occur whenever there is a partial pressure difference<br />
of CO 2 across this interface. <strong>The</strong> flux can be estimated as<br />
the product of a gas transfer coefficient, the solubility of CO 2,<br />
<strong>and</strong> the partial pressure difference of CO 2 between air <strong>and</strong><br />
water. <strong>The</strong> gas transfer coefficient incorporates effects of many<br />
physical factors but is usually expressed as a non-linear<br />
function of wind speed alone. <strong>The</strong>re is considerable uncertainty<br />
about this function (Liss <strong>and</strong> Merlivat, 1986; Wanninkhof,<br />
1992; Watson et al., 1995). Improvements in the ability to<br />
measure CO 2 transfer directly (e.g., Wanninkhof <strong>and</strong> McGillis,<br />
1999) may lead to a better knowledge of gas transfer coefficients.<br />
Despite extensive global measurements conducted during<br />
the 1990s, measurements of surface water pCO 2 remain sparse,<br />
<strong>and</strong> extensive spatial <strong>and</strong> temporal interpolation is required in<br />
order to produce global fields. Takahashi et al. (1999) interpolated<br />
data collected over three decades in order to derive<br />
monthly values of surface water pCO 2 over the globe for a<br />
single “virtual” calendar year (1995). A wind speed dependent<br />
Box 3.3: <strong>The</strong> varying CO 2 uptake capacity of the ocean.<br />
197<br />
gas transfer coefficient was used to calculate monthly net CO 2<br />
fluxes. <strong>The</strong> resulting estimates, although subject to large<br />
uncertainty, revealed clear regional <strong>and</strong> seasonal patterns in net<br />
fluxes.<br />
Regional net CO 2 transfers estimated from contemporary<br />
surface water pCO 2 data should not be confused with the uptake<br />
of anthropogenic CO 2. <strong>The</strong> uptake of anthropogenic CO 2 is the<br />
increase in net transfer over the pre-industrial net transfer, <strong>and</strong><br />
is therefore superimposed on a globally varying pattern of<br />
relatively large natural transfers. <strong>The</strong> natural transfers result<br />
from heating <strong>and</strong> cooling, <strong>and</strong> biological production <strong>and</strong><br />
respiration. <strong>Carbon</strong> is transferred within the ocean from natural<br />
sink regions to natural source regions via ocean circulation <strong>and</strong><br />
the sinking of carbon rich particles. This spatial separation of<br />
natural sources <strong>and</strong> sinks dominates the regional distribution of<br />
net annual air-sea fluxes.<br />
CO 2 solubility is temperature dependent, hence air-sea heat<br />
transfer contributes to seasonal <strong>and</strong> regional patterns of air-sea<br />
CO 2 transfer (Watson et al., 1995). Net cooling of surface<br />
waters tends to drive CO 2 uptake; net warming drives<br />
outgassing. Regions of cooling <strong>and</strong> heating are linked via<br />
circulation, producing vertical gradients <strong>and</strong> north-south<br />
transports of carbon within the ocean (e.g., of the order 0.5 to 1<br />
PgC/yr southward transport in the Atlantic Basin; Broecker <strong>and</strong><br />
Peng, 1992; Keeling <strong>and</strong> Peng, 1995; Watson et al., 1995;<br />
Holfort et al., 1998).<br />
Biological processes also drive seasonal <strong>and</strong> regional distributions<br />
of CO 2 fluxes (Figure 1c). <strong>The</strong> gross primary production<br />
by ocean phytoplankton has been estimated by Bender et al.<br />
(1994) to be 103 PgC/yr. Part of this is returned to DIC through<br />
autotrophic respiration, with the remainder being net primary<br />
production, estimated on the basis of global remote sensing data<br />
Because of its solubility <strong>and</strong> chemical reactivity, CO 2 is taken up by the ocean much more effectively than other anthropogenic<br />
gases (e.g., chlorofluorocarbons (CFCs) <strong>and</strong> CH 4). CO 2 that dissolves in seawater is found in three main forms. <strong>The</strong> sum of these<br />
forms constitutes dissolved inorganic carbon (DIC). <strong>The</strong> three forms are: (1) dissolved CO 2 (non-ionic, about 1% of the total) which<br />
can be exchanged with the atmosphere until the partial pressure in surface water <strong>and</strong> air are equal, (2) bicarbonate ion (HCO 3 − , about<br />
91%); <strong>and</strong> (3) carbonate ion (CO 3 2− , about 8%). As atmospheric CO2 increases, the dissolved CO 2 content of surface seawater<br />
increases at a similar rate, but most of the added CO 2 ends up as HCO 3 − . Meanwhile, the CO3 2− content decreases, since the net<br />
effect of adding CO 2 is a reaction with CO 3 2− to form HCO3 − (Figure 3.1). <strong>The</strong>re is therefore less available CO3 2− to react with further<br />
CO 2 additions, causing an increasing proportion of the added CO 2 to remain in its dissolved form. This restricts further uptake, so<br />
that the overall ability of surface sea water to take up CO 2 decreases at higher atmospheric CO 2 levels. <strong>The</strong> effect is large. For a<br />
100 ppm increase in atmospheric CO 2 above today’s level (i.e., from 370 to 470 ppm) the DIC concentration increase of surface<br />
sea water is already about 40% smaller than would have been caused by a similar 100 ppm increase relative to pre-industrial levels<br />
(i.e., from 280 to 380 ppm). <strong>The</strong> contemporary DIC increase is about 60% greater than would result if atmospheric CO 2 were to<br />
increase from 750 to 850 ppm.<br />
<strong>The</strong> uptake capacity for CO 2 also varies significantly due to additional factors, most importantly seawater temperature, salinity<br />
<strong>and</strong> alkalinity (the latter being a measurable quantity approximately equal to [HCO 3 − ] + 2 × [CO3 2− ]). Alkalinity is influenced<br />
primarily by the cycle of CaCO 3 formation (in shells <strong>and</strong> corals) <strong>and</strong> dissolution (see Figure 3.1c).
198 <strong>The</strong> <strong>Carbon</strong> <strong>Cycle</strong> <strong>and</strong> <strong>Atmospheric</strong> <strong>Carbon</strong> <strong>Dioxide</strong><br />
to be about 45 PgC/yr (Longhurst et al., 1995; Antoine et al.,<br />
1996; Falkowski et al., 1998; Field et al., 1998; Balkanski et al.,<br />
1999). About 14 to 30% of the total NPP occurs in coastal areas<br />
(Gattuso et al., 1998). <strong>The</strong> resulting organic carbon is<br />
consumed by zooplankton (a quantitatively more important<br />
process than herbivory on l<strong>and</strong>) or becomes detritus. Some<br />
organic carbon is released in dissolved form (DOC) <strong>and</strong><br />
oxidised by bacteria (Ducklow, 1999) with a fraction entering<br />
the ocean reservoir as net DOC production (Hansell <strong>and</strong><br />
Carlson, 1998). Sinking of particulate organic carbon (POC)<br />
composed of dead organisms <strong>and</strong> detritus together with vertical<br />
transfer of DOC create a downward flux of organic carbon from<br />
the upper ocean known as “export production”. Recent<br />
estimates for global export production range from roughly 10 to<br />
20 PgC/yr (Falkowski et al., 1998; Laws et al., 2000). An<br />
alternative estimate for global export production of 11 PgC/yr<br />
has been derived using an inverse model of physical <strong>and</strong><br />
chemical data from the world’s oceans (Schlitzer, 2000). Only<br />
a small fraction (about 0.1 PgC) of the export production sinks<br />
in sediments, mostly in the coastal ocean (Gattuso et al., 1998).<br />
Heterotrophic respiration at depth converts the remaining<br />
organic carbon back to DIC. Eventually, <strong>and</strong> usually at another<br />
location, this DIC is upwelled into the ocean’s surface layer<br />
again <strong>and</strong> may re-equilibrate with the atmospheric CO 2. <strong>The</strong>se<br />
mechanisms, often referred to as the biological pump, maintain<br />
higher DIC concentrations at depth <strong>and</strong> cause atmospheric CO 2<br />
concentrations to be about 200 ppm lower than would be the<br />
case in the absence of such mechanisms (Sarmiento <strong>and</strong><br />
Toggweiler, 1984; Maier-Reimer et al., 1996).<br />
Marine organisms also form shells of solid calcium<br />
carbonate (CaCO 3) that sink vertically or accumulate in<br />
sediments, coral reefs <strong>and</strong> s<strong>and</strong>s. This process depletes surface<br />
CO 3 2− , reduces alkalinity, <strong>and</strong> tends to increase pCO2 <strong>and</strong> drive<br />
more outgassing of CO 2 (see Box 3.3 <strong>and</strong> Figure 3.1). <strong>The</strong><br />
effect of CaCO 3 formation on surface water pCO 2 <strong>and</strong> air-sea<br />
fluxes is therefore counter to the effect of organic carbon<br />
production. For the surface ocean globally, the ratio between<br />
the export of organic carbon <strong>and</strong> the export of calcium<br />
carbonate (the “rain ratio”) is a critical factor controlling the<br />
overall effect of biological activity on surface ocean pCO 2<br />
(Figure 3.1; Archer <strong>and</strong> Maier-Reimer, 1994). Milliman (1993)<br />
estimated a global production of CaCO 3 of 0.7 PgC/yr, with<br />
roughly equivalent amounts produced in shallow water <strong>and</strong><br />
surface waters of the deep ocean. Of this total, approximately<br />
60% accumulates in sediments. <strong>The</strong> rest re-dissolves either in<br />
the water column or within the sediment. An estimate of CaCO 3<br />
flux analogous to the export production of organic carbon,<br />
however, should include sinking out of the upper layers of the<br />
open ocean, net accumulation in shallow sediments <strong>and</strong> reefs,<br />
<strong>and</strong> export of material from shallow systems into deep sea<br />
environments. Based on Milliman’s (1993) budget, this quantity<br />
is about 0.6 PgC/yr (± 25 to 50 % at least). <strong>The</strong> global average<br />
rain ratio has been variously estimated from models of varying<br />
complexity to be 4 (Broecker <strong>and</strong> Peng, 1982), 3.5 to 7.5<br />
(Shaffer, 1993), <strong>and</strong> 11 (Yamanaka <strong>and</strong> Tajika, 1996). (It should<br />
be noted that rain ratios are highly depth dependent due to rapid<br />
oxidation of organic carbon at shallow depth compared to the<br />
depths at which sinking CaCO 3 starts to dissolve.) If one<br />
accepts an organic carbon export production value of 11 PgC/yr<br />
(Schlitzer, 2000), then only Yamanaka <strong>and</strong> Tajika’s (1996) value<br />
for the rain ratio approaches consistency with the observationbased<br />
estimates of the export of CaCO 3 <strong>and</strong> organic carbon<br />
from the ocean surface layer.<br />
<strong>The</strong> overall productivity of the ocean is determined largely<br />
by nutrient supply from deep water. <strong>The</strong>re are multiple<br />
potentially limiting nutrients: in practice nitrate <strong>and</strong>/or<br />
phosphate are commonly limiting (Falkowski et al., 1998;<br />
Tyrell, 1999). Silicate plays a role in limiting specific types of<br />
phytoplankton <strong>and</strong> hence in determining the qualitative nature<br />
of primary production, <strong>and</strong> potentially the depth to which<br />
organic carbon sinks. A role for iron in limiting primary productivity<br />
in regions with detectable phosphate <strong>and</strong> nitrate but low<br />
productivity (HNLC or “high nutrient, low chlorophyll<br />
regions”) has been experimentally demonstrated in the equatorial<br />
Pacific (Coale et al., 1996) <strong>and</strong> the Southern Ocean (Boyd<br />
et al., 2000). In both regions artificial addition of iron<br />
stimulated phytoplankton growth, resulting in decreased<br />
surface-water pCO 2. In HLNC regions, the supply of iron from<br />
deep water, while an important source, is generally insufficient<br />
to meet the requirements of phytoplankton. An important<br />
additional supply of iron to surface waters far removed from<br />
sediment <strong>and</strong> riverine sources is aeolian transport <strong>and</strong> deposition<br />
(Duce <strong>and</strong> Tindale, 1991; Fung et al., 2000; Martin, 1990).<br />
This aeolian supply of iron may limit primary production in<br />
HNLC regions, although the effect is ultimately constrained by<br />
the availability of nitrate <strong>and</strong> phosphate. Iron has been hypothesised<br />
to play an indirect role over longer time-scales (e.g.,<br />
glacial-interglacial) through limitation of oceanic nitrogen<br />
fixation <strong>and</strong>, consequently, the oceanic content of nitrate<br />
(Falkowski et al., 1998; Broecker <strong>and</strong> Henderson, 1998; Box<br />
3.4). <strong>The</strong> regional variability of oceanic nitrogen fixation<br />
(Gruber <strong>and</strong> Sarmiento, 1997) <strong>and</strong> its temporal variability <strong>and</strong><br />
potential climate-sensitivity have recently become apparent<br />
based on results from long time-series <strong>and</strong> global surveys (Karl<br />
et al., 1997; Hansell <strong>and</strong> Feely, 2000).<br />
<strong>Carbon</strong> (organic <strong>and</strong> inorganic) derived from l<strong>and</strong> also enters<br />
the ocean via rivers as well as to some extent via groundwater.<br />
This transport comprises a natural carbon transport together with<br />
a significant anthropogenic perturbation. <strong>The</strong> global natural<br />
transport from rivers to the ocean is about 0.8 PgC/yr, half of<br />
which is organic <strong>and</strong> half inorganic (Meybeck 1982, 1993;<br />
Sarmiento <strong>and</strong> Sundquist 1992; Figure 3.1). Additional fluxes<br />
due to human activity have been estimated (Meybeck, 1993) to<br />
be about 0.1 PgC/yr (mainly organic carbon). Much of the<br />
organic carbon is deposited <strong>and</strong>/or respired <strong>and</strong> outgassed close<br />
to l<strong>and</strong>, mostly within estuaries (Smith <strong>and</strong> Hollibaugh,<br />
1993).<strong>The</strong> outgassing of anthropogenic carbon from estuaries<br />
can be a significant term in comparison with regional CO 2<br />
emissions estimates (e.g., 5 to 10% for Western Europe;<br />
Frankignoulle et al., 1998). <strong>The</strong> natural DIC transport via rivers,<br />
however, is part of a large-scale cycling of carbon between the<br />
open ocean <strong>and</strong> l<strong>and</strong> associated with dissolution <strong>and</strong> precipitation<br />
of carbonate minerals. This natural cycle drives net<br />
outgassing from the ocean of the order 0.6 PgC/yr globally,
<strong>The</strong> <strong>Carbon</strong> <strong>Cycle</strong> <strong>and</strong> <strong>Atmospheric</strong> <strong>Carbon</strong> <strong>Dioxide</strong><br />
which should be included in any assessment of net air-sea <strong>and</strong><br />
atmosphere-terrestrial biosphere transfers (Sarmiento <strong>and</strong><br />
Sundquist, 1992) <strong>and</strong> ocean transports (e.g., Holfort et al.,<br />
1998).<br />
3.2.3.2 Uptake of anthropogenic CO 2<br />
Despite the importance of biological processes for the ocean’s<br />
natural carbon cycle, current thinking maintains that the oceanic<br />
uptake of anthropogenic CO 2 is primarily a physically <strong>and</strong><br />
chemically controlled process superimposed on a biologically<br />
driven carbon cycle that is close to steady state. This differs from<br />
the situation on l<strong>and</strong> because of the different factors which control<br />
marine <strong>and</strong> terrestrial primary productivity. On l<strong>and</strong>, experiments<br />
have repeatedly shown that current CO 2 concentrations are<br />
limiting to plant growth (Section 3.2.2.4). In the ocean, experimental<br />
evidence is against control of productivity by CO 2 concentrations,<br />
except for certain species at lower than contemporary<br />
CO 2 concentrations (Riebesell et al., 1993; Falkowski, 1994).<br />
Further, deep ocean concentrations of major nutrients <strong>and</strong> DIC are<br />
tightly correlated, with the existing ratios closely (but not exactly,<br />
see Section 3.2.3.3) matching the nutritional requirements of<br />
marine organisms (the “Redfield ratios”: Redfield et al., 1963).<br />
This implies that as long as nutrients that are mixed into the ocean<br />
surface layer are largely removed by organic carbon production<br />
<strong>and</strong> export, then there is little potential to drive a net air-sea carbon<br />
transfer simply through alteration of the global rate of production.<br />
Terrestrial ecosystems show greater variability in this respect<br />
because l<strong>and</strong> plants have multiple ways to acquire nutrients, <strong>and</strong><br />
have greater plasticity in their chemical composition (Melillo <strong>and</strong><br />
Gosz, 1983). <strong>The</strong>re are, however, extensive regions of the ocean<br />
surface where major nutrients are not fully depleted, <strong>and</strong> changes<br />
in these regions may play a significant role in altering atmosphereocean<br />
carbon partitioning (see Section 3.2.3.3).<br />
<strong>The</strong> increase of atmospheric pCO 2 over pre-industrial levels<br />
has tended to increase uptake into natural CO 2 sink regions <strong>and</strong><br />
decreased release from natural outgassing regions. Contemporary<br />
net air-sea fluxes comprise spatially-varying mixtures of natural<br />
<strong>and</strong> anthropogenic CO 2 flux components <strong>and</strong> cannot be equated<br />
with anthropogenic CO 2 uptake, except on a global scale. Uptake<br />
of anthropogenic CO 2 is strongest in regions where “old” waters,<br />
which have spent many years in the ocean interior since their last<br />
contact with the atmosphere, are re-exposed at the sea surface to a<br />
contemporary atmosphere which now contains anthropogenic<br />
CO 2 (e.g., Sarmiento et al., 1992; Doney, 1999). In an upwelling<br />
region, for example, the natural component of the air-sea flux may<br />
be to outgas CO 2 to the atmosphere. <strong>The</strong> higher atmospheric pCO 2<br />
of the contemporary atmosphere acts to reduce this outgassing<br />
relative to the natural state, implying that more carbon remains in<br />
the ocean. This represents uptake of anthropogenic CO 2 by a<br />
region which is a source of CO 2 to the atmosphere. <strong>The</strong> additional<br />
carbon in the ocean resulting from such uptake is then transported<br />
by the surface ocean circulation, <strong>and</strong> eventually stored as surface<br />
waters sink, or are mixed, into the deep ocean interior. Whereas<br />
upwelling into the surface layer is quantitatively balanced on a<br />
global scale by sinking, the locations where deep waters rise <strong>and</strong><br />
sink can be separated by large horizontal distances.<br />
Air-sea gas transfer allows older waters to approach a new<br />
199<br />
steady state with higher atmospheric CO 2 levels after about a year<br />
at the sea surface. This is fast relative to the rate of ocean mixing,<br />
implying that anthropogenic CO 2 uptake is limited by the rate at<br />
which “older” waters are mixed towards the air-sea interface. <strong>The</strong><br />
rate of exposure of older, deeper waters is therefore a critical<br />
factor limiting the uptake of anthropogenic CO 2. In principle,<br />
there is sufficient uptake capacity (see Box 3.3) in the ocean to<br />
incorporate 70 to 80% of anthropogenic CO 2 emissions to the<br />
atmosphere, even when total emissions of up to 4,500 PgC are<br />
considered (Archer et al., 1997). <strong>The</strong> finite rate of ocean mixing,<br />
however, means that it takes several hundred years to access this<br />
capacity (Maier-Reimer <strong>and</strong> Hasselmann, 1987; Enting et al.,<br />
1994; Archer et al., 1997). Chemical neutralisation of added CO 2<br />
through reaction with CaCO 3 contained in deep ocean sediments<br />
could potentially absorb a further 9 to 15% of the total emitted<br />
amount, reducing the airborne fraction of cumulative emissions by<br />
about a factor of 2; however the response time of deep ocean<br />
sediments is in the order of 5,000 years (Archer et al., 1997).<br />
Using time-series <strong>and</strong> global survey data, the increasing<br />
oceanic carbon content has been directly observed, although the<br />
signal is small compared to natural variability <strong>and</strong> requires<br />
extremely accurate measurements (Sabine et al., 1997). A longterm<br />
increase of surface water CO 2 levels tracking the mean<br />
atmospheric CO 2 increase has been observed in the ocean’s<br />
subtropical gyres (Bates et al., 1996; Winn et al., 1998) <strong>and</strong> the<br />
equatorial Pacific (Feely et al., 1999b). However, very few such<br />
time-series exist <strong>and</strong> the response of other important oceanic<br />
regions to the atmospheric pCO 2 increase cannot yet be assessed.<br />
Inter-decadal increases in DIC concentrations at depth have been<br />
resolved from direct measurements (Wallace, 1995; Peng et al.,<br />
1998; Ono et al., 1998; Sabine et al., 1999). <strong>The</strong> total amounts of<br />
anthropogenic CO 2 accumulated in the ocean since the preindustrial<br />
era can also be estimated from measurements using<br />
recent refinements (Gruber et al., 1996) of long-st<strong>and</strong>ing methods<br />
for separating the natural <strong>and</strong> anthropogenic components of<br />
oceanic DIC. A comparison of such analyses with ocean model<br />
results is presented in Section 3.6.3.<br />
3.2.3.3 Future changes in ocean CO 2 uptake<br />
This section lists processes that may be important for the future<br />
uptake of anthropogenic CO 2. <strong>The</strong>se changes can represent<br />
changes in anthropogenic CO 2 uptake itself (mainly physical <strong>and</strong><br />
chemical processes), or changes in the natural biologically-linked<br />
cycling of carbon between the atmosphere <strong>and</strong> ocean.<br />
Physical <strong>and</strong> chemical processes<br />
Buffering changes. <strong>The</strong> capacity of surface waters to take up<br />
anthropogenic CO 2 is decreasing as CO 2 levels increase (see Box<br />
3.3). <strong>The</strong> magnitude of this effect is substantial. This decrease in<br />
uptake capacity of the ocean makes atmospheric CO 2 more<br />
sensitive to anthropogenic emissions <strong>and</strong> other changes in the<br />
natural cycling of carbon.<br />
Emissions rate. Even assuming no other changes to the carbon<br />
cycle, the proportion of emitted CO 2 that can be taken up by the<br />
ocean decreases as the rate of emission increases. This is due to<br />
the finite rate of exposure of ‘older’, deeper waters to the anthropogenic<br />
CO 2 contained in the atmosphere.
200 <strong>The</strong> <strong>Carbon</strong> <strong>Cycle</strong> <strong>and</strong> <strong>Atmospheric</strong> <strong>Carbon</strong> <strong>Dioxide</strong><br />
Warming. CO 2 is less soluble in warmer water, <strong>and</strong> the equilibrium<br />
pCO 2 in seawater increases by about 10 to 20 ppm per °C<br />
temperature increase. Warming of surface water would therefore<br />
tend to increase surface water pCO 2, driving CO 2 from the<br />
surface ocean to the atmosphere. <strong>The</strong> expected effect of such<br />
warming on atmospheric CO 2 may be smaller, depending on the<br />
rate of exchange between ocean surface waters <strong>and</strong> the deep<br />
ocean at high latitudes (e.g., Bacastow, 1993).<br />
Vertical mixing <strong>and</strong> stratification. Several coupled<br />
atmosphere-ocean models have shown global warming to be<br />
accompanied by an increase in vertical stratification (see Chapter<br />
7). Such a change would reduce the rate of mixing between<br />
surface <strong>and</strong> deep waters, <strong>and</strong> therefore reduce the effective<br />
volume of the ocean that is exposed to high atmospheric CO 2. On<br />
its own, this effect would tend to reduce the ocean CO 2 uptake.<br />
However, changes in stratification may also drive changes in the<br />
natural carbon cycle. <strong>The</strong> magnitude <strong>and</strong> even the sign of changes<br />
in the natural cycle are much more difficult to predict because of<br />
the complexity of ocean biological processes (Sarmiento et al.,<br />
1998; Matear <strong>and</strong> Hirst, 1999).<br />
Biologically-linked processes<br />
Qualitative <strong>and</strong> quantitative changes in carbon uptake arising from<br />
changes in marine ecosystems are more speculative (Denman et<br />
al., 1996; Falkowski et al., 1998; Watson <strong>and</strong> Liss, 1998), but are<br />
likely to have occurred over glacial-interglacial time-scales<br />
(Section 3.3). Falkowski et al. (1998) listed three major classes of<br />
biologically linked factors that can in principal alter the air-sea<br />
partitioning of CO 2: (1) changes in surface nutrient utilisation<br />
(e.g., in HNLC areas); (2) changes in total ocean content of major<br />
nutrients; (3) changes in the elemental composition of biogenic<br />
material (including the rain ratio). Our incomplete underst<strong>and</strong>ing<br />
of present day nutrient controls on productivity limits our ability<br />
to predict future changes in ocean biology <strong>and</strong> their effect on CO 2<br />
levels. For example, the possible identification of changes in deep<br />
ocean C:N:P ratios (Pahlow <strong>and</strong> Riebesell, 2000) leaves open the<br />
question of the extent to which ocean biological carbon cycling is<br />
in steady state, or is likely to remain so in the future.<br />
Changes in surface nutrient utilisation. Changes in the utilisation<br />
of surface nutrients in HNLC regions have the potential to<br />
alter export production <strong>and</strong> carbon storage in the ocean interior.<br />
Most attention focuses on the role of inadvertent or deliberate<br />
changes in the external supply of iron to such regions. <strong>The</strong> sign of<br />
possible future responses of ocean biota due to iron supply<br />
changes is difficult to assess. Future iron supply may increase due<br />
to erosion (enhanced by agriculture <strong>and</strong> urbanisation) which tends<br />
to increase dust export <strong>and</strong> aeolian iron deposition (Tegen <strong>and</strong><br />
Fung, 1995). Conversely, a globally enhanced hydrological cycle<br />
<strong>and</strong> increased water-use efficiency of terrestrial plants may tend to<br />
reduce future dust export (Harrison et al., 2001). <strong>The</strong> delivery of<br />
dust to the HNLC regions will be sensitive to regional changes in<br />
erosion <strong>and</strong> the hydrological cycle, affecting the important regions<br />
of dust export, rather than to global scale changes (Dai et al.,<br />
1998).<br />
Surface nutrient supply could be reduced if ocean stratification<br />
reduces the supply of major nutrients carried to the surface waters<br />
from the deep ocean (Sarmiento et al., 1998). <strong>The</strong> impact of strati-<br />
fication on marine productivity depends on the limiting factor. In<br />
regions limited by deep ocean nutrients, stratification would<br />
reduce marine productivity <strong>and</strong> the strength of the export of<br />
carbon by biological processes. Conversely, stratification also<br />
increases the light exposure of marine organisms, which would<br />
increase productivity in regions where light is limiting.<br />
Changes in total ocean content of major nutrients. Changes in<br />
the delivery of the major biologically limiting nutrients (N, P, Fe,<br />
Si) from riverine, atmospheric or sedimentary sources, or changes<br />
in removal rates (e.g., denitrification), could alter oceanic nutrient<br />
inventories <strong>and</strong> hence export production <strong>and</strong> ocean carbon<br />
storage. On the global scale, the upward fluxes of major nutrients<br />
are slightly depleted in N relative to P with respect to the nutrient<br />
requirements of phytoplankton (Fanning, 1992). This relative<br />
supply of N versus P may be sensitive to climate <strong>and</strong> circulation<br />
related changes in the rate of fixed-nitrogen removal by denitrification<br />
(Ganeshram et al., 1995) or via changes in the rate of<br />
nitrogen fixation. Changes in river flow <strong>and</strong> composition are also<br />
affecting the supply of nutrients (Frankignoulle et al., 1998). <strong>The</strong><br />
hypothesised link between nitrogen fixation in certain ocean<br />
regions <strong>and</strong> the external iron supply (Falkowski, 1997; Wu et al.,<br />
2000) could play a role in future nutrient <strong>and</strong> carbon budgets.<br />
Nitrogen fixation rates may also be affected by changes in stratification<br />
<strong>and</strong> mixing. For example, Karl et al. (1997) have identified<br />
interannual variability in nitrogen fixation rates in the subtropical<br />
Pacific which are apparently linked to ENSO variability<br />
in upper ocean dynamics.<br />
Changes in the elemental composition of biogenic material.<br />
<strong>The</strong> structure <strong>and</strong> biogeochemistry of marine ecosystems can be<br />
affected by numerous climate-related factors including temperature,<br />
cloudiness, nutrient availability, mixed-layer physics <strong>and</strong><br />
sea-ice extent. In turn the structure of marine ecosystems, <strong>and</strong><br />
particularly the species composition of phytoplankton, exert a<br />
control on the partitioning of carbon between the ocean <strong>and</strong> the<br />
atmosphere. For example, a change in distribution of calcareous<br />
versus siliceous planktonic organisms could affect CO 2 uptake in<br />
the future, as it may have done in the past (Archer <strong>and</strong> Maier-<br />
Reimer, 1994). Precipitation of CaCO 3 by marine organisms<br />
(calcification) removes dissolved CO 3 2− , thus decreasing surface<br />
water alkalinity <strong>and</strong> reducing the capacity of sea water to dissolve<br />
atmospheric CO 2 (see Box 3.3). Recent experimental evidence<br />
suggests that as a direct result of increasing atmospheric <strong>and</strong><br />
surface water pCO 2 levels, oceanic calcification will decrease<br />
significantly over the next 100 years. Model-based calculations<br />
suggest that decreases in coral reef calcification rates of the order<br />
17 to 35% relative to pre-industrial rates are possible (Kleypas et<br />
al., 1999). Experimental studies with corals have confirmed such<br />
effects (Langdon et al., 2000). Field <strong>and</strong> laboratory studies have<br />
shown that planktonic calcification is also highly sensitive to<br />
pCO 2 levels. <strong>The</strong> calcification rate of coccolithophorids decreases<br />
by 16 to 83% at pCO 2 levels of 750 ppm (Riebesell et al., 2000).<br />
Such an effect would tend to favour CO 2 storage in the upper<br />
ocean <strong>and</strong> act as a negative feedback on atmospheric growth rates<br />
of CO 2. However, long-term predictions of such biological<br />
responses are hampered by a lack of underst<strong>and</strong>ing concerning<br />
physiological acclimation <strong>and</strong> genetic adaptations of species to<br />
increasing pCO 2.
<strong>The</strong> <strong>Carbon</strong> <strong>Cycle</strong> <strong>and</strong> <strong>Atmospheric</strong> <strong>Carbon</strong> <strong>Dioxide</strong><br />
CO 2 concentration(ppm)<br />
CO 2 concentration (ppm)<br />
CO 2 concentration (ppm)<br />
380<br />
360<br />
340<br />
320<br />
300<br />
280<br />
260<br />
240<br />
220<br />
200<br />
180<br />
380<br />
360<br />
340<br />
320<br />
300<br />
280<br />
260<br />
240<br />
220<br />
200<br />
180<br />
380<br />
360<br />
340<br />
320<br />
300<br />
280<br />
260<br />
240<br />
220<br />
200<br />
180<br />
a)<br />
CO2 Mauna Loa<br />
CO2 South Pole<br />
1950 1960 1970 1980 1990 2000<br />
Year<br />
b)<br />
c) Taylor Dome<br />
1988 1992 1996<br />
O2 Cape Grim<br />
O2 Barrow<br />
12500 10000 7500 5000 2500 0<br />
Age (yr BP)<br />
3.3 Palaeo CO 2 <strong>and</strong> Natural Changes in the <strong>Carbon</strong> <strong>Cycle</strong><br />
3.3.1 Geological History of <strong>Atmospheric</strong> CO2 <strong>Atmospheric</strong> CO2 concentration has varied on all time-scales<br />
during the Earth’s history (Figure 3.2). <strong>The</strong>re is evidence for<br />
very high CO2 concentrations (>3,000 ppm) between 600 <strong>and</strong><br />
400 Myr BP <strong>and</strong> between 200 <strong>and</strong> 150 Myr BP (Figure 3.2f). On<br />
long time-scales, atmospheric CO2 content is determined by the<br />
O 2 ppm<br />
800 1000 1200 1400<br />
Year<br />
1600 1800 2000<br />
0<br />
−20<br />
−40<br />
Mauna Loa<br />
Law Dome<br />
Adelie L<strong>and</strong><br />
Siple<br />
South Pole<br />
CO 2 concentration (ppm)<br />
CO 2 concentration (ppm)<br />
CO 2 concentration (ppm)<br />
380<br />
360<br />
340<br />
320<br />
300<br />
280<br />
260<br />
240<br />
220<br />
200<br />
180<br />
380<br />
360<br />
340<br />
320<br />
300<br />
280<br />
260<br />
240<br />
220<br />
200<br />
7500<br />
6000<br />
4500<br />
3000<br />
1500<br />
d) Vostok<br />
f)<br />
400<br />
300 200<br />
Age (kyr BP)<br />
Petit et al.<br />
Fischer et al.<br />
201<br />
balance among geochemical processes including organic carbon<br />
burial in sediments, silicate rock weathering, <strong>and</strong> vulcanism<br />
(Berner, 1993, 1997). In particular, terrestrial vegetation has<br />
enhanced the rate of silicate weathering, which consumes CO 2<br />
while releasing base cations that end up in the ocean.<br />
Subsequent deep-sea burial of Ca <strong>and</strong> Mg (as carbonates, for<br />
example CaCO 3) in the shells of marine organisms removes<br />
CO 2. <strong>The</strong> net effect of slight imbalances in the carbon cycle over<br />
tens to hundreds of millions of years has been to reduce<br />
100<br />
e) Pagani et al.<br />
Pearson <strong>and</strong> Palmer<br />
180<br />
25 20 15 10 5 0<br />
Age (Myr BP)<br />
0<br />
500 400 300 200 100 0<br />
Age (Myr BP)<br />
Figure 3.2: Variations in atmospheric CO 2 concentration on different time-scales. (a) Direct measurements of atmospheric CO 2 concentration<br />
(Keeling <strong>and</strong> Whorf, 2000), <strong>and</strong> O 2 from 1990 onwards (Battle et al., 2000). O 2 concentration is expressed as the change from an arbitrary<br />
st<strong>and</strong>ard. (b) CO 2 concentration in Antarctic ice cores for the past millenium (Siegenthaler et al., 1988; Neftel et al., 1994; Barnola et al., 1995;<br />
Etheridge et al., 1996). Recent atmospheric measurements at Mauna Loa (Keeling <strong>and</strong> Whorf, 2000) are shown for comparison. (c) CO 2 concentration<br />
in the Taylor Dome Antarctic ice core (Indermühle et al., 1999). (d) CO 2 concentration in the Vostok Antarctic ice core (Petit et al., 1999;<br />
Fischer et al., 1999). (e) Geochemically inferred CO 2 concentrations, from Pagani et al. (1999a) <strong>and</strong> Pearson <strong>and</strong> Palmer (2000). (f)<br />
Geochemically inferred CO 2 concentrations: coloured bars represent different published studies cited by Berner (1997). <strong>The</strong> data from Pearson<br />
<strong>and</strong> Palmer (2000) are shown by a black line. (BP = before present.)<br />
0
202 <strong>The</strong> <strong>Carbon</strong> <strong>Cycle</strong> <strong>and</strong> <strong>Atmospheric</strong> <strong>Carbon</strong> <strong>Dioxide</strong><br />
Box 3.4: Causes of glacial/inter-glacial changes in atmospheric CO 2.<br />
One family of hypotheses to explain glacial/inter-glacial variations of atmospheric CO 2 relies on physical mechanisms that could<br />
change the dissolution <strong>and</strong> outgassing of CO 2 in the ocean. <strong>The</strong> solubility of CO 2 is increased at low temperature, but reduced at<br />
high salinity. <strong>The</strong>se effects nearly cancel out over the glacial/inter-glacial cycle, so simple solubility changes are not the answer.<br />
Stephens <strong>and</strong> Keeling (2000) have proposed that extended winter sea ice prevented outgassing of upwelled, CO 2-rich water around<br />
the Antarctic continent during glacial times. A melt-water “cap” may have further restricted outgassing of CO 2 during summer<br />
(François et al., 1997). <strong>The</strong>se mechanisms could explain the parallel increases of Antarctic temperature <strong>and</strong> CO 2 during deglaciation.<br />
However, they require less vertical mixing to occur at low latitudes than is normally assumed. <strong>The</strong> relative importance of high<br />
<strong>and</strong> low latitudes for the transport of CO 2 by physical processes is not well known, <strong>and</strong> may be poorly represented in most ocean<br />
carbon models (Toggweiler, 1999; Broecker et al., 1999).<br />
Several authors have hypothesised increased utilisation of surface nutrients by marine ecosystems in high latitudes, leading to<br />
stronger vertical gradients of DIC <strong>and</strong> thus reduced atmospheric CO 2 during glacial times (Sarmiento <strong>and</strong> Toggweiler, 1984;<br />
Siegenthaler <strong>and</strong> Wenk, 1984; Knox <strong>and</strong> McElroy, 1984). Other hypotheses call for an increased external supply of nutrients to the<br />
ocean (McElroy, 1983; Martin et al., 1990; Broecker <strong>and</strong> Henderson, 1998). <strong>The</strong> supply of iron-rich dust to the Southern Ocean is<br />
increased during glacial periods, due to exp<strong>and</strong>ed deserts in the Patagonian source region (Andersen et al., 1998; Mahowald et al.,<br />
1999; Petit et al., 1999); dust-borne iron concentration in Antarctic ice is also increased (Edwards et al., 1998). Fertilisation of<br />
marine productivity by iron from this source could have influenced atmospheric CO 2. Most of these mechanisms, however, can only<br />
account for about 30 ppm, or less, of the change (Lefèvre <strong>and</strong> Watson, 1999; Archer <strong>and</strong> Johnson, 2000). Palaeo-nutrient proxies<br />
have also been used to argue against large changes in total high latitude productivity (Boyle, 1988; Rickaby <strong>and</strong> Elderfield, 1999;<br />
Elderfield <strong>and</strong> Rickaby, 2000), even if the region of high productivity in the Southern Ocean may have been shifted to the north<br />
(Kumar et al., 1995; François et al., 1997). Increased productivity over larger regions might have been caused by decreased denitrification<br />
(Altabet et al., 1995; Ganeshram et al., 1995) or iron stimulated N 2 fixation (Broecker <strong>and</strong> Henderson, 1998) leading to an<br />
increase in the total ocean content of reactive nitrogen.<br />
Another family of hypotheses invokes ocean alkalinity changes by a variety of mechanisms (Opdyke <strong>and</strong> Walker, 1992; Archer<br />
<strong>and</strong> Maier-Reimer, 1994; Kleypas, 1997), including increased silica supply through dust, promoting export production by siliceous<br />
rather than calcareous phytoplankton (Harrison, 2000). Although there is geochemical evidence for higher ocean pH during glacial<br />
times (Sanyal et al., 1995), a large increase in alkalinity would result in a much deeper lysocline, implying an increase in CaCO 3<br />
preservation that is not observed in deep-sea sediments (Catubig et al., 1998; Sigman et al., 1998; Archer et al., 2000).<br />
Given the complex timing of changes between climate changes <strong>and</strong> atmospheric CO 2 on glacial-interglacial time-scales, it is<br />
plausible that more than one mechanism has been in operation; <strong>and</strong> indeed most or all of the hypotheses encounter difficulties if<br />
called upon individually to explain the full magnitude of the change.<br />
atmospheric CO 2. <strong>The</strong> rates of these processes are extremely slow,<br />
hence they are of limited relevance to the atmospheric CO 2<br />
response to emissions over the next hundred years.<br />
It is pertinent, however, that photosynthesis evolved at a time<br />
when O 2 concentrations were far less than at present. O 2 has<br />
accumulated in the atmosphere over geological time because<br />
photosynthesis results in the burial of reduced chemical species:<br />
pyrite (FeS 2) derived from sulphur-reducing bacteria, <strong>and</strong> organic<br />
carbon. This accumulation has consequences for terrestrial <strong>and</strong><br />
marine ecosystems today. Primary production is carbon limited in<br />
terrestrial ecosystems in part because of (geologically speaking)<br />
low CO 2 concentrations, <strong>and</strong> in part because Rubisco (the enzyme<br />
that fixes CO 2 in all plants) also has an affinity for O 2 that reduces<br />
its efficiency in photosynthesis (see Section 3.2.2.4). Primary<br />
production is iron limited in some marine ecosystems mainly<br />
because of the extreme insolubility of Fe(III), the predominant<br />
form of iron in the present, O 2-rich environment. <strong>The</strong>se difficulties<br />
faced by contemporary organisms represent a legacy of earlier<br />
evolution under very different biogeochemical conditions.<br />
In more recent times, atmospheric CO 2 concentration<br />
continued to fall after about 60 Myr BP <strong>and</strong> there is geochemical<br />
evidence that concentrations were
<strong>The</strong> <strong>Carbon</strong> <strong>Cycle</strong> <strong>and</strong> <strong>Atmospheric</strong> <strong>Carbon</strong> <strong>Dioxide</strong><br />
these bounds, despite considerable variability on multi-millenial<br />
time-scales. <strong>The</strong> present CO 2 concentration is higher than at any<br />
time during the 420 kyr period covered by the Vostok record.<br />
<strong>The</strong> terrestrial biosphere stores 300 to 700 Pg more carbon<br />
during interglacial periods than during glacial periods, based on a<br />
widely accepted interpretation of the δ 13 C record in deep-sea<br />
sediments (Shackleton, 1977; Bird et al., 1994; Crowley, 1995).<br />
Terrestrial modelling studies (e.g., Friedlingstein et al., 1995b;<br />
Peng et al., 1998) have reached the same conclusion. Thus, the<br />
terrestrial biosphere does not cause the difference in atmospheric<br />
CO 2 between glacial <strong>and</strong> interglacial periods. <strong>The</strong> cause must lie<br />
in the ocean, <strong>and</strong> indeed the amount of atmospheric change to be<br />
accounted for must be augmented to account for a fraction of the<br />
carbon transferred between the l<strong>and</strong> <strong>and</strong> ocean. <strong>The</strong> mechanism<br />
remains controversial (see Box 3.4). In part this is because a<br />
variety of processes that could be effective in altering CO 2 levels<br />
on a century time-scale can be largely cancelled on multi-millenial<br />
time-scales by changes in CaCO 3 sedimentation or dissolution, as<br />
discussed in Section 3.2.3.1.<br />
Orbital variations (Berger, 1978) are the pacemaker of climate<br />
change on multi-millenial time-scales (Hays et al., 1976).<br />
<strong>Atmospheric</strong> CO 2 is one of many Earth system variables that<br />
show the characteristic “Milankovitch” periodicities, <strong>and</strong> has been<br />
implicated as a key factor in locking natural climate changes to the<br />
100 kyr eccentricity cycle (Shackleton, 2000). Whatever the<br />
mechanisms involved, lags of up to 2,000 to 4,000 years in the<br />
drawdown of CO 2 at the start of glacial periods suggests that the<br />
low CO 2 concentrations during glacial periods amplify the climate<br />
change but do not initiate glaciations (Lorius <strong>and</strong> Oeschger, 1994;<br />
Fischer et al., 1999). Once established, the low CO 2 concentration<br />
is likely to have enhanced global cooling (Hewitt <strong>and</strong> Mitchell,<br />
1997). During the last deglaciation, rising CO 2 paralleled<br />
Southern Hemisphere warming <strong>and</strong> was ahead of Northern<br />
Hemisphere warming (Chapter 2).<br />
During glacial periods, the atmospheric CO 2 concentration<br />
does not track the “fast” changes in climate (e.g., decade to<br />
century scale warming events) associated with Dansgaard-<br />
Oeschger events, although there are CO 2 fluctuations of up to 20<br />
ppm associated with the longer-lived events (Stauffer et al., 1998;<br />
Indermühle et al., 2000) (see Chapter 2 for explanations of these<br />
terms). During the last deglaciation, atmospheric CO 2 concentration<br />
continued to increase, by about 12 ppm, through the Younger<br />
Dryas cold reversal (12.7 to 11.6 kyr BP) seen in Northern<br />
Hemisphere palaeoclimate records (Fischer et al., 1999; Smith et<br />
al., 1999). Palaeo-oceanographic evidence shows that the Younger<br />
Dryas event was marked by a prolonged shut-down of the thermohaline<br />
circulation, which is likely to have been triggered by the<br />
release of melt water into the North Atlantic. Similar behaviour,<br />
with a slight rise in CO 2 accompanying a major Northern<br />
Hemisphere cooling <strong>and</strong> shutdown of North Atlantic Deep Water<br />
production, has been produced in a coupled atmosphere-ocean<br />
model (Marchal et al., 1998). <strong>The</strong> observed CO 2 rise during the<br />
Younger Dryas period was modest, suggesting that atmospheric<br />
CO 2 has, under natural conditions, been well buffered against<br />
abrupt changes in climate, including thermohaline collapse. This<br />
buffering is a direct consequence of the large reservoir of DIC in<br />
the ocean.<br />
3.3.3 Variations in <strong>Atmospheric</strong> CO 2 during the Past 11,000<br />
Years<br />
Natural variations in CO 2 during the past 11,000 years (Figure<br />
3.2c) have been small (about 20 ppm) according to the best<br />
available measurements, which are from the Taylor Dome ice core<br />
(Smith et al., 1999; Indermühle et al., 1999). <strong>The</strong>se measurements<br />
show a short-lived maximum around 11 kyr BP, followed by a<br />
slight fall, which may have been caused by increasing carbon<br />
storage in the terrestrial biosphere. <strong>Atmospheric</strong> CO 2 concentration<br />
was about 260 ppm at its Holocene minimum around 8 kyr<br />
BP <strong>and</strong> increased towards about 280 ppm in the pre-industrial<br />
period. <strong>The</strong> same pattern <strong>and</strong> the same CO 2 concentration levels<br />
over the past 8 kyr have also been shown in another ice core, BH7<br />
near Vostok (Peybernès et al., 2000). <strong>The</strong> causes of these changes<br />
are not known. Preliminary δ 13 C measurements (see Box 3.6)<br />
suggest that this increase may have been due to a gradual<br />
reduction in terrestrial carbon storage (Indermühle et al., 1999;<br />
Smith et al., 1999) but others have considered an oceanic explanation<br />
more likely.<br />
<strong>Atmospheric</strong> CO 2 concentrations have also been reconstructed<br />
indirectly, from stomatal index measurements on sub-fossil leaves<br />
(Van de Water et al., 1994; Beerling et al., 1995; Rundgren <strong>and</strong><br />
Beerling, 1999; Wagner et al., 1999). Stomatal density <strong>and</strong><br />
stomatal index of many species respond to atmospheric CO 2<br />
(Woodward, 1987; Woodward <strong>and</strong> Bazzaz, 1988) but are<br />
influenced by other environmental variables as well (Poole et al.,<br />
1996). One recent stomatal index record, interpreted as implying<br />
high (up to 350 ppm) <strong>and</strong> rapidly fluctuating CO 2 concentrations<br />
in the early Holocene (Wagner et al., 1999), is clearly incompatible<br />
with the ice core record of Indermühle et al. (1999), whereas<br />
a continuous stomatal index record from 9 kyr BP onwards<br />
(Rundgren <strong>and</strong> Beerling, 1999) has shown concentration trends<br />
consistent with the ice-core records.<br />
Figure 3.2b shows the excellent agreement among different<br />
high-resolution Antarctic ice cores covering the past 1,000 years.<br />
<strong>Atmospheric</strong> CO 2 concentration fell by about 8 to 10 ppm during<br />
the Little Ice Age (from 1280 to 1860, see Chapter 2) (Figure.<br />
3.2b, c; Barnola et al., 1995; Etheridge et al., 1996; Indermühle et<br />
al., 1999; Rundgren <strong>and</strong> Beerling, 1999). A slight contemporaneous<br />
increase in δ 13 C of atmospheric CO 2 has led to the suggestion<br />
that this effect was caused by enhanced carbon storage on<br />
l<strong>and</strong> (Francey et al., 1999b; Trudinger et al., 1999).<br />
3.3.4 Implications<br />
203<br />
<strong>The</strong> Vostok record of atmospheric CO 2 <strong>and</strong> Antarctic climate is<br />
consistent with a view of the climate system in which CO 2<br />
concentration changes amplify orbitally-induced climate<br />
changes on glacial/inter-glacial time-scales (Shackleton, 2000).<br />
Changes during the present inter-glacial (until the start of the<br />
anthropogenic CO 2 rise) have been small by comparison.<br />
Although complete explanations for these changes in the past<br />
are lacking, high-resolution ice core records establish that the<br />
human-induced increase of atmospheric CO 2 over the past<br />
century is at least an order of magnitude faster than has<br />
occurred during the preceeding 20,000 years.
204 <strong>The</strong> <strong>Carbon</strong> <strong>Cycle</strong> <strong>and</strong> <strong>Atmospheric</strong> <strong>Carbon</strong> <strong>Dioxide</strong><br />
3.4 Anthropogenic Sources of CO 2<br />
3.4.1 Emissions from Fossil Fuel Burning <strong>and</strong> Cement<br />
Production<br />
Current anthropogenic emissions of CO2 are primarily the<br />
result of the consumption of energy from fossil fuels.<br />
Estimates of annual global emissions from fossil fuel burning<br />
<strong>and</strong> cement production have been made for the period from<br />
1751 through 1999. Figure 3.3 summarises emissions over the<br />
period from 1959 to 1999 (Keeling <strong>and</strong> Whorf, 2000).<br />
Estimates of annual global emissions from fossil fuel<br />
burning <strong>and</strong> cement production by Marl<strong>and</strong> et al. (2000) span<br />
the period from 1751 through to 1997, reaching a maximum in<br />
1997 of 6.6 PgC/yr (0.2 PgC/yr of this was from cement<br />
production). <strong>The</strong> primary data for these estimates are annual<br />
energy statistics compiled by the United Nations (2000).<br />
Emissions for 1998 <strong>and</strong> 1999 have been estimated based on<br />
energy statistics compiled by British Petroleum (2000).<br />
Emission factors (IPCC, 1997) were applied to consumption<br />
statistics (British Petroleum, 2000) to calculate emissions over<br />
the period 1990 to 1999. Emissions were then scaled to match<br />
the estimates for emissions from fossil fuel burning <strong>and</strong> cement<br />
production from Marl<strong>and</strong> et al. (2000) over the overlap period<br />
from 1990 to 1997. <strong>The</strong> scaled emission estimates, therefore,<br />
implicitly include emissions from cement production.<br />
<strong>The</strong> average value of emissions for the 1980s given by<br />
Marl<strong>and</strong> et al. (2000) is 5.44 ± 0.3 PgC/yr, revised from the<br />
earlier estimate (Marl<strong>and</strong> et al. 1994; Andres et al. 2000) of<br />
5.46 ± 0.3 PgC/yr used in the SAR <strong>and</strong> in the Special Report<br />
on Radiative Forcing (IPCC, 1994) (hereafter SRRF).<br />
Estimated emissions rose from 6.1 PgC/yr in 1990 to 6.5<br />
PgC/yr in 1999. <strong>The</strong> average value of emissions in the 1990s<br />
was 6.3 ± 0.4 PgC/yr.<br />
3.4.2 Consequences of L<strong>and</strong>-use Change<br />
About 10 to 30% of the current total anthropogenic emissions<br />
of CO 2 are estimated to be caused by l<strong>and</strong>-use conversion. Such<br />
estimates rely on l<strong>and</strong> cover data sets which are highly variable,<br />
<strong>and</strong> estimates of average carbon density of vegetation types,<br />
which are also highly variable with st<strong>and</strong> age <strong>and</strong> local<br />
conditions (see Box 3.1). Hence they cannot be specified as<br />
accurately as is possible for fossil fuel emissions. Historical<br />
emissions are treated in Section 3.2.2.2; this section focuses on<br />
the contemporary situation.<br />
Net l<strong>and</strong>-use flux, comprising the balance of positive terms<br />
due to deforestation <strong>and</strong> negative terms due to regrowth on<br />
ab<strong>and</strong>oned agricultural l<strong>and</strong>, has been estimated based on l<strong>and</strong>use<br />
statistics <strong>and</strong> simple models of rates of decomposition <strong>and</strong><br />
regrowth, excluding possible climate, CO 2 <strong>and</strong> N fertilisation<br />
effects (Houghton, 1999). Not all l<strong>and</strong>-use emissions are<br />
included, for example mining of peatl<strong>and</strong>s. <strong>The</strong> analysis of<br />
Houghton (1999) indicated that the net flux due to l<strong>and</strong>-use<br />
change was 2.0 ± 0.8 PgC/yr during the 1980s, almost entirely<br />
due to deforestation of tropical regions. Temperate forests were<br />
found to show an approximate balance between carbon uptake<br />
in regrowing forests <strong>and</strong> carbon lost in oxidation of wood<br />
PgC/yr<br />
8<br />
7<br />
6<br />
5<br />
4<br />
3<br />
2<br />
1<br />
0<br />
fossil fuel emissions<br />
annual atmospheric increase<br />
monthly atmospheric increase (filtered)<br />
1960 1970 1980 1990 2000<br />
Year<br />
Figure 3.3: Fossil fuel emissions <strong>and</strong> the rate of increase of CO 2<br />
concentration in the atmosphere. <strong>The</strong> annual atmospheric increase is<br />
the measured increase during a calendar year. <strong>The</strong> monthly<br />
atmospheric increases have been filtered to remove the seasonal cycle.<br />
Vertical arrows denote El Niño events. A horizontal line defines the<br />
extended El Niño of 1991 to 1994. <strong>Atmospheric</strong> data are from Keeling<br />
<strong>and</strong> Whorf (2000), fossil fuel emissions data are from Marl<strong>and</strong> et al.<br />
(2000) <strong>and</strong> British Petroleum (2000), see explanations in text.<br />
products, except in Europe, which showed a small net accumulation.<br />
<strong>The</strong> estimate of 2.0 PgC/yr is somewhat higher than<br />
Houghton <strong>and</strong> Hackler’s (1995) earlier estimate of 1.6 PgC/yr<br />
for the same period, which was used in the SAR, because of a<br />
reanalysis of data from tropical Asia (Houghton <strong>and</strong> Hackler,<br />
1999). However, other recent analyses by the same authors<br />
reduce the estimated emissions from the Brazilian Amazon by<br />
half (Houghton et al., 2000), <strong>and</strong> point to other previously<br />
unaccounted for sinks of carbon in the USA such as fire<br />
suppression <strong>and</strong> woody encroachment, <strong>and</strong> changes in the<br />
management of agricultural soils (Houghton et al., 1999).<br />
Consideration of these additional studies brings the overall total<br />
back down to 1.7 ± 0.8 PgC/yr (Houghton, 2000), as given in<br />
the SRLULUCF.<br />
An independent analysis (see Section 3.6.2.2) by the <strong>Carbon</strong><br />
<strong>Cycle</strong> Model Linkage Project (CCMLP) also calculated the<br />
marginal effects of l<strong>and</strong>-use changes on the global terrestrial<br />
carbon budget (McGuire et al., 2001). L<strong>and</strong>-use change data<br />
(conversions between native vegetation <strong>and</strong> crops) were derived<br />
from Ramankutty <strong>and</strong> Foley (2000). <strong>The</strong> estimates obtained for<br />
net l<strong>and</strong>-use flux during the 1980s were between 0.6 <strong>and</strong> 1.0<br />
PgC/yr, i.e., substantially smaller than the fluxes calculated by<br />
Houghton (1999). <strong>The</strong> reasons for this discrepancy are unclear.<br />
<strong>The</strong> CCMLP estimates may be too low because they neglected<br />
conversions to pasture. However, data presented in Houghton<br />
(1999) indicate that the main changes during recent decades<br />
were due to l<strong>and</strong> conversion for crops. A more important difference<br />
may lie in the timing of deforestation in different regions<br />
in the tropics, where Ramankutty <strong>and</strong> Foley (2000) show higher<br />
overall rates in the 1970s <strong>and</strong> lower rates in the 1980s than<br />
Houghton does (1999).
<strong>The</strong> <strong>Carbon</strong> <strong>Cycle</strong> <strong>and</strong> <strong>Atmospheric</strong> <strong>Carbon</strong> <strong>Dioxide</strong><br />
Box 3.5: <strong>The</strong> use of O 2 measurements to assess the fate of fossil fuel CO 2.<br />
<strong>The</strong> amount of CO 2 that remains in the atmosphere each year has been consistently less than the amount emitted by fossil fuel<br />
burning. This is because some CO 2 dissolves <strong>and</strong> mixes in the ocean, <strong>and</strong> some is taken up by the l<strong>and</strong>. <strong>The</strong>se two modes of uptake<br />
have different effects on the concentration of O 2 in the atmosphere. Fossil fuel burning consumes O 2 <strong>and</strong> causes a decline in<br />
atmospheric O 2 concentration (Figure 3.4). Dissolution of CO 2 in the ocean has no effect on atmospheric O 2. Terrestrial uptake of<br />
CO 2, by contrast, implies that photosynthesis (which releases O 2) is exceeding respiration <strong>and</strong> other oxidation processes, including<br />
fire (which consume O 2). Thus, net terrestrial uptake of CO 2 implies a net release of O 2, in a known stochiometric ratio. This difference<br />
can be used to partition the total CO 2 uptake into l<strong>and</strong> <strong>and</strong> ocean components, as shown graphically in Figure 3.4. Strictly<br />
speaking, the atmospheric O 2 – CO 2 budget method can only distinguish between net non-biological ocean uptake <strong>and</strong> net<br />
biospheric uptake, which in principle includes both the terrestrial <strong>and</strong> the marine biosphere. However, since biological oxygen<br />
uptake is not expected to have changed significantly during recent decades because of nutrient limitations in most parts of the ocean<br />
(see Section 3.2.3.2), this inferred biospheric uptake is attributed to the l<strong>and</strong>.<br />
Measurement of changes in O 2 presents a technical challenge because changes of a few ppm caused by fossil fuel burning have<br />
to be determined against a background concentration of 209,000 ppm (about 21%). For technical reasons, O 2 is measured relative<br />
to N 2, the main constituent of the atmosphere, as a reference gas. For simplicity this chapter refers to O 2 concentrations, although<br />
strictly it is O 2 :N 2 ratios that are measured. <strong>The</strong> impact of nitrification-denitrification changes on atmospheric N 2 content are<br />
assumed not to be problematic because they are small <strong>and</strong> the inventory of N 2 is very large. Increases in ocean temperatures (Levitus<br />
et al., 2000), because of their effect on the temperature dependent solubility, induce small outgassing fluxes of O 2 <strong>and</strong> N 2 (Keeling<br />
et al., 1993) that have to be taken into account (see Figure 3.4) although their magnitude is only approximately known. Impacts on<br />
atmospheric O 2 caused by changes in the ventilation of deeper, oxygen depleted waters have been observed on interannual timescales<br />
(Keeling et al., 1993, Bender et al., 1996). <strong>The</strong>y could also occur on longer time-scales, e.g., through increased ocean stratification<br />
induced by ocean warming.<br />
Another analysis calculated a substantially higher net source<br />
due to l<strong>and</strong>-use change in the tropics of 2.4 ± 1.0 PgC/yr during<br />
the 1980s (Fearnside, 2000). This analysis did not deal with<br />
temperate regions, <strong>and</strong> is not used in the global budget estimates.<br />
No complete global assessment of deforestation effects<br />
covering the 1990s is available. Rates of deforestation appear to<br />
be declining. <strong>The</strong> FAO (1997) tropical forest assessment reported<br />
annual losses of 15.5×10 6 ha in the 1980s, <strong>and</strong> 13.7×10 6 ha in<br />
1990 to 1995. Independent studies show a significant decline in<br />
deforestation rates in the Amazon region (Skole <strong>and</strong> Tucker,<br />
1993; Fearnside, 2000). <strong>The</strong> annual flux of carbon from l<strong>and</strong>-use<br />
change for the period from 1990 to 1995 has been estimated to be<br />
1.6 PgC/yr from 1990 to 1995, consisting of a source of 1.7<br />
PgC/yr in the tropics <strong>and</strong> a small sink in temperate <strong>and</strong> boreal<br />
areas (Houghton, 2000).<br />
3.5 Observations, Trends <strong>and</strong> Budgets<br />
3.5.1 <strong>Atmospheric</strong> Measurements <strong>and</strong> Global CO 2 Budgets<br />
Continuous time-series of highly precise measurements of the<br />
atmospheric composition are of central importance to current<br />
underst<strong>and</strong>ing of the contemporary carbon cycle. CO 2 has been<br />
measured at the Mauna Loa <strong>and</strong> South Pole stations since 1957<br />
(Keeling et al., 1995; Figure 3.2a), <strong>and</strong> through a global surface<br />
sampling network developed in the 1970s that is becoming<br />
progressively more extensive <strong>and</strong> better inter-calibrated (Conway<br />
et al., 1994; Keeling et al., 1995). Associated measurements of<br />
δ 13 C in atmospheric CO 2 began in 1977 (Francey et al., 1995,<br />
Keeling et al., 1995, Trolier et al., 1996). More recently, comple-<br />
205<br />
mentary information has been available from O 2 concentrations<br />
(measured as ratios of O 2:N 2, see Box 3.5), which have been<br />
regularly measured since the early 1990s (Keeling <strong>and</strong> Shertz,<br />
1992; Keeling et al., 1993; Bender et al., 1996; Keeling et al.,<br />
1996b; Battle et al., 2000; Manning, 2001; Figure 3.2a). O 2<br />
concentration data for the 1980s have been gleaned by two<br />
methods: sampling of archived air flasks that were collected<br />
during the 1980s (Langenfelds et al., 1999), <strong>and</strong> measuring the<br />
air trapped in Antarctic firn (Battle et al., 1996).<br />
In addition to fossil fuel CO 2 emissions, Figure 3.3 shows<br />
the observed seasonally corrected growth rate of the<br />
atmospheric CO 2 concentrations, based on the two longest<br />
running atmospheric CO 2 recording stations (Keeling <strong>and</strong><br />
Whorf, 2000). It is evident from this comparison that a part of<br />
the anthropogenic CO 2 has not remained in the atmosphere; in<br />
other words, CO 2 has been taken up by the l<strong>and</strong> or the ocean or<br />
both. This comparison also shows that there is considerable<br />
interannual variability in the total rate of uptake.<br />
O 2 <strong>and</strong> CO 2 measurements are used here to provide observationally-based<br />
budgets of atmospheric CO 2 (Table 3.1). CO 2<br />
budgets are presented here (Table 3.1) for the 1980s (for<br />
comparison with previous work; Table 3.3), <strong>and</strong> for the 1990s.<br />
<strong>The</strong> reported error ranges are based on uncertainties of global<br />
fossil fuel emissions, determination of the decadal average<br />
changes in the atmospheric CO 2 concentration, <strong>and</strong> O 2:N 2 ratio;<br />
<strong>and</strong> uncertainties in the assumed O 2:CO 2 stoichiometric ratios<br />
in the combustion of fossil fuels <strong>and</strong> in photosynthesis <strong>and</strong><br />
respiration. <strong>The</strong> error ranges reflect uncertainties of the decadal<br />
mean averaged values; they do not reflect interannual<br />
variability in annual values, which far exceeds uncertainty in
206 <strong>The</strong> <strong>Carbon</strong> <strong>Cycle</strong> <strong>and</strong> <strong>Atmospheric</strong> <strong>Carbon</strong> <strong>Dioxide</strong><br />
O 2 concentration, difference from st<strong>and</strong>ard (ppm)<br />
−20<br />
−25<br />
−30<br />
−35<br />
−40<br />
−45<br />
−50<br />
−55<br />
−60<br />
345<br />
1990<br />
350<br />
1991<br />
1992<br />
1993<br />
1994<br />
355<br />
1995<br />
1996<br />
1997<br />
atmospheric<br />
increase<br />
1998<br />
outgassing<br />
1999<br />
2000<br />
fossil<br />
fuel<br />
bur ning<br />
l<strong>and</strong><br />
uptake<br />
360 365 370<br />
CO2 concentration (ppm)<br />
375<br />
ocean<br />
uptake<br />
Figure 3.4: Partitioning of fossil fuel CO 2 uptake using O 2 measurements (Keeling <strong>and</strong> Shertz, 1992; Keeling et al., 1993; Battle et al., 1996,<br />
2000; Bender et al., 1996; Keeling et al., 1996b; Manning, 2001). <strong>The</strong> graph shows the relationship between changes in CO 2 (horizontal axis) <strong>and</strong><br />
O 2 (vertical axis). Observations of annual mean concentrations of O 2, centred on January 1, are shown from the average of the Alert <strong>and</strong> La Jolla<br />
monitoring stations (Keeling et al., 1996b; Manning, 2001; solid circles) <strong>and</strong> from the average of the Cape Grim <strong>and</strong> Point Barrow monitoring<br />
stations (Battle et al., 2000; solid triangles). <strong>The</strong> records from the two laboratories, which use different reference st<strong>and</strong>ards, have been shifted to<br />
optimally match during the mutually overlapping period. <strong>The</strong> CO 2 observations represent global averages compiled from the stations of the<br />
NOAA network (Conway et al., 1994) with the methods of Tans et al. (1989). <strong>The</strong> arrow labelled “fossil fuel burning” denotes the effect of the<br />
combustion of fossil fuels (Marl<strong>and</strong> et al., 2000; British Petroleum, 2000) based on the relatively well known O 2:CO 2 stoichiometric relation of<br />
the different fuel types (Keeling, 1988). Uptake by l<strong>and</strong> <strong>and</strong> ocean is constrained by the known O 2:CO 2 stoichiometric ratio of these processes,<br />
defining the slopes of the respective arrows. A small correction is made for differential outgassing of O 2 <strong>and</strong> N 2 with the increased temperature of<br />
the ocean as estimated by Levitus et al. (2000).<br />
380<br />
385
<strong>The</strong> <strong>Carbon</strong> <strong>Cycle</strong> <strong>and</strong> <strong>Atmospheric</strong> <strong>Carbon</strong> <strong>Dioxide</strong><br />
Box 3.6: Stable carbon isotopes in atmospheric CO 2.<br />
δ 13 C, a measure of the relative abundance of the two stable carbon isotopes, 13 C <strong>and</strong> 12 C, in atmospheric CO 2 gives in principle<br />
similar possibilities to O 2 for the partitioning of atmospheric CO 2 uptake (Keeling et al., 1979, 1980; Mook et al., 1983; Keeling<br />
et al., 1989; Francey et al., 1995; Keeling et al., 1995). <strong>The</strong> principle of using δ 13 C to separate l<strong>and</strong> <strong>and</strong> ocean components of the<br />
carbon budget relies on the fractionation during photosynthesis by C 3 plants, which discriminates against 13 C. This fractionation<br />
leads to biospheric carbon being depleted in 13 C by about 18‰ relative to the atmosphere. In contrast, exchanges with the ocean<br />
involve relatively small fractionation effects. Changes in the 13 C/ 12 C ratio of atmospheric CO 2 thus indicate the extent to which<br />
concurrent CO 2 variations can be ascribed to variations in biospheric uptake. <strong>The</strong> calculation also requires specification of the<br />
turnover times of carbon in the ocean <strong>and</strong> on l<strong>and</strong>, because fossil fuel burning implies a continuous release of isotopically light<br />
carbon to the atmosphere. This leads to a lowering of the atmospheric 13 C/ 12 C isotope ratio, which takes years to centuries to work<br />
its way through the carbon cycle (Keeling et al., 1980; Tans et al., 1993; Ciais et al., 1995a,b).<br />
<strong>The</strong>re are some complications. C 3 plants discriminate against 13 C more strongly than C 4 plants (Lloyd <strong>and</strong> Farquhar, 1994), thus<br />
the distributions of C 3 <strong>and</strong> C 4 photosynthesis need to be known. <strong>The</strong> oceanic disequilibrium can in principle be estimated observationally<br />
(Tans et al., 1993; Heimannn <strong>and</strong> Maier-Reimer, 1996; Bacastow et al., 1996; Gruber et al., 1999), while the terrestrial<br />
disequilibrium has to be estimated by means of models (e.g., Ciais et al., 1999). Langenfelds et al. (1999) <strong>and</strong> Battle et al. (2000)<br />
have shown that recently estimated values for the disequilibrium terms lead to consistency between the partitioning of CO 2 uptake<br />
into l<strong>and</strong> <strong>and</strong> ocean uptake based on O 2 <strong>and</strong> on δ 13 C measurements.<br />
the decadal mean rate of increase, as is further discussed in<br />
Section 3.5.2. <strong>The</strong> salient facts are as follows:<br />
• During the 1980s, fossil fuel emissions were on average 5.4 ± 0.3<br />
PgC/yr <strong>and</strong> atmospheric CO 2 content increased on average by<br />
3.3 ± 0.1 PgC/yr. Partitioning of CO 2 uptake was estimated based<br />
on archived flask O 2 measurements (Langenfelds et al., 1999) for<br />
the 1979 to 1997 period, taking the O 2 trend during 1991 to 1997<br />
(Battle et al., 2000) into account. <strong>The</strong> resulting estimate of the<br />
ocean-atmosphere flux was −1.9 ± 0.6 PgC/yr <strong>and</strong> of the l<strong>and</strong>atmosphere<br />
flux −0.2 ± 0.7 PgC/yr. This partitioning is adopted<br />
here in Table 3.1. It is corroborated by independent O 2 measurements<br />
in Antarctic firn (Battle et al., 1996). Restricting the<br />
analysis to the Battle et al. (1996) data for the 1980 to 1989<br />
period, an ocean-atmosphere flux of −1.8 ± 1.0 PgC/yr <strong>and</strong> a<br />
l<strong>and</strong>-atmosphere flux of −0.4 ± 1.0 PgC/yr were obtained, i.e.,<br />
results indistinguishable from the values in Table 3.1.<br />
• Despite a greater emission rate of 6.3 ± 0.4 PgC/yr (see Section<br />
3.4.1), the average atmospheric increase during the 1990s was<br />
3.2 ± 0.1 PgC/yr, i.e., about the same as during the 1980s. An<br />
exceptionally low rate of increase during the early 1990s was<br />
balanced by a high rate during the late 1990s. Based on the<br />
longest existing O 2 records from La Jolla (California, USA)<br />
<strong>and</strong> Alert (northern Canada) (Keeling et al., 1996b; Manning,<br />
2001; see Figure 3.4), the ocean-atmosphere flux during the<br />
1990s was −1.7 ± 0.5 PgC/yr <strong>and</strong> the l<strong>and</strong>-atmosphere flux was<br />
−1.4 ± 0.7 PgC/yr.<br />
Ocean uptake in the 1980s as estimated from O 2 <strong>and</strong> CO 2 measurements<br />
thus agrees with the estimates in the SRRF (Schimel et al.,<br />
1995) <strong>and</strong> the SAR (Schimel et al., 1996) (although these were<br />
model-based estimates; this section presents only observationallybased<br />
estimates (Table 3.3)). Considering the uncertainties, the<br />
ocean sink in the 1990s was not significantly different from that in<br />
207<br />
the 1980s. <strong>The</strong> l<strong>and</strong>-atmosphere flux was close to zero in the<br />
1980s, as also implied by the SAR budget. <strong>The</strong> l<strong>and</strong> appears to<br />
have taken up more carbon during the 1990s than during the 1980s.<br />
<strong>The</strong> causes cannot yet be reliably quantified, but possible<br />
mechanisms include a slow down in deforestation (Section 3.4.2),<br />
<strong>and</strong> climate variability that resulted in temporarily increased l<strong>and</strong><br />
<strong>and</strong>/or ocean uptake in the early 1990s (Section 3.5.2). <strong>The</strong>se<br />
budgets are consistent with information from atmospheric δ 13 C<br />
measurements (see Box 3.6 <strong>and</strong> Table 3.4) <strong>and</strong> with budgets<br />
presented in the SRLULUCF (Bolin et al. 2000) except that<br />
estimated ocean uptake is smaller, <strong>and</strong> l<strong>and</strong> uptake accordingly<br />
larger, than given in the SRLULUCF (see Table 3.3, footnote i).<br />
Several alternative approaches to estimating the oceanatmosphere<br />
<strong>and</strong> l<strong>and</strong>-atmosphere fluxes of CO 2 are summarised<br />
in Table 3.4. Alternative methods for estimating the global oceanatmosphere<br />
flux, based on surface-water pCO 2 measurements<br />
<strong>and</strong> ocean δ 13 C changes (Quay et al., 1992; Tans et al., 1993,<br />
Heimann <strong>and</strong> Maier-Reimer, 1996; Sonnerup et al., 1999),<br />
respectively, have yielded a range of −1.5 to −2.8 PgC/yr (for<br />
various recent periods). <strong>The</strong> total anthropogenic CO 2 added to the<br />
ocean since pre-industrial times can also be estimated indirectly<br />
using oceanic observations (Gruber et al., 1996). A global value<br />
of 107 ± 27 PgC by 1990 can be estimated from the basin-scale<br />
values of 40 ± 9 PgC for the Atlantic in the 1980s (Gruber, 1998),<br />
20 ± 3 PgC for the Indian Ocean in 1995 (Sabine et al., 1999),<br />
<strong>and</strong> the preliminary value of 45 PgC for the Pacific Ocean in<br />
1990 to 1996 (Feely et al., 1999a) with a large uncertainty of the<br />
order of ± 15 PgC. Assuming that accumulation of CO 2 in the<br />
ocean follows a curve similar to the (better known) accumulation<br />
in the atmosphere, the value for the ocean-atmosphere flux for<br />
1980 to 1989 would be between −1.6 <strong>and</strong> −2.7 PgC/yr. Although<br />
each individual method has large uncertainty, all of these oceanbased<br />
measurements give results comparable with the fluxes<br />
presented in Table 3.1. Consideration of model-based estimates<br />
of ocean uptake in Table 3.4 is deferred to Section 3.6.2.2.
208 <strong>The</strong> <strong>Carbon</strong> <strong>Cycle</strong> <strong>and</strong> <strong>Atmospheric</strong> <strong>Carbon</strong> <strong>Dioxide</strong><br />
Table 3.3: Comparison of the global CO 2 budgets from Table 3.1 with previous IPCC estimates a,b,c (units are PgC/yr).<br />
<strong>The</strong> l<strong>and</strong>-atmosphere flux based on atmospheric measurements<br />
represents the balance of a net l<strong>and</strong>-use flux (currently a<br />
positive flux, or carbon source, dominated by tropical deforestation)<br />
<strong>and</strong> a residual component which is, by inference, a negative<br />
flux or carbon sink. Using the l<strong>and</strong>-atmosphere flux estimates<br />
from Table 3.1, assuming that l<strong>and</strong>-use change contributed +1.7<br />
PgC/yr to the atmosphere during the 1980s (Section 3.4.2), then<br />
a residual terrestrial flux of −1.9 PgC/yr (i.e., a residual sink of<br />
similar magnitude to the total ocean uptake) is required for mass<br />
balance. This is the term popularly (<strong>and</strong> misleadingly) known as<br />
the “missing sink”. <strong>The</strong> central estimate of its magnitude agrees<br />
with previous analyses, e.g., in the SAR (if “northern forest<br />
regrowth” is combined with “residual terrestrial sink” terms in<br />
the SAR budget; Schimel et al., 1996) <strong>and</strong> the SRLULUCF<br />
(Bolin et al., 2000) (Table 3.3). <strong>The</strong> uncertainty around this<br />
number is rather large, however, because it compounds the<br />
uncertainty in the atmospheric budget with a major uncertainty<br />
about changes in l<strong>and</strong> use. Using an error range corresponding<br />
to 90% confidence intervals around the atmospheric estimate of<br />
−0.2 PgC/yr (i.e., 1.6σ, giving confidence intervals of ±1.1<br />
PgC/yr), <strong>and</strong> taking the range of estimates for CO 2 released due<br />
to l<strong>and</strong>-use change during the 1980s from Section 3.4.2, the<br />
residual terrestrial sink is estimated to range from −3.8 to +0.3<br />
PgC/yr for the 1980s. Model-based analysis of the components of<br />
the residual terrestrial sink (Table 3.4) is discussed in Section<br />
3.6.2.2.<br />
1980s<br />
This chapter SRLULUCF d SAR e<br />
SRRF f<br />
<strong>Atmospheric</strong> increase 3.3 ± 0.1 3.3 ± 0.1 3.3 ± 0.1 3.2 ± 0.1<br />
Emissions (fossil fuel, cement) 5.4 ± 0.3 5.5 ± 0.3 5.5 ± 0.3 5.5 ± 0.3<br />
Ocean-atmosphere flux −1.9 ± 0.6 −2.0 ± 0.5 −2.0 ± 0.5 −2.0 ± 0.5<br />
L<strong>and</strong>-atmosphere flux*<br />
−0.2 ± 0.7<br />
*partitioned as follows<br />
g<br />
−0.2 ± 0.6 −0.2 ± 0.6 −0.3 ± 0.6<br />
L<strong>and</strong>-use change 1.7 (0.6 to 2.5) g<br />
Residual terrestrial sink −1.9 (−3.8 to 0.3)<br />
1.7 ± 0.8<br />
−1.9 ± 1.3<br />
1.6 ± 1.0<br />
−1.8 ± 1.6<br />
1.6 ± 1.0<br />
h<br />
−1.9 ± 1.6<br />
i<br />
1990s 1989 to 1998<br />
This chapter SRLULUCF d<br />
3.2 ± 0.1 3.3 ± 0.1<br />
6.4 ± 0.4 6.3 ± 0.4<br />
−1.7 ± 0.5 −2.3 ± 0.5 i<br />
−1.4 ± 0.7 −0.7 ± 0.6<br />
insufficient 1.6 ± 0.8 j<br />
data −2.3 ± 1.3<br />
a Positive values are fluxes to the atmosphere; negative values represent uptake from the atmosphere.<br />
b Previous IPCC carbon budgets calculated ocean uptake <strong>and</strong> l<strong>and</strong>-use change from models. <strong>The</strong> residual terrestrial sink was inferred. Here the<br />
implied l<strong>and</strong>-atmosphere flux (with its error) is derived from these previous budgets as required for comparison with Table 3.1.<br />
c Error ranges are expressed in this book as 67% confidence intervals (± 1σ). Previous IPCC estimates have used 90% confidence intervals<br />
(± 1.6σ). <strong>The</strong>se error ranges have been scaled down as required for comparison with Table 3.1. Uncertainty ranges for l<strong>and</strong>-use change<br />
emissions have not been altered in this way.<br />
d IPCC Special Report on L<strong>and</strong> Use, L<strong>and</strong>-use Change <strong>and</strong> Forestry (SRLULUCF) (IPCC, 2000a; Bolin et al., 2000).<br />
e IPCC Second Assessment Report (SAR) (IPCC, 1996a; Schimel et al., 1996).<br />
f IPCC Special Report on Radiative Forcing (SRRF) (Schimel et al., 1995).<br />
g Ranges based on Houghton (1999, 2000), Houghton <strong>and</strong> Hackler (1999), <strong>and</strong> CCMLP model results (McGuire et al., 2001).<br />
h <strong>The</strong> sink of 0.5 ± 0.5 PgC/yr in “northern forest regrowth” cited in the SAR budget is assigned here to be part of the residual terrestrial sink,<br />
following Bolin et al. (2000).<br />
i Based on an ocean carbon cycle model (Jain et al., 1995) used in the IPCC SAR (IPCC, 1996; Harvey et al., 1997), tuned to yield an oceanatmosphere<br />
flux of 2.0 PgC/yr in the 1980s for consistency with the SAR. After re-calibration to match the mean behaviour of OCMIP models<br />
<strong>and</strong> taking account of the effect of observed changes in temperature aon CO2 <strong>and</strong> solubility, the same model yields an ocean-atmosphere flux of<br />
−1.7 PgC/yr for the 1980s <strong>and</strong> −1.9 PgC/yr for 1989 to 1998.<br />
j Based on annual average estimated emissions for 1989 to 1995 (Houghton, 2000).<br />
3.5.2 Interannual Variability in the Rate of <strong>Atmospheric</strong> CO 2<br />
Increase<br />
<strong>The</strong> rate of increase in the globally averaged atmospheric concentration<br />
of CO 2 varies greatly from year to year. “Fast” <strong>and</strong> “slow”<br />
years have differed by 3 to 4 PgC/yr within a decade (Figure 3.3).<br />
This variability cannot be accounted for by fossil fuel emissions,<br />
which do not show short-term variability of this magnitude. <strong>The</strong><br />
explanation must lie in variability of the l<strong>and</strong>-atmosphere flux or<br />
the ocean-atmosphere flux or both. Variability in both systems<br />
could be induced by climate variability.<br />
An association between CO 2 variability <strong>and</strong> El Niño in particular<br />
has been reported for over twenty years <strong>and</strong> has been<br />
confirmed by recent statistical analyses (Bacastow, 1976; Keeling<br />
<strong>and</strong> Revelle, 1985; Thompson et al., 1986; Siegenthaler, 1990;<br />
Elliott et al., 1991; Braswell et al., 1997; Feely et al., 1997;<br />
Dettinger <strong>and</strong> Ghil, 1998; Rayner et al., 1999b). During most of<br />
the observational record, El Niño events have been marked by<br />
high rates of increase in atmospheric CO 2 concentration<br />
compared with surrounding years, in the order of > 1 PgC/yr<br />
higher during most El Niño events (Figure 3.3). Direct measurements<br />
of oceanic CO 2 in the equatorial Pacific over the last 20<br />
years have shown that the natural efflux of CO 2 from this region<br />
is reduced by between 0.2 to 1.0 PgC/yr during El Niño (Keeling<br />
<strong>and</strong> Revelle, 1985; Smethie et al., 1985; Takahashi et al., 1986;<br />
Inoue <strong>and</strong> Sugimura, 1992; Wong et al., 1993; Feely et al., 1997;
<strong>The</strong> <strong>Carbon</strong> <strong>Cycle</strong> <strong>and</strong> <strong>Atmospheric</strong> <strong>Carbon</strong> <strong>Dioxide</strong><br />
Table 3.4: Alternative estimates of ocean-atmosphere <strong>and</strong> l<strong>and</strong>-atmosphere fluxes.<br />
Oceanic observations<br />
1970 to 1990<br />
Ocean 13 C inventory −2.1 ± 0.8 a<br />
−2.1 ± 0.9 b<br />
1985 to 1995<br />
Ocean 13 C inventory −1.5 ± 0.9 c<br />
1995<br />
Surface-water pCO 2 −2.8 ± 1.5 d<br />
1990<br />
e<br />
Inventory of anthropogenic CO 2 −1.6 to −2.7<br />
<strong>Atmospheric</strong> observations<br />
1980 to 1989<br />
O2 in Antarctic firn −1.8 f<br />
1990 to 1999<br />
<strong>Atmospheric</strong> CO 2 <strong>and</strong> δ 13 C −1.8 g<br />
1999b), mainly due to the reduced upwelling of CO 2-rich waters<br />
(Archer et al., 1996). <strong>The</strong> ocean response to El Niño in the most<br />
active region thus tends to increase global CO 2 uptake, counter to<br />
the increasing atmospheric concentration. Although it cannot be<br />
ruled out that other ocean basins may play a significant role for<br />
global interannual variability in ocean-atmosphere flux, the<br />
existing oceanic measurements suggest (by default) that the<br />
response of the terrestrial biosphere is the cause of the typically<br />
high rates of CO 2 increase during El Niño.<br />
Associated variations in the north-south gradient of CO 2<br />
indicate that the El Niño CO 2 anomalies originate in the tropics<br />
(Conway et al., 1994; Keeling <strong>and</strong> Piper, 2000). Typical El<br />
Niño events are characterised by changed atmospheric circula-<br />
Ocean-atmosphere flux L<strong>and</strong>-atmosphere flux<br />
−2.4 h<br />
− 0.4 f<br />
−1.4 g<br />
−0.8 h<br />
Models<br />
1980 to 1989<br />
OCMIP −1.5 to −2.2 i<br />
CCMLP −0.3 to −1.5 j *<br />
*<br />
*partitioned as follows:<br />
*partitioned as follows:<br />
L<strong>and</strong>-use change 0.6 to 1.0<br />
CO2 <strong>and</strong> N fertilisation −1.5 to −3.1<br />
Climate variability − 0.2 to +0.9<br />
Sources of data:<br />
a Quay et al. (1992).<br />
b Heimann <strong>and</strong> Maier-Reimer (1996).<br />
c Gruber <strong>and</strong> Keeling (2001).<br />
d Takahashi et al. (1999) with –0.6 PgC/yr correction for l<strong>and</strong>-ocean river flux.<br />
e Gruber (1998), Sabine et al. (1999); Feely et al. (1999a), assuming that the ocean <strong>and</strong> atmospheric CO2 increase follow a similar curve.<br />
f This chapter, from data of Battle et al. (1996).<br />
g Updated calculation of Ciais et al. (1995b); Tans et al. (1989); Trolier et al. (1996) (no error bars given).<br />
h Keeling <strong>and</strong> Piper (2000) (no error bars given).<br />
i Orr et al. (2000), Orr <strong>and</strong> Dutay (1999).<br />
j McGuire et al. (2001).<br />
209<br />
tion <strong>and</strong> precipitation patterns (Zeng, 1999) that give rise to<br />
high tropical l<strong>and</strong> temperatures (which would be expected to<br />
increase Rh <strong>and</strong> reduce NPP); concurrent droughts which<br />
reduce NPP, especially in the most productive regions such as<br />
the Amazon rain forest; <strong>and</strong> increased incidence of fires in<br />
tropical regions. Increased cloudiness associated with enhanced<br />
south-east Asian monsoons during the late phase of El Niño has<br />
also been suggested as a factor reducing global NPP (Yang <strong>and</strong><br />
Wang, 2000). Typically, although not invariably, the rate of<br />
atmospheric CO 2 increase declines around the start of an El<br />
Niño, then rapidly rises during the late stages (Elliott et al.,<br />
1991; Conway et al., 1994). It has been suggested that this<br />
pattern represents early onset of enhanced ocean CO 2 uptake,
210 <strong>The</strong> <strong>Carbon</strong> <strong>Cycle</strong> <strong>and</strong> <strong>Atmospheric</strong> <strong>Carbon</strong> <strong>Dioxide</strong><br />
followed by reduced terrestrial CO 2 uptake or terrestrial CO 2<br />
release (Feely et al., 1987, 1999b; Rayner et al., 1999b; Yang<br />
<strong>and</strong> Wang, 2000).<br />
<strong>Atmospheric</strong> δ 13 C <strong>and</strong>, more recently, O 2 measurements have<br />
been used to partition the interannual variability of the<br />
atmospheric CO 2 increase into oceanic <strong>and</strong> terrestrial<br />
components. Analyses based on δ 13 C by Keeling et al. (1995) <strong>and</strong><br />
Francey et al. (1995) reached contradictory conclusions, but the<br />
discrepancies are now thought to be due at least in part to δ 13 C<br />
measurement calibration problems during the 1980s, which have<br />
largely been resolved during the 1990s (Francey et al., 1999a).<br />
For the 1990s, a range of analyses using different atmospheric<br />
observations <strong>and</strong>/or data analysis techniques estimate that the<br />
amplitude of annual peak to peak variation associated with the<br />
ocean is about 2 to 3 PgC/yr <strong>and</strong> the amplitude associated with<br />
the terrestrial biosphere is about 4 to 5 PgC/yr (Rayner et al.,<br />
1999a; Joos et al., 1999a; Battle et al., 2000 (O 2-based analysis);<br />
Keeling <strong>and</strong> Piper, 2000; Manning, 2001). A similar partitioning<br />
was estimated by Bousquet et al. (2000) based on the spatial<br />
pattern of CO 2 measurements using the approach described in the<br />
next section (3.5.3). However, the various reconstructed time<br />
sequences of terrestrial <strong>and</strong> ocean uptake differ in many details<br />
<strong>and</strong> do not provide conclusive evidence of the mechanisms<br />
involved.<br />
<strong>The</strong> early 1990s were unusual in that the growth rate in<br />
atmospheric CO 2 was low (1.9 PgC/yr in 1992), especially in the<br />
Northern Hemisphere (Conway et al., 1994), while an extended<br />
El Niño event occurred in the equatorial Pacific. Various<br />
mechanisms have been suggested, but none fully explain this<br />
unusual behavior of the carbon cycle. <strong>The</strong> slow down in the CO 2<br />
increase has been linked to the predominantly mid- to high<br />
latitude cooling caused by the Pinatubo eruption (Conway et al.,<br />
1994; Ciais et al., 1995a,b; Schimel et al., 1996), but there is no<br />
proof of any connection between these events. Other partial<br />
explanations could come from a temporary slow down of tropical<br />
deforestation (Houghton et al., 2000), or natural decadal<br />
variability in the ocean-atmosphere or l<strong>and</strong>-atmosphere fluxes<br />
(Keeling et al., 1995). In any case, the slowdown proved to be<br />
temporary, <strong>and</strong> the El Niño of 1998 was marked by the highest<br />
rate of CO 2 increase on record, 6.0 PgC/yr.<br />
3.5.3 Inverse Modelling of <strong>Carbon</strong> Sources <strong>and</strong> Sinks<br />
Inverse modelling attempts to resolve regional patterns of CO 2<br />
uptake <strong>and</strong> release from observed spatial <strong>and</strong> temporal patterns<br />
in atmospheric CO 2 concentrations, sometimes also taking into<br />
consideration O 2 <strong>and</strong>/or δ 13 C measurements. <strong>The</strong> most robust<br />
results are for the latitudinal partitioning of sources <strong>and</strong> sinks<br />
between northern <strong>and</strong> southern mid- to high latitudes <strong>and</strong> the<br />
tropics. <strong>The</strong> observed annual mean latitudinal gradient of<br />
atmospheric CO 2 concentration during the last 20 years is<br />
relatively large (about 3 to 4 ppm) compared with current<br />
measurement accuracy. It is however not as large as would be<br />
predicted from the geographical distribution of fossil fuel<br />
burning – a fact that suggests the existence of a northern sink<br />
for CO 2, as already recognised a decade ago (Keeling et al.,<br />
1989; Tans et al., 1990; Enting <strong>and</strong> Mansbridge, 1991).<br />
PgC/yr<br />
PgC/yr<br />
4<br />
2<br />
0<br />
−2<br />
4<br />
2<br />
0<br />
−2<br />
1980-1989<br />
1990-1996<br />
30°N<br />
Latitude zone<br />
l<strong>and</strong>-atmosphere flux<br />
ocean-atmosphere flux<br />
sum of ocean-atmosphere <strong>and</strong> l<strong>and</strong>-atmosphere fluxes<br />
fossil-fuel emissions<br />
Figure 3.5: Inverse model estimates of fossil fuel CO 2 uptake by<br />
latitude b<strong>and</strong>s according to eight models using different techniques <strong>and</strong><br />
sets of atmospheric observations (results summarised by Heimann,<br />
2001). Positive numbers denote fluxes to the atmosphere; negative<br />
numbers denote uptake from the atmosphere. <strong>The</strong> ocean-atmosphere<br />
fluxes represent mainly the natural carbon cycle; the l<strong>and</strong>-atmosphere<br />
fluxes may be considered as estimates of the uptake of anthropogenic<br />
CO 2 by the l<strong>and</strong> (with some caveats as discussed in the text). <strong>The</strong> sum<br />
of l<strong>and</strong>-atmosphere <strong>and</strong> ocean-atmosphere fluxes is shown because it<br />
is somewhat better constrained by observations than the separate<br />
fluxes, especially for the 1980s when the measurement network was<br />
less extensive than it is today. <strong>The</strong> 1990s are represented by the period<br />
1990 to 1996 only, because when this exercise was carried out the<br />
modelling groups did not have access to all of the necessary data for<br />
more recent years.<br />
<strong>The</strong> nature of this sink, however, cannot be determined from<br />
atmospheric CO 2 concentration measurements alone. It might<br />
reflect, at least in part, a natural source-sink pattern of oceanic<br />
CO 2 fluxes (Keeling et al., 1989; Broecker <strong>and</strong> Peng, 1992).<br />
This view is supported by the early atmospheric CO 2 data from<br />
the 1960s (Bolin <strong>and</strong> Keeling, 1963) which do not show a clear<br />
latitudinal gradient, despite the fact that at that time the fossil
<strong>The</strong> <strong>Carbon</strong> <strong>Cycle</strong> <strong>and</strong> <strong>Atmospheric</strong> <strong>Carbon</strong> <strong>Dioxide</strong><br />
CO 2 flux (PgC/yr)<br />
3<br />
2<br />
1<br />
0<br />
−1<br />
−2<br />
−3<br />
−4<br />
30°S to 30°N >30°N<br />
l<strong>and</strong>-atmosphere flux, from observations (Figure 3.5)<br />
estimated flux due to l<strong>and</strong>-use change<br />
inferred (residual) terrestrial sink<br />
Figure 3.6: Partitioning the 1980s l<strong>and</strong>-atmosphere flux for the tropics<br />
<strong>and</strong> the northern extratropics. <strong>The</strong> residual terrestrial sink in different<br />
latitude b<strong>and</strong>s can be inferred by subtracting the l<strong>and</strong>-use change flux<br />
for the 1980s (estimated by modelling studies: Houghton, 1999;<br />
Houghton <strong>and</strong> Hackler, 1999; Houghton et al., 2000; McGuire et al.,<br />
2001) from the net l<strong>and</strong>-atmosphere flux as obtained from atmospheric<br />
observations by inverse modelling for the same period (Heimann, 2001;<br />
results from Figure 3.5). Positive numbers denote fluxes to the<br />
atmosphere; negative numbers denote uptake from the atmosphere. This<br />
calculation is analogous to the global budget calculation in Table 3.1,<br />
but now the model results are broken down geographically <strong>and</strong> the<br />
l<strong>and</strong>-atmosphere fluxes are obtained by inverse modelling. <strong>The</strong> upper<br />
<strong>and</strong> lower bounds on the residual sink are obtained by pairing opposite<br />
extremes of the ranges of values accepted for the two terms in this<br />
calculation (for example, by subtracting the bottom of the range of<br />
values for l<strong>and</strong>-use change with the top of the range for the l<strong>and</strong>atmosphere<br />
flux). <strong>The</strong> mid-ranges are obtained by combining similar<br />
extremes (for example, subtracting the bottom of the range for l<strong>and</strong>-use<br />
change emissions from the bottom of the range l<strong>and</strong>-atmosphere flux).<br />
emissions were already at least half as large as in the 1990s.<br />
Quantitative analysis shows that the Northern Hemisphere sink<br />
has not changed much in magnitude since the 1960s (Keeling et<br />
al., 1989; Fan et al., 1999). On the other h<strong>and</strong>, the existing airsea<br />
flux measurements do not support the idea of a large<br />
oceanic uptake of CO 2 in the Northern Hemisphere (Tans et al.,<br />
1990; Takahashi, 1999). An alternative view, therefore, locates<br />
a significant fraction of this Northern Hemisphere sink on l<strong>and</strong>.<br />
This view is corroborated, at least for the 1990s, by analyses of<br />
the concurrent latitudinal gradients of δ 13 C (Ciais et al.,<br />
1995a,b) <strong>and</strong> O 2 (Keeling et al., 1996b).<br />
Results of analyses for the 1980s <strong>and</strong> 1990 to 1996, carried<br />
out by eight modelling groups using different atmospheric<br />
transport models, observational data, constraints <strong>and</strong> mathematical<br />
procedures, are summarised in Figure 3.5. Only the most<br />
robust findings, i.e., estimates of the mean carbon balance for<br />
three latitude b<strong>and</strong>s averaged over the two time periods, are<br />
211<br />
shown. <strong>The</strong> latitude b<strong>and</strong>s are: “southern extratropics” (>30°S),<br />
“tropics” (30°S to 30°N) <strong>and</strong> “northern extratropics” (>30°N).<br />
<strong>The</strong> carbon balance estimates are broken down into l<strong>and</strong> <strong>and</strong><br />
ocean compartments within each latitude b<strong>and</strong> (Heimann,<br />
2001).<br />
Although the ranges of the estimates in Figure 3.5 limit the<br />
precision of any inference from these analyses, some clear<br />
features emerge. <strong>The</strong> inferred ocean uptake pattern shows the<br />
sum of two components: the natural carbon cycle in which CO 2<br />
is outgassed in the tropics <strong>and</strong> taken up in the extratropics, <strong>and</strong><br />
the perturbation uptake of anthropogenic CO 2. Separation of<br />
these two components cannot be achieved from atmospheric<br />
measurements alone.<br />
<strong>The</strong> estimates for the l<strong>and</strong>, on the other h<strong>and</strong>, in principle<br />
indicate the locations of terrestrial anthropogenic CO 2 uptake<br />
(albeit with caveats listed below). For 1980 to 1989, the inversemodel<br />
estimates of the l<strong>and</strong>-atmosphere flux are −2.3 to −0.6<br />
PgC/yr in the northern extratropics <strong>and</strong> −1.0 to +1.5 PgC/yr in the<br />
tropics. <strong>The</strong>se estimates imply that anthropogenic CO 2 was taken<br />
up both in the northern extratropics <strong>and</strong> in the tropics (balancing<br />
deforestation), as illustrated in Figure 3.6. <strong>The</strong> estimated l<strong>and</strong>atmosphere<br />
flux in the southern extratropics is estimated as close<br />
to zero, which is expected given the small l<strong>and</strong> area involved.<br />
Estimates of CO 2 fluxes for the period 1990 to 1996 show a<br />
general resemblance to those for the 1980s. For 1990 to 1996, the<br />
inverse-model estimates of the l<strong>and</strong>-atmosphere flux are −1.8 to<br />
−0.7 PgC/yr in the northern extratropics <strong>and</strong> −1.3 to +1.1 PgC/yr<br />
in the tropics. <strong>The</strong>se results suggest a tendency towards a reduced<br />
l<strong>and</strong>-atmosphere flux in the tropics, compared to the 1980s. Such<br />
a trend could be produced by reduced deforestation, increased<br />
CO 2 uptake or a combination of these.<br />
Inverse modelling studies usually attempt greater spatial<br />
resolution of sources <strong>and</strong> sinks than is presented in this section.<br />
However, there are large unresolved differences in longitudinal<br />
patterns obtained by inverse modelling, especially in the northern<br />
hemisphere <strong>and</strong> in the tropics (Enting et al., 1995, Law et al.,<br />
1996; Fan et al., 1998; Rayner et al., 1999a; Bousquet et al.,<br />
1999; Kaminski et al., 1999). <strong>The</strong>se differences may be traced to<br />
different approaches <strong>and</strong> several difficulties in inverse modelling<br />
of atmospheric CO 2 (Heimann <strong>and</strong> Kaminski, 1999):<br />
• <strong>The</strong> longitudinal variations in CO 2 concentration reflecting net<br />
surface sources <strong>and</strong> sinks are on annual average typically
212 <strong>The</strong> <strong>Carbon</strong> <strong>Cycle</strong> <strong>and</strong> <strong>Atmospheric</strong> <strong>Carbon</strong> <strong>Dioxide</strong><br />
measured tracer that can be used to evaluate the models’<br />
representation of longitudinal transport. Furthermore, the<br />
strong seasonality of the terrestrial CO 2 flux in the Northern<br />
Hemisphere together with covarying seasonal variations in<br />
atmospheric transport may induce significant mean annual<br />
gradients in concentration which do not reflect net annual<br />
sources <strong>and</strong> sinks, but which nevertheless have to be modelled<br />
correctly if inverse model calculations are to be reliable (Bolin<br />
<strong>and</strong> Keeling, 1963; Heimann et al., 1986; Keeling et al., 1989;<br />
Denning et al., 1995; Law et al., 1996). Even the sign of this<br />
so-called “rectifier effect” is uncertain. Some scientists believe<br />
that it may be responsible for a part of the apparent Northern<br />
Hemisphere uptake of CO 2 implied by inverse modelling<br />
results (Taylor, 1989; Taylor <strong>and</strong> Orr, 2000).<br />
• <strong>The</strong> spatial partitioning of CO 2 uptake could also be distorted by<br />
a few tenths of 1 PgC/yr because the atmospheric concentration<br />
gradients also reflect the natural fluxes induced by weathering,<br />
transport of carbon by rivers <strong>and</strong> subsequent outgassing from<br />
the ocean (see Figure 3.1) (Sarmiento <strong>and</strong> Sundquist, 1992;<br />
Aumont et al., 2001b). Furthermore, the effects of atmospheric<br />
transport of carbon released as CO <strong>and</strong> CH 4 (especially from<br />
incomplete fossil fuel burning, tropical biomass burning, <strong>and</strong><br />
CH 4 from tropical wetl<strong>and</strong>s) with subsequent oxidation to CO 2<br />
is generally neglected. <strong>The</strong>ir inclusion in the inversion leads to<br />
corrections of the latitudinal partitioning of up to 0.1 PgC/yr<br />
(Enting <strong>and</strong> Mansbridge, 1991).<br />
• <strong>The</strong> distribution of atmospheric CO 2 measurement stations<br />
(Figure 3.7) is uneven, <strong>and</strong> severely underrepresents the<br />
continents. This underrepresentation is due in part to the<br />
problem of finding continental locations where measurements<br />
will not be overwhelmed by local sources <strong>and</strong> sinks.<br />
• Because of the finite number of monitoring stations, the<br />
mathematical inversion problem is highly underdetermined. In<br />
principle a multitude of different surface source/sink configurations<br />
are compatible with the atmospheric data, within their<br />
measurement accuracy. <strong>The</strong>refore, in order to extract a<br />
meaningful solution, additional information on the sources <strong>and</strong><br />
sinks has to be introduced into the calculation. Examples of this<br />
additional information include maps of air-sea fluxes from<br />
observations or ocean models, patterns of terrestrial CO 2<br />
exchanges inferred by terrestrial models, <strong>and</strong> remote sensing<br />
data. Thus, many methodological choices about the use of<br />
auxiliary data can influence the outcome of the analysis.<br />
Interannual variability of climate is likely to strongly influence<br />
the spatial distribution of CO 2 sources <strong>and</strong> sinks, so that analyses<br />
based on a few years of data are insufficient to establish a longterm<br />
trend.<br />
In conclusion, the present atmospheric measurement<br />
network, current information on air-sea fluxes <strong>and</strong> current<br />
underst<strong>and</strong>ing of vertical atmospheric transport are not sufficient<br />
to allow full use of the potential of inverse modelling techniques<br />
to infer geographically detailed source-sink distributions of<br />
anthropogenic CO 2.<br />
90°N<br />
60°N<br />
30°N<br />
EQ<br />
30°S<br />
60°S<br />
90°S<br />
0° 60°E 120°E 180° 120°W 60°W 0°<br />
Figure 3.7: <strong>The</strong> atmospheric CO 2 measuring station network as<br />
represented by GLOBAL VIEW−CO 2 (Comparative Atmosphere Data<br />
Integration Project − <strong>Carbon</strong> <strong>Dioxide</strong>, NOAA/CMDL,<br />
http://www.cmdl.noaa.gov/ccg/co2).<br />
3.5.4 Terrestrial Biomass Inventories<br />
Inventory studies measure changes in carbon stocks over large<br />
areas, <strong>and</strong> can thus provide spatially aggregated estimates of<br />
large-scale fluxes of CO 2 over multi-annual time-scales (Box<br />
3.1). Mid- <strong>and</strong> high latitude forests are covered by extensive<br />
national inventories based on repeated measurements of many<br />
thous<strong>and</strong>s of plots. Inventories in the tropics are by comparison<br />
generally inadequate, particularly in view of the high rates of<br />
l<strong>and</strong>-use change <strong>and</strong> extremely heterogeneous carbon density in<br />
many tropical ecosystems. <strong>The</strong>re are still therefore large<br />
uncertainties in attempting to balance the terrestrial carbon<br />
budget on a global scale using inventory data.<br />
<strong>The</strong> FAO Temperate <strong>and</strong> Boreal Forest Resource Assessment<br />
(TBFRA-2000) is a recent synthesis of inventories of forests <strong>and</strong><br />
other wooded l<strong>and</strong>s in Annex I (developed) countries for the early<br />
1990s (UN-ECE/FAO, 2000). Many countries reported substantial<br />
increases in forest areas in recent years, as well as increasing<br />
carbon density in existing forests. According to TBFRA-2000,<br />
the l<strong>and</strong>-atmosphere flux was −0.9 PgC/yr for all Annex I<br />
countries combined (the net annual increment of trees accounted<br />
for −1.5 PgC/yr, while losses due to fellings were 0.6 PgC/yr). Of<br />
this flux, −0.8 PgC/yr was due to uptake in “northern” forests<br />
(Europe, CIS, Japan <strong>and</strong> North America). An earlier review of<br />
individual regional <strong>and</strong> national studies by Dixon et al. (1994),<br />
highlighted in the IPCC WGII Second Assessment Report (IPCC,<br />
1996b; Brown et al., 1996), gave a range of −0.6 to −0.9 PgC/yr<br />
for the l<strong>and</strong> atmosphere flux in northern forests. While TBFRA-<br />
2000 estimated biomass of woody vegetation only, the analyses<br />
reviewed in Dixon et al. (1994) included other vegetation, soils,<br />
litter <strong>and</strong> wood products. Under the United Nations Framework<br />
Convention for Climate Change (UNFCCC) signatory countries<br />
are required to report greenhouse gas emissions, including those<br />
from l<strong>and</strong>-use change <strong>and</strong> forestry. Compilation of these data<br />
implies a l<strong>and</strong>-atmosphere flux of −0.6 PgC/yr for all Annex I<br />
countries, <strong>and</strong> −0.6 PgC/yr for Annex I countries in the northern<br />
latitudes only (UNFCCC, 2000). While the TBFRA synthesised
<strong>The</strong> <strong>Carbon</strong> <strong>Cycle</strong> <strong>and</strong> <strong>Atmospheric</strong> <strong>Carbon</strong> <strong>Dioxide</strong><br />
country statistics <strong>and</strong> adjusted data to fit FAO definitions <strong>and</strong><br />
methodologies for calculating carbon stocks, the UNFCCC<br />
report summarises emissions data reported by each country<br />
according to IPCC guidelines; interpretation of guidelines is<br />
variable, <strong>and</strong> not all countries had reported data on l<strong>and</strong> use. <strong>The</strong><br />
implications of definitions <strong>and</strong> methodologies in calculating<br />
carbon fluxes, particularly in relation to implementation of the<br />
Kyoto Protocol, is discussed in detail in the SRLULUCF (IPCC,<br />
2000a).<br />
A recent compilation of data from 478 permanent plots in<br />
mature tropical moist forests throughout the tropics over at least<br />
two decades found these were taking up carbon due to increasing<br />
rates of tree growth. Extrapolation from these plots led to an<br />
estimated l<strong>and</strong>-atmosphere flux of (0.6 ± 0.3 PgC/yr in Latin<br />
America; growth trends in African <strong>and</strong> Asian forests were not<br />
significantly different from zero (Phillips et al., 1998). This net<br />
uptake is offset by emissions due to deforestation. Dixon et al.<br />
(1994) estimated tropical forests overall to be a net source of<br />
carbon with a l<strong>and</strong>-atmosphere flux 1.7 ± 0.4, based mostly on<br />
FAO (1993b) inventory data <strong>and</strong> simple models of the effect of<br />
l<strong>and</strong>-use change (Houghton, 1995). It will not be possible to<br />
assess trends <strong>and</strong> fluxes for the 1990s in the tropics from<br />
inventory data until a full data set is available from the FAO<br />
Global Forest Resources Assessment 2000. Among those<br />
countries that have reported l<strong>and</strong>-use emissions data to the<br />
UNFCCC, there are significant discrepancies between the<br />
primary data used in emissions inventories <strong>and</strong> the data available<br />
in international surveys; for example, rates of deforestation differ<br />
from rates reported by FAO (1993b) by as much as a factor of six<br />
(Houghton <strong>and</strong> Ramakrishna, 1999).<br />
<strong>The</strong> results of globally aggregated forest inventories show a<br />
greater uptake of carbon in forest growth than model-based<br />
calculations of the marginal effects of l<strong>and</strong>-use change (e.g.,<br />
Houghton, 2000). Thus, inventory studies provide independent<br />
evidence for the existence of a residual terrestrial sink; <strong>and</strong> they<br />
show that a substantial part of this sink, at least, is located in<br />
northern extratropical <strong>and</strong> tropical forests. Additional evidence<br />
from individual inventory studies in mature forests that have not<br />
undergone l<strong>and</strong>-use changes shows that carbon stocks in such<br />
forests are increasing (e.g., Lugo <strong>and</strong> Brown, 1993; Phillips et<br />
al., 1998; Schulze et al., 1999). <strong>The</strong> difference between the<br />
northern extra-tropical l<strong>and</strong>-atmosphere flux of around −0.8<br />
PgC/yr calculated by inventories (TBFRA-2000) <strong>and</strong> that of −<br />
0.1 PgC/yr from l<strong>and</strong>-use statistics (Houghton, 2000), both for<br />
the early 1990s, implies a residual terrestrial sink on the order<br />
of −0.7 PgC/yr in northern mid- <strong>and</strong> high latitudes. Combining<br />
this with the estimated sink of −0.6 PgC/yr in mature tropical<br />
moist forests (Phillips et al., 1998) makes it plausible that at<br />
least a significant fraction of the current global terrestrial sink<br />
(Table 3.1) could be explained by an increase of carbon stocks<br />
in extant forests. <strong>The</strong> inventory-based estimate of l<strong>and</strong>atmosphere<br />
flux in northern forests (−0.8 PgC/yr) is at the<br />
positive end of the range calculated by inverse modelling studies<br />
for the >30°N latitude b<strong>and</strong> from 1990 to 1996 (−1.8 to −0.7<br />
PgC/yr, Section 3.5.3), either because of biases in inverse<br />
modelling that might tend to increase apparent uptake in the<br />
north (Section 3.5.3), or because possible sinks in other ecosys-<br />
tems (e.g., temperate grassl<strong>and</strong> soils) have not been considered<br />
in the inventories. In the tropics, the difference between the<br />
uptake of carbon estimated by inventory studies in mature<br />
forests of Latin America (−0.6 PgC/yr) (Phillips et al., 1998)<br />
<strong>and</strong> the estimated emissions due to deforestation in the tropics<br />
of 1.7 PgC/yr (Houghton, 2000) yields an estimated l<strong>and</strong>atmosphere<br />
flux of 1.1 PgC/yr, which is at the positive end of<br />
the range calculated by inverse modelling studies for 30°S to<br />
30°N (−1.3 to +1.1 PgC/yr, Section 3.5.3). Again, it should be<br />
noted that possible additional sinks (e.g., in savannas) are<br />
neglected by the l<strong>and</strong>-use <strong>and</strong> inventory-based calculations.<br />
3.6 <strong>Carbon</strong> <strong>Cycle</strong> Model Evaluation<br />
3.6.1 Terrestrial <strong>and</strong> Ocean Biogeochemistry Models<br />
213<br />
<strong>The</strong> interactions of complex processes as discussed in Section 3.2<br />
can be analysed with models that incorporate current knowledge<br />
at the process level, including syntheses of experimental results.<br />
Process-based models make it possible to explore the potential<br />
consequences of climate variability for the global carbon cycle,<br />
<strong>and</strong> to project possible future changes in carbon cycling associated<br />
with changes in atmospheric <strong>and</strong> ocean circulation. Models<br />
can be run with prescribed inputs such as observations of surface<br />
climate <strong>and</strong> CO 2 or the output of climate models. <strong>The</strong>y can also<br />
be coupled to atmospheric general circulation models (Cox et al.,<br />
2000; Friedlingstein et al., 2000), to allow simulation of a wider<br />
range of interactions between climate <strong>and</strong> the carbon cycle.<br />
Process-based terrestrial models used in carbon cycle studies<br />
are (a) terrestrial biogeochemical models (TBMs), which<br />
simulate fluxes of carbon, water <strong>and</strong> nitrogen coupled within<br />
terrestrial ecosystems, <strong>and</strong> (b) dynamic global vegetation models<br />
(DGVMs), which further couple these processes interactively<br />
with changes in ecosystem structure <strong>and</strong> composition (competition<br />
among different plant functional types; Prentice et al., 2000).<br />
<strong>The</strong> treatment of carbon-nutrient interaction varies widely; for<br />
example, some models treat nitrogen supply explicitly as a<br />
constraint on NPP, while others do not. <strong>The</strong>re are currently about<br />
30 TBMs <strong>and</strong>
214 <strong>The</strong> <strong>Carbon</strong> <strong>Cycle</strong> <strong>and</strong> <strong>Atmospheric</strong> <strong>Carbon</strong> <strong>Dioxide</strong><br />
current models, the uptake of anthropogenic CO 2 is controlled<br />
mainly by physical transport <strong>and</strong> surface carbon chemistry,<br />
whereas the natural carbon cycle is controlled by physical,<br />
chemical <strong>and</strong> biological processes. <strong>The</strong> Ocean <strong>Carbon</strong> <strong>Cycle</strong><br />
Model Intercomparison Project (OCMIP) compared the performance<br />
of four ocean models with respect to natural <strong>and</strong> anthropogenic<br />
tracers (Sarmiento et al., 2000; Orr et al., 2001), <strong>and</strong> is<br />
currently undergoing a similar comparison with 13 models <strong>and</strong><br />
an extended data set (Orr <strong>and</strong> Dutay, 1999).<br />
3.6.2 Evaluation of Terrestrial Models<br />
Evaluation of terrestrial carbon cycle models requires different<br />
types of data to test processes operating on a range of time-scales<br />
from hours to centuries (see Section 3.2.2), including short-term<br />
environmental responses of CO 2 <strong>and</strong> water fluxes between<br />
vegetation canopies <strong>and</strong> the atmosphere (e.g., Cienciala et al.,<br />
1998), responses of ecosystem carbon balance to interannual<br />
climate variability (e.g. Kindermann et al., 1996; Heimann et al.,<br />
1997; Gérard et al., 1999; Knorr, 2000; Prentice et al., 2000), <strong>and</strong><br />
longer-term consequences of historical l<strong>and</strong>-use change<br />
(McGuire et al., 2001). Differences <strong>and</strong> uncertainties in model<br />
behaviour have been evaluated through model intercomparison<br />
(Cramer et al., 1999, 2001) <strong>and</strong> sensitivity analyses (Knorr, 2000;<br />
Knorr <strong>and</strong> Heimann, 2001a).<br />
3.6.2.1 Natural carbon cycling on l<strong>and</strong><br />
Terrestrial model evaluation has traditionally been carried out as<br />
comparisons with in situ field observations of ecosystem<br />
variables (e.g., Raich et al., 1991; Foley, 1994; Haxeltine <strong>and</strong><br />
Prentice, 1996). <strong>The</strong> largest data sets of relevant field measurements<br />
are for NPP <strong>and</strong> soil carbon content. Other “target”<br />
variables include soil moisture, nitrogen mineralisation rate,<br />
<strong>and</strong> the amounts of carbon <strong>and</strong> nitrogen in different compartments<br />
of the ecosystem. Such comparisons have generally<br />
shown reasonable agreement between observed <strong>and</strong> modelled<br />
geographic patterns of these variables, but they do not test the<br />
time-dependent response of models to environmental<br />
variability.<br />
Time-dependent data sets for in situ comparisons are now<br />
becoming available, thanks to eddy-covariance measurements<br />
of CO 2 fluxes (Section 3.2.2.1; Box 3.1). Daily <strong>and</strong> seasonal<br />
cycles of CO 2 <strong>and</strong> water fluxes provide a test of the coupling<br />
between the carbon <strong>and</strong> hydrological cycles as simulated by<br />
terrestrial models (Cienciala et al., 1998). Flux measurements<br />
are now being carried out on a multi-annual basis at an<br />
increasing number of stations, although global coverage<br />
remains uneven, with the greatest concentration in Europe <strong>and</strong><br />
North America <strong>and</strong> few measurements from the tropics (see<br />
Box 3.1). Field campaigns have started to retrieve flux data<br />
from more remote regions (e.g., Schulze et al., 1999). <strong>The</strong><br />
Large-scale Biosphere Atmosphere Experiment in Amazonia,<br />
LBA, will yield more comprehensive data on the carbon, water<br />
<strong>and</strong> energy exchanges of tropical terrestrial ecosystems <strong>and</strong><br />
will allow a more rigorous evaluation of the performance of<br />
models in the tropics than has been possible up until now (e.g.,<br />
Tian et al., 1998). As current models show conflicting<br />
responses of global NPP to climate (Cramer et al., 1999),<br />
systematic comparisons with seasonal <strong>and</strong> interannual flux<br />
measurements are a priority to reduce uncertainties in terrestrial<br />
carbon modelling.<br />
Terrestrial models have also been evaluated at a global<br />
scale by comparing simulated ecosystem water balance with<br />
river runoff (e.g., Neilson <strong>and</strong> Marks, 1994; Foley et al., 1996;<br />
Kucharik et al., 2000), <strong>and</strong> simulated seasonal leaf area with<br />
satellite observations of “greenness”, often based on the<br />
normalised difference vegetation index (NDVI) (Field et al.,<br />
1995b; de Fries et al., 1995). NDVI data can be translated into<br />
estimates of the plant-absorbed fraction of incoming photosynthetically<br />
active radiation (FPAR) (Asrar et al, 1992),<br />
which is related to leaf area index (LAI). <strong>The</strong> first terrestrial<br />
model intercomparison showed differences among model<br />
simulations of LAI <strong>and</strong> its seasonality (Bondeau et al., 1999).<br />
More recently, it has been shown that constraining a terrestrial<br />
model with remotely sensed spatial patterns of FPAR can lead<br />
to a reduction of uncertainty in NPP simulations by about one<br />
third (Knorr <strong>and</strong> Heimann, 2001b). Agreement with patterns of<br />
remotely sensed FPAR has thus become a st<strong>and</strong>ard benchmark<br />
for terrestrial models (Haxeltine <strong>and</strong> Prentice, 1996; Kucharik<br />
et al., 2000) <strong>and</strong> attention has been focused on improving the<br />
simulation of LAI <strong>and</strong> its seasonal variations.<br />
A more direct test of the simulated net exchange of CO 2<br />
between the terrestrial biosphere <strong>and</strong> the atmosphere is<br />
provided by comparison with atmospheric CO 2 measurements<br />
at remote monitoring sites. <strong>The</strong> comparison requires the use of<br />
an atmospheric transport model to simulate CO 2 as a passive<br />
tracer (Kaminski et al., 1996). <strong>The</strong> seasonal cycle of<br />
atmospheric CO 2 shows a strong latitudinal pattern in<br />
amplitude <strong>and</strong> phase, <strong>and</strong> is dominated by the terrestrial<br />
biosphere (Heimann et al., 1998). <strong>The</strong> ability to simulate this<br />
seasonal cycle thus constitutes a benchmark for terrestrial<br />
models’ response to climate (Denning et al., 1996; Hunt et al.,<br />
1996; Heimann et al., 1998; Nemry et al., 1999). Generally,<br />
the observed seasonal cycles of CO 2 in northern <strong>and</strong> tropical<br />
latitudes can be well simulated, with terrestrial models using<br />
NDVI data as input (Knorr <strong>and</strong> Heimann, 1995), or by fully<br />
prognostic models, including DGVMs (Prentice et al., 2000).<br />
Major features of interannual variability of the CO 2<br />
increase are also simulated by terrestrial models (Kindermann<br />
et al., 1996; Heimann et al., 1997; Gérard et al., 1999; Ito <strong>and</strong><br />
Oikawa, 2000; Knorr, 2000; Prentice et al., 2000). This finding<br />
supports the hypothesis (Section 3.5.2) that terrestrial effects<br />
are important in determining the interannual variability of CO 2<br />
uptake. During typical El Niño events, terrestrial model results<br />
consistently show strongly reduced CO 2 uptake or CO 2 release<br />
by the l<strong>and</strong>. This result has been obtained with a range of<br />
models, even when the models differ substantially in the<br />
relative sensitivitivities of NPP <strong>and</strong> heterotrophic respiration to<br />
temperature (Heimann et al., 1997; Knorr, 2000). <strong>The</strong> low CO 2<br />
growth rate during the early 1990s has been simulated by some<br />
terrestrial models (Prentice et al., 2000; Knorr, 2000).<br />
At the longest time-scales of interest, spanning the<br />
industrial period, models of the natural terrestrial carbon cycle<br />
show a pronounced response to rising atmospheric CO 2 levels
PgC/yr<br />
PgC/yr<br />
<strong>The</strong> <strong>Carbon</strong> <strong>Cycle</strong> <strong>and</strong> <strong>Atmospheric</strong> <strong>Carbon</strong> <strong>Dioxide</strong><br />
3<br />
2<br />
1<br />
0<br />
−1<br />
−2<br />
−3<br />
−4<br />
3<br />
2<br />
1<br />
0<br />
−1<br />
−2<br />
−3<br />
3<br />
2<br />
1<br />
0<br />
−1<br />
PgC/yr −4<br />
−2<br />
−3<br />
a) Modelled net ocean uptake<br />
b) Modelled net terrestrial uptake<br />
c)<br />
Modelled CO2 releases<br />
from changes in l<strong>and</strong> use<br />
Modelled uptake resulting from<br />
rising CO 2 <strong>and</strong> climate variations<br />
CO 2 /O 2<br />
Budgets<br />
−4<br />
1900 1920 1940 1960 1980 2000<br />
Year<br />
CO 2 /O 2<br />
Budgets<br />
SRLULUCF<br />
AWI<br />
IGCR<br />
NCAR<br />
PIUB<br />
SOC<br />
IPSL<br />
PRINCE<br />
MPIM<br />
CSIRO<br />
LLNL<br />
LPJ<br />
HRBM<br />
TEM<br />
IBIS<br />
Houghton99<br />
LPJ<br />
HRBM<br />
TEM<br />
IBIS<br />
LPJ<br />
HRBM<br />
TEM<br />
IBIS<br />
Figure 3.8: Modelled fluxes of anthropogenic CO 2 over the past<br />
century. (a) Ocean model results from OCMIP (Orr <strong>and</strong> Dutay, 1999;<br />
Orr et al., 2000); (b), (c) terrestrial model results from CCMLP<br />
(McGuire et al., 2001). Positive numbers denote fluxes to the<br />
atmosphere; negative numbers denote uptake from the atmosphere.<br />
<strong>The</strong> ocean model results appear smooth because they contain no<br />
interannual variability, being forced only by historical changes in<br />
atmospheric CO 2. <strong>The</strong> results are truncated at 1990 because<br />
subsequent years were simulated using a CO 2 concentration scenario<br />
rather than actual measurements, leading to a likely overestimate of<br />
uptake for the 1990s. <strong>The</strong> terrestrial model results include effects of<br />
historical CO 2 concentrations, climate variations, <strong>and</strong> l<strong>and</strong>-use<br />
changes based on Ramankutty <strong>and</strong> Foley (2000). <strong>The</strong> results were<br />
smoothed using a 10-year running mean to remove short-term<br />
variability. For comparison, grey boxes denote observational<br />
estimates of CO 2 uptake by the ocean in panel (a) <strong>and</strong> by the l<strong>and</strong> in<br />
panel (b) (from Table 3.1). L<strong>and</strong>-use change flux estimates from<br />
Houghton et al. (1999) are shown by the black line in panel (c). <strong>The</strong><br />
grey boxes in panel (c) indicate the range of decadal average values<br />
for the l<strong>and</strong>-use change flux accepted by the SRLULUCF (Bolin et<br />
al., 2000) for the 1980s <strong>and</strong> for 1990 to 1995.<br />
215<br />
as a result of CO 2 fertilisation, generally larger than the NPP<br />
response to the climate change over this period (Kicklighter et<br />
al., 1999). According to CCMLP results, the CO 2 increase<br />
maintains a lead of NPP over Rh <strong>and</strong> an increase of the<br />
amplitude of the seasonal CO 2 cycle (McGuire et al., 2001),<br />
consistent with long-term observations (Keeling et al., 1996a),<br />
which indicate an increase in amplitude of about 20% since<br />
accurate atmospheric measurements began. However, the<br />
magnitude of this effect was greatly over- or under estimated by<br />
some models, reflecting unresolved differences in the parametrization<br />
of the CO 2 fertilisation response.<br />
3.6.2.2 Uptake <strong>and</strong> release of anthropogenic CO 2 by the l<strong>and</strong><br />
<strong>The</strong> most comprehensive model-based estimates of the terrestrial<br />
components of the anthropogenic CO 2 budget are those that have<br />
been produced by the CCMLP. McGuire et al. (2001) used two<br />
TBMs <strong>and</strong> two DGVMs driven by changes in atmospheric CO 2,<br />
then changes in CO 2 with historical changes in climate (from<br />
observations), <strong>and</strong> finally changes in CO 2 <strong>and</strong> climate with l<strong>and</strong>use<br />
change from Ramankutty <strong>and</strong> Foley (2000) (Figure 3.8; Table<br />
3.4). In these simulations, CO 2 fertilisation accounted for a l<strong>and</strong>atmosphere<br />
flux of −0.9 to −3.1 PgC/yr, l<strong>and</strong>-use change a<br />
positive flux of 0.6 to 1.0 PgC/yr, <strong>and</strong> climate variability a small<br />
additional effect of uncertain sign, −0.2 to 0.9 PgC/yr during the<br />
1980s. <strong>The</strong> total l<strong>and</strong>-atmosphere flux simulated for the 1980s<br />
amounted to −0.3 to −1.5 PgC/yr, which is consistent with or<br />
slightly more negative than the observationally-based estimate of<br />
−0.2 ± 0.7 PgC/yr (Table 3.1). Net uptake by all models reported<br />
in McGuire et al. (2001) is shown to be occurring mainly in<br />
tropical, temperate <strong>and</strong> boreal forests − consistent with forest<br />
inventory data (Section 3.5.4) – while some regions (notably<br />
semi-arid tropical <strong>and</strong> sub-tropical regions) show net carbon loss.<br />
<strong>The</strong> model estimates of the CO 2 source due to l<strong>and</strong>-use change<br />
are substantially smaller than the estimate of Houghton (1999)<br />
(Section 3.4.2). This divergence primarily reflects disagreements<br />
between the Houghton (1999) <strong>and</strong> Ramankutty <strong>and</strong> Foley (2000)<br />
data sets as to the timing of tropical deforestation in different<br />
regions (see Section 3.4.2).<br />
<strong>The</strong>re is no general agreement on how to model the linkage<br />
between reactive nitrogen deposition <strong>and</strong> vegetation productivity,<br />
<strong>and</strong> recent model estimates of the additional effect of<br />
anthropogenic nitrogen fertilisation on the global carbon cycle<br />
vary widely. <strong>The</strong> anthropogenic nitrogen input itself (Holl<strong>and</strong> et<br />
al., 1999), the fate of anthropogenic nitrogen in the ecosystem<br />
(Nadelhoffer et al., 1999; Jenkinson et al., 1999), <strong>and</strong> changes<br />
in ecosystem nitrogen fixation (Vitousek <strong>and</strong> Field, 1999)<br />
represent major sources of uncertainty. Estimates of the anthropogenic<br />
nitrogen effect range from −0.2 PgC/yr (Nadelhoffer et<br />
al., 1999) to −1.1 or −1.4 PgC/yr (Holl<strong>and</strong> et al., 1997). <strong>The</strong><br />
model with the smallest CO 2 fertilisation effect (−0.9 PgC/yr)<br />
in the McGuire et al. (2001) study has been shown to respond<br />
strongly to anthropogenic nitrogen input, yielding a combined<br />
(CO 2 <strong>and</strong> nitrogen) fertilisation effect of −1.5 PgC/yr. A<br />
modelling study by Lloyd (1999) suggests that CO 2 <strong>and</strong><br />
nitrogen fertilisation effects may by synergistic. Evaluation of<br />
model results on carbon-nitrogen coupling against experimental<br />
results is a current research focus.
216 <strong>The</strong> <strong>Carbon</strong> <strong>Cycle</strong> <strong>and</strong> <strong>Atmospheric</strong> <strong>Carbon</strong> <strong>Dioxide</strong><br />
3.6.3 Evaluation of Ocean Models<br />
Natural <strong>and</strong> anthropogenic tracers have been extensively<br />
measured, most recently as part of the Joint Global Ocean Flux<br />
Study (JGOFS) <strong>and</strong> World Ocean Circulation Experiment<br />
(WOCE). Because of these measurement campaigns, such tracers<br />
provide important opportunities to evaluate representations of<br />
ocean physics <strong>and</strong> biogeochemistry in models.<br />
3.6.3.1 Natural carbon cycling in the ocean<br />
Most global ocean models of the carbon cycle are successful in<br />
reproducing the main vertical <strong>and</strong> horizontal features of ocean<br />
carbon content (Maier-Reimer, 1993; Aumont, 1998; Murnane et<br />
al., 1999). <strong>The</strong> observed features reasonably reproduced by all<br />
ocean models are the mean vertical gradient in DIC, with enriched<br />
deep ocean concentrations (Goyet <strong>and</strong> Davies, 1997), <strong>and</strong> the<br />
spatial patterns of surface pCO 2 with outgassing in the tropics <strong>and</strong><br />
uptake at higher latitudes (Takahashi et al., 1999). Furthermore,<br />
models which incorporate marine biology (including DOC <strong>and</strong><br />
plankton dynamics) roughly reproduce the seasonal cycle of<br />
surface ocean pCO 2, atmospheric O 2 after it has been corrected for<br />
seasonal l<strong>and</strong> variability, <strong>and</strong> surface chlorophyll (Six <strong>and</strong> Maier-<br />
Reimer, 1996; Stephens et al., 1998; Aumont et al., 2001a). Ocean<br />
carbon models can also roughly reproduce the phase <strong>and</strong><br />
amplitude of interannual variability of ocean pCO 2 in the<br />
equatorial Pacific (Winguth et al., 1994; Le Quéré et al., 2000)<br />
in agreement with available observations (Feely et al., 1997;<br />
1999b; Boutin et al., 1999).<br />
Although many first-order features can be reproduced by<br />
global models, there are still important aspects of the ocean<br />
carbon cycle that are not well simulated, because either marine<br />
biology or ocean physics are imperfectly reproduced. Ocean<br />
carbon models have difficulties in reproducing the spatial<br />
structure of the deep ocean 14 C (Orr et al., 2001), which suggests<br />
problems in simulating the physical exchange of carbon between<br />
surface <strong>and</strong> the deep ocean. Models display their largest<br />
disagreements where fewest observations exist, in particular in<br />
the important region of the Southern Ocean where the mixing of<br />
tracers is subject to large uncertainties (Caldeira <strong>and</strong> Duffy,<br />
2000; Sarmiento et al., 2000; Orr et al., 2001). In spite of these<br />
differences, all ocean carbon models estimate zero interhemispheric<br />
transport of carbon (Sarmiento et al., 2000) whereas a<br />
transport as large as 1 PgC/yr has been inferred from<br />
atmospheric CO 2 measurements (Keeling et al., 1989).<br />
Consideration of the global transport of carbon by rivers reduces<br />
the discrepancy but does not remove it (Sarmiento <strong>and</strong><br />
Sundquist, 1992; Aumont et al., 2001b). <strong>Atmospheric</strong> CO 2 <strong>and</strong><br />
O 2 measurements suggest that interhemispheric transport may<br />
be incorrectly simulated by ocean models (Stephens et al.,<br />
1998), <strong>and</strong> could hint at difficulties in modelling heat transport<br />
(Murnane et al., 1999). Recent data from the Southern Ocean,<br />
however, seem closer to model results (Stephens, 1999) <strong>and</strong> the<br />
question about interhemispheric transport thus remains open.<br />
<strong>The</strong>se problems could partly be resolved by a better representation<br />
of the physical transport of carbon in the ocean, especially<br />
isopycnal diffusion, sub-grid eddy mixing, <strong>and</strong> sea-ice formation<br />
(Stephens et al., 1999).<br />
Three common problems related to marine biology in global<br />
ocean models are discussed here. First, most models poorly<br />
represent the formation <strong>and</strong> dissolution of CaCO 3, which controls<br />
alkalinity. This process is often parameterized as a function of<br />
direct or indirect observations (salinity, temperature, nutrients).<br />
Although correct for the present day ocean, this parametrisation<br />
may not hold for past or future conditions with different ocean<br />
circulation <strong>and</strong> surface water fluxes. <strong>The</strong> alkalinity cycle is difficult<br />
to represent because the rate of CaCO 3 formation derived from<br />
observations is consistently larger than the one required by models<br />
for reproducing observed deep ocean alkalinity (Maier-Reimer,<br />
1993; Yamanaka <strong>and</strong> Tajika, 1996). Second, marine productivity<br />
tends to be underestimated by models in sub-tropical regions <strong>and</strong><br />
overestimated in the equatorial oceans <strong>and</strong> at high latitudes in the<br />
North Pacific <strong>and</strong> Southern Oceans. <strong>The</strong> overestimation may be<br />
caused by limitation in plankton growth by iron (Coale et al.,<br />
1996; Boyd et al., 2000; Archer <strong>and</strong> Johnson, 2000), while underestimation<br />
in the sub-tropics partly stems from neglecting<br />
mesoscale variability (McGillicuddy <strong>and</strong> Robinson, 1997; Oschlies<br />
<strong>and</strong> Garçon, 1998). <strong>The</strong> remaining discrepancies might be attributed<br />
in part to more complex processes involving nitrogen fixation<br />
(Karl et al., 1997). Finally, the tight coupling between carbon <strong>and</strong><br />
either nitrogen or phosphate, which is generally implicit in ocean<br />
carbon models, precludes the simulation of past or future marine<br />
biological feedback mechanisms that involve a partial decoupling<br />
between carbon <strong>and</strong> nutrients (see Section 3.2.3).<br />
3.6.3.2 Uptake of anthropogenic CO 2 by the ocean<br />
Ocean uptake is constrained to some degree by observations of<br />
anthropogenic tracers. Three transient tracers are commonly used.<br />
First, anthropogenic CO 2 itself gives a direct benchmark for model<br />
estimates of the quantity <strong>and</strong> distribution of anthropogenic CO 2 that<br />
has penetrated the ocean since the pre-industrial era. Anthropogenic<br />
CO 2 can be inventoried by an indirect method whereby carbon<br />
concentration is compared to what would be expected from water<br />
exposed to pre-industrial air (Gruber et al., 1996). <strong>The</strong> 14 CO 2<br />
released in the early 1960s by atmospheric nuclear testing<br />
(commonly called bomb 14 C) provides a second tracer; the content<br />
of bomb 14 C in the ocean is used to constrain global air-sea CO 2<br />
exchange (Wanninkhof et al., 1992), <strong>and</strong> ocean model results can<br />
be compared with its penetration depth as a benchmark for vertical<br />
transport (Broecker et al., 1995). Bomb 14 C is computed by<br />
subtracting the observed 14 C concentration from an estimate of its<br />
pre-industrial value (Broecker et al., 1995). Finally, CFCs also<br />
constrain the downward transport of tracers in ocean models. No<br />
natural background needs to be subtracted from CFCs. None of<br />
these three tracers provide a perfect indicator of anthropogenic CO 2<br />
uptake: CO 2 equilibrates with the atmosphere ten times faster than<br />
14 C <strong>and</strong> ten times slower than CFCs; anthropogenic CO2 <strong>and</strong> 14 C<br />
are indirectly estimated. As part of the Ocean <strong>Carbon</strong>-<strong>Cycle</strong> Model<br />
Intercomparison Project (OCMIP), a comparison of carbon models<br />
with respect to all three anthropogenic tracers is in progress (Orr<br />
<strong>and</strong> Dutay, 1999; Orr et al., 2001).<br />
Although regional estimates show discrepancies, modelled<br />
estimates of anthropogenic tracers agree reasonably well with<br />
observations when integrated globally. <strong>The</strong> mean value of the<br />
penetration depth of bomb 14 C for all observational sites during
<strong>The</strong> <strong>Carbon</strong> <strong>Cycle</strong> <strong>and</strong> <strong>Atmospheric</strong> <strong>Carbon</strong> <strong>Dioxide</strong><br />
Depth (m)<br />
Depth (m)<br />
0<br />
1000<br />
2000<br />
3000<br />
4000<br />
5000<br />
6000<br />
0<br />
1000<br />
2000<br />
3000<br />
4000<br />
5000<br />
6000<br />
135°E 180° 135°W 90°W 45°W 0° 45°E 90°E<br />
10<br />
10<br />
10<br />
5<br />
5<br />
20<br />
20<br />
30<br />
5<br />
10<br />
5<br />
5<br />
5<br />
1<br />
5<br />
5<br />
1 1<br />
the late 1970s is 390 ± 39 m (Broecker et al., 1995). For the same<br />
years <strong>and</strong> stations, modelled estimates range between 283 <strong>and</strong><br />
376 m (Orr et al., 2001). Modelled <strong>and</strong> observed CFC concentrations<br />
have been compared locally but not yet globally<br />
(Engl<strong>and</strong> 1995; Robitaille <strong>and</strong> Weaver, 1995; Orr <strong>and</strong> Dutay,<br />
1999). Modelled anthropogenic CO 2 inventory since 1800 is<br />
5<br />
60°S 30°S 0° 30°N 60°N<br />
40<br />
5<br />
30<br />
5<br />
5<br />
10<br />
20<br />
10<br />
20<br />
20<br />
MPI<br />
60°S 30°S 0°<br />
Latitude<br />
30°N 60°N<br />
1<br />
5<br />
10<br />
5<br />
1<br />
20<br />
20<br />
30<br />
Princeton<br />
› GFDL<br />
30<br />
20<br />
3<br />
45°N<br />
0°<br />
45°S<br />
60<br />
50<br />
40<br />
30<br />
20<br />
10<br />
5<br />
1<br />
60<br />
50<br />
40<br />
30<br />
20<br />
10<br />
5<br />
1<br />
Depth (m)<br />
Depth (m)<br />
Depth (m)<br />
0<br />
1000<br />
2000<br />
3000<br />
4000<br />
5000<br />
6000<br />
0<br />
1000<br />
2000<br />
3000<br />
4000<br />
5000<br />
6000<br />
0<br />
1000<br />
2000<br />
3000<br />
4000<br />
5000<br />
6000<br />
20<br />
30<br />
1 1<br />
5<br />
10<br />
5<br />
10<br />
5<br />
10<br />
20<br />
40<br />
1<br />
10<br />
217<br />
comparable to the estimate of 40 ± 9 PgC for the Atlantic Ocean<br />
(Gruber, 1998) <strong>and</strong> 20 ± 3 PgC for the Indian Ocean (Sabine et<br />
al., 1999; Orr et al., 2001). Latitude-depth profiles of anthropogenic<br />
CO 2 in the Atlantic, extracted from data <strong>and</strong> from<br />
models, are shown in Figure 3.9. Modelled CO 2 uptake for the<br />
global ocean between 1800 <strong>and</strong> 1990 ranges between 100 <strong>and</strong><br />
1<br />
60°S 30°S 0°<br />
Latitude<br />
30°N 60°N<br />
5<br />
5<br />
30<br />
5<br />
1<br />
1<br />
20<br />
10<br />
30<br />
5<br />
1<br />
10<br />
40<br />
10<br />
5<br />
20<br />
20 20<br />
20<br />
1<br />
10<br />
30<br />
DATA<br />
30<br />
Hadley<br />
60°S 30°S 0°<br />
Latitude<br />
30°N 60°N<br />
30<br />
10<br />
IPSL<br />
60°S 30°S 0°<br />
Latitude<br />
30°N 60°N<br />
Figure 3.9: Anthropogenic CO 2 in the Atlantic Ocean (µmol/kg): comparison of data <strong>and</strong> models. <strong>The</strong> top left panel shows the sampling transect;<br />
the top right panel shows estimates of anthropogenic CO 2 content along this transect using observations from several cruises between 1981 <strong>and</strong><br />
1989 (Gruber, 1998). Anthropogenic CO 2 is not measured directly but is separated from the large background of oceanic carbon by an indirect<br />
method based on observations (Gruber et al., 1996). <strong>The</strong> remaining panels show simulations of anthropogenic CO 2 content made with four ocean<br />
carbon models forced by the same atmospheric CO 2 concentration history (Orr et al., 2000).<br />
60<br />
50<br />
40<br />
30<br />
20<br />
10<br />
5<br />
1<br />
60<br />
50<br />
40<br />
30<br />
20<br />
10<br />
5<br />
1<br />
60<br />
50<br />
40<br />
30<br />
20<br />
10<br />
5<br />
1
218 <strong>The</strong> <strong>Carbon</strong> <strong>Cycle</strong> <strong>and</strong> <strong>Atmospheric</strong> <strong>Carbon</strong> <strong>Dioxide</strong><br />
133 PgC (Figure 3.8), comparable to the preliminary data-based<br />
estimate of 107 ± 27 PgC for the global ocean, which includes<br />
the Pacific value of 45 ± 15 PgC (Feely et al., 1999a). Although<br />
in reasonable agreement with basin <strong>and</strong> global estimates of<br />
anthropogenic CO 2, modelled inventories exhibit large differences<br />
at the regional scale: models tend to underestimate the<br />
inventory of anthropogenic CO 2 between 50°S <strong>and</strong> 50°N in the<br />
Atlantic <strong>and</strong> Indian Oceans, <strong>and</strong> to overestimate it at high<br />
latitudes (Sabine et al., 1999; Orr et al., 2001). In the Southern<br />
Ocean the uptake of anthropogenic CO 2 varies by a factor of two<br />
among models (Orr et al., 2001). <strong>The</strong> difficulty for models in<br />
reproducing the spatial structure of anthropogenic tracers may<br />
be indicative of problems in ocean physics mentioned earlier,<br />
<strong>and</strong> may be responsible for the increasing range of model<br />
estimates when future CO 2 uptake is projected by the same<br />
models (Figure 3.10c).<br />
CO 2 flux to atmosphere (PgC/yr)<br />
CO 2 flux to atmosphere (PgC/yr)<br />
4<br />
2<br />
0<br />
−2<br />
−4<br />
−6<br />
−8<br />
−10<br />
−12<br />
4<br />
2<br />
0<br />
−2<br />
−4<br />
−6<br />
−8<br />
−10<br />
−12<br />
a) Terrestrial models: CO 2 only<br />
Hybrid<br />
LPJ<br />
IBIS<br />
SDGVM<br />
VECODE<br />
TRIFFID<br />
c) Ocean models: CO 2 only<br />
IPSL<br />
PRINCE<br />
MPIM<br />
CSIRO<br />
LLNL<br />
AWI<br />
IGCR<br />
NCAR<br />
PIUB<br />
SOC<br />
1850 1900 1950 2000 2050 2100<br />
Year<br />
<strong>The</strong> most recent model estimates of the ocean-atmosphere flux<br />
obtained with process-based models are −1.5 to −2.2 for 1980 to<br />
1989 (Table 3.4), in agreement with earlier model estimates for the<br />
same period (Enting et al., 1994; Orr et al., 2001). <strong>The</strong>se estimates<br />
are fully consistent with the budget based on atmospheric observations<br />
alone (Table 3.1), with estimates based on pCO 2 <strong>and</strong> δ 13 C<br />
observations (Table 3.4), <strong>and</strong> with the SAR estimate of −2.0 ± 0.8<br />
PgC/yr. Figure 3.8 shows modelled ocean CO 2 uptake for 1900 to<br />
2000. (<strong>The</strong>se results do not include natural variability <strong>and</strong> therefore<br />
appear smoother than in reality.) <strong>The</strong> oceanic regions absorbing the<br />
largest quantities of anthropogenic CO 2 according to models are<br />
those where older waters come in contact with the atmosphere,<br />
such as high latitudes <strong>and</strong> upwelling regions of the equator. In<br />
contrast, modelled sub-tropical regions rapidly saturate at<br />
atmospheric CO 2 level <strong>and</strong> do not absorb large quantities of anthropogenic<br />
CO 2 (Sarmiento et al., 1992; Orr et al., 2001).<br />
b) Terrestrial models: CO 2 <strong>and</strong> Climate<br />
Hybrid<br />
LPJ<br />
IBIS<br />
SDGVM<br />
VECODE<br />
TRIFFID<br />
range of Terrestrial models: CO2 only (panel a)<br />
d) Ocean models: CO 2 <strong>and</strong> Climate<br />
mean of Ocean models: CO 2 only (panel c)<br />
PIUB<br />
MPIM<br />
IPSL<br />
CSIRO<br />
PRINCE-1<br />
PRINCE-2<br />
1900 1950 2000 2050 2100<br />
Figure 3.10: Projections of anthropogenic CO 2 uptake by process-based models. Six dynamic global vegetation models were run with IS92a CO 2<br />
concentrations as given in the SAR: (a) CO 2 only, <strong>and</strong> (b) with these CO 2 concentrations plus simulated climate changes obtained from the Hadley<br />
Centre climate model with CO 2 <strong>and</strong> sulphate aerosol forcing from IS92a (Cramer et al., 2000). Panel (b) also shows the envelope of the results from<br />
panel (a) (in grey). (c) Ten process-based ocean carbon models were run with the same CO 2 concentrations, assuming a constant climate (Orr <strong>and</strong><br />
Dutay, 1999; Orr et al., 2000). A further six models were used to estimate the climate change impact on ocean CO 2 uptake as a proportional change<br />
from the CO 2-only case. <strong>The</strong> resulting changes were imposed on the mean trajectory of the simulations shown in panel (c), shown by the black line<br />
in panel (d), yielding the remaining trajectories in panel (d). <strong>The</strong> range of model results in panel (d) thus represents only the climate change impact<br />
on CO 2 uptake; the range does not include the range of representations of ocean physical transport, which is depicted in panel (c).<br />
Year
<strong>The</strong> <strong>Carbon</strong> <strong>Cycle</strong> <strong>and</strong> <strong>Atmospheric</strong> <strong>Carbon</strong> <strong>Dioxide</strong><br />
3.7 Projections of CO 2 Concentration <strong>and</strong> their Implications<br />
3.7.1 Terrestrial <strong>Carbon</strong> Model Responses to Scenarios of<br />
Change in CO 2 <strong>and</strong> Climate<br />
Possible feedbacks from terrestrial carbon cycling to<br />
atmospheric CO 2 were assessed using multiple models by<br />
Cramer et al. (2001). Six DGVMs (Figure 3.10a) (Foley et al.,<br />
1996; Brovkin et al., 1997; Friend et al., 1997; Woodward et<br />
al., 1998; Huntingford et al., 2000; Sitch, 2000) were driven<br />
first by CO 2 concentrations derived from the IS92a emissions<br />
scenario as in the SAR, <strong>and</strong> then with CO 2 changes plus climate<br />
changes derived from the HadCM2 coupled ocean-atmosphere<br />
general circulation model simulation including sulphate aerosol<br />
effects as described by Mitchell et al. (1995). Except for one<br />
empirical model (VECODE; Brovkin et al., 1997), the models<br />
included explicit representation of all the following processes:<br />
the CO 2 fertilisation effect on NPP (modelled explicitly in<br />
terms of photosynthesis, respiration, <strong>and</strong> feedbacks associated<br />
with carbon allocation); responses of NPP to climate specific to<br />
each plant functional type (PFT); competition among PFTs for<br />
light <strong>and</strong> water; dynamic shifts in vegetation structure due to<br />
climate <strong>and</strong> CO 2 effects; competitive limits to above-ground<br />
biomass; natural disturbance regimes <strong>and</strong> their interaction with<br />
PFT composition; soil temperature <strong>and</strong> moisture effects on<br />
heterotrophic respiration. Two models include an interactive N<br />
cycle. L<strong>and</strong> use <strong>and</strong> anthropogenic N deposition were not<br />
considered.<br />
Driven by increases in CO 2 beyond the present day, the<br />
modelled sink due to CO 2 fertilisation continued to increase. By<br />
the middle of the 21st century the simulated l<strong>and</strong>-atmosphere<br />
flux due to CO 2 was in the range −8.7 to −3.6 PgC/yr. Beyond<br />
mid-century the rate of increase became less, due to the<br />
declining photosynthetic response to CO 2. When the climate<br />
change scenario was included as well as the CO 2 increase,<br />
modelled uptake was reduced compared with the CO 2-only<br />
analysis. At mid-century, climate change reduced the uptake by<br />
21 to 43%. A marked decline in terrestrial uptake after the midcentury<br />
was seen in two models, <strong>and</strong> one model had zero terrestrial<br />
uptake by 2100. By 2100 the range of model estimates of<br />
the l<strong>and</strong>-atmosphere flux had widened to −6.7 to +0.4 PgC/yr.<br />
Increasing heterotrophic respiration in response to warming<br />
(Cao <strong>and</strong> Woodward, 1998a,b; Cramer et al., 2001) was a<br />
common factor (but not the only one) leading to reduced l<strong>and</strong><br />
uptake. <strong>The</strong> differences among the modelled climate responses<br />
were largely due to unresolved discrepancies in the response of<br />
global NPP to temperature. <strong>The</strong> balance of positive versus<br />
negative regional effects of climate change on NPP was<br />
estimated differently by these models, to the extent that the sign<br />
of the global response of NPP to climate change alone was not<br />
consistent. In addition, one model simulated a partial replacement<br />
of the Amazon rainforest by C 4 grassl<strong>and</strong>. This response<br />
was not shown, or occurred on a much smaller scale, in the<br />
other models. <strong>The</strong> details of this modelling exercise are presumably<br />
dependent on sensitivity of the particular climate model,<br />
<strong>and</strong> regional aspects of the simulated climate change (Cramer et<br />
al., 2001).<br />
219<br />
3.7.2 Ocean <strong>Carbon</strong> Model Responses to Scenarios of Change<br />
in CO 2 <strong>and</strong> Climate<br />
Analogous simulations have been performed with several ocean<br />
carbon models (Figure 3.10c,d). To compute the impact of<br />
increasing CO 2 alone (no climate change), OCMIP models were<br />
forced to follow the atmospheric CO 2 concentration derived from<br />
the IS92a scenario as in the DGVM experiment (Figure 3.10a,b)<br />
(Orr <strong>and</strong> Dutay, 1999). All models agreed in projecting that the<br />
annual ocean-atmosphere flux of CO 2 continues to become<br />
larger, reaching −6.7 to −4.5 PgC/yr by 2100 (Figure 3.10c).<br />
Since surface conditions (temperature, wind speed, alkalinity)<br />
were prescribed, the range in model estimates stems only from<br />
different representations of physical transport processes.<br />
Several atmosphere-ocean models were used to project the<br />
effect of climate change (Maier-Reimer et al., 1996; Sarmiento et<br />
al., 1998; Matear <strong>and</strong> Hirst, 1999; Joos et al., 1999b; Bopp et al.,<br />
2001). <strong>The</strong>se models include most processes previously<br />
discussed, including all processes associated with carbonate<br />
chemistry <strong>and</strong> gas exchange, physical <strong>and</strong> biological transport of<br />
CO 2, <strong>and</strong> changes in temperature, salinity, wind speed, <strong>and</strong> ice<br />
cover. <strong>The</strong>y account for simple changes in biological productivity,<br />
but not for changes in external nutrient supply, species<br />
composition, pH, or Redfield ratios, all of which could be<br />
involved in more complex biological feedbacks. Coupled models<br />
estimate the impact of climate change as a departure, reported in<br />
per cent, from a “control” experiment modelling the effect of<br />
increasing atmospheric CO 2 alone.<br />
In climate change simulations, warming of surface waters <strong>and</strong><br />
increased stratification of the upper ocean produced an overall<br />
positive feedback that reduced the accumulated ocean uptake of<br />
CO 2 by 6 to 25% between 1990 <strong>and</strong> the middle of the 21st<br />
century, as compared with the CO 2-only case. In the first part of<br />
the simulation, the climate-mediated feedback is mainly due to<br />
the temperature effect on CO 2 solubility (Sarmiento <strong>and</strong> Le<br />
Quéré, 1996; Matear <strong>and</strong> Hirst, 1999). Towards the mid-century,<br />
the impact of circulation changes becomes significant in most<br />
models, with the net effect of further reducing ocean CO 2 uptake.<br />
To investigate the effect of climate change on the IS92a scenario,<br />
the average of the OCMIP CO 2-only projections (mean of results<br />
in Figure 3.10c) was used as a baseline <strong>and</strong> the reduction in<br />
atmosphere-ocean CO 2 flux caused by climate change (in per<br />
cent since the beginning of the simulation) was applied to this<br />
curve (Figure 3.10d). <strong>The</strong> range in model results (Figure 3.10d)<br />
must be attributed to uncertainties related to climate change<br />
feedback, <strong>and</strong> not to uncertainties in the modelling of physical<br />
transport as shown in Figure 3.10c.<br />
<strong>The</strong> range of model estimates of the climate change impact is<br />
dependent on the choice of scenario for atmospheric CO 2 <strong>and</strong> on<br />
assumptions concerning marine biology (Joos et al., 1999b). At<br />
high CO 2 concentrations, marine biology can have a greater<br />
impact on atmospheric CO 2 than at low concentrations because<br />
the buffering capacity of the ocean is reduced (see Box 3.3)<br />
(Sarmiento <strong>and</strong> Le Quéré, 1996). Although the impact of changes<br />
in marine biology is highly uncertain <strong>and</strong> many key processes<br />
discussed in Section 3.2.3.1 are not included in current models,<br />
sensitivity studies can provide approximate upper <strong>and</strong> lower
220 <strong>The</strong> <strong>Carbon</strong> <strong>Cycle</strong> <strong>and</strong> <strong>Atmospheric</strong> <strong>Carbon</strong> <strong>Dioxide</strong><br />
bounds for the potential impact of marine biology on future<br />
ocean CO 2 uptake. A sensitivity study of two extreme scenarios<br />
for nutrient supply to marine biology gave a range of 8 to 25%<br />
for the reduction of CO 2 uptake by mid-century (Sarmiento et al.,<br />
1998). This range is comparable to other uncertainties, including<br />
those stemming from physical transport (Figure 3.10c).<br />
3.7.3 Coupled Model Responses <strong>and</strong> Implications for Future<br />
CO 2 Concentrations<br />
<strong>Carbon</strong> cycle models have indicated the potential for climate<br />
change to influence the rate of CO 2 uptake by both l<strong>and</strong> (Section<br />
3.7.1) <strong>and</strong> oceans (Section 3.7.2) <strong>and</strong> thereby influence the time<br />
course of atmospheric CO 2 concentration for any given emissions<br />
scenario. Coupled models are required to quantify these effects.<br />
Two general circulation model simulations have included<br />
interactive l<strong>and</strong> <strong>and</strong> ocean carbon cycle components (Cox et al.,<br />
2000; Friedlingstein et al., 2001). <strong>The</strong> Cox et al. (2000) model<br />
was driven by CO 2 emissions from the IS92a scenario (Legget et<br />
al., 1992) <strong>and</strong> the Friedlingstein et al. (2001) model was driven by<br />
CO 2 emissions from the SRES A2 scenario (IPCC, 2000b). Both<br />
simulations indicate a positive feedback, i.e., both CO 2 concentrations<br />
<strong>and</strong> climate change at the end of the 21st century are<br />
increased due to the coupling. <strong>The</strong> simulated magnitudes of the<br />
effect differ (+70 ppm, Friedlingstein et al., 2001; +270 ppm, Cox<br />
et al., 2000). In the Cox et al. (2000) simulation, which included<br />
a DGVM, the increased atmospheric CO 2 is caused mainly by loss<br />
of soil carbon <strong>and</strong> in part by tropical forest die back. <strong>The</strong><br />
magnitude of the climate-carbon cycle feedback still has large<br />
uncertainties associated with the response of the terrestrial<br />
biosphere to climate change, especially the response of<br />
heterotrophic respiration <strong>and</strong> tropical forest NPP to temperature<br />
(Cox et al., 2000; see Sections 3.2.2.3 <strong>and</strong> 3.7.1). In the following<br />
section, simplified models are used to assess these uncertainties.<br />
Figure 3.11: Projected CO 2 concentrations resulting from the IS92a<br />
emissions scenario. For a strict comparison with previous work, IS92abased<br />
projections were made with two fast carbon cycle models, Bern-<br />
CC <strong>and</strong> ISAM (see Box 3.7), based on CO 2 changes only, <strong>and</strong> on CO 2<br />
changes plus l<strong>and</strong> <strong>and</strong> ocean climate feedbacks. Panel (a) shows the<br />
CO 2 emisisons prescribed by IS92a; the panels (b) <strong>and</strong> (c) show<br />
projected CO 2 concentrations for the Bern-CC <strong>and</strong> ISAM models,<br />
respectively. Results obtained for the SAR, using earlier versions of the<br />
same models, are also shown. <strong>The</strong> model ranges for ISAM were<br />
obtained by tuning the model to approximate the range of responses to<br />
CO 2 <strong>and</strong> climate shown by the models in Figure 3.10, combined with a<br />
range of climate sensitivities from 1.5 to 4.5°C rise for a doubling of<br />
CO 2. This approach yields a lower bound on uncertainties in the carbon<br />
cycle <strong>and</strong> climate. <strong>The</strong> model ranges for Bern-CC were obtained by<br />
combining different bounding assumptions about the behaviour of the<br />
CO 2 fertilisation effect, the response of heterotrophic respiration to<br />
temperature <strong>and</strong> the turnover time of the ocean, thus approaching an<br />
upper bound on uncertainties in the carbon cycle. <strong>The</strong> effect of varying<br />
climate sensitivity from 1.5 to 4.5°C is shown separately for Bern-CC.<br />
Both models adopted a “reference case” with mid-range behaviour of<br />
the carbon cycle <strong>and</strong> climate sensitivity of 2.5°C.<br />
3.7.3.1 Methods for assessing the response of atmospheric CO 2<br />
to different emissions pathways <strong>and</strong> model sensitivities<br />
This section follows the approach of previous IPCC reports in<br />
using simplified, fast models (sometimes known as reduced-form<br />
models) to assess the relationship between CO 2 emissions <strong>and</strong><br />
concentrations, under various assumptions about their future time<br />
course. Results are shown from two models, whose salient<br />
features are summarised in Box 3.7. <strong>The</strong> models lend themselves<br />
to somewhat different approaches to estimating uncertainties. In<br />
the ISAM model, “high-CO 2” <strong>and</strong> “low-CO 2” alternatives are<br />
calculated for every emissions scenario, based on tuning the<br />
model to match the range of responses included in the model<br />
(a)<br />
CO 2 Emissions (PgC/yr)<br />
(b)<br />
CO 2 concentration (ppm)<br />
(c)<br />
CO 2 concentration (ppm)<br />
20<br />
15<br />
10<br />
5<br />
0<br />
1000<br />
900<br />
800<br />
700<br />
600<br />
500<br />
400<br />
300<br />
200<br />
1000<br />
900<br />
800<br />
700<br />
600<br />
500<br />
400<br />
300<br />
IS92a emissions<br />
Bern-CC<br />
reference (CO2 + climate)<br />
range (CO2 + climate)<br />
climate sensitivity 1.5°C to 4.5°C<br />
SAR<br />
CO2 only<br />
ISAM<br />
reference (CO 2 + climate)<br />
range (CO 2 + climate)<br />
CO 2 only<br />
SAR<br />
200<br />
1980 2000 2020 2040<br />
Year<br />
2060 2080 2100
<strong>The</strong> <strong>Carbon</strong> <strong>Cycle</strong> <strong>and</strong> <strong>Atmospheric</strong> <strong>Carbon</strong> <strong>Dioxide</strong><br />
Box 3.7: Fast, simplified models used in this assessment.<br />
<strong>The</strong> Bern-CC model comprises:<br />
• A box-diffusion type ocean carbon model, (HILDA version K(z); Siegenthaler <strong>and</strong> Joos, 1992; Joos et al., 1996), already used in<br />
the SAR. In addition to the SAR version, the effect of sea surface warming on carbonate chemistry is included (Joos et al., 1999b).<br />
• An impulse-response climate model (Hooss et al., 1999), which converts radiative forcing into spatial patterns of changes in<br />
temperature, precipitation <strong>and</strong> cloud cover on a global grid. <strong>The</strong> patterns of the climate anomalies are derived from the first<br />
principal component of the climate response shown by the full three-dimensional atmosphere-ocean GCM, ECHAM-3/LSG<br />
(Voss <strong>and</strong> Mikolajewicz, 1999). <strong>The</strong>ir magnitude is scaled according to the prescribed climate sensitivity.<br />
• <strong>The</strong> terrestrial carbon model LPJ, as described in Sitch et al. (2000) <strong>and</strong> Cramer et al. (2001). LPJ is a process-based DGVM that<br />
falls in the mid-range of CO 2 <strong>and</strong> climate responses as shown in Cramer et al. (2001). It is used here at 3.75° × 2.5° resolution,<br />
as in Cramer et al. (2001).<br />
• A radiative forcing module. <strong>The</strong> radiative forcing of CO 2, the concentration increase of non-CO 2 greenhouse gases <strong>and</strong> their<br />
radiative forcing, direct forcing due to sulphate, black carbon <strong>and</strong> organic aerosols, <strong>and</strong> indirect forcing due to sulphate aerosols<br />
are projected using a variant of SAR models (Harvey et al., 1997; Fuglestvedt <strong>and</strong> Berntsen, 1999) updated with information<br />
summarised in Chapters 4, 5 <strong>and</strong> 6. <strong>The</strong> concentrations of non-CO 2 greenhouse gases, aerosol loadings, <strong>and</strong> radiative forcings are<br />
consistent with those given in Appendix II.<br />
Sensitivities of projected CO 2 concentrations to model assumptions were assessed as follows. Rh was assumed either to be<br />
independent of global warming (Giardina <strong>and</strong> Ryan, 2000; Jarvis <strong>and</strong> Linder 2000), or to increase with temperature according to<br />
Lloyd <strong>and</strong> Taylor (1994). CO 2 fertilisation was either capped after year 2000 by keeping CO 2 at the year 2000 value in the<br />
photosynthesis module, or increased asymptotically following Haxeltine <strong>and</strong> Prentice (1996). (Although apparently unrealistic,<br />
capping the CO 2 fertilisation in the model is designed to mimic the possibility that other, transient factors such as l<strong>and</strong> management<br />
changes might be largely responsible for current terrestrial carbon uptake.) Transport parameters of the ocean model (including gas<br />
exchange) were scaled by a factor of 1.5 <strong>and</strong> 0.5. Average ocean uptake for the 1980s is 2.0 PgC/yr in the reference case, 1.46<br />
PgC/yr for the “slow ocean” <strong>and</strong> 2.54 PgC/yr for the “fast ocean”, roughly in accord with the range of observational estimates (Table<br />
3.1, Section 3.2.3.2). A “low-CO 2” parametrization was obtained by combining the fast ocean <strong>and</strong> no response of Rh to temperature.<br />
A “high-CO 2” parametrization was obtained by combining the slow ocean <strong>and</strong> capping CO 2 fertilisation. Climate sensitivity<br />
was set at 2.5 °C for a doubling of CO 2. Effects of varying climate sensitivity from 1.5°C to 4.5°C are also shown for one case.<br />
<strong>The</strong> ISAM model was described by Jain et al. (1994) <strong>and</strong> used in the SAR for CO 2-only analyses, with a different set of model<br />
parameters from those used here (Jain, 2000). <strong>The</strong> full configuration of ISAM comprises:<br />
• A globally aggregated upwelling-diffusion ocean model including the effects of temperature on CO 2 solubility <strong>and</strong> carbonate<br />
chemistry (Jain et al., 1995).<br />
• An energy balance climate model of the type used in the IPCC 1990 assessment (Hoffert et al., 1980; Bretherton et al., 1990). In<br />
this model, heat is transported as a tracer in the ocean <strong>and</strong> shares the same transport parameters as DIC.<br />
• A six-box globally aggregated terrestrial carbon model including empirical parametrizations of CO 2 fertilisation <strong>and</strong> temperature<br />
effects on productivity <strong>and</strong> respiration (Harvey, 1989; Kheshgi et al., 1996).<br />
• <strong>The</strong> radiative forcing of CO 2 projected using a SAR model (Harvey et al., 1997) modified with information summarised in<br />
Chapter 6. Radiative forcing from agents other than CO 2 are identical to that used in the Bern-CC model.<br />
In addition to varying the climate sensitivity (1.5 to 4.5°C), parameters of the terrestrial <strong>and</strong> ocean components (strength of CO 2<br />
fertilisation, temperature response of NPP <strong>and</strong> heterotrophic respiration; ocean heat <strong>and</strong> DIC transport) were adjusted to mimic the<br />
ranges of CO 2 <strong>and</strong> climate responses as shown by existing process-based models (Figure 3.10). A reference case was defined with<br />
climate sensitivity 2.5°C, ocean uptake corresponding to the mean of the ocean model results in Figure 3.10, <strong>and</strong> terrestrial uptake<br />
corresponding to the mean of the responses of the mid-range models LPJ, IBIS <strong>and</strong> SDGVM (Figure 3.10). A “low CO 2” parametrisation<br />
was chosen with climate sensitivity 1.5°C, <strong>and</strong> maximal CO 2 uptake by oceans <strong>and</strong> l<strong>and</strong>; <strong>and</strong> a “high-CO 2” parametrization<br />
with climate sensitivity 4.5°C, <strong>and</strong> minimal CO 2 uptake by oceans <strong>and</strong> l<strong>and</strong>.<br />
221
222 <strong>The</strong> <strong>Carbon</strong> <strong>Cycle</strong> <strong>and</strong> <strong>Atmospheric</strong> <strong>Carbon</strong> <strong>Dioxide</strong><br />
intercomparisons shown in Figure 3.10. Uncertainties cited from<br />
the ISAM model can be regarded as providing a lower bound on<br />
uncertainty since they do not admit possible behaviours outside<br />
the range considered in recent modelling studies. In the Bern-CC<br />
model, “high-CO 2” <strong>and</strong> “low-CO 2” alternatives are calculated by<br />
making bounding assumptions about carbon cycle processes (for<br />
example, in the high-CO 2 parametrization CO 2 fertilisation is<br />
capped at year 2000; in the low-CO 2 parametrization Rh does not<br />
increase with warming). This approach yields generally larger<br />
ranges of projected CO 2 concentrations than the ISAM approach.<br />
<strong>The</strong> ranges cited from the Bern-CC model can be regarded as<br />
approaching an upper bound on uncertainty, since the true system<br />
response is likely to be less extreme than the bounding assumptions,<br />
<strong>and</strong> because the combination of “best” <strong>and</strong> “worst” case<br />
assumptions for every process is intrinsically unlikely.<br />
3.7.3.2 Concentration projections based on IS92a, for<br />
comparison with previous studies<br />
Illustrative model runs (Figure 3.11) based on the IS92a scenario<br />
(Leggett et al., 1992) are shown first so as to allow comparison with<br />
earlier model results presented in the SAR <strong>and</strong> the SRRF (Schimel<br />
et al., 1995). In the SRRF comparison of eighteen global carbon<br />
cycle models (Enting et al., 1994; Schimel et al., 1995) the CO 2<br />
fertilisation response of the l<strong>and</strong> was calibrated to match the central<br />
estimate of the global carbon budget for the 1980s, assuming a<br />
l<strong>and</strong>-use source of 1.6 PgC/yr in the 1980s <strong>and</strong> attributing the<br />
residual terrestrial sink to CO 2 fertilisation. This intercomparison<br />
yielded CO 2 concentrations in 2100 of 668 to 734 ppm; results<br />
presented in Schimel et al. (1996) (from the Bern model) gave 688<br />
ppm. After recalibrating to match a presumed l<strong>and</strong>-use source of<br />
1.1 PgC/yr, implying a weaker CO 2 response, the 2100 CO 2<br />
concentration was given as 712 ppm in the SAR (Schimel et al.,<br />
1996). An IPCC Technical Paper (Wigley et al., 1997) evaluated the<br />
sensitivity of IS92a results to this calibration procedure. Wigley et<br />
al., (1997) found that a range of assumed values from 0.4 to 1.8<br />
PgC/yr for the l<strong>and</strong>-use source during the 1980s gave rise to a range<br />
of 2100 CO 2 concentrations from 667 to 766 ppm.<br />
In contrast with the SAR, the results presented here are based<br />
on approximating the behaviour of spatially resolved processbased<br />
models in which CO 2 <strong>and</strong> climate responses are not<br />
constrained by prior assumptions about the global carbon budget.<br />
<strong>The</strong> CO 2-only response of both models’ reference cases (Figure<br />
3.11) leads to a 2100 CO 2 concentration of 682 ppm (ISAM) or<br />
651 ppm (Bern-CC). <strong>The</strong>se values are slightly lower than projected<br />
in the SAR − 715 ppm (ISAM; SAR version) <strong>and</strong> 712 ppm (Bern<br />
Model; SAR version) − because current process-based terrestrial<br />
models typically yield a stronger CO 2 response than was assumed<br />
in the SAR. With climate feedbacks included, the 2100 CO 2<br />
concentration in the reference case becomes, by coincidence,<br />
effectively indistinguishable from that given in the SAR: 723 ppm<br />
(ISAM) <strong>and</strong> 706 ppm (Bern-CC). <strong>The</strong> ranges of 164 ppm or −12%<br />
/ +11% (about the reference case) (ISAM) <strong>and</strong> 273 ppm or −10%<br />
/ +28% (Bern-CC) in the 2100 CO 2 concentration indicate that<br />
there is significant uncertainty about the future CO 2 concentrations<br />
due to any one pathway of changes in emissions. Separate<br />
calculations with the Bern-CC model (Figure 3.11) show that the<br />
effect of changing climate sensitivity alone is less important than<br />
(a)<br />
CO 2 Emissions (PgC/yr)<br />
(b)<br />
CO 2 concentration (ppm)<br />
(c)<br />
CO 2 concentration (ppm)<br />
30<br />
25<br />
20<br />
15<br />
10<br />
1300<br />
1100<br />
5<br />
0<br />
900<br />
700<br />
500<br />
300<br />
1300<br />
1100<br />
900<br />
700<br />
500<br />
300<br />
SRES emissions<br />
Bern-CC<br />
ISAM<br />
A1FI<br />
A2<br />
B2<br />
A1B<br />
B1<br />
A1T<br />
2000 2020 2040<br />
Year<br />
2060 2080 2100<br />
A1FI<br />
A2<br />
A1B<br />
B2<br />
A1T<br />
B1<br />
A1FI<br />
A2<br />
A1B<br />
B2<br />
A1T<br />
B1<br />
Figure 3.12: Projected CO 2 concentrations resulting from six SRES<br />
scenarios. <strong>The</strong> SRES scenarios represent the outcome of different<br />
assumptions about the future course of economic development,<br />
demography <strong>and</strong> technological change (see Appendix II). Panel (a)<br />
shows CO 2 emissions for the selected scenarios <strong>and</strong> panels (b) <strong>and</strong><br />
(c) show resulting CO 2 concentrations as projected by two fast<br />
carbon cycle models, Bern-CC <strong>and</strong> ISAM (see Box 3.7 <strong>and</strong> Figure<br />
3.11). <strong>The</strong> ranges represent effects of different model parametrizations<br />
<strong>and</strong> assumptions as indicated in the text <strong>and</strong> in the caption to<br />
Figure 3.11. For each model, <strong>and</strong> each scenario the reference case is<br />
shown by a black line, the upper bound (high-CO 2 parametrization)<br />
is indicated by the top of the coloured area, <strong>and</strong> the lower bound<br />
(low-CO 2 parametrization) by the bottom of the coloured area or<br />
(where hidden) by a dashed coloured line.
<strong>The</strong> <strong>Carbon</strong> <strong>Cycle</strong> <strong>and</strong> <strong>Atmospheric</strong> <strong>Carbon</strong> <strong>Dioxide</strong><br />
the effect of varying assumptions in the carbon cycle model’s<br />
components. <strong>The</strong> effect of increasing climate sensitivity to 4.5<br />
°C (increasing the climate feedback) is much larger than the<br />
effect of reducing climate sensitivity to 1.5 °C. <strong>The</strong> “low-CO 2”<br />
parametrization of Bern-CC yields CO 2 concentrations closer to<br />
the reference case than the “high-CO 2” parametrization, in<br />
which the terrestrial sink is forced to approach zero during the<br />
first few decades of the century due to the capping of the CO 2<br />
fertilisation effect.<br />
<strong>The</strong> reference simulations with ISAM yielded an implied<br />
average l<strong>and</strong>-use source during the 1980s of 0.9 PgC/yr. <strong>The</strong> range<br />
was 0.2 to 2.0 PgC/yr. Corresponding values for Bern-CC were<br />
0.6 PgC/yr <strong>and</strong> a range of 0.0 to 1.5 PgC/yr. <strong>The</strong>se ranges broadly<br />
overlap the range estimates of the 1980s l<strong>and</strong>-use source given in<br />
Table 3.1. Present knowledge of the carbon budget is therefore not<br />
precise enough to allow much narrowing of the uncertainty associated<br />
with future l<strong>and</strong> <strong>and</strong> ocean uptake as expressed in these<br />
projections. However, the lowest implied l<strong>and</strong>-use source values<br />
fall below the range given in Table 3.1.<br />
3.7.3.3 SRES scenarios <strong>and</strong> their implications for future CO 2<br />
concentration<br />
<strong>The</strong> Special Report on Emissions Scenarios (SRES) (IPCC,<br />
2000b) produced a series of scenarios, of which six are used here,<br />
representing outcomes of distinct narratives of economic development<br />
<strong>and</strong> demographic <strong>and</strong> technological change. In ISAM model<br />
runs with these scenarios, past fossil emissions (see Section 3.4.1),<br />
CO 2 concentrations (Enting et al., 1994; Keeling <strong>and</strong> Whorf,<br />
2000) <strong>and</strong> mean global temperatures (Jones et al., 2000) were<br />
specified up to <strong>and</strong> including 1999; scenario-based analyses<br />
started in 2000. In the Bern-CC model runs, observed CO 2<br />
(Etheridge, et al., 1996, Keeling <strong>and</strong> Whorf, 2000) <strong>and</strong> past fossil<br />
emissions (Marl<strong>and</strong> et al., 1999) were prescribed, <strong>and</strong> historical<br />
temperature changes were modelled, based on radiative forcing<br />
from greenhouse gases <strong>and</strong> aerosols; again, scenario-based<br />
analyses started in 2000. Past emissions from changing l<strong>and</strong> use<br />
were calculated in order to balance the carbon budget.<br />
<strong>The</strong> six scenarios lead to substantial differences in projected<br />
CO 2 concentration trajectories (Figure 3.12). Significant<br />
uncertainties are introduced by the range of model parametrizations<br />
considered, so that the trajectories calculated for “adjacent”<br />
scenarios overlap, especially during the first half-century. <strong>The</strong><br />
reference cases of the six scenarios account for a range of 2100<br />
CO 2 concentrations from 541 to 963 ppm in the Bern-CC model<br />
<strong>and</strong> 549 to 970 ppm in the ISAM model. <strong>The</strong> uncertainties around<br />
the 2100 values due to model parametrizations are −12 to +10 %<br />
(ISAM) <strong>and</strong> −14 to +31 % (Bern-CC).<br />
<strong>The</strong>se uncertainties reflect incomplete underst<strong>and</strong>ing of<br />
climate sensitivity <strong>and</strong> the carbon cycle. <strong>The</strong>y substantially limit<br />
our current ability to make quantitative predictions about the<br />
future consequences of a given emissions trajectory. Nevertheless,<br />
the results show that higher emissions are always expected to lead<br />
to higher projected atmospheric concentrations. <strong>The</strong>y also show<br />
that the range of emissions scenarios currently accepted as<br />
plausible leads to a range of CO 2 concentrations that exceeds the<br />
likely upper bound of uncertainties due to differences among<br />
model parameterizations <strong>and</strong> assumptions.<br />
(a)<br />
CO 2 concentration (ppm)<br />
(b)<br />
CO 2 emissions (PgC/yr)<br />
(c)<br />
CO 2 emissions (PgC/yr)<br />
1100<br />
1000<br />
900<br />
800<br />
700<br />
600<br />
500<br />
400<br />
300<br />
20<br />
15<br />
10<br />
5<br />
0<br />
20<br />
15<br />
10<br />
5<br />
0<br />
Stabilisation scenarios<br />
Bern-CC<br />
550<br />
450<br />
750<br />
650<br />
1000<br />
ISAM<br />
1000<br />
750<br />
650<br />
550<br />
450<br />
2000 2100 2200 2300<br />
Year<br />
223<br />
WRE1000<br />
WRE750<br />
WRE650<br />
WRE550<br />
WRE450<br />
Fig 3.13: Projected CO 2 emissions leading to stabilisation of<br />
atmospheric CO 2 concentrations at different final values. Panel (a)<br />
shows the assumed trajectories of CO 2 concentration (WRE<br />
scenarios; Wigley et al., 1996) <strong>and</strong> panels (b) <strong>and</strong> (c) show the<br />
implied CO 2 emissions, as projected with two fast carbon cycle<br />
models, Bern-CC <strong>and</strong> ISAM (see Box 3.7 <strong>and</strong> Figure 3.11). <strong>The</strong><br />
ranges represent effects of different model parametrizations <strong>and</strong><br />
assumptions as indicated in the text <strong>and</strong> in the caption to Figure 3.11.<br />
For each model, the upper <strong>and</strong> lower bounds (corresponding to low<strong>and</strong><br />
high-CO 2 parametrizations, respectively) are indicated by the top<br />
<strong>and</strong> bottom of the shaded area. Alternatively, the lower bound (where<br />
hidden) is indicated by a dashed line.
224 <strong>The</strong> <strong>Carbon</strong> <strong>Cycle</strong> <strong>and</strong> <strong>Atmospheric</strong> <strong>Carbon</strong> <strong>Dioxide</strong><br />
3.7.3.4 Stabilisation scenarios <strong>and</strong> their implications for future<br />
CO 2 emissions<br />
Stabilisation scenarios illustrate implied rates of CO 2 emission<br />
that would arrive at various stable CO 2 concentration levels.<br />
<strong>The</strong>se have been projected using a similar methodology to that<br />
applied in the analysis of emissions scenarios. <strong>The</strong> WRE trajectories<br />
follow CO 2 concentrations consistent with the IS92a<br />
scenario beginning in 1990 <strong>and</strong> branch off to reach constant CO 2<br />
concentrations of 450, 550, 650, 750 <strong>and</strong> 1,000 ppm (Wigley et<br />
al., 1996). <strong>The</strong> rationale for various alternative time trajectories<br />
<strong>and</strong> stabilisation levels is discussed in Chapter 2 of the IPCC<br />
WGIII Third Assessment Report (Morita et al., 2001).<br />
Differences in emissions pathways for different time trajectories<br />
leading to a certain stabilisation target (e.g., S versus WRE<br />
profiles) are discussed in Schimel et al., (1997). Here, we have<br />
calculated emissions for one set of emission profiles to illustrate<br />
differences in implied emissions that arise from updating models<br />
since the SAR.<br />
As in Section 3.7.3.2, the models were initialised up to present.<br />
<strong>The</strong>n anthropogenic emissions for the prescribed CO 2 stabilization<br />
profiles were calculated; deduced emissions equal the change in<br />
modeled ocean <strong>and</strong> terrestrial carbon inventories plus the<br />
prescribed change in atmospheric CO 2 content. To estimate the<br />
strength of carbon cycle-climate feedbacks, global temperature<br />
(ISAM) <strong>and</strong> changes in the fields of temperature, precipitation <strong>and</strong><br />
cloud cover (Bern-CC) were projected from CO 2 radiative forcing<br />
only, neglecting effects of other greenhouse gases <strong>and</strong> aerosols<br />
which are not specified in the WRE profiles. <strong>The</strong> results for the<br />
reference cases are not substantially different from those presented<br />
in the SAR (Figure 3.13). However, the range based on alternative<br />
model parametrizations is larger than presented in the SAR, mainly<br />
due to the range of simulated terrestrial CO 2 uptake. CO 2 stabilisation<br />
at 450, 650 or 1,000ppm would require global anthropogenic<br />
CO 2 emissions to drop below 1990 levels, within a few decades,<br />
about a century, or about two centuries, respectively.<br />
In all cases, once CO 2 concentration becomes constant, the<br />
implied anthropogenic emission declines steadily. This result was<br />
expected. It highlights the fact that to maintain a constant future<br />
CO 2 concentration, anthropogenic CO 2 emissions would<br />
ultimately have to be reduced to the level of persistent natural<br />
sinks. Persistent terrestrial sinks are not well quantified;<br />
peatl<strong>and</strong>s may be a c<strong>and</strong>idate, but the gradual rise in atmospheric<br />
CO 2 concentration during the present interglacial (Figure 3.2)<br />
argues against any such sink. Estimates of current uptake by<br />
peatl<strong>and</strong>s are 400 ppm range among the SRES scenarios<br />
(Figure 3.12).
<strong>The</strong> <strong>Carbon</strong> <strong>Cycle</strong> <strong>and</strong> <strong>Atmospheric</strong> <strong>Carbon</strong> <strong>Dioxide</strong><br />
References<br />
Aber, J., W. McDowell, K. Nadelhoffer, A. Magill, G. Bernstson, M.<br />
Kamakea, S. McNulty, W. Currie, L. Rustad, I. Fern<strong>and</strong>ez, 1998:<br />
Nitrogen saturation in temperate forest ecosystems. BioScience, 48,<br />
921-934.<br />
Allen, A.S., J.A. Andrews, A.C. Finzi, R. Matamala, D.D. Richter <strong>and</strong><br />
W.H. Schlesinger, 2000: Effects of free-air CO 2 enrichement (FACE)<br />
on belowground processes in a Pinus taeda forest. Ecological<br />
Applications, 10, 437-448.<br />
Altabet, M.A., R. Francois, D.W. Murray, <strong>and</strong> W.L. Prell, 1995: Climate-<br />
Related Variations in Denitrification in the Arabian Sea From<br />
Sediment 15 N/ 14 N Ratios. Nature, 373, 506-509.<br />
Andersen, K. K., A. Armengaud, <strong>and</strong> C. Genthon, 1998: <strong>Atmospheric</strong><br />
dust under glacial <strong>and</strong> interglacial conditions, Geophysical Research<br />
Letters, 25, 2281-2284, 1998.<br />
Andres, R. J., Marl<strong>and</strong>, G., Boden, T., <strong>and</strong> Bischof, S., 2000: <strong>Carbon</strong><br />
dioxide emissions from fossil fuel consumption <strong>and</strong> cement<br />
manufacture, 1751-1991, <strong>and</strong> an estimate of their isotopic composition<br />
<strong>and</strong> latitudinal distribution. In: <strong>The</strong> <strong>Carbon</strong> <strong>Cycle</strong>, [Wigley,<br />
T.M.L. <strong>and</strong> D.S. Schimel (eds.)]. Cambridge University Press, New<br />
York, pp. 53-62.<br />
Antoine, D., J.M. Andre, <strong>and</strong> A. Morel, 1996: Oceanic primary production.<br />
2. Estimation at global scale from satellite (coastal zone color<br />
scanner) chlorophyll. Global Biogeochemical <strong>Cycle</strong>s, 10, 57-69.<br />
Apps, M.J., W.A. Kurz, R.J. Luxmoore, L.O. Nilsson, R.A. Sedjo, R.<br />
Schmidt, L.G. Simpson, <strong>and</strong> T.S. Vinson, 1993: Boreal Forests <strong>and</strong><br />
Tundra. Water Air Soil Pollution, 70, 39-53.<br />
Archer, D.E, <strong>and</strong> E. Maier-Reimer, 1994: Effect of deep-sea sedimentary<br />
calcite preservation on atmospheric CO 2 concentration. Nature, 367,<br />
260-263.<br />
Archer, D.E., <strong>and</strong> K. Johnson, 2000: A Model of the iron cycle in the<br />
ocean. Global Biogeochemical <strong>Cycle</strong>s, 14, 269-279.<br />
Archer, D.E., T. Takahashi, S. Sutherl<strong>and</strong>, J. Goddard, D. Chipman, K.<br />
Rodgers, <strong>and</strong> H. Ogura, 1996: Daily, seasonal <strong>and</strong> interannual<br />
variability of sea-surface carbon <strong>and</strong> nutrient concentration in the<br />
equatorial Pacific Ocean. Deep-Sea Research Part II-Topical Studies<br />
in Oceanography, 43, 779-808.<br />
Archer, D.E, H. Kheshgi, <strong>and</strong> E. Maier-Reimer, 1997: Multiple<br />
timescales for neutralization of fossil fuel CO 2. Geophysical<br />
Research Letters, 24, 405-408.<br />
Archer, D.E, H. Kheshgi, <strong>and</strong> E. Maier-Reimer, 1998: Dynamics of<br />
fossil fuel CO 2 neutralization by marine CaCO 3. Global<br />
Biogeochemical <strong>Cycle</strong>s, 12, 259-276.<br />
Archer, D.E, A. Winguth, D. Lea, <strong>and</strong> N. Mahowald, 2000: What caused<br />
the glacial/interglacial atmospheric pCO 2 cycles? Reviews of<br />
Geophysics, 38, 159-189.<br />
Archer, S., T.W. Boutton, <strong>and</strong> K.A. Hibbard, 2001: Trees in grassl<strong>and</strong>s:<br />
biogeochemical consequences of woody plant expansion. In: Global<br />
Biogeochemical <strong>Cycle</strong>s <strong>and</strong> their Interrelationship with Climate<br />
[Schulze, E.-A., S.P. Harrison, M. Heimann, E.A. Holl<strong>and</strong>, J. Lloyd,<br />
I.C. Prentice, <strong>and</strong> D.S. Schimel (eds.)], Academic Press.<br />
Asrar, G., Myneni R.B., <strong>and</strong> Choudhury, B.J., 1992: Spatial heterogeneity<br />
in vegetation canopies <strong>and</strong> remote sensing of absorbed<br />
photosynthetically active radiation: a modeling study. Remote<br />
Sensing Environment, 41, 85-103.<br />
Atjay, G.L., P. Ketner, <strong>and</strong> P. Duvigneaud, 1979: Terrestrial primary<br />
production <strong>and</strong> phytomass. In: <strong>The</strong> Global <strong>Carbon</strong> <strong>Cycle</strong> [Bolin, B.,<br />
E.T. Degens, S. Kempe, <strong>and</strong> P. Ketner (eds.)], John Wiley & Sons,<br />
Chichester, pp. 129-181.<br />
Aubinet, M., A. Grelle, A. Ibrom, U. Rannik, J. Moncrieff, T. Foken, A.S.<br />
Kowalski, P.H. Martin, P. Berbigier, C. Bernhofer, R. Clement, J.<br />
Elbers, A. Granier, T. Grunwald, K. Morgenstern, K. Pilegaard, C.<br />
Rebmann, W. Snijders, R. Valentini <strong>and</strong> T. Vesala, 2000: Estimates of<br />
the annual net carbon <strong>and</strong> water exchange of forests: <strong>The</strong><br />
225<br />
EUROFLUX methodology. Advances in Ecological Research, 30,<br />
113-175.<br />
Aumont, O., 1998: Étude du cycle naturel du carbone dans un modèle 3D<br />
de l’océan mondial. Ph.D. thesis, Université Pierre et Marie Curie, 4<br />
place Jussieu, Paris 95005.<br />
Aumont, O., S. Belviso <strong>and</strong> P. Monfray, 2001a:<br />
Dimethylsulfoniopropionate (DMSP) <strong>and</strong> dimethylsulfide (DMS)<br />
sea surface distributions simulated from a global 3-D ocean carbon<br />
cycle model. Journal of Geophysical Research, (in press)<br />
Aumont, O., J.C. Orr, P. Monfray, W. Ludwig, P. Amiotte-Suchet <strong>and</strong> J.L.<br />
Probst, 2001b: Riverine-driven interhemispheric transport of carbon.<br />
Global Biogeochemical <strong>Cycle</strong>s, (in press)<br />
Bacastow, R.B., 1976: Modulation of atmospheric carbon dioxide by the<br />
southern oscillation. Nature, 261, 116-118.<br />
Bacastow, R.B., 1993: <strong>The</strong> effect of temperature change of the warm<br />
surface waters of the oceans on atmospheric CO 2. Global<br />
Biogeochemical <strong>Cycle</strong>s, 10, 319-333.<br />
Bacastow, R.B., C.D. Keeling, T.J. Lueker, M. Wahlen, <strong>and</strong> W.G. Mook,<br />
1996: <strong>The</strong> 13 C Suess effect in the world surface oceans <strong>and</strong> its<br />
implications for oceanic uptake of CO 2 – Analysis of observations at<br />
Bermuda. Global Biogeochemical <strong>Cycle</strong>s, 10, 335-346.<br />
Baldocchi, D.D., B.B. Hicks, T.P. Meyers, 1988: Measuring biosphereatmosphere<br />
exchanges of biologically related gases with micrometeorological<br />
methods. Ecology, 69, 1331-1340.<br />
Balkanski, Y., P. Monfray, M. Battle, <strong>and</strong> M. Heimann, 1999: Ocean<br />
primary production derived from satellite data: An evaluation with<br />
atmospheric oxygen measurements. Global Biogeochemical <strong>Cycle</strong>s,<br />
13, 257-271.<br />
Barnola, J.M., M. Anklin, J. Porcheron, D. Raynaud, J. Schw<strong>and</strong>er, <strong>and</strong><br />
B. Stauffer, 1995: CO 2 evolution during the last millennium as<br />
recorded by Antarctic <strong>and</strong> Greenl<strong>and</strong> ice. Tellus Series B-Chemical<br />
<strong>and</strong> Physical Meteorology, 47, 264-272.<br />
Bates, N.R., A.F. Michaels, <strong>and</strong> A.H. Knap, 1996: Seasonal <strong>and</strong> interannual<br />
variability of oceanic carbon dioxide species at the US JGOFS<br />
Bermuda Atlantic Time-series Study (BATS) site. Deep-Sea<br />
Research Part II-Topical Studies in Oceanography, 43, 347-383.<br />
Batjes, N.H., 1996: Total carbon <strong>and</strong> nitrogen in the soils of the world.<br />
European Journal of Soil Science 47: 151-163.<br />
Battle, M., M. Bender, T. Sowers, P.P. Tans, J.H. Butler, J.W. Elkins, J.T.<br />
Ellis, T. Conway, N. Zhang, P. Lang, <strong>and</strong> A.D. Clarke, 1996:<br />
<strong>Atmospheric</strong> gas concentrations over the past century measured in air<br />
from firn at the South Pole. Nature, 383, 231-235.<br />
Battle, M., M. Bender, P.P. Tans, J.W.C. White, J.T. Ellis, T. Conway, <strong>and</strong><br />
R.J. Francey, 2000: Global carbon sinks <strong>and</strong> their variability, inferred<br />
from atmospheric O 2 <strong>and</strong> δ 13 C. Science, 287, 2467-2470.<br />
Beerling, D.J., H.H. Birks, <strong>and</strong> F.I. Woodward, 1995: Rapid late-glacial<br />
atmospheric CO 2 changes reconstructed from the stomatal density<br />
record of fossil leaves. Journal of Quaternary Science, 10, 379-384.<br />
Bender, M., T. Sowers, <strong>and</strong> L. Labeyrie, 1994: <strong>The</strong> Dole effect <strong>and</strong> its<br />
variations during the last 130,000 years as measured in the VOSTOK<br />
ice core. Global Biogeochemical <strong>Cycle</strong>s, 8, 363-376.<br />
Bender, M., T. Ellis, P. Tans, R. Francey, <strong>and</strong> D. Lowe, 1996: Variability<br />
in the O 2/N 2 ratio of southern hemisphere air, 1991-1994 -<br />
Implications for the carbon cycle. Global Biogeochemical <strong>Cycle</strong>s, 10,<br />
9-21.<br />
Berger, A.L., 1978: Long-term variations of caloric insolation resulting<br />
from the Earth’s orbital elements. Quaternary Research, 9, 139-167.<br />
Bergh, J., S. Linder, T. Lundmark, B. Elfving, 1999: <strong>The</strong> effect of water<br />
<strong>and</strong> nutrient availability on the productivity of Norway spruce in<br />
northern <strong>and</strong> southern Sweden. Forest Ecology <strong>and</strong> Management,<br />
119, 51-62.<br />
Berner, R.A., 1993: Weathering <strong>and</strong> its effect on atmospheric CO 2 over<br />
phanerozoic time. Chemical Geology, 107, 373-374.<br />
Berner, R.A., 1997: <strong>The</strong> rise of plants <strong>and</strong> their effect on weathering <strong>and</strong><br />
atmospheric CO 2. Science, 276, 544-546.
226 <strong>The</strong> <strong>Carbon</strong> <strong>Cycle</strong> <strong>and</strong> <strong>Atmospheric</strong> <strong>Carbon</strong> <strong>Dioxide</strong><br />
Bickle, M.J., 1994: <strong>The</strong> role of metamorphic decarbonation reactions in<br />
returning strontium to the silicate sediment mass. Nature, 367, 699-<br />
704.<br />
Bird, M.I., J. Lloyd, <strong>and</strong> G.D. Farquhar, 1994: Terrestrial carbon storage<br />
at the LGM. Nature, 371, 585.<br />
Blume, H.P., H. Eger, E. Fleischhauer, A. Hebel, C. Reij, <strong>and</strong> K.G.<br />
Steiner, 1998: Towards sustainable l<strong>and</strong> use. Advances in<br />
Geoecology, 31, 1625pp.<br />
Bolin, B. <strong>and</strong> Keeling C.D., 1963: Large-scale atmospheric mixing as<br />
deduced from the seasonal <strong>and</strong> meridional variations of carbon<br />
dioxide. Journal of Geophysical Research, 68, 3899-3920.<br />
Bolin, B., Sukumar, R., P. Ciais, W. Cramer, P. Jarvis, H. Kheshgi, C.<br />
Nobre, S. Semenov, W. Steffen, 2000: Global Perspective. In: IPCC,<br />
L<strong>and</strong> Use, L<strong>and</strong>-Use Change, <strong>and</strong> Forestry. A Special Report of the<br />
IPCC [Watson, R.T., I.R. Noble, B. Bolin, N.H. Ravindranath, D.J.<br />
Verardo <strong>and</strong> D.J. Dokken (eds.)]. Cambridge University Press,<br />
Cambridge, UK, pp. 23-51.<br />
Bondeau, A., D.W. Kicklighter, <strong>and</strong> J. Kaduk, 1999: Comparing global<br />
models of terrestrial net primary productivity (NPP): importance of<br />
vegetation structure on seasonal NPP estimates. Global Change<br />
Biology, 5, 35-45.<br />
Boone, R.D., K.J. Nadelhoffer, J.D. Canary, <strong>and</strong> J.P. Kaye, 1998: Roots<br />
exert a strong influence on the temperature sensitivity of soil respiration.<br />
Nature, 396, 570-572.<br />
Bopp, L., P. Monfray, O. Aumont, J.-L. Dufresne, H. LeTreut, G. Madec, L.<br />
Terray, <strong>and</strong> J. Orr, 2001: Potential impact of climate change on marine<br />
export production. Global Biogeochemical <strong>Cycle</strong>s 15(1), 81-100.<br />
Bousquet, P., P. Ciais, P. Peylin, M. Ramonet, <strong>and</strong> P. Monfray, 1999:<br />
Inverse modeling of annual atmospheric CO 2 sources <strong>and</strong> sinks 1.<br />
Method <strong>and</strong> control inversion. Journal of Geophysical Research-<br />
Atmospheres, 104, 26161-26178.<br />
Bousquet, P., P. Peylin, P. Ciais, C. Le Quéré, P. Friedlingstein <strong>and</strong> P. P.<br />
Tans, 2000: Regional changes of CO 2 fluxes over l<strong>and</strong> <strong>and</strong> oceans<br />
since 1980. Science, 290, 1342-1346.<br />
Boutin, J., J. Etcheto, Y. D<strong>and</strong>onneau, D.C.E. Bakker, R.A. Feely, H.Y.<br />
Inoue, M. Ishii, R.D. Ling, P.D. Nightingale, N. Metzl, <strong>and</strong> R.<br />
Wanninkhof, 1999: Satellite sea surface temperature: a powerful tool<br />
for interpreting in situ pCO 2 measurements in the equatorial Pacific<br />
Ocean. Tellus Series B-Chemical <strong>and</strong> Physical Meteorology, 51, 490-<br />
508.<br />
Boyd, P.W., A. Watson, C.S. Law, E. Abraham, T. Trull, R. Murdoch,<br />
D.C.E. Bakker, A.R. Bowie, K. Buesseler, H. Chang, M. Charette, P.<br />
Croot, K. Downing, R. Frew, M. Gall, M. Hadfield, J. Hall, M.<br />
Harvey, G. Jameson, J. La Roche, M. Liddicoat, R. Ling, M.<br />
Maldonado, R.M. McKay, S. Nodder, S. Pickmere, R. Pridmore, S.<br />
Rintoul, K. Safi, P. Sutton, R. Strzepek, K. Tanneberger, S. Turner, A.<br />
Waite, <strong>and</strong> J. Zeldis, 2000: A mesoscale pytoplankton bloom in the<br />
polar Southern Ocean stimulated by iron fertilization. Nature, 407,<br />
695-702.<br />
Boyle, E.A., 1988: <strong>The</strong> role of vertical chemical fractionation in controlling<br />
late Quaternary atmospheric carbon dioxide. Journal of<br />
Geophysical Research, 93, 15701-15714.<br />
Braun, S., Rihm, B., Schindler, C., <strong>and</strong> Fluckiger, W., 2000: Growth of<br />
mature beech in relation to ozone <strong>and</strong> nitrogen deposition: an<br />
epidemiological approach. Water Air <strong>and</strong> Soil Pollution, 116, 357-<br />
364.<br />
Braswell, B.H., D.S. Schimel, E. Linder, <strong>and</strong> B. Moore, 1997: <strong>The</strong><br />
response of global terrestrial ecosystems to interannual temperature<br />
variability. Science, 278, 870-872.<br />
Bretherton, F.P., K. Bryan, <strong>and</strong> J.D. Woods, 1990: Time-dependent<br />
greenhouse-gas-induced climate change. In: Climate Change, <strong>The</strong><br />
IPCC Scientific Assessment [Houghton, J.T., G.J. Jenkins <strong>and</strong> J.J.<br />
Ephraums (eds.)]. Cambridge University Press, Cambridge, pp. 173-<br />
194.<br />
British Petroleum Company, 2000: BP Statistical Review of World<br />
Energy 1999. British Petroleum Company, London, UK.<br />
Broecker, W.S., <strong>and</strong> T.H. Peng, 1982: Tracers in the sea, Eldigio,<br />
Palisades, pp. 691.<br />
Broecker, W.S. <strong>and</strong> T.H. Peng, 1992: Interhemispheric transport of<br />
carbon dioxide by ocean circulation. Nature, 356, 587-589.<br />
Broecker, W.S., <strong>and</strong> G.M. Henderson, 1998: <strong>The</strong> sequence of events<br />
surrounding Termination II <strong>and</strong> their implications for the cause of<br />
glacial-interglacial CO 2 changes. Paleoceanography, 13, 352-364.<br />
Broecker, W.S., S. Sutherl<strong>and</strong>, W. Smethie, T.H. Peng, <strong>and</strong> G. Ostlund,<br />
1995: Oceanic radiocarbon: separation of the natural <strong>and</strong> bomb<br />
components. Global Biogeochemical <strong>Cycle</strong>s, 9, 263-288.<br />
Broecker, W., J. Lynch-Stieglitz, D. Archer, M. Hofmann, E. Maier-<br />
Reimer, O. Marchal, T. Stocker, <strong>and</strong> N. Gruber, 1999: How strong is<br />
the Harvardton-Bear constraint? Global Biogeochemical <strong>Cycle</strong>s, 13,<br />
817-820.<br />
Brovkin, V., A. Ganopolski, <strong>and</strong> Y. Svirezhev, 1997: A continuous<br />
climate-vegetation classification for use in climate-biosphere studies.<br />
Ecological Modelling, 101, 251-261.<br />
Brown, S., J. Sathaye, M. Cannell, P. Kauppi, P. Burschel, A. Grainger,<br />
J. Heuveldop, R. Leemans, P. Moura Costa, M. Pinard, S. Nilsson, W.<br />
Schopfhauser, R. Sedjo, N. Singh, M. Trexler, J. van Minnen, S.<br />
Weyers, 1996: Management of forests for mitigation of greenhouse<br />
gas emissions. In: IPCC Climate Change 1995 - Impacts,<br />
Adaptations <strong>and</strong> Mitigation of Climate Change: Scientific-Technical<br />
Analyses, Contribution of Working Group II to the Second<br />
Assessment Report of the Intergovernmental Panel on Climate<br />
Change [Watson, R.T., M.C. Zinyowera, R.H. Moss <strong>and</strong> D.J. Dokken<br />
(eds.)], Cambridge University Press, Cambridge, pp. 773-797.<br />
Bryant, D.M., E.A. Holl<strong>and</strong>, T.R. Seastedt <strong>and</strong> M.D. Walker, 1998:<br />
Analysis of litter decomposition in an alpine tundra. Canadian<br />
Journal of Botany-Revue Canadienne De Botanique, 76, 1295-1304.<br />
Buchmann, N., <strong>and</strong> E.D. Schulze, 1999: Net CO 2 <strong>and</strong> H 2O fluxes of<br />
terrestrial ecosystems. Global Biogeochemical <strong>Cycle</strong>s, 13, 751-760.<br />
Burrows, W.H., J.F. Compton, <strong>and</strong> M.B. Hoffmann, 1998: Vegetation<br />
thickening <strong>and</strong> carbon sinks in the grazed woodl<strong>and</strong>s of north-east<br />
Australia. In: Proceedings Australian Forest Growers Conference,<br />
Lismore, NSW, pp. 305-316.<br />
Caldeira, K., <strong>and</strong> P.B. Duffy, 2000: <strong>The</strong> role of the Southern Ocean in<br />
uptake <strong>and</strong> storage of anthropogenic carbon dioxide. Science, 287,<br />
620-622.<br />
Cao, M., <strong>and</strong> F.I. Woodward, 1998a: Dynamic responses of terrestrial<br />
ecosystem carbon cycling to global climate change. Nature, 393,<br />
249-252.<br />
Cao, M.K., <strong>and</strong> F.I. Woodward, 1998b: Net primary <strong>and</strong> ecosystem<br />
production <strong>and</strong> carbon stocks of terrestrial ecosystems <strong>and</strong> their<br />
responses to climate change. Global Change Biology, 4, 185-198.<br />
Carter, A.J. <strong>and</strong> R.J. Scholes, 2000: Spatial Global Database of Soil<br />
Properties. IGBP Global Soil Data Task CD-ROM. International<br />
Geosphere-Biosphere Programme (IGBP) Data Information<br />
Systems. Toulouse, France.<br />
Catubig, N.R., D.E. Archer, R. Francois, P. deMenocal, W. Howard <strong>and</strong><br />
E.-F. Yu, 1998: Global deep-sea burial rate of calcium carbonate<br />
during the last glacial maximum. Paleoceanography, 13, 298-310.<br />
Cerling, T.E., Y. Wang, <strong>and</strong> J. Quade, 1993: Expansion of C 4 ecosystems<br />
as an indicator of global ecological change in the late miocene.<br />
Nature, 361, 344-345.<br />
Cerling, T.E., J.M. Harris, B.J. MacFadden, M.G. Leakey, J. Quade, V.<br />
Eisenmann, 1997: Global vegetation change through the Miocene-<br />
Pliocene boundary. Nature, 389, 153-158.<br />
Chapin, F.S., 1980: <strong>The</strong> mineral-nutrition of wild plants. Annual Review<br />
of Ecology <strong>and</strong> Systematics, 11, 233-260.<br />
Chapman, W.L., <strong>and</strong> J.E. Walsh, 1993: Recent variations of sea ice <strong>and</strong><br />
air-temperature in high- latitudes. Bulletin of the American<br />
Meteorological Society, 74, 33-47.<br />
Ciais, P., P.P. Tans, <strong>and</strong> M. Trolier, 1995a: A large northern-hemisphere
<strong>The</strong> <strong>Carbon</strong> <strong>Cycle</strong> <strong>and</strong> <strong>Atmospheric</strong> <strong>Carbon</strong> <strong>Dioxide</strong><br />
terrestrial CO 2 sink indicated by the 13 C/ 12 C ratio of atmospheric<br />
CO 2. Science, 269, 1098-1102.<br />
Ciais, P., P.P. Tans, J.W.C. White, M. Trolier, R.J. Francey, J.A. Berry,<br />
D.R. R<strong>and</strong>all, P.J. Sellers, J.G. Collatz, <strong>and</strong> D.S. Schimel, 1995b:<br />
Partitioning of ocean <strong>and</strong> l<strong>and</strong> uptake of CO 2 as inferred by δ 13 C<br />
measurements from the NOAA Climate Monitoring <strong>and</strong> Diagnostics<br />
Laboratory Global Air Sampling Network. Journal of Geophysical<br />
Research-Atmospheres, 100, 5051-5070.<br />
Ciais, P., A.S. Denning, P.P. Tans, J.A. Berry, D.A. R<strong>and</strong>all, G.J. Collatz,<br />
P.J. Sellers, J.W.C. White, M. Trolier, H.A.J. Meijer, R.J. Francey, P.<br />
Monfray, <strong>and</strong> M. Heimann, 1997: A three-dimensional synthesis<br />
study of δ 18 O in atmospheric CO 2. 1. Surface Fluxes. Journal of<br />
Geophysical Research - Atmosphere, 102, 5857-5872.<br />
Ciais, P., P. Friedlingstein, D.S. Schimel, <strong>and</strong> P.P. Tans, 1999: A global<br />
calculation of the delta 13 C of soil respired carbon: Implications for<br />
the biospheric uptake of anthropogenic CO 2. Global Biogeochemical<br />
<strong>Cycle</strong>s, 13, 519-530.<br />
Cienciala, E., S. W. Running, A. Lindroth, A. Grelle, <strong>and</strong> M.G. Ryan,<br />
1998: Analysis of carbon <strong>and</strong> water fluxes from the NOPEX boreal<br />
forest: comparison of measurments with Forest-BGC simulations.<br />
Journal of Hydrology, 212-213, 62-78.<br />
Clark, F.E., 1977: Internal cycling of 15 N in shortgrass prairie. Ecology,<br />
58, 1322-1333.<br />
Clymo, R.S., J. Turunen, <strong>and</strong> K. Tolonen, 1998: <strong>Carbon</strong> accumulation in<br />
peatl<strong>and</strong>. Oikos, 81, 368-388.<br />
Coale, K.H., K.S. Johnson, S.E. Fitzwater, R.M. Gordon, S. Tanner, F.P.<br />
Chavez, L. Ferioli, C. Sakamoto, P. Rogers, F. Millero, P. Steinberg,<br />
P. Nightingale, D. Cooper, W.P. Cochlan, M.R. L<strong>and</strong>ry, J.<br />
Constantinou, G. Rollwagen, A. Trasvina, <strong>and</strong> R. Kudela, 1996: A<br />
massive phytoplankton bloom induced by an ecosystem-scale iron<br />
fertilization experiment in the equatorial Pacific Ocean. Nature, 383,<br />
495-501.<br />
Cole, C.V., C. Cerri, K. Minami, A. Mosier, N. Rosenberg, D. Sauerbeck,<br />
J. Dumanski, J. Duxbury, J. Freney, R. Gupta, O. Heinemeyer, T.<br />
Kolchugina, J. Lee, K. Paustian, D. Powlson, N. Sampson, H.<br />
Tiessen, M. Van Noordwijk, Q. Zhao, I.P. Abrol, T. Barnwell, C.A.<br />
Campbell, R.L Desjardin, C. Feller, P. Garin, M.J. Glendining, E.G.<br />
Gregorich, D. Johnson, J. Kimble, R. Lal, C. Monreal, D.S. Ojima,<br />
M. Padgett, W. Post, W. Sombroek, C. Tarnocai, T. Vinson, S. Vogel,<br />
<strong>and</strong> G. Ward, 1996: Agricultural options for mitigation of greenhouse<br />
gas emissions. In: Climate Change 1995 – Impacts, Adaptations <strong>and</strong><br />
Mitigation of Climate Change: Scientific–Technical Analyses<br />
[Watson, R.T., M.C. Zinyowera <strong>and</strong> R.H. Moss (eds.)], Cambridge<br />
University Press, Cambridge, pp. 745-771.<br />
Collatz, G.J., J.A. Berry, <strong>and</strong> J.S. Clark, 1998: Effects of climate <strong>and</strong><br />
atmospheric CO 2 partial pressure on the global distribution of C 4<br />
grasses: present, past, <strong>and</strong> future. Oecologia, 114, 441-454.<br />
Conway, T.J., P.P. Tans, L.S. Waterman, K.W. Thoning, D.R. Kitzis, K.A.<br />
Masarie, <strong>and</strong> N. Zhang, 1994: Evidence for interannual varibaility of<br />
the carbon cycle from the National Oceanic <strong>and</strong> <strong>Atmospheric</strong><br />
Administration/Climate Monitoring <strong>and</strong> Diagnostics Laboratory<br />
global air sampling network. Journal of Geophysical Research, 99,<br />
22831-22855.<br />
Cox, P.M., R.A. Betts, C.D. Jones, S.A. Spall, <strong>and</strong> I.J. Totterdell, 2000:<br />
Acceleration of global warming due to carbon-cycle feedbacks in a<br />
coupled model. Nature, 408, 184-187.<br />
Cramer, W. <strong>and</strong> C.B. Field, 1999: Comparing global models of terrestrial<br />
net primary productivity (NPP): introduction. Global Change<br />
Biology, 5, III-IV.<br />
Cramer, W., D.W. Kicklighter, A. Bondeau, B. Moore III, G. Churkina,<br />
B. Nemry, A. Ruimy, A.L. Schloss <strong>and</strong> the participants of the<br />
Potsdam NPP Model Intercomparison, 1999: Comparing global<br />
models of terrestrial net primary productivity (NPP) overview <strong>and</strong><br />
key results. Global Change Biology, 5, 1-16.<br />
Cramer, W., A. Bondeau, F.I. Woodward, I.C. Prentice, R.A. Betts, V.<br />
227<br />
Brovkin, P.M. Cox, V. Fisher, J.A. Foley, A.D. Friend, C. Kucharik,<br />
M.R. Lomas, N. Ramankutty, S. Sitch, B. Smith, A. White, <strong>and</strong> C.<br />
Young-Molling, 2001: Global response of terrestrial ecosystem<br />
structure <strong>and</strong> function to CO 2 <strong>and</strong> climate change: results from six<br />
dynamic global vegetation models. Global Change Biology (in<br />
press).<br />
Crowley, T.J., 1995: Ice-age terrestrial carbon changes revisited. Global<br />
Biogeochemical <strong>Cycle</strong>s, 9, 377-389.<br />
Curtis, P.S., 1996: A meta-analysis of leaf gas exchange <strong>and</strong> nitrogen in<br />
trees grown under elevated carbon dioxide. Plant Cell <strong>and</strong><br />
Environment, 19, 127-137.<br />
Curtis, P.S., <strong>and</strong> X.Z. Wang, 1998: A meta-analysis of elevated CO 2<br />
effects on woody plant mass, form, <strong>and</strong> physiology. Oecologia, 113,<br />
299-313.<br />
Dai, A., <strong>and</strong> I.Y. Fung, 1993: Can climate variability contribute to the<br />
“missing” CO 2 sink? Global Biogeochemical <strong>Cycle</strong>s, 7, 599-609.<br />
Dai, A., K.E. Trenberth <strong>and</strong> T.R. Karl, 1998: Global variations in<br />
droughts <strong>and</strong> wet spells: 1900-1995. Geophysical Research Letters,<br />
25, 3367-3370.<br />
De Fries, R.S. <strong>and</strong> J.R.G. Townshend, 1994: NDVI-derived l<strong>and</strong>-cover<br />
classifications at a global-scale. International Journal of Remote<br />
Sensing, 15, 3567-3586.<br />
De Fries, R.S., C.B. Field, I. Fung, C.O. Justice, S. Los, P.A. Matson, E.<br />
Matthews, H.A. Mooney, C.S. Potter, K. Prentice, P.J. Sellers, J.R.G.<br />
Townshend, C.J. Tucker, S.L. Ustin <strong>and</strong> P.M. Vitousek, 1995:<br />
Mapping the l<strong>and</strong>-surface for global atmosphere-biosphere models -<br />
toward continuous distributions of vegetations functional- properties.<br />
Journal of Geophysical Research-Atmospheres, 100, 20867-20882.<br />
De Fries, R.S., C.B. Field, I. Fung, G.J. Collatz, <strong>and</strong> L. Bounoua, 1999:<br />
Combining satellite data <strong>and</strong> biogeochemical models to estimate<br />
global effects of human-induced l<strong>and</strong> cover change on carbon<br />
emissions <strong>and</strong> primary productivity. Global Biogeochemical <strong>Cycle</strong>s,<br />
13, 803-815.<br />
Delgado, J.A., A.R. Mosier, D.W. Valentine, D.S. Schimel, <strong>and</strong> W.J.<br />
Parton, 1996: Long term 15 N studies in a catena of the shortgrass<br />
steppe. Biogeochemistry, 32, 41-52.<br />
DeLucia, E.H., J.G. Hamilton, S.L. Naidu, R.B. Thomas, J.A. Andrews,<br />
A. Finzi, M. Lavine, R. Matamala, J.E. Mohan, G.R. Hendrey, <strong>and</strong><br />
W.H. Schlesinger, 1999: Net primary production of a forest<br />
ecosystem with experimental CO 2 enrichment. Science, 284, 1177-<br />
1179.<br />
Denman, K., E. Hofmann, <strong>and</strong> H. Marchant, 1996: Marine biotic<br />
responses to environmental change <strong>and</strong> feedbacks to climate, In:<br />
Climate Change 1995. <strong>The</strong> Science of Climate Change. [Houghton,<br />
J.T., L.G.M. Filho, B.A. Call<strong>and</strong>er, N. Harris, A. Kattenberg, <strong>and</strong> K.<br />
Maskell (eds.)]. University Press, Cambridge, pp. 449-481.<br />
Denning, A.S., I.Y. Fung, <strong>and</strong> D. R<strong>and</strong>all, 1995: Latitudinal gradient of<br />
atmospheric CO 2 due to seasonal exchange with l<strong>and</strong> biota. Nature,<br />
376, 240-243.<br />
Denning, A.S., D.A. R<strong>and</strong>all, G.J. Collatz, <strong>and</strong> P.J. Sellers, 1996:<br />
Simulations of terrestrial carbon metabolism <strong>and</strong> atmospheric CO 2 in<br />
a general circulation model. Part 2: Spatial <strong>and</strong> temporal variations of<br />
atmospheric CO 2. Tellus, 48B, 543-567.<br />
Denning, A. S., M. Holzer, K. R. Gurney, M. Heimann, R. M. Law, P. J.<br />
Rayner, I. Y. Fung, S.-M. Fan, S. Taguchi, P. Friedlingstein, Y.<br />
Balkanski, J. Taylor, M. Maiss, <strong>and</strong> I. Levin, 1999. Threedimensional<br />
transport <strong>and</strong> concentration of SF 6: A model intercomparison<br />
study (TransCom 2). Tellus, 51B, 266-297.<br />
Dettinger, M.D. <strong>and</strong> M. Ghil, 1998: Seasonal <strong>and</strong> interannual variations<br />
of atmospheric CO 2 <strong>and</strong> climate. Tellus Series B-Chemical <strong>and</strong><br />
Physical Meteorology, 50, 1-24.<br />
Dixon, R.K., S. Brown, R.A. Houghton, A.M. Solomon, M.C. Trexler<br />
<strong>and</strong> J. Wisniewski, 1994: <strong>Carbon</strong> Pools <strong>and</strong> Flux of Global Forest<br />
Ecosystems. Science, 263, 185-190.<br />
Doney, S.C., 1999: Major challenges confronting marine biogeochemical
228 <strong>The</strong> <strong>Carbon</strong> <strong>Cycle</strong> <strong>and</strong> <strong>Atmospheric</strong> <strong>Carbon</strong> <strong>Dioxide</strong><br />
modeling. Global Biogeochemical <strong>Cycle</strong>s, 13, 705-714.<br />
Drake, B.G., M.A. Gonzalez-Meler, <strong>and</strong> S.P. Long, 1997: More efficient<br />
plants: a consequence of rising atmospheric CO 2? Annual Review of<br />
Plant Physiology <strong>and</strong> Plant Molecular Biology, 48, 609-639.<br />
Drake, B.G., J. Azcon-Bieto, J. Berry, J. Bunce, P. Dijkstra, J. Farrar,<br />
R.M. Gifford, M.A. Gonzalez-Meler, G. Koch, H. Lambers, J.<br />
Siedow <strong>and</strong> S. Wullschleger, 1999: Does elevated atmospheric CO 2<br />
concentration inhibit mitochondrial respiration in green plants? Plant<br />
Cell <strong>and</strong> Environment, 22, 649-657.<br />
Duce, R.A., <strong>and</strong> N.W. Tindale, 1991: <strong>Atmospheric</strong> transport of iron <strong>and</strong><br />
its deposition in the ocean. Limnology <strong>and</strong> Oceanography, 36, 1715-<br />
1726.<br />
Ducklow, H.W., 1999: <strong>The</strong> bacterial content of the oceanic euphotic<br />
zone. FEMS Microbiology-Ecology, 30, 1-10.<br />
Edmonds, J.A., M.A. Wise, R.D. S<strong>and</strong>s, R.A. Brown, <strong>and</strong> H.S. Kheshgi,<br />
1996: Agriculture, L<strong>and</strong> Use, <strong>and</strong> Commercial Biomass Energy: A<br />
Preliminary Integrated Analysis of the Potential Role of Biomass<br />
Energy for Reducing Future Greenhouse Related Emissions. PNNL–<br />
111555. Pacific Northwest National Laboratory, Washington, DC,<br />
USA.<br />
Edwards, R., P.N. Sedwick, V. Morgan, C.F. Boutron <strong>and</strong> S. Hong, 1998:<br />
Iron in ice cores from Law Dome, East Antarctica: implications for<br />
past deposition of aerosol iron. Annals of Glaciology, 27, 365-370.<br />
Elderfield, H. <strong>and</strong> R.E.M. Rickaby, 2000: Oceanic Cd/P ratio <strong>and</strong><br />
nutrient utilization in the glacial Southern Ocean. Nature, 405, 305-<br />
310.<br />
Elliott, W.P., J.K. Angell <strong>and</strong> K.W. Thoning, 1991: Relation of<br />
atmospheric CO 2 to tropical sea <strong>and</strong> air temperatures <strong>and</strong> precipitation.<br />
Tellus Series B-Chemical <strong>and</strong> Physical Meteorology, 43, 144-<br />
155.<br />
Engl<strong>and</strong>, M.H., 1995: Using chlorofluorocarbons to assess ocean climate<br />
models. Geophysical Research Letters, 22, 3051-3054.<br />
Enting, I.G. <strong>and</strong> J.V. Mansbridge, 1991: Latitudinal distribution of<br />
sources <strong>and</strong> sinks of CO 2 - results of an inversion study. Tellus Series<br />
B-Chemical <strong>and</strong> Physical Meteorology, 43, 156-170<br />
Enting, I.G., T.M.L. Wigley, <strong>and</strong> M. Heimann, 1994: Future emissions<br />
<strong>and</strong> concentrations of carbon dioxide: Key ocean/atmosphere/l<strong>and</strong><br />
analyses. Division of <strong>Atmospheric</strong> Research, Commonw. Science<br />
<strong>and</strong> Ind. Research Organisation, Melbourne, Victoria.<br />
Enting, I.G., C.M. Trudinger, <strong>and</strong> R.J. Francey, 1995: A Synthesis<br />
Inversion of the Concentration <strong>and</strong> δ 13 C of <strong>Atmospheric</strong> CO 2. Tellus<br />
Series B-Chemical <strong>and</strong> Physical Meteorology, 47, 35-52.<br />
Eppley, R.W., <strong>and</strong> B.J. Peterson, 1979: Particulate organic-matter flux<br />
<strong>and</strong> planktonic new production in the deep ocean. Nature, 282, 677-<br />
680.<br />
Etheridge, D.M., L.P. Steele, R.L. Langenfelds, R.J. Francey, J.M.<br />
Barnola, <strong>and</strong> V.I. Morgan, 1996: Natural <strong>and</strong> anthropogenic changes<br />
in atmospheric CO 2 over the last 1000 years from air in Antarctic ice<br />
<strong>and</strong> firn. Journal of Geophysical Research - Atmosphere, 101, 4115-<br />
4128.<br />
Falkowski, P.G., 1994: <strong>The</strong> role of phytoplankton photosynthesis in<br />
global biogeochemical cycles. Photosynthesis Research, 39, 235-<br />
258.<br />
Falkowski, P.G., 1997: Evolution of the nitrogen cycle <strong>and</strong> its influence<br />
on the biological CO 2 pump in the ocean. Nature, 387, 272-275.<br />
Falkowski, P.G., R.T. Barber, <strong>and</strong> V. Smetacek, 1998: Biogeochemical<br />
controls <strong>and</strong> feedbacks on ocean primary production. Science, 281,<br />
200-206.<br />
Falloon, P., Smith, P., Coleman, K. <strong>and</strong> Marshall, S. 1998: Estimating the<br />
size of the inert organic matter pool from total soil organic carbon<br />
content for use in the Rothamsted <strong>Carbon</strong> Model. Soil Biology <strong>and</strong><br />
Biochemistry, 30, 1207-1211.<br />
Fan, S., M. Gloor, <strong>and</strong> J. Mahlman, S. Pacala, J. Sarmiento, T. Takahashi<br />
<strong>and</strong> P. Tans, 1998: A large terrestrial carbon sink in North America<br />
implied by atmospheric <strong>and</strong> oceanic carbon dioxide data <strong>and</strong> models.<br />
Science, 282, 442-446.<br />
Fan, S.M., Blaine T.L., <strong>and</strong> Sarmiento J.L., 1999: Terrestrial carbon sink<br />
in the Northern Hemisphere estimated from the atmospheric CO 2<br />
difference between Manna Loa <strong>and</strong> the South Pole since 1959. Tellus<br />
Series B-Chemical <strong>and</strong> Physical Meteorology, 51, 863-870.<br />
Fanning, K.A., 1992: Nutrient provinces in the sea: concentration ratios,<br />
reaction rate ratios, <strong>and</strong> ideal covariation. Journal of Geophysical<br />
Research, 97, 5693-5712.<br />
FAO, 1993a: 1992 Production Yearbook. FAO, Rome, Italy<br />
FAO, 1993b: Forest Resources Assessment 1990. Tropical Countries.<br />
FAO Forestry Pap. No. 112. UN Food Agric. Org., Rome, Italy.<br />
FAO, 1997: State of the world’s forests. FAO, Rome, Italy.<br />
Farquhar, G.D., 1997: <strong>Carbon</strong> dioxide <strong>and</strong> vegetation. Science, 278,<br />
1411.<br />
Farquhar, G.D., S.V. von Caemmerer, <strong>and</strong> J.A. Berry, 1980: A biochemical-model<br />
of photosynthetic CO 2 assimilation in leaves of C 3 plants.<br />
Planta, 149, 78-90.<br />
Farquhar, G.D., J. Lloyd, J.A. Taylor, L.B. Flanagan, J.P. Syvertsen, K.T.<br />
Hubick, S.C. Wong, <strong>and</strong> J.R. Ehleringer, 1993: Vegetation effects on<br />
the isotope composition of oxygen in atmospheric CO 2. Nature, 363,<br />
439-443.<br />
Fearnside, P.M., 2000: Global warming <strong>and</strong> tropical l<strong>and</strong>-use change:<br />
greenhouse gas emissions from biomass burning, decomposition <strong>and</strong><br />
soils in forest conversion, shifting cultivation <strong>and</strong> secondary vegetation.<br />
Climatic Change, 46, 115-158.<br />
Feely, R.A., R.H. Gammon, B.A. Taft, P.E. Pullen, L.S. Waterman, T.J.<br />
Conway, J.F. Gendron <strong>and</strong> D.P. Wisegarver, 1987: Distribution of<br />
chemical tracers in the eastern equatorial Pacific during <strong>and</strong> after the<br />
1982-1983 El-Niño/Southern Oscillation event. Journal of<br />
Geophysical Research, 92, 6545-6558.<br />
Feely, R.A., R. Wanninkhof, C. Goyet, D.E. Archer, <strong>and</strong> T. Takahashi,<br />
1997: Variability of CO 2 distributions <strong>and</strong> sea-air fluxes in the central<br />
<strong>and</strong> eastern equatorial Pacific during the 1991-1994 El Niño. Deep-<br />
Sea Research Part II-Topical Studies in Oceanography, 44, 1851-<br />
1867.<br />
Feely, R.A., C.L. Sabine, R.M. Key, <strong>and</strong> T.H. Peng, 1999a: CO 2 synthesis<br />
results: estimating the anthropogenic carbon dioxide sink in the<br />
Pacific ocean. US. JGOFS News, 9, 1-5.<br />
Feely, R.A., R. Wanninkhof, T. Takahashi, <strong>and</strong> P. Tans, 1999b: Influence<br />
of El Niño on the equatorial Pacific contribution to atmospheric CO 2<br />
accumulation. Nature, 398, 597-601.<br />
Fearnside, P.M., 2000: Global warming <strong>and</strong> tropical l<strong>and</strong>-use change:<br />
Greenhouse gas emissions from biomass burning, decomposition <strong>and</strong><br />
soils in forest conversion, shifting cultivation <strong>and</strong> secondary vegetation.<br />
Climatic Change, 46, 115-158.<br />
Field, C.B., R.B. Jackson, <strong>and</strong> H.A. Mooney, 1995a: Stomatal responses<br />
to increased CO 2: implications from the plant to the global scale.<br />
Plant Cell <strong>and</strong> Environment, 18, 1214-1225.<br />
Field, C.B., J.T. R<strong>and</strong>erson, <strong>and</strong> C.M. Malmstrom, 1995b: Global net<br />
primary production - combining ecology <strong>and</strong> remote- sensing.<br />
Remote Sensing of Environment, 51, 74-88.<br />
Field, C.B., M.J. Behrenfeld, J.T. R<strong>and</strong>erson, <strong>and</strong> P. Falkowski, 1998:<br />
Primary production of the biosphere: Integrating terrestrial <strong>and</strong><br />
oceanic components. Science, 281, 237-240.<br />
Fischer, H., M. Whalen, J. Smith, D. Mastroianni, <strong>and</strong> B. Deck, 1999: Ice<br />
core records of atmospheric CO 2 around the last three glacial<br />
terminations. Science, 283, 1712-1714.<br />
Fisher, M.J., I.M. Rao, M.A. Ayarza, C.E. Lascano, J.I. Sanz, R.J.<br />
Thomas, <strong>and</strong> R.R. Vera, 1994: <strong>Carbon</strong> storage by introduced deeprooted<br />
grasses in the South- American Savannas. Nature, 371, 236-<br />
238.<br />
Fog, K., 1988: <strong>The</strong> effect of added nitrogen on the rate of decomposition<br />
of organic -matter. Biological Reviews of the Cambridge<br />
Philosophical Society, 63, 433-462.<br />
Foley, J.A., 1994: <strong>The</strong> sensitivity of the terrestrial biosphere to climatic
<strong>The</strong> <strong>Carbon</strong> <strong>Cycle</strong> <strong>and</strong> <strong>Atmospheric</strong> <strong>Carbon</strong> <strong>Dioxide</strong><br />
change: A simulation of the middle Holocene. Global<br />
Biogeochemical <strong>Cycle</strong>s, 8, 505-525.<br />
Foley, J.A., I.C. Prentice, N. Ramankutty, S. Levis, D. Pollard, S. Sitch,<br />
<strong>and</strong> A. Haxeltine, 1996: An integrated biosphere model of l<strong>and</strong><br />
surface processes, terrestrial carbon balance, <strong>and</strong> vegetation<br />
dynamics. Global Biogeochemical <strong>Cycle</strong>s, 10, 603-628.<br />
Foley, N.A., S. Levis, <strong>and</strong> I.C. Prentice, 1998: Coupling dynamic models<br />
of climate <strong>and</strong> vegetation. Global Change Biology, 4, 561-579.<br />
Fowler, D., J.N. Cape, M. Coyle, C. Flechard, J. Kuylenstierna, K. Hicks,<br />
D. Derwent, C. Johnson, <strong>and</strong> D. Stevenson, 2000: <strong>The</strong> global<br />
exposure of forests to air pollutants. Water Air <strong>and</strong> Soil Pollution,<br />
116, 5-32.<br />
Franςois, R., M.A. Altabet, E.F. Yu, D.M. Sigman, M.P. Bacon, M.<br />
Frank, G. Bohrmann, G. Bareille <strong>and</strong> L.D. Labeyrie, 1997:<br />
Contribution of Southern Ocean surface-water stratification to low<br />
atmospheric CO 2 concentrations during the last glacial period.<br />
Nature, 389, 929-935.<br />
Francey, R.J., <strong>and</strong> P.P. Tans, 1987: Latitudinal variation in O 18 of<br />
atmospheric CO 2. Nature, 327, 495-497.<br />
Francey, R.J., P.P. Tans, <strong>and</strong> C.E. Allison, 1995: Changes in oceanic <strong>and</strong><br />
terrestrial carbon uptake since 1982. Nature, 373, 326-330.<br />
Francey, R., P. Rayner, R. Langenfelds, <strong>and</strong> C. Trudinger, 1999a: <strong>The</strong><br />
inversion of atmospheric CO 2 mixing ratios <strong>and</strong> isotopic composition<br />
to constrain large-scale air-sea fluxes. In: 2nd international<br />
symposium CO 2 in the oceans, Center for Global Environmental<br />
Research, National Institute for Environmental Study, Tsukuba,<br />
Japan, 237-243.<br />
Francey, R.J., C.E. Allison, D.M. Etheridge, C.M. Trudinger, I.G.<br />
Enting, M. Leuenberger, R.L. Langenfelds, E. Michel, <strong>and</strong> L.P.<br />
Steele, 1999b: A 1000-year high precision record of delta 13 C in<br />
atmospheric CO 2. Tellus Series B-Chemical <strong>and</strong> Physical<br />
Meteorology, 51, 170-193.<br />
Frankignoulle, M., G. Abril, A. Borges, I. Bourge, C. Canon, B. Delille,<br />
E. Libert, <strong>and</strong> J.-M. Théate, 1998: <strong>Carbon</strong> dioxide emission from<br />
European estuaries. Science, 282, 434-436.<br />
Friedlingstein, P., I. Fung, E. Holl<strong>and</strong>, J. John, G. Brasseur, D. Erickson<br />
<strong>and</strong> D. Schimel, 1995a: On the contribution of CO 2 fertilization to<br />
the missing biospheric sink. Global Biogeochemical <strong>Cycle</strong>s, 9, 541-<br />
556.<br />
Friedlingstein, P., K.C. Prentice, I.Y. Fung, J.G. John, <strong>and</strong> G.P. Brasseur,<br />
1995b: <strong>Carbon</strong>-biosphere-climate interactions in the last glacial<br />
maximum climate. Journal of Geophysical Research - Atmosphere,<br />
100, 7203-7221.<br />
Friedlingstein, P., L. Bopp, P. Ciais, J.-L. Dufresne, L. Fairhead, H.<br />
LeTreut, P. Monfray, <strong>and</strong> J. Orr, 2001: Positive feedback between<br />
future climate change <strong>and</strong> the carbon cycle. Note du Pole de<br />
Modelisation, Geophys. Res. Lett., 28, 1543-1546.<br />
Friend, A.D., A.K. Stevens, R.G. Knox, <strong>and</strong> M.G.R. Cannell, 1997: A<br />
process-based, terrestrial biosphere model of ecosystem dynamics<br />
(Hybrid v3.0). Ecological Modelling, 95, 249-287.<br />
Fuglestvedt, J.S., <strong>and</strong> T. Berntsen, 1999: A simple model for scenario<br />
studies of changes in global climate. Technical Report # 1999:2,<br />
Center for International Climate <strong>and</strong> Environmental Research, Oslo.<br />
Fung, I.Y., S.K. Meyn, I. Tegen, S.C. Doney, J. John, <strong>and</strong> J.K.B. Bishop,<br />
2000: Iron supply <strong>and</strong> dem<strong>and</strong> in the upper ocean. Global<br />
Biogeochemical <strong>Cycle</strong>s, 14, 281-295.<br />
Gattuso, J.-P., M. Frankignoulle <strong>and</strong> R. Wollast, 1998: <strong>Carbon</strong> <strong>and</strong><br />
carbonate metabolism in coastal aquatic ecosystems. Annual Review<br />
of Ecology <strong>and</strong> Systematics, 29, 405-434.<br />
Ganeshram, R.S., T.F. Pedersen, S.E. Calvert, <strong>and</strong> J.W. Murray, 1995:<br />
Large changes in oceanic nutrient inventories from glacial to<br />
interglacial periods. Nature, 376, 755-758.<br />
Gérard, J.C., B. Nemry, L.M. Francois <strong>and</strong> P. Warnant, 1999: <strong>The</strong><br />
interannual change of atmospheric CO 2: contribution of subtropical<br />
ecosystems? Geophys. Res. Lett., 26, 243-246.<br />
229<br />
Giardina, C.P. <strong>and</strong> M.G. Ryan, 2000: Evidence that decomposition rates<br />
of organic carbon in mineral soil do not vary with temperature.<br />
Nature, 404, 858-861.<br />
Gifford, R.M., 1992: Implications of the globally increasing atmospheric<br />
CO 2 concentration <strong>and</strong> temperature for the Australian terrestrial<br />
carbon budget - integration using a simple-model. Australian Journal<br />
of Botany, 40, 527-543.<br />
Gorham, E., 1991: Northern peatl<strong>and</strong>s - role in the carbon-cycle <strong>and</strong><br />
probable responses to climatic warming. Ecological Applications, 1,<br />
182-195.<br />
Goulden, M.L., J.W. Munger, S.M. Fan, B.C. Daube, <strong>and</strong> S.C. Wofsy,<br />
1996: Exchange of carbon dioxide by a deciduous forest: Response<br />
to interannual climate variability. Science, 271, 1576-1578.<br />
Goulden, M.L., S.C. Wofsy, J.W. Harden, S.E. Trumbore, P.M. Crill, S.T.<br />
Gower, T. Fries, B.C. Daube, S.M. Fan, D.J. Sutton, A. Bazzaz, <strong>and</strong><br />
J.W. Munger, 1998: Sensitivity of boreal forest carbon balance to soil<br />
thaw. Science, 279, 214-217.<br />
Goyet, C., <strong>and</strong> D. Davis, 1997: Estimation of total CO 2 concentration<br />
throughout the water column. Deep-Sea Research Part I-<br />
Oceanographic Research Papers, 44, 859-877.<br />
Gruber, N., 1998: Anthropogenic CO 2 in the Atlantic Ocean. Global<br />
Biogeochemical <strong>Cycle</strong>s, 12, 165-191.<br />
Gruber, N., <strong>and</strong> J. L. Sarmiento, 1997: Global patterns of marine<br />
nitrogen fixation <strong>and</strong> denitrification. Global Biogeochemical <strong>Cycle</strong>s,<br />
11, 235-266.<br />
Gruber, N. <strong>and</strong> C. D. Keeling, 2001: An improved estimate of the<br />
isotopic air-sea disequilibrium of CO 2: Implications for the oceanic<br />
uptake of anthropogenic CO 2, GRL, vol. 28, pg 555-558.<br />
Gruber, N., J.L. Sarmiento, <strong>and</strong> T.F. Stocker, 1996: An improved method<br />
for detecting anthropogenic CO 2 in the oceans. Global<br />
Biogeochemical <strong>Cycle</strong>s, 10, 809-837.<br />
Gruber, N., C.D. Keeling, R.B. Bacastow, P.R. Guenther, T.J. Lueker, M.<br />
Wahlen, H.A.J. Meijer, W.G. Mook, <strong>and</strong> T.F. Stocker, 1999:<br />
Spatiotemporal patterns of carbon-13 in the global surface oceans<br />
<strong>and</strong> the oceanic Suess effect. Global Biogeochemical <strong>Cycle</strong>s, 13,<br />
307-335.<br />
Gunderson, P., B.A. Emmett, O.J. Kjønaas, C.J. Koopmans, A. Tietema,<br />
1998: Impact of nitrogen deposition on nitrogen cycling in forests: a<br />
synthesis of NITREX data. Forest Ecology <strong>and</strong> Management, 101,<br />
37-55<br />
Hall, D.O., J.M.O. Scurlock, H.R. Bolhar-Nordenkampfe, P.C. Leegood,<br />
<strong>and</strong> S.P. Long, 1993: Photosynthesis <strong>and</strong> Production in a Changing<br />
Environment: A Field <strong>and</strong> Laboratory Manual, (eds.)]. Chapman &<br />
Hall, London, 464pp.<br />
Hall, D.O., J. House, <strong>and</strong> I. Scrase, 2000: An overview of biomass<br />
energy. In: Industrial Uses of Biomass Energy: the Example of Brazil<br />
[Rosillo-Calle, F., H. Rothman <strong>and</strong> S.V. Bajay (eds.)]. Taylor &<br />
Francis, London.<br />
Hansell, D.A., <strong>and</strong> C.A. Carlson, 1998: Deep-ocean gradients in the<br />
concentration of dissolved organic carbon. Nature, 395, 263-266.<br />
Hansell, D.A., <strong>and</strong> R.A. Feely, 2000: <strong>Atmospheric</strong> intertropical convergence<br />
impacts surface ocean carbon <strong>and</strong> nitrogen biogeochemistry in<br />
the western tropical Pacific. Geophys. Res. Lett., 27, 1013-1016.<br />
Harrison, K.G., 2000: Role of increased marine silica input on paleopCO<br />
2 levels. Paleoceanography, 15, 292-298.<br />
Harrison, S.P., K.E. Kohfeld, C. Roel<strong>and</strong>t, <strong>and</strong> T. Claquin, 2001: <strong>The</strong><br />
role of dust in climate changes today, at the last glacial maximum <strong>and</strong><br />
in the future. Earth Science Reviews (in press).<br />
Harvey, L.D.D., 1989: Effect of model structure on the response of<br />
terrestrial biosphere models to CO 2 <strong>and</strong> temperature increases.<br />
Global Biogeochemical <strong>Cycle</strong>s, 3, 137-153.<br />
Harvey, L. D. D., Gregory, J., Hoffert, M., Jain, A., Lal, M., Leemans,<br />
R., Raper, S. C. B., Wigley, T. M. L., <strong>and</strong> de Wolde, J. R., 1997: An<br />
introduction to simple climate models used in the IPCC Second<br />
Assessment Report. IPCC Technical Paper II, [Houghton, J.T., L.G.
230 <strong>The</strong> <strong>Carbon</strong> <strong>Cycle</strong> <strong>and</strong> <strong>Atmospheric</strong> <strong>Carbon</strong> <strong>Dioxide</strong><br />
Meira Filho, D.J. Griggs <strong>and</strong> K. Maskell (eds)]. IPCC, Geneva,<br />
Switzerl<strong>and</strong>. 50 pp.<br />
Haxeltine, A., <strong>and</strong> I.C. Prentice, 1996: BIOME3: An equilibrium terrestrial<br />
biosphere model based on ecophysiological constraints, resource<br />
availability, <strong>and</strong> competition among plant functional types. Global<br />
Biogeochemical <strong>Cycle</strong>s, 10, 693 - 709.<br />
Hays, J.D., J. Imbrie, <strong>and</strong> N.J. Shackleton, 1976: Variations in Earths<br />
Orbit - Pacemaker of Ice Ages. Science, 194, 1121-1132.<br />
Heimann, M., 2001: <strong>Atmospheric</strong> Inversion Calculations Performed for<br />
IPCC Third Assesment Report Chapter 3 (<strong>The</strong> <strong>Carbon</strong> <strong>Cycle</strong> <strong>and</strong><br />
<strong>Atmospheric</strong> CO 2), Technical Reports - Max-Planck-Institute für<br />
Biogeochemie No. 2.<br />
Heimann, M. <strong>and</strong> Maier-Reimer, E., 1996: On the relations between the<br />
oceanic uptake of CO 2 <strong>and</strong> its carbon isotopes. Global<br />
Biogeochemical <strong>Cycle</strong>s, 10, 89-110.<br />
Heimann, M., <strong>and</strong> T. Kaminski, 1999: Inverse modelling approaches to<br />
infer surface trace gas fluxes from observed atmospheric mixing<br />
ratios. In: Approaches to scaling a trace gas fluxes in ecosystems<br />
[Bowman A.F. (ed.)]. Elsevier Science, pp. 277-295.<br />
Heimann, M., C.D. Keeling, <strong>and</strong> I.Y. Fung, 1986: Simulating the<br />
atmospheric carbon dioxide distribution with a three dimensional<br />
tracer model. In: <strong>The</strong> Changing <strong>Carbon</strong> <strong>Cycle</strong>: A Global Analysis<br />
[J.R. Trabalka <strong>and</strong> D. E. Reichle (eds.)]. Springer-Verlag, New York.<br />
Heimann, M., G. Esser, J. Kaduk, D. Kicklighter, G. Kohlmaier, D.<br />
McGuire, B. Morre III, C. Prentice, W. Sauf, A. Schloss, U.<br />
Wittenberg, <strong>and</strong> G. Würth, 1997: Interannual variability of CO 2<br />
exchange fluxes as simulated by four terrestrial biogeochemical<br />
models. In: Fifth International <strong>Carbon</strong> <strong>Dioxide</strong> Conference, Cairns,<br />
Queensl<strong>and</strong>, Australia.<br />
Heimann, M., G. Esser, A. Haxeltine, J. Kaduk, D.W. Kicklighter, W.<br />
Knorr, G.H. Kohlmaier, A.D. McGuire, J. Melillo, B. Moore, R.D.<br />
Otto, I.C. Prentice, W. Sauf, A. Schloss, S. Sitch, U. Wittenberg, <strong>and</strong><br />
G. Wurth, 1998: Evaluation of Terrestrial <strong>Carbon</strong> <strong>Cycle</strong> Models<br />
Through Simulations of the Seasonal <strong>Cycle</strong> of <strong>Atmospheric</strong> CO 2 -<br />
First Results of a Model Intercomparison Study. Global<br />
Biogeochemical <strong>Cycle</strong>s, 12, 1-24.<br />
Hewitt, C.D., <strong>and</strong> J.F.B. Mitchell, 1997: Radiative forcing <strong>and</strong> response<br />
of a GCM to ice age boundary conditions: cloud feedback <strong>and</strong><br />
climate sensitivity. Climate Dynamics, 13, 821-834.<br />
Hoffert, M.I., A.J. Callegari, <strong>and</strong> C.T. Hsieh, 1980: <strong>The</strong> role of deep-sea<br />
heat-storage in the secular response to climatic forcing. Journal of<br />
Geophysical Research-Oceans <strong>and</strong> Atmospheres, 85, 6667-6679.<br />
Holfort, J., K.M. Johnson, B. Schneider, G. Siedler, <strong>and</strong> D.W.R. Wallace,<br />
1998: Meridional transport of dissolved inorganic carbon in the<br />
South Atlantic Ocean. Global Biogeochemical <strong>Cycle</strong>s, 12, 479-499.<br />
Holl<strong>and</strong>, E.A., B.H. Braswell, J.F. Lamarque, A. Townsend, J. Sulzman,<br />
J.F. Muller, F. Dentener, G. Brasseur, H. Levy, J.E. Penner, <strong>and</strong> G.J.<br />
Roelofs, 1997: Variations in the predicted spatial distribution of<br />
atmospheric nitrogen depostion <strong>and</strong> their impact on carbon uptake by<br />
terrestrial ecosystems. Journal of Geophysical Research -<br />
Atmosphere, 102, 15849-15866.<br />
Holl<strong>and</strong>, E.A., F.J. Dentener, B.H. Braswell, <strong>and</strong> J.M. Sulzman, 1999:<br />
Contemporary <strong>and</strong> pre-industrial global reactive nitrogen budgets.<br />
Biogeochemistry, 46, 7-43.<br />
Hooss, G., R. Voss, K. Hasselmann, E. Meier-Reimer, <strong>and</strong> F. Joss, 1999:<br />
A nonlinear impulse response model of the coupled carbon cycleocean-atmosphere<br />
climate system. Max-Planck-Institut für<br />
Meteorologie, Hamburg.<br />
Houghton, R.A., 1995: Effects of l<strong>and</strong>-use change, surface temperature,<br />
<strong>and</strong> CO 2 concentration on terrestrial stores of carbon. In: Biotic<br />
Feedbacks in teh Global Climate System [Woodwell, G.M. (ed.)].<br />
Oxford University Press, London, pp. 333-350.<br />
Houghton, R.A., 1999: <strong>The</strong> annual net flux of carbon to the atmosphere<br />
from cahgnes in l<strong>and</strong> use 1850-1990. Tellus, 51B, 298-313.<br />
Houghton, R.A., 2000: A new estimate of global sources <strong>and</strong> sinks of<br />
carbon from l<strong>and</strong>-use change. EOS, 81, supplement s281.<br />
Houghton, R.A., <strong>and</strong> J.L. Hackler, 1995: Continental scale estimates of<br />
the biotic carbon flux from l<strong>and</strong> cover change: 1850-1980.<br />
ORNL/CDIAC-79, NDP-050. Oak Ridge National Laboratory, Oak<br />
Ridge, Tennessee, pp. 144.<br />
Houghton, R.A., <strong>and</strong> J.L. Hackler, 1999: Emissions of carbon from<br />
forestry <strong>and</strong> l<strong>and</strong>-use change in tropical Asia. Global Change<br />
Biology, 5, 481-492.<br />
Houghton, R.A., <strong>and</strong> K. Ramakrishna, 1999: A review of national<br />
emissions inventories from select non-annex I countries: Implications<br />
for counting sources <strong>and</strong> sinks of carbon. Annual Review of Energy<br />
Environment, 24, 571-605.<br />
Houghton, R.A., J.L. Hackler, <strong>and</strong> K.T. Lawrence, 1999: <strong>The</strong> US carbon<br />
budget: Contributions from l<strong>and</strong>-use change. Science, 285, 574-578.<br />
Houghton, R.A., D.L. Skole, C.A. Nobre, J.L. Hackler, K.T. Lawerence<br />
<strong>and</strong> W.H. Chomentowski, 2000: Annual fluxes of carbon from<br />
deforestation <strong>and</strong> regrowth in the Brazilian Amazon. Nature, 403,<br />
301-304.<br />
House, J.I., <strong>and</strong> D.O. Hall, 2001: Net primary production of savannas <strong>and</strong><br />
tropical grassl<strong>and</strong>s, In: Terrestrial Global Productivity: Past, Present<br />
<strong>and</strong> Future [Mooney, H., J. Roy <strong>and</strong> B. Saugier (eds.)], Academic<br />
Press, San Diego (in press).<br />
Hungate, B.A., E.A. Holl<strong>and</strong>, R.B. Jackson, F.S. Chapin, H.A. Mooney,<br />
<strong>and</strong> C.B. Field, 1997: <strong>The</strong> fate of carbon in grassl<strong>and</strong>s under carbon<br />
dioxide enrichment. Nature, 388, 576-579.<br />
Hungate, B.A., P. Dijkstra, D.W. Johnson, C.R. Hinkle <strong>and</strong> B.G. Drake,<br />
1999: Elevated CO 2 increases nitrogen fixation <strong>and</strong> decreases soil<br />
nitrogen mineralization in Florida scrub oak. Global Change Biology,<br />
5, 781-789.<br />
Hunt, E.R., S.C. Piper, R. Nemani, C.D. Keeling, R.D. Otto, <strong>and</strong> S.W.<br />
Running, 1996: Global net carbon exchange <strong>and</strong> intra-annual<br />
atmospheric CO 2 concentrations predicted by an ecosystem process<br />
model <strong>and</strong> three dimensional atmospheric transport model. Global<br />
Biogeochemical <strong>Cycle</strong>s, 10, 431-456.<br />
Huntingford, C., P.M. Cox, <strong>and</strong> T.M. Lenton, 2000. Contrasting<br />
responses of a simple terrestrial ecosystem model to global change.<br />
Ecological Modelling, 134(1), 41-58.<br />
Indermühle, A., T.F. Stocker, F. Joss, H. Fischer, H.J. Smith, M. Wahlen,<br />
B. Deck, D. Mastroianni, J. Tschumi, T. Blunier, R. Meyer, <strong>and</strong> B.<br />
Stauffer, 1999: Holocene carbon-cycle dynamics based on CO 2<br />
trapped in ice at Taylor Dome, Antarctica. Nature, 398, 121-126.<br />
Indermühle, A., E. Monnin B Stauffer, T. Stocker, <strong>and</strong> M. Wahlen, 2000.<br />
<strong>Atmospheric</strong> CO 2 concentration from 60 to 20 kyr BP from Taylor<br />
Dome ice core, Antarctica, Geophys. Res. Lett. 29, 753-758.<br />
Inoue, H.Y., <strong>and</strong> Y. Sugimura, 1992: Variations <strong>and</strong> distributions of CO 2<br />
in <strong>and</strong> over the equatorial pacific during the period from the 1986/88<br />
El-Niño event to the 1988/89 La-Niña event. Tellus Series B, 44, 1-<br />
22.<br />
Ishitani, H., T.B. Johansson, <strong>and</strong> S. Al–Khouli, 1996: Energy Supply<br />
Mitigation Options. In: Climate Change 1995. Impacts, Adaptations<br />
<strong>and</strong> Mitigation of Climate Change: Scientific-Technical Analyses.<br />
Contribution of Working Group II to the Second Assessment Report<br />
of the Intergovernmental Panel on Climate Change. [Watson, R.T..<br />
M.C. Zinyowera <strong>and</strong> R.H. Moss (eds.)]. Cambridge University Press,<br />
Cambridge, pp. 587-648.<br />
IPCC, 1994: Radiative Forcing of Climate Change <strong>and</strong> An Evaluation of<br />
the IPCC IS92 Emissions Scenarios [Houghton, J.T., L.G. Meira<br />
Filho, J. Bruce, Hoesung Lee, B.A. Call<strong>and</strong>er, E. Haites, N. Harris<br />
<strong>and</strong> K. Maskell (eds)]. Cambridge University Press, Cambridge, pp.<br />
339.<br />
IPCC, 1996a: Climate Change 1995. <strong>The</strong> Science of Climate Change.<br />
Contribution of Working Group I to the Second Assessment Report<br />
of the Intergovernmental Panel on Climate Change. [Houghton, J.T. ,<br />
L.G. Meira Filho, B.A. Call<strong>and</strong>er, N. Harris, A. Kattenberg <strong>and</strong> K.<br />
Maskell (eds.)]. Cambridge University Press, Cambridge, UK.
<strong>The</strong> <strong>Carbon</strong> <strong>Cycle</strong> <strong>and</strong> <strong>Atmospheric</strong> <strong>Carbon</strong> <strong>Dioxide</strong><br />
IPCC, 1996b: Climate Change 1995. Impacts, Adaptations <strong>and</strong><br />
Mitigation of Climate Change: Scientific-Technical Analyses.<br />
Contribution of Working Group II to the Second Assessment Report<br />
of the Intergovernmental Panel on Climate Change. [Watson, R.T.,<br />
M.C. Zinyowera, R.H. Moss <strong>and</strong> D.J. Dokken (eds.)]. Cambridge<br />
University Press, Cambridge, UK<br />
IPCC, 1997: Revised 1996 IPCC Guidelines for National Greenhouse<br />
Gas Inventories. Reference Manual, Intergovernmental Panel on<br />
Climate Change. [Houghton, J.T., L.G. Meira Filho, B. Lim, K.<br />
Treanton, I. Mamaty, Y. Bonduki, D.J. Griggs <strong>and</strong> B.A. Callender<br />
(eds.)]. Cambridge University Press, Cambridge, UK.<br />
IPCC, 2000a: L<strong>and</strong> Use, L<strong>and</strong>-Use Change, <strong>and</strong> Forestry. A Special<br />
Report of the IPCC. [Watson, R.T., I.R. Noble, B. Bolin, N.H.<br />
Ravindranath, D.J. Verardo <strong>and</strong> D.J. Dokken (eds.)]. Cambridge<br />
University Press, Cambridge, UK.<br />
IPCC, 2000b: Special Report on Emissions Scenarios. A Special Report<br />
of Working Group III of the intergovernmental Panel on Climate<br />
Change. [Nakićenović, N., J. Alcamo, G. Davis, B. de Vries, J.<br />
Fenhann, S. Gaffin, K. Gregory, A. Grübler, T. Yong Jung, T. Kram,<br />
E.L. La Rovere, L. Michaelis, S. Mori, T. Morita, W. Pepper, H.<br />
Pitcher, L. Price, K. Riahi, A. Roehrl, H.-H. Rogner, A. Sankovski,<br />
M. Schlesinger, P. Shukla, S. Smith, R. Swart, S. van Rooijen, N.<br />
Victor <strong>and</strong> Z. Dadi (eds.)]. Cambridge University Press, Cambridge,<br />
UK.<br />
Ito A. <strong>and</strong> T. Oikawa, 2000: <strong>The</strong> large carbon emission from terrestrial<br />
ecosystem in 1998: A model simulation, Journal of the Meterological<br />
Society of Japan, 78, 103-110<br />
Jain A.K., 2000: <strong>The</strong> Web Interface of Integrated Science Assessment<br />
Model (ISAM). http://frodo.atmos.uiuc.edu/isam.<br />
Jain, A.K., H.S. Kheshgi, <strong>and</strong> D.J. Wuebbles, 1994: Integrated Science<br />
Model for Assessment of Climate Change. Lawrence Livermore<br />
National Laboratory, UCRL-JC-116526.<br />
Jain, A.K., H.S. Kheshgi, M.I. Hoffert, <strong>and</strong> D.J. Wuebbles, 1995:<br />
Distribution of radiocarbon as a test of global carbon-cycle models.<br />
Global Biogeochemical <strong>Cycle</strong>s, 9, 153-166.<br />
Jarvis, P. <strong>and</strong> S. Linder, 2000: Botany - Constraints to growth of boreal<br />
forests. Nature, 405, 904-905.<br />
Jenkinson, D.S., K. Goulding, <strong>and</strong> D.S. Powlson, 1999: Nitrogen deposition<br />
<strong>and</strong> carbon sequestration. Nature, 400, 629-629.<br />
Joos, F., M. Bruno, R. Fink, U. Siegenthaler, T.F. Stocker, <strong>and</strong> C. Le<br />
Quéré, 1996: An efficient <strong>and</strong> accurate representation of complex<br />
oceanic <strong>and</strong> biospheric models of anthropogenic carbon uptake.<br />
Tellus Series B, 48, 397-417.<br />
Joos, F., R. Meyer, M. Bruno, <strong>and</strong> M. Leuenberger, 1999a: <strong>The</strong> variability<br />
in the carbon sinks as reconstructed for the last 1000 years. Geophys.<br />
Res. Lett., 26, 1437-1441.<br />
Joos, F., G.-K. Plattner, T.F. Stocker, O. Marchal, <strong>and</strong> A. Schmittner,<br />
1999b: Global warming <strong>and</strong> marine carbon cycle feedbacks on future<br />
atmospheric CO 2. Science, 284, 464-467.<br />
Jones, P.D., Parker, D.E., Osborn, T.J., <strong>and</strong> Briffa, K.R., 2000: Global <strong>and</strong><br />
hemispheric temperature anomalies - l<strong>and</strong> <strong>and</strong> marine instrumental<br />
records. In: Trends: A Compendium of Data on Global Change, Oak<br />
Ridge National Laboratory, Oak Ridge, Tenn., U.S.A.<br />
Kaminski, T., R. Giering, <strong>and</strong> M. Heimann, 1996: Sensitivity of the<br />
seasonal cycle of CO 2 at remote monitoring stations with respect to<br />
seasonal surface exchange fluxes determined with the adjoint of an<br />
atmospheric transport model. Physics <strong>and</strong> Chemistry of the Earth, 21,<br />
457-462.<br />
Kaminski, T., M. Heimann, <strong>and</strong> R. Giering, 1999: A coarse grid threedimensional<br />
global inverse model of the atmospheric transport - 1.<br />
Adjoint model <strong>and</strong> Jacobian matrix. Journal of Geophysical<br />
Research-Atmospheres, 104, 18535-18553.<br />
Karl, D., R. Letelier, L. Tupas, J. Dore, J. Christian, <strong>and</strong> D. Hebel, 1997:<br />
<strong>The</strong> role of nitrogen fixation in biogeochemical cycling in the<br />
subtropical North Pacific Ocean. Nature, 388, 533-538.<br />
231<br />
Keeling, C.D., <strong>and</strong> R. Revelle, 1985: Effects of El-Niño southern oscillation<br />
on the atmospheric content of carbon-dioxide. Meteoritics, 20,<br />
437-450.<br />
Keeling, C.D., <strong>and</strong> T.P. Whorf, 2000: <strong>Atmospheric</strong> CO2 records from<br />
sites in the SIO air sampling network. In: Trends: A compendium of<br />
data on global change. <strong>Carbon</strong> <strong>Dioxide</strong> Information Analysis Center,<br />
Oak Ridge National Laboratory, Oak Ridge, Tenn., USA.<br />
Keeling, C.D., <strong>and</strong> Piper S.C., 2000: Interannual variations of exchanges<br />
of atmospheric CO2 <strong>and</strong> 13CO2 with the terrestrial biosphere <strong>and</strong><br />
oceans from 1978 to 2000: III. Simulated sources <strong>and</strong> sinks. Scripps<br />
Institution of Oceanography Reference No. 00-14, University of<br />
California, San Diego, 68 pp.<br />
Keeling, C.D., W.G. Mook, <strong>and</strong> P.P. Tans, 1979: Recent trends in the 13C- 12C ratio of atmospheric carbon- dioxide. Nature, 277, 121-123.<br />
Keeling, C.D., R.B. Bacastow, <strong>and</strong> P.P. Tans, 1980: Predicted shift in the<br />
13C-12C ratio of atmospheric carbon-dioxide. Geophys. Res. Lett., 7,<br />
505-508.<br />
Keeling, C.D., R.B. Bacastow, A.l. Carter, S.C. Piper, T.P. Whorf, M.<br />
Heimann, W.G. Mook, <strong>and</strong> H. Roeloffzen, 1989: A three dimensional<br />
model of atmospheric CO2 transport based on observed winds: 1.<br />
Analysis of observational data. In: Aspects of Climate Variability in<br />
the Pacific <strong>and</strong> the Western Americas [Peterson D.H. (ed.)]. American<br />
Geophysical Union, Washington, DC, pp. 165-236.<br />
Keeling, C.D., T.P. Whorf, M. Wahlen, <strong>and</strong> J. V<strong>and</strong>erplicht, 1995:<br />
Interannual extremes in the rate of rise of atmospheric carbon dioxide<br />
since 1980. Nature, 375, 666-670.<br />
Keeling, C.D., J.F.S. Chin, <strong>and</strong> T.P. Whorf, 1996a: Increased activity of<br />
northern vegetation inferred from atmospheric CO2 measurements.<br />
Nature, 382, 146-149.<br />
Keeling, R.F., 1988: Measuring correlations between atmospheric<br />
oxygen <strong>and</strong> carbon- dioxide mole fractions - a preliminary-study in<br />
urban air. Journal Of <strong>Atmospheric</strong> Chemistry, 7, 153-176.<br />
Keeling, R.F., <strong>and</strong> S.R. Shertz, 1992: Seasonal <strong>and</strong> interannual variations<br />
in atmospheric oxygen <strong>and</strong> implications for the global carbon cycle.<br />
Nature, 358, 723-727.<br />
Keeling, R.F., <strong>and</strong> T.H. Peng, 1995: Transport of Heat, CO2 <strong>and</strong> O2 by<br />
the Atlantic thermohaline circulation. Philosophical Transactions of<br />
the Royal Society of London Series B, 348, 133-142.<br />
Keeling, R.F., R.P. Najjar, <strong>and</strong> M.L. Bender, 1993: What atmospheric<br />
oxygen measurements can tell us about the global carbon-cycle.<br />
Global Biogeochemical <strong>Cycle</strong>s, 7, 37-67.<br />
Keeling, R.F., S.C. Piper, <strong>and</strong> M. Heimann, 1996b: Global <strong>and</strong><br />
hemispheric CO2 sinks deduced from changes in atmospheric O2 concentration. Nature, 381, 218-221.<br />
Kheshgi, H.S., A.K. Jain, <strong>and</strong> D.J. Wuebbles, 1996: Accounting for the<br />
missing carbon sink with the CO2 fertilization effect. Climatic<br />
Change, 33, 31-62.<br />
Kicklighter, D.W., M. Bruno, S. Dönges, G. Esser, M. Heimann, J.<br />
Helfrich, F. Ift, F. Joos, J. Kadku, G.H. Kohlmaier, A.D. McGuire,<br />
J.M. Melillo, R. Meyer, B. Moore III, A. Nadler, I.C. Prentice, W.<br />
Sauf, A.L. Schloss, S. Sitch, U. Wittenberg, <strong>and</strong> G. Würth, 1999: A<br />
first order analysis of the potential of CO2 fertilization to affect the<br />
global carbon budget: A comparison of four terrestrial biosphere<br />
models. Tellus, 51B, 343-366.<br />
Kindermann, J., G. Wurth, G.H. Kohlmaier, <strong>and</strong> F.W. Badeck, 1996:<br />
Interannual variation of carbon exchange fluxes in terrestrial ecosystems.<br />
Global Biogeochemical <strong>Cycle</strong>s, 10, 737-755.<br />
Klepper, O., <strong>and</strong> B.J. De Haan, 1995: A sensitivity study of the effect of<br />
global change on ocean carbon uptake. Tellus Series B, 47, 490-500.<br />
Kleypas, J.A., 1997: Modeled estimates of global reef habitat <strong>and</strong><br />
carbonate production since the last glacial maximum.<br />
Paleoceanography, 12, 533-545.<br />
Kleypas, J.A., R.W. Buddemeier, D. Archer, J.P. Gattuso, C. Langdon,<br />
<strong>and</strong> B.N. Opdyke, 1999: Geochemical consequences of increased<br />
atmospheric carbon dioxide on coral reefs. Science, 284, 118-120.
232 <strong>The</strong> <strong>Carbon</strong> <strong>Cycle</strong> <strong>and</strong> <strong>Atmospheric</strong> <strong>Carbon</strong> <strong>Dioxide</strong><br />
Knorr, W., 2000: Annual <strong>and</strong> interannual CO 2 exchanges of the terrestrial<br />
biosphere: process-based simulations <strong>and</strong> uncertainties. Global<br />
Ecology <strong>and</strong> Biogeography, 9, 225-252.<br />
Knorr, W., <strong>and</strong> M. Heimann, 1995: Impact of drought stress <strong>and</strong> other<br />
factors on seasonal l<strong>and</strong> biosphere CO 2 exchange studied through an<br />
atmospheric tracer transport model. Tellus, 47B, 471-489.<br />
Knorr, W. <strong>and</strong> M. Heimann, 2001a: Uncertainties in global terrestrial<br />
biosphere modeling, Part I: a comprehensive sensitivity analysis with<br />
a new photosynthesis <strong>and</strong> energy balance scheme. Global<br />
Biogeochemical <strong>Cycle</strong>s, 15(1), 207-225.<br />
Knorr, W., <strong>and</strong> M. Heimann, 2001b: Uncertainties in global terrestrial<br />
biosphere modeling, Part II: global constraints for a process-based<br />
vegetation model. Global Biogeochemical <strong>Cycle</strong>s, 15(1), 227-246.<br />
Knox, F. <strong>and</strong> M.B. McElroy, 1984: Changes in atmospheric CO 2:<br />
influence of the marine biota at high latitude. Journal of Geophysical<br />
Research, 89, 4629-4637.<br />
Koch, G.W., <strong>and</strong> H.A. Mooney, 1996: Response of terrestrial ecosystems<br />
to elevated CO 2: a synthesis <strong>and</strong> summary. In: <strong>Carbon</strong> <strong>Dioxide</strong> <strong>and</strong><br />
Terrestrial Ecosystems [Koch, G.W. <strong>and</strong> H.A. Mooney (eds.)].<br />
Academic Press, San Diego, pp. 415-429.<br />
Körner, C., 2000: Biosphere responses to CO 2-enrichment. Ecological<br />
Applications, 10, 1590-1619.<br />
Kucharik, C.J., J.A. Foley, C. Delire, V.A. Fisher, M.T. Coe, J.D.<br />
Lenters, C. Young-Molling, N. Ramankutty, J.M. Norman <strong>and</strong> S.T.<br />
Gower, 2000: Testing the performance of a Dynamic Global<br />
Ecosystem Model: Water balance, carbon balance, <strong>and</strong> vegetation<br />
structure. Global Biogeochemical <strong>Cycle</strong>s, 14, 795-825.<br />
Kuhlbusch, T.A.J., M.O. Andeae, H. Cahier, J.G. Goldammer, J.P.<br />
Lacaux, R. Shea, <strong>and</strong> P.J. Crutzen, 1996: Black carbon formation by<br />
savanna fires: Measurements <strong>and</strong> implications for the global carbon<br />
cycle. Journal of Geophysical Research, 101, 23651-23665.<br />
Kumar, N., R.F. Anderson, R.A. Mortlock, P.N. Froelich, P. Kubik, B.<br />
Dittrich-Hannen, <strong>and</strong> M. Suter, 1995: Increased biological productivity<br />
<strong>and</strong> export production in the glacial Southern Ocean. Nature,<br />
378, 675-680.<br />
Langenfelds, R.L., R.J. Francey, <strong>and</strong> L.P. Steele, 1999: Partitioning of<br />
the global fossil CO 2 sink using a 19-year trend in atmospheric O 2.<br />
Geophys. Res. Lett. 26, 1897-1900.<br />
Langdon, C., T. Takahashi, C. Sweeney, D. Chipman, J. Goddard, F.<br />
Marubini, H. Aceves, H. Barnett <strong>and</strong> M. Atkinson, 2000: Effect of<br />
calcium carbonate saturation state on the calcification rate of an<br />
experimental coral reef. Global Biogeochemical <strong>Cycle</strong>s, 14, 639-654.<br />
Law, R.M., P.J. Rayner, A.S. Denning, D. Erickson, I.Y. Fung, M.<br />
Heimann, S.C. Piper, M. Ramonet, S. Taguchi, J.A. Taylor, C.M.<br />
Trudinger, <strong>and</strong> I.G. Watterson, 1996: Variations in modeled<br />
atmospheric transport of carbon dioxide <strong>and</strong> the consequences for<br />
CO 2 inversions. Global Biogeochemical <strong>Cycle</strong>s, 10, 783-796.<br />
Laws, E.A., P.G. Falkowski, W.O. Smith Jr., H. Ducklow, <strong>and</strong> J.J.<br />
McCarthy, 2000: Temperature effects on export production in the<br />
open ocean. Global Biogeochemical <strong>Cycle</strong>s, 14(4), 1231-1246.<br />
Le Quéré, C., J. C. Orr, P. Monfray, O. Aumont, <strong>and</strong> G. Madec, 2000:<br />
Interannual variability of the oceanic sink of CO 2 from 1979 through<br />
1997. Global Biogeochemical <strong>Cycle</strong>s, 14(4), 1247-1265.<br />
Leemans, R., 1990: Global data sets collected <strong>and</strong> compiled by the<br />
Biosphere Project, Working Paper, International Institute for Applied<br />
Analysis (IIASA), Laxenburg, Austria.<br />
Leemans, R., A. vanAmstel, C. Battjes, E. Kreileman, <strong>and</strong> S. Toet, 1996:<br />
<strong>The</strong> l<strong>and</strong> cover <strong>and</strong> carbon cycle consequences of large-scale utilizations<br />
of biomass as an energy source. Global Environmental Change-<br />
Human <strong>and</strong> Policy Dimensions, 6, 335-357.<br />
Lefèvre, N., <strong>and</strong> A.J. Watson, 1999: Modeling the geochemical cycle of<br />
iron in the oceans <strong>and</strong> its impact on atmospheric CO 2 concentrations.<br />
Global Biogeochemical <strong>Cycle</strong>s, 13, 727-736.<br />
Leggett, J.A., W.J. Pepper, <strong>and</strong> R.J. Swart, 1992: Emissions scenarios for<br />
the IPCC: an update. In: Climate Change 1992. <strong>The</strong> Supplementary<br />
Report to the IPCC Scientific assessment. [Houghton, J.T., B.A.<br />
Call<strong>and</strong>er <strong>and</strong> S.K. Varney (eds.)]. Cambridge University Press,<br />
Cambridge, pp. 69-95.<br />
Levitus, S., J.I. Antonov, T.P. Boyer, <strong>and</strong> C. Stephens, 2000: Warming of<br />
the world ocean. Science, 287, 2225-2229.<br />
Liss, P.S., <strong>and</strong> L. Merlivat, 1986: Air-sea gas exchange: Introduction <strong>and</strong><br />
synthesis. In: <strong>The</strong> Role of Air-Sea Exchange in Geochemical Cycling<br />
[Buat-Ménard, P. (ed.)]. D. Reidel, Hingham, Massachusetts, 113-<br />
127.<br />
Lloyd, J., 1999: <strong>The</strong> CO 2 dependence of photosynthesis, plant growth<br />
responses to elevated CO 2 concentrations <strong>and</strong> their interaction with<br />
soil nutrient status, II. Temperate <strong>and</strong> boreal forest productivity <strong>and</strong><br />
the combined effects of increasing CO 2 concentrations <strong>and</strong> increased<br />
nitrogen deposition at a global scale. Functional Ecology, 13, 439-<br />
459.<br />
Lloyd, J., <strong>and</strong> G.D. Farquhar, 1994: 13 C discrimination during CO 2<br />
assimilation by the terrestrial biosphere. Oecologia, 99, 201-215.<br />
Lloyd, J., <strong>and</strong> J.A. Taylor, 1994: On the temperature-dependence of soil<br />
respiration. Functinal Ecolology, 8, 315-323.<br />
Lloyd, J., <strong>and</strong> G.D. Farquhar, 1996: <strong>The</strong> CO 2 dependence of photosynthesis,<br />
plant growth responses to elevated atmospheric CO 2 concentrations,<br />
<strong>and</strong> their interaction with soil nutrient status. I. General<br />
principles <strong>and</strong> forest ecosystems. Functional Ecology, 10, 4-32.<br />
Longhurst, A., S. Sathyendranath, T. Platt, <strong>and</strong> C. Caverhill, 1995: An<br />
Estimate of global primary production in the ocean from satellite<br />
radiometer data. Journal of Plankton Research, 17, 1245-1271.<br />
Lorius, C., <strong>and</strong> H. Oeschger, 1994: Palaeo-perspectives - reducing<br />
uncertainties in global change. Ambio, 23, 30-36.<br />
Lugo, A.E. <strong>and</strong> S. Brown, 1993: Management of tropical soils as sinks or<br />
sources of atmospheric carbon. Plant <strong>and</strong> Soil, 149, 27-41.<br />
Luo, Y.Q., J. Reynolds, <strong>and</strong> Y.P. Wang, 1999: A search for predictive<br />
underst<strong>and</strong>ing of plant responses to elevated [CO 2]. Global Change<br />
Biology, 5, 143-156.<br />
Mahowald, N., K.E. Kohfeld, M. Hansson, Y. Balkanski, S.P. Harrison,<br />
I.C. Prentice, H. Rodhe, <strong>and</strong> M. Schulz, 1999: Dust sources <strong>and</strong><br />
deposition during the Last Glacial Maximum <strong>and</strong> current climate: a<br />
comparison of model results with paleodata from ice cores <strong>and</strong><br />
marine sediments. Journal of Geophysical Research, 104, 15,895-<br />
16,436.<br />
Maier-Reimer, E., 1993: Geochemical cycles in an ocean generalcirculation<br />
model - preindustrial tracer distributions. Global<br />
Biogeochemical <strong>Cycle</strong>s, 7, 645-677.<br />
Maier-Reimer, E., <strong>and</strong> K. Hasselmann, 1987: Transport <strong>and</strong> storage of<br />
CO 2 in the ocean - An inorganic ocean-circulation carbon cycle<br />
model. Climate Dynamics, 2, 63-90.<br />
Maier-Reimer, E., U. Mikolajewicz, <strong>and</strong> A. Winguth, 1996: Future<br />
ocean uptake of CO 2 - Interaction between ocean circulation <strong>and</strong><br />
biology. Climate Dynamics, 12, 711-721.<br />
Malhi, Y., A.D. Nobre, J. Grace, B. Kruijt, M.G.P. Pereira, A. Culf, S.<br />
Scott, 1998: <strong>Carbon</strong> dioxide transfer over a Central Amazonian rain<br />
forest. Journal of Geophysical Research-Atmospheres, 103, 31593-<br />
31612.<br />
Manning, A.C., 2001. Temporal variability of atmospheric oxygen from<br />
both continuous measurements <strong>and</strong> a flask sampling network: Tools<br />
for studying the global carbon cycle. Ph. D. thesis, University of<br />
California, San Diego, La Jolla, California, U.S.A., 190 pp.<br />
Manning, M.R., 1992: Seasonal cycles in atmospheric CO 2 concentrations.<br />
In: <strong>The</strong> Global <strong>Carbon</strong> <strong>Cycle</strong>: Proceedings of the NATO. [M.<br />
Heimann, (ed.)]. Advanced Study Institute I15, Il Ciocco, September<br />
8-20, 1991, Springer Verlag, Berlin.<br />
Marchal, O., T.F. Stocker, <strong>and</strong> F. Joos, 1998: A latitude-depth, circulation<br />
biogeochemical ocean model for paleoclimate studies - development<br />
<strong>and</strong> sensitivities. Tellus, 50B, 290-316.<br />
Marl<strong>and</strong>, G., R.J. Andres, <strong>and</strong> T.A. Boden, 1994: Global, regional, <strong>and</strong><br />
national CO 2 emissions. In: Trends 93: A Compendium of Data on
<strong>The</strong> <strong>Carbon</strong> <strong>Cycle</strong> <strong>and</strong> <strong>Atmospheric</strong> <strong>Carbon</strong> <strong>Dioxide</strong><br />
Global Change [T. A. Boden, D. P. Kaiser, R. J. Sepanski, <strong>and</strong> F. W.<br />
Stoss (eds.)], Oak Ridge National Laboratory, ORNL/CDIAC-65,<br />
Oak Ridge, Tenn., USA, 505-584.<br />
Marl<strong>and</strong>, G., R.J. Andres, T.A. Boden, C. Hohnston, <strong>and</strong> A. Brenkert,<br />
1999: Global, Regional, <strong>and</strong> National CO 2 Emission Estimates from<br />
Fossil Fuel Burning, Cement Production, <strong>and</strong> Gas Flaring: 1751-<br />
1996. <strong>Carbon</strong> <strong>Dioxide</strong> Information Analysis Center, Oak Ridge<br />
National Laboratory, Oak Ridge, Tenn., USA.<br />
Marl<strong>and</strong>, G., T.A. Boden, <strong>and</strong> R.J. Andres, 2000: Global, regional, <strong>and</strong><br />
national CO 2 emissions. In: Trends: A Compendium of Data on<br />
Global Change. <strong>Carbon</strong> <strong>Dioxide</strong> Information Analysis Center, Oak<br />
Ridge National Laboratory, U. S. Department of Energy, Oak Ridge,<br />
Tenn., USA.<br />
Martin, J., 1990: Glacial-interglacial CO 2 change: the iron hypothesis.<br />
Paleoceanography, 5, 1-13.<br />
Martin, J.H., S.E. Fitzwater, <strong>and</strong> R.M. Gordon, 1990: Iron deficiency<br />
limits phytoplankton growth in Antarctic waters. Global<br />
Biogeochemical <strong>Cycle</strong>s, 4, 5-12.<br />
Masle, J. 2000: <strong>The</strong> effects of elevated CO 2 concentrations on cell<br />
division rates, growth patterns, <strong>and</strong> blade anatomy in young wheat<br />
plants are modulated by factors related to leaf position, vernalization,<br />
<strong>and</strong> genotype. Plant Physiology, 122, 1399-1415.<br />
Matear, R.J., <strong>and</strong> A.C. Hirst, 1999: Climate change feedback on the<br />
future oceanic CO 2 uptake. Tellus Series B, 51, 722-733.<br />
Matson, P.A., W.H. McDowell, A.R. Townsend <strong>and</strong> P.M. Vitousek, 1999:<br />
<strong>The</strong> globalization of N deposition: ecosystem consequences in<br />
tropical environments. Biogeochemistry, 46, 67-83.<br />
Matthews, E., 1983: Global vegetation <strong>and</strong> l<strong>and</strong>-use - new high-resolution<br />
data-bases for climate studies. Journal of Climate <strong>and</strong> Applied<br />
Meteorology, 22, 474-487.<br />
McElroy, M.B., 1983: Marine biological-controls on atmospheric CO 2<br />
<strong>and</strong> climate. Nature, 302, 328-329.<br />
McGillicuddy, D.J., <strong>and</strong> A.R. Robinson, 1997: Eddy-induced nutrient<br />
supply <strong>and</strong> new production in the Sargasso Sea. Deep-Sea Research<br />
Part I-Oceanographic Research Papers, 44, 1427-1450.<br />
McGuire, A.D., J.M. Melillo, <strong>and</strong> L.A. Joyce, 1995: <strong>The</strong> role of nitrogen<br />
in the response of forest net primary production to elevated<br />
atmospheric carbon-dioxide. Annual Review of Ecology <strong>and</strong><br />
Systematics, 26, 473-503.<br />
McGuire, A.D., S. Sitch, J.S. Clein, R. Dargaville, G. Esser, J. Foley, M.<br />
Heimann, F. Joos, J. Kaplan, D.W. Kicklighter, R.A. Meier, J.M.<br />
Melillo, B. Moore III, I.C. Prentice, N. Ramankutty, T. Reichenau, A.<br />
Schloss, H. Tian, L.J. Williams, U. Wittenberg, 2001 <strong>Carbon</strong> balance<br />
of the terrestrial biosphere in the twentieth century: Analyses of CO 2,<br />
climate <strong>and</strong> l<strong>and</strong>-use effects with four process-based ecosystem<br />
models. Global Biogeochemical <strong>Cycle</strong>s, 15(1), 183-206.<br />
Mclaughlin, S., <strong>and</strong> Downing, D.J., 1995: Interactive effects of ambient<br />
ozone <strong>and</strong> climate measured on growth of mature forest trees. Nature,<br />
374, 252-254.<br />
Mclaughlin, S., <strong>and</strong> Percy, K., 2000: Forest health in North America:<br />
some perspectives on actual <strong>and</strong> potential roles of climate <strong>and</strong> air<br />
pollution. Water Air <strong>and</strong> Soil Pollution, 116, 151-197.<br />
Melillo, J.M., <strong>and</strong> J.R. Gosz, 1983: Interactions of biogeochemical cycles<br />
in forest ecosystems. In: <strong>The</strong> major biogeochemical cycles <strong>and</strong> their<br />
interactions [Bolin, B. <strong>and</strong> R.B. Cook (eds.)]. John Wiley <strong>and</strong> Sons,<br />
New York, pp. 177-222.<br />
Melillo, J.M., A.D. McGuire, D.W. Kicklighter, B.M. III, C.J.<br />
Vörösmarty <strong>and</strong> A.L. Schloss, 1993: Global climate change <strong>and</strong><br />
terrestrial net primary production. Nature, 363, 234-240.<br />
Melillo, J.M., I.C. Prentice, G.D. Farquhar, E.-D. Schulze, <strong>and</strong> O.E. Sala,<br />
1996: Terrestrial biotic response to environmental change <strong>and</strong><br />
feedbacks to climate, In:Climate Change 1995. <strong>The</strong> Science of<br />
Climate Change., [J.T. Houghton, L.G.M. Filho, B.A. Call<strong>and</strong>er, N.<br />
Harris, A. Kattenberg <strong>and</strong> K. Maskell (eds.)]. University Press,<br />
Cambridge, pp. 449-481.<br />
233<br />
Menzel, A., <strong>and</strong> P. Fabian, 1999: Growing season extended in Europe.<br />
Nature, 397, 659.<br />
Meybeck, M., 1982: <strong>Carbon</strong>, nitrogen, <strong>and</strong> phosphorus transport by<br />
world rivers. American Journal of Science, 282, 401-450.<br />
Meybeck, M., 1993: Riverine transport of atmospheric carbon – sources,<br />
global typology <strong>and</strong> budget. Water, Air <strong>and</strong> Soil Pollution, 70, 443-<br />
463<br />
Milliman, J.D., 1993: Production <strong>and</strong> accumulation of calciumcarbonate<br />
in the ocean - budget of a nonsteady state. Global<br />
Biogeochemical <strong>Cycle</strong>s, 7, 927-957.<br />
Minkkinen, K., <strong>and</strong> J. Laine, 1998: Long-term effect of forest drainage<br />
on the peat carbon stores of pine mires in Finl<strong>and</strong>. Canadian Journal<br />
of Forest Research-Revue Canadienne De Recherche Forestiere, 28,<br />
1267-1275.<br />
Mitchell, J.F.B., T.C. Johns, J.M. Gregory, <strong>and</strong> S.F.B. Tett, 1995: Climate<br />
response to increasing levels of greenhouse gases <strong>and</strong> sulphate<br />
aerosols. Nature, 376, 501-504.<br />
Mook, W.G., M. Koopmans, A.F. Carter, <strong>and</strong> C.D. Keeling, 1983:<br />
Seasonal, latitudinal, <strong>and</strong> secular variations in the abundance <strong>and</strong><br />
isotopic-ratios of atmospheric carbon-dioxide. 1. Results from l<strong>and</strong><br />
stations. Journal of Geophysical Research-Oceans <strong>and</strong> Atmospheres,<br />
88, 915-933.<br />
Mooney, H.A., J. Canadell, F.S. Chapin III, J.R. Ehleringer, Ch. Körner,<br />
R.E. McMurtrie, W.J. Parton, L.F. Pitelka, <strong>and</strong> E.D. Schulze, 1999:<br />
Ecosystem physiology responses to global change. In: Implications<br />
of Global Change for Natural <strong>and</strong> Managed Ecosystems. A Synthesis<br />
of GCTE <strong>and</strong> Related Research. IGBP Book Series No. 4, [Walker,<br />
B.H., W.L. Steffen, J. Canadell <strong>and</strong> J.S.I. Ingram (eds.)]. Cambridge<br />
University Press, Cambridge, pp. 141-189.<br />
Mooney, H., J. Roy <strong>and</strong> B. Saugier (eds.) 2001. Terrestrial Global<br />
Productivity: Past, Present <strong>and</strong> Future, Academic Press, San Diego<br />
(in press).<br />
Morita, T., J. Robinson, A. Adegbulugbe, J. Alcamo, E. Lebre La Rovere,<br />
N. Nakićenović, H. Pitcher, P. Raskin, V. Sokolov, B. de Vries, D.<br />
Zhou, 2001. Greenhouse gas emission mitigation scenarios <strong>and</strong><br />
implications. In: Climate Change: Mitigation. Contribution of<br />
Working Group III to the Third Assessment Report of the<br />
Intergovernmental Panel on Climate Change [O. Davidson, B. Metz<br />
<strong>and</strong> R. Swart (eds)]. Cambridge University Press, Cambridge, United<br />
Kingdom <strong>and</strong> New York, NY, USA, in press.<br />
Murnane, R.J., J.L. Sarmiento, <strong>and</strong> C. Le Quéré, 1999: Spatial distribution<br />
of air-sea CO 2 fluxes <strong>and</strong> the interhemispheric transport of<br />
carbon by the oceans. Global Biogeochemical <strong>Cycle</strong>s, 13, 287-305.<br />
Myneni, R.B., C.D. Keeling, C.J. Tucker, G. Asrar, <strong>and</strong> R.R. Nemani,<br />
1997: Increased plant growth in the northern high latitudes from 1981<br />
to 1991. Nature, 386, 698-702.<br />
Nadelhoffer, K.J., B.A. Emmett, <strong>and</strong> P. Gundersen, 1999: Nitrogen<br />
deposition makes a minor contribution to carbon sequestration in<br />
temperate forests. Nature, 398, 145-148.<br />
Neftel, A., H. Friedli, E. Moor, H. Lötscher, H. Oeschger, U.<br />
Siegenthaler, <strong>and</strong> B. Stauffer, 1994: Historical CO 2 record from the<br />
Siple station ice core. In: Trends ‘93: A Compendium of Data on<br />
Global Change. [T.A. Boden, D.P. Kaiser, R.J. Sepanski, <strong>and</strong> F.W.<br />
Stoss (eds.)], <strong>Carbon</strong> <strong>Dioxide</strong> Inf. Anal. Cent., Oak Ridge., pp. 11-14.<br />
Neilson, R.P., <strong>and</strong> D. Marks, 1994: A global perspective of regional<br />
vegetation <strong>and</strong> hydrologic sensitivities from climatic change. Journal<br />
of Vegetation Science, 5, 715-730.<br />
Nemry, B., L. Francois, J.C. Gerard, A. Bondeau, <strong>and</strong> M. Heimann,<br />
1999: Comparing global models of terrestrial net primary productivity<br />
(NPP): analysis of the seasonal atmospheric CO 2 signal. Global<br />
Change Biology, 5, 65-76.<br />
Norby, R.J. <strong>and</strong> M.F. Cotrufo, 1988: Global change - A question of litter<br />
quality. Nature, 396, 17-18.<br />
Norby, R.J., S.D. Wullschleger, C.A. Gunderson, D.W. Johnson, <strong>and</strong> R.<br />
Ceulemans, 1999: Tree responses to rising CO 2 in field experiments:
234 <strong>The</strong> <strong>Carbon</strong> <strong>Cycle</strong> <strong>and</strong> <strong>Atmospheric</strong> <strong>Carbon</strong> <strong>Dioxide</strong><br />
implications for the future forest. Plant Cell <strong>and</strong> Environment, 22,<br />
683-714.<br />
Oechel, W.C., S.J. Hastings, G. Vourlitis, M. Jenkins, G. Riechers, <strong>and</strong> N.<br />
Grulke, 1993: Recent change of arctic tundra ecosystems from a net<br />
carbon- dioxide sink to a source. Nature, 361, 520-523.<br />
Oechel, W.C., G.L. Vourlitis, S.J. Hastings, R.C. Zulueta, L. Hinzman,<br />
<strong>and</strong> D. Kane, 2000: Acclimation of ecosystem CO 2 exchange in the<br />
Alaskan Arctic in response to decadal climate warming. Nature, 406,<br />
978-981.<br />
Ollinger, S.V., J.S. Aber, <strong>and</strong> P.B. Reich, 1997: Simulating ozone effects<br />
on forest productivity: interactions among leaf-, canopy-, <strong>and</strong> st<strong>and</strong>level<br />
processes. Ecological Applications, 7, 1237-1251.<br />
Olson, J.S., J.A. Watts, <strong>and</strong> L.J. Allison, 1983: <strong>Carbon</strong> in Live Vegetation<br />
of Major World Ecosystems. Oak Ridge, Tennessee:Oak Ridge<br />
National Laboratory. ORNL-5862.<br />
Ono, T., S. Watanabe, K. Okuda, <strong>and</strong> M. Fukasawa, 1998: Distribution of<br />
total carbonate <strong>and</strong> related properties in the North Pacific along 30<br />
degrees N. Journal of Geophysical Research-Oceans, 103, 30873-<br />
30883.<br />
Opdyke, B.N., <strong>and</strong> J.C.G. Walker, 1992: Return of the coral-reef hypothesis<br />
- basin to shelf partitioning of CaCO 3 <strong>and</strong> Its Effect On<br />
<strong>Atmospheric</strong> CO 2. Geology, 20, 733-736.<br />
Orr, J.C., <strong>and</strong> J.-C. Dutay, 1999: OCMIP mid-project workshop.<br />
Research GAIM Newsletter, 3, 4-5.<br />
Orr, J., E. Maier-Reimer, U. Mikolajewicz, P. Monfray, J. L. Sarmiento,<br />
J. R. Toggweiler, N. K. Taylor, J. Palmer, N. Gruber, C. L. Sabine, C.<br />
Le Quéré, R. M. Key, <strong>and</strong> J. Boutin, 2001: Estimates of anthropogenic<br />
carbon uptake from four 3-D global ocean models. Global<br />
Biogeochemical <strong>Cycle</strong>s, 15, 43-60.<br />
Oschlies, A., <strong>and</strong> V. Garçon, 1998: Eddy-induced enhancement of<br />
primary production in a model of the north Atlantic Ocean. Nature,<br />
394, 266-269.<br />
Overpeck, J., K. Hughen, D. Hardy, R. Bradley, R. Case, M. Douglas, B.<br />
Finney, K. Gajewski, G. Jacoby, A. Jennings, S. Lamoureux, A.<br />
Lasca, G. MacDonald, J. Moore, M. Retelle, S. Smith, A. Wolfe, <strong>and</strong><br />
G. Zielinski, 1997: Arctic environmental change of the last four<br />
centuries. Science, 278, 1251-1256.<br />
Owensby, C.E., P.I. Coyne, <strong>and</strong> J.M. Ham, 1993: Biomass production in<br />
a tallgrass prairie ecosystem exposed to ambient <strong>and</strong> elevated CO 2.<br />
Ecological Applications, 3, 644-653.<br />
Pagani, M., M.A. Arthur <strong>and</strong> K.H. Freeman, 1999a: Miocene evolution<br />
of atmospheric carbon dioxide. Paleoceanography, 14, 273-292.<br />
Pagani, M., K. Freeman, <strong>and</strong> M.A. Arthur, 1999b: Late Miocene<br />
atmospheric CO 2 concentrations <strong>and</strong> the expansion of C 4 grasses.<br />
Science, 285, 876-879.<br />
Pahlow, M., <strong>and</strong> U. Riebesell, 2000: Temporal trends in deep ocean<br />
Redfield ratios. Science, 287, 831-833.<br />
Pearson, P.N. <strong>and</strong> M.R. Palmer, 1999: Middle eocene seawater pH <strong>and</strong><br />
atmospheric carbon dioxide concentrations. Science, 284, 1824-<br />
1826.<br />
Pearson, P.N. <strong>and</strong> M.R. Palmer, 2000: <strong>Atmospheric</strong> carbon dioxide<br />
concentrations over the past 60 million years. Nature, 406, 695-699.<br />
Peng, C.H., J. Guiot, <strong>and</strong> E.V. Campo, 1998: Past <strong>and</strong> future carbon<br />
balance of European ecosystems from pollen data <strong>and</strong> climatic<br />
models simulations. Global Planetary Change, 18, 189-200.<br />
Petit, J.R., J. Jouzel, D. Raynaud, N.I. Barkov, J.M. Barnola, I. Basile, M.<br />
Bender, J. Chappellaz, M. Davis, G. Delaygue, M. Delmotte, V.M.<br />
Kotlyakov, M. Legr<strong>and</strong>, V.Y. Lipenkov, C. Lorius, L. Pepin, C. Ritz,<br />
E. Saltzman, <strong>and</strong> M. Stievenard, 1999: Climate <strong>and</strong> atmospheric<br />
history of the past 420,000 years from the Vostok ice core, Antarctica.<br />
Nature, 399, 429-436.<br />
Peybernès, N., E. Michel, J.-M. Barnola, M. Delmotte, J. Chappellaz, <strong>and</strong><br />
D. Raynaud, 2000: Information on carbon cycle during the last 8,000<br />
years deduced from CO 2, δ 13 CO 2 <strong>and</strong> CH 4 profiles obtained on a<br />
Vostok Ice core. Presented at: EGS, Nice, France, 25-26 April 2000.<br />
Phillips, O.L., Y. Malhi, N. Higuchi, W.F. Laurance, P.V. Nunez, R.M.<br />
Vasquez, S.G. Laurance, L.V. Ferreira, M. Stern, S. Brown <strong>and</strong> J.<br />
Grace, 1998: Changes in the carbon balance of tropical forests:<br />
Evidence from long-term plots. Science, 282, 439-442.<br />
Polley, H.W., H.B. Johnson, H.S. Mayeux, <strong>and</strong> C.R. Tischler, 1996: Are<br />
some of the recent changes in grassl<strong>and</strong> communities a response to<br />
rising CO 2 concentrations? In: <strong>Carbon</strong> <strong>Dioxide</strong>, Populations, <strong>and</strong><br />
Communities [Körner, C. <strong>and</strong> F.A. Bazzaz (eds.)]. Academic Press,<br />
San Diego, pp. 177-195.<br />
Prentice, I.C., M. Heimann, <strong>and</strong> S. Sitch, 2000: <strong>The</strong> carbon balance of the<br />
terrestrial biosphere: Ecosystem models <strong>and</strong> atmospheric observations.<br />
Ecological Applications, 10, 1553-1573.<br />
Pritchard, S.G., H.H. Rogers, S.A. Prior, <strong>and</strong> C.M. Peterson, 1999:<br />
Elevated CO 2 <strong>and</strong> plant structure: a review. Global Change Biology,<br />
5, 807-837.<br />
Poole, I., J.D.B. Weyers, T. Lawson <strong>and</strong> J.A. Raven, 1996: Variations in<br />
stomatal density <strong>and</strong> index: Implications for palaeoclimatic<br />
reconstructions. Plant Cell <strong>and</strong> Environment, 19, 705-712.<br />
Quay, P.D., B. Tilbrook, C.S. Won, 1992: Oceanic uptake of fossil fuel<br />
CO 2: <strong>Carbon</strong>-13 evidence. Science, 256, 74-79.<br />
Raich, J.W., E.B. Rastetter, J.M. Melillo, D.W. Kicklighter, P.A. Steudler,<br />
B.J. Peterson, A.L. Grace, B. Moore <strong>and</strong> C.J. Vorosmarty, 1991:<br />
Potential net primary productivity in South-America - application of<br />
a global-model. Ecological Applications, 1, 399-429.<br />
Raich, J.W., <strong>and</strong> W.H. Schlesinger, 1992: <strong>The</strong> global carbon-dioxide flux<br />
in soil respiration <strong>and</strong> its relationship to vegetation <strong>and</strong> climate. Tellus<br />
Series B-Chemical <strong>and</strong> Physical Meteorology, 44, 81-99<br />
Ramankutty, N., <strong>and</strong> J.A. Foley, 2000: Estimating historical changes in<br />
global l<strong>and</strong> cover: Cropl<strong>and</strong>s from 1700 to 1992. Global<br />
Biogeochemical <strong>Cycle</strong>s, 13, 997-1027.<br />
R<strong>and</strong>erson, J.T., C.B. Field, I.Y. Fung, <strong>and</strong> P.P. Tans, 1999: Increases in<br />
early season ecosystem uptake explain recent changes in the seasonal<br />
cycle of atmospheric CO 2 at high northern latitudes. Geophys. Res.<br />
Lett., 26, 2765-2768.<br />
Rayner, P.J., I.G. Enting, R.J. Francey, <strong>and</strong> R. Langenfelds, 1999a:<br />
Reconstructing the recent carbon cycle from atmospheric CO 2, δ 13 C<br />
<strong>and</strong> O 2/N 2 observations. Tellus, 51B, 213-232.<br />
Rayner, P.J., R.M. Law, <strong>and</strong> R. Dargaville, 1999b: <strong>The</strong> relationship<br />
between tropical CO 2 fluxes <strong>and</strong> the El Niño - Southern Oscillation.<br />
Geophys. Res. Lett., 26, 493-496.<br />
Redfield, A.C., B.H. Ketchum, <strong>and</strong> F.A. Richards, 1963: <strong>The</strong> influence of<br />
organisms on the composition of seawater. In: <strong>The</strong> Sea [Hill, M.N.<br />
(ed.)]. Wiley, New York, NY, pp. 26-77.<br />
Rickaby, R.E.M., <strong>and</strong> H. Elderfield, 1999: Planktonic foraminiferal<br />
Cd/Ca: Paleonutrients or paleotemperature? Paleoceanography, 14,<br />
293-303.<br />
Riebesell, U., D.A. Wolf-Gladrow, <strong>and</strong> V. Smetacek, 1993: <strong>Carbon</strong>dioxide<br />
limitation of marine-phytoplankton growth-rates. Nature,<br />
361, 249-251.<br />
Riebesell, U., I. Zondervan, B. Rost, P.D. Tortell, R.E. Zeebe, <strong>and</strong> F.M.<br />
Morel, 2000: Reduced calcification of marine phytoplankton in<br />
response to increased atmospheric CO 2. Nature, 407, 364-367.<br />
Robitaille, D.Y., <strong>and</strong> A.J. Weaver, 1995: Validation of sub-grid-scale<br />
mixing schemes using CFCs in a global ocean model. Geophys. Res.<br />
Lett., 22, 2917-2920.<br />
Ruimy, A., B. Saugier, <strong>and</strong> G. Dedieu, 1994: Methodology for the estimation<br />
of terrestrial net primary production from remotely sensed data.<br />
Journal of Geophysical Research-Atmosphere, 99, 5263-5283.<br />
Rundgren, M., <strong>and</strong> D. Beerling, 1999: A Holocene CO 2 record from the<br />
stomatal index of subfossil Salix herbacea L. leaves from northern<br />
Sweden. Holocene, 9, 509-513.<br />
Sabine, C.L., D.W.R. Wallace, <strong>and</strong> F.J. Millero, 1997: Survey of CO 2 in<br />
the Oceans reveals clues about global carbon cycle. EOS, Transaction<br />
of the American Geophysical Union, 78, 54-55.<br />
Sabine, C.L., R.M. Key, K.M. Johnson, F.J. Millero, A. Poisson, J.L.
<strong>The</strong> <strong>Carbon</strong> <strong>Cycle</strong> <strong>and</strong> <strong>Atmospheric</strong> <strong>Carbon</strong> <strong>Dioxide</strong><br />
Sarmiento, D.W.R. Wallace, <strong>and</strong> C.D. Winn, 1999: Anthropogenic<br />
CO 2 inventory of the Indian Ocean. Global Biogeochemical <strong>Cycle</strong>s,<br />
13, 179-198.<br />
Sampson, R.N. <strong>and</strong> R.J. Scholes, 2000: Additional Human-Induced<br />
Activities-Article 3.4. In: L<strong>and</strong> Use, L<strong>and</strong>-Use Change, <strong>and</strong> Forestry<br />
[Watson, R.T., I.R. Noble, B. Bolin, N.H. Ravindranath, D.J. Verardo<br />
<strong>and</strong> D.J. Dokken (eds.)]. Cambridge University Press, Cambridge,<br />
UK, pp. 181-282.<br />
Sanyal, A., N.G. Hemming, G.N. Hanson, <strong>and</strong> W.S. Broecker, 1995:<br />
Evidence for a higher pH in the glacial ocean from boron isotopes in<br />
foraminifera. Nature, 373, 234-236.<br />
Sarmiento, J.L., <strong>and</strong> J.R. Toggweiler, 1984: A new model for the role of<br />
the oceans in determining atmospheric pCO 2. Nature, 308, 621-624.<br />
SAR, see IPCC (1996a).<br />
Sarmiento, J.L., J.C. Orr, <strong>and</strong> U. Siegenthaler, 1992: A perturbation<br />
simulation of CO 2 uptake in an ocean general- circulation model.<br />
Journal of Geophysical Research-Oceans, 97, 3621-3645.<br />
Sarmiento, J.L., <strong>and</strong> E.T. Sundquist, 1992: Revised budget for the<br />
oceanic uptake of anthropogenic carbon- dioxide. Nature, 356, 589-<br />
593.<br />
Sarmiento, J.L., <strong>and</strong> C. Le Quéré, 1996: Oceanic carbon dioxide uptake<br />
in a model of century-scale global warming. Science, 274, 1346-1350.<br />
Sarmiento, J.L., T.M.C. Hughes, R.J. Stouffer, <strong>and</strong> S. Manabe, 1998:<br />
Simulated response of the ocean carbon cycle to anthropogenic<br />
climate warming. Nature, 393, 245-249.<br />
Sarmiento, J.L., P. Monfray, E. Maier-Reimer, O. Aumont, R. Murnane,<br />
<strong>and</strong> J. C. Orr, 2000: Sea-air CO 2 fluxes <strong>and</strong> carbon transport: a<br />
comparison of three ocean general circulation models. Global<br />
Biogeochemical <strong>Cycle</strong>s, 14(4), 1267-1281.<br />
Saugier, B., <strong>and</strong> J. Roy, 2001: Estimations of global terrestrial productivity:<br />
converging towards a single number? In: Global terrestrial<br />
productivity: past, present <strong>and</strong> future [Roy, J., B. Saugier <strong>and</strong> H.A.<br />
Mooney (eds.)]. Academic Press, (in press).<br />
Saxe, H., D.S. Ellsworth, <strong>and</strong> J. Heath, 1998: Tree <strong>and</strong> forest functioning<br />
in an enriched CO 2 atmosphere. New Phytologist, 139, 395-436.<br />
Schimel, J.P., <strong>and</strong> F.S. Chapin, 1996: Tundra plant uptake of amino acid<br />
<strong>and</strong> NH4 + nitrogen in situ: Plants compete well for amino acid N.<br />
Ecology, 77, 2142-2147.<br />
Schimel, D.S., B.H. Braswell, E.A. Holl<strong>and</strong>, R. McKeown, D.S. Ojima,<br />
T.H. Painter, W.J. Parton, <strong>and</strong> A.R. Townsend, 1994: Climatic,<br />
edaphic <strong>and</strong> biotic controls over carbon <strong>and</strong> turnover of carbon in<br />
soils. Global Biogeochemical <strong>Cycle</strong>s, 8, 279-293.<br />
Schimel, D., I.G. Enting, M. Heimann, T.M.L. Wigley, D. Raynaud, D.<br />
Alves, <strong>and</strong> U. Siegenthaler, 1995: CO 2 <strong>and</strong> the carbon cycle. In:<br />
Climate Change 1994: Radiative Forcing of Climate Change <strong>and</strong> an<br />
Evaluation of the IPCC IS92 Emission Scenarios [Houghton, J.T.,<br />
L.G. Meira Filho, J. Bruce, Hoesung Lee, B.A. Call<strong>and</strong>er, E. Haites,<br />
E. Harris, K. Maskell (eds.)]. Cambridge University Press,<br />
Cambridge, pp. 35-71.<br />
Schimel, D., D. Alves, I. Enting, M. Heimann, F. Joos, D. Raynaud, <strong>and</strong><br />
T. Wigley, 1996: CO 2 <strong>and</strong> the carbon cycle. In: Climate Change 1995:<br />
<strong>The</strong> Science of Climate Change: Contribution of WGI to the Second<br />
Assessment Report of the IPCC [Houghton, J.T., L.G. Meira Filho,<br />
B.A. Call<strong>and</strong>er, N. Harris, A. Kattenberg <strong>and</strong> K. Maskell (eds.)].<br />
Cambridge University Press, Cambridge, pp. 65-86.<br />
Schimel, D., M. Grubb, F. Joos, R. Kaufmann, R. Moss, W. Ogana, R.<br />
Richels, <strong>and</strong> T.M.L. Wigley, 1997: Stabilization of <strong>Atmospheric</strong><br />
Greenhouse Gases: Physical, Biological <strong>and</strong> Socio-economic<br />
Implications — IPCC Technical Paper 3 [Houghton, J.T.,, L.G. Meira<br />
Filho, D.J. Griggs <strong>and</strong> K. Maskell (eds)]. Intergovernmental Panel on<br />
Climate Change, Bracknell, UK , 53 pp.<br />
Schlamadinger, B. <strong>and</strong> T. Karjalainen, 2000: Afforestation,<br />
Reforestation, <strong>and</strong> Deforestation (ARD) Activites. In: L<strong>and</strong> Use,<br />
L<strong>and</strong>-Use Change, <strong>and</strong> Forestry [Watson, R.T., I.R. Noble, B. Bolin,<br />
N.H. Ravindranath, D.J. Verardo <strong>and</strong> D.J. Dokken (eds.)]. Cambridge<br />
235<br />
University Press, Cambridge, UK, pp. 127-181.<br />
Schlesinger, W.H., 1990: Evidence from chronosequence studies for a<br />
low carbon-storage potential of soils. Nature, 348, 233-234.<br />
Schlesinger, W.H., 2000: <strong>Carbon</strong> sequestration in soils. Science, 284,<br />
2095.<br />
Schlesinger, W.H. <strong>and</strong> J.M. Melack, 1981: Transport of organic-carbon in<br />
the worlds rivers. Tellus, 33, 172-187<br />
Schlesinger, W.H., <strong>and</strong> J.A. Andrews, 2000: Soil respiration <strong>and</strong> the<br />
global carbon cycle. Biogeochemistry, 48, 7-20.<br />
Schlitzer, R. 2000: Applying the adjoint method for biogeochemical<br />
modeling: export of particulate organic matter in the world ocean. In:<br />
Inverse methods in global biogeochemical cycles [Kasibhatla, P., M.<br />
Heimann, P. Rayner, N. Mahowald, R.G. Prinn, <strong>and</strong> D.E. Hartley<br />
(eds)], Geophysical Monograph Series, 114, 107-124.<br />
Scholes, R.J., <strong>and</strong> S.R. Archer, 1997: Tree-grass interactions in savannas.<br />
Annual Review of Ecology <strong>and</strong> Systematics, 28, 517-544.<br />
Scholes, M., <strong>and</strong> M.O. Andreae, 2000: Biogenic <strong>and</strong> pyrogenic emissions<br />
from Africa <strong>and</strong> their impact on the global atmosphere. Ambio, 29,<br />
23-29.<br />
Scholes, R.J., E.D. Schulze, L.F. Pitelka, <strong>and</strong> D.O. Hall, 1999:<br />
Biogeochemistry of terrestrial ecosystems. In: <strong>The</strong> terrestrial<br />
biosphere <strong>and</strong> global change [Walker B., Steffen W., Canadell J. <strong>and</strong><br />
Ingram J. (eds.)]. Cambridge University Press., Cambridge, pp. 271-<br />
303.<br />
Schulze, E.D., 2000: <strong>Carbon</strong> <strong>and</strong> Nitrogen Cycling in European Forest<br />
Ecosystems. Ecological Studies Vol. 142., Springer Verlag.<br />
Schulze, E.D., <strong>and</strong> M. Heimann, 1998: <strong>Carbon</strong> <strong>and</strong> water exchange of<br />
terrestrial ecosystems. In: Asian change in the context of global<br />
change [Galloway, J.N. <strong>and</strong> J. Melillo (eds.)]. Cambridge University<br />
Press, Cambridge.<br />
Schulze, E.D., W. Devries, <strong>and</strong> M. Hauhs, 1989: Critical loads for<br />
nitrogen deposition on forest ecosystems. Water Air <strong>and</strong> Soil<br />
Pollution, 48, 451-456.<br />
Schulze, E.D., J. Lloyd, F.M. Kelliher, C. Wirth, C. Rebmann, B. Luhker,<br />
M. Mund, A. Knohl, I.M. Milyukova, W. Schulze, W. Ziegler, A.B.<br />
Varlagin, A.F. Sogachev, R. Valentini, S. Dore, S. Grigoriev, O. Kolle,<br />
M.I. Panfyorov, N. Tchebakova, <strong>and</strong> N.N. Vygodskaya, 1999:<br />
Productivity of forests in the Eurosiberian boreal region <strong>and</strong> their<br />
potential to act as a carbon sink - a synthesis. Global Change Biology,<br />
5, 703-722.<br />
Semenov, S.M., I.M. Kounina, <strong>and</strong> B.A. Koukhta, 1998: An ecological<br />
analysis of anthropogenic changes in ground–level concentrations of<br />
O 3,SO 2, <strong>and</strong> CO 2 in Europe. Doklady Biological Sciences, 361, 344-<br />
347.<br />
Semenov, S.M., I.M. Kounina, <strong>and</strong> B.A. Koukhta, 1999: Tropospheric<br />
ozone <strong>and</strong> plant growth in Europe., Publishing Centre, ‘Meteorology<br />
<strong>and</strong> Hydrology’, Moscow, 208 pp.<br />
Shackleton, N.J., 1977: <strong>Carbon</strong>-13 in Uvigerina: Tropical rainforest<br />
history <strong>and</strong> the equatorial Pacific carbonate dissolution cycles. In: <strong>The</strong><br />
Fate of Fossil Fuel CO 2 in the Oceans [Anderson, N.R. <strong>and</strong> A.<br />
Malahoff (eds.)], 401-427.<br />
Shackleton, N.J., 2000: <strong>The</strong> 100,000-year ice-age cycle identified <strong>and</strong><br />
found to lag temperatrue, carb on dioxide, <strong>and</strong> orbital eccentricity.<br />
Science, 289, 1897-1902.<br />
Shaffer, G., 1993: Effects of the marine carbon biota on global carbon<br />
cycling. In: <strong>The</strong> Global <strong>Carbon</strong> <strong>Cycle</strong> [Heimann, M. (ed.)]. I 15,<br />
Springer Verlag, Berlin, pp. 431-455.<br />
Siegenthaler, U., 1990: Biogeochemical <strong>Cycle</strong>s - El-Niño <strong>and</strong><br />
<strong>Atmospheric</strong> CO 2. Nature, 345, 295-296.<br />
Siegenthaler, U. <strong>and</strong> H. Oeschger, 1978: Predicting future atmospheric<br />
carbon-dioxide levels. Science, 199, 388-395<br />
Siegenthaler, U., <strong>and</strong> T. Wenk, 1984: Rapid atmospheric CO 2 variations<br />
<strong>and</strong> ocean circulation. Nature, 308, 624-627.<br />
Siegenthaler, U. <strong>and</strong> F. Joos, 1992: Use of a simple-model for studying<br />
oceanic tracer distributions <strong>and</strong> the global carbon-cycle. Tellus Series
236 <strong>The</strong> <strong>Carbon</strong> <strong>Cycle</strong> <strong>and</strong> <strong>Atmospheric</strong> <strong>Carbon</strong> <strong>Dioxide</strong><br />
B-Chemical <strong>and</strong> Physical Meteorology, 44, 186-207.<br />
Siegenthaler, U., H. Friedli, H. Loetscher, E. Moor, A. Neftel, H.<br />
Oeschger <strong>and</strong> B. Stauffer, 1988: Stable-isotope ratios <strong>and</strong> concentration<br />
of CO 2 in air from polar ice cores. Annals of Glaciology, 10, 1-6.<br />
Sigman, D.M., D.C. McCorkle, <strong>and</strong> W.R. Martin, 1998: <strong>The</strong> calcite<br />
lysocline as a constraint on glacial/interglacial low-latitude production<br />
changes. Global Biogeochemical <strong>Cycle</strong>s, 12, 409-427.<br />
Sitch, S., 2000: <strong>The</strong> role of vegetation dynamics in the control of<br />
atmospheric CO 2 content. PhD thesis, University of Lund, Sweden,<br />
213 pp.<br />
Six, K.D., <strong>and</strong> E. Maier-Reimer, 1996: Effects of plankton dynamics on<br />
seasonal carbon fluxes in an ocean general circulation model. Global<br />
Biogeochemical <strong>Cycle</strong>s, 10, 559-583.<br />
Skole, D. <strong>and</strong> C. Tucker, 1993: Tropical deforestation <strong>and</strong> habitat<br />
fragmentation in the Amazon - satellite data from 1978 to 1988.<br />
Science, 260, 1905-1910.<br />
Smethie, W.M., T. Takahashi, <strong>and</strong> D.W. Chipman, 1985: Gas-exchange<br />
<strong>and</strong> CO 2 flux in the tropical atlantic-ocean determined from 222 Rn <strong>and</strong><br />
pCO 2 measurements. Journal of Geophysical Research-Oceans, 90,<br />
7005-7022.<br />
Smith, H.J., H. Fischer, M. Wahlen, D. Mastroianni, <strong>and</strong> B. Deck, 1999:<br />
Dual modes of the carbon cycle since the Last Glacial Maximum.<br />
Nature, 400, 248-250.<br />
Smith, S.V., <strong>and</strong> J.T. Hollibaugh, 1993: Coastal metabolism <strong>and</strong> the<br />
oceanic organic-carbon balance. Reviews of Geophysics, 31, 75-89.<br />
Sonnerup, R. E., Quay P. D., McNichol A. P., Bullister J. L., Westby T.<br />
A., <strong>and</strong> Anderson H. L., 1999: Reconstructing the oceanic C-13 Suess<br />
effect. Global Biogeochemical <strong>Cycle</strong>s, 13, 857-872<br />
Spiecker, H., K. Mielikäinen, M. Köhl, J.P. Skovsgaard, 1996: Growth<br />
trends in European forests. European Forest Institute Research Report<br />
No. 5, Springer Verlag, Berlin-Heidelberg.<br />
Stauffer, B., T. Blunier, A. Dällenbach, A. Indermühle, J. Schw<strong>and</strong>er, T.F.<br />
Stocker, J. Tschumi, J. Chappellaz, D. Raynaud, C.U. Hammer <strong>and</strong><br />
H.B. Clausen,1998: <strong>Atmospheric</strong> CO 2 concentration <strong>and</strong> millennialscale<br />
climate change during the last glacial period. Nature, 392, 59-<br />
62.<br />
Stephens, B.B., 1999: Field-based atmospheric oxygen measurements<br />
<strong>and</strong> the ocean carbon cycle. Unpublished Ph.D. thesis, Univ. of<br />
California, USA.<br />
Stephens, B.B., <strong>and</strong> R.F. Keeling, 2000: <strong>The</strong> influence of Antarctic sea<br />
ice on glacial-interglacial CO 2 variations. Nature, 404, 171-174.<br />
Stephens, B.B., R.F. Keeling, <strong>and</strong> M. Heimann, 1998: Testing global<br />
ocean carbon cycle models using measurements of atmospheric O 2<br />
<strong>and</strong> CO 2 concentration. Global Biogeochemical <strong>Cycle</strong>s, 12, 213-230.<br />
Street-Perrott, F.A., Y. Huang, R.A. Perrott, <strong>and</strong> G. Eglinton, 1998:<br />
<strong>Carbon</strong> isotopes in lake sediments <strong>and</strong> peats of last glacial age:<br />
implications for the global carbon cycle, In: Stable Isotopes [Griffiths<br />
H. (ed.)]. BIOS Scientific Publishers Ltd, pp. 381-396.<br />
Takahashi, T., J. Goddard, S. Sutherl<strong>and</strong>, D.W. Chipman, <strong>and</strong> C. C.<br />
Breeze, 1986: Seasonal <strong>and</strong> geographic variability of carbon dioxide<br />
sink/source in the ocean areas, Lamont Doherty Geol. Obs.,<br />
Palisades, New York, 66 pp.<br />
Takahashi, T., R. H. Wanninkhof, R. A. Feely, R. F. Weiss, D. W.<br />
Chipman, N. Bates, J. Olafson, C. Sabine, <strong>and</strong> S.C. Sutherl<strong>and</strong>, 1999:<br />
Net sea-air CO 2 flux over the global oceans: An improved estimate<br />
based on the sea-air pCO 2 difference. In: Proceedings of the 2nd<br />
International Symposium CO 2 in the Oceans, Center for Global<br />
Environmental Research, National Institute for Environmental<br />
Studies, Tsukuba, Japan, 9-15.<br />
Tans, P.P., <strong>and</strong> D.W.R. Wallace, 1999: <strong>Carbon</strong> cycle research after Kyoto.<br />
Tellus, 51B, 562-571.<br />
Tans, P.P., T.J. Conway, <strong>and</strong> T. Nakazawa, 1989: Latitudinal distribution<br />
of the sources <strong>and</strong> sinks of atmospheric carbon dioxide derived from<br />
surface observations <strong>and</strong> atmospheric transport model. Journal of<br />
Geophysical Research, 94, 5151-5172.<br />
Tans, P.P., I.Y. Fung, <strong>and</strong> T. Takahashi, 1990: Observational constraints on<br />
the global atmospheric CO 2 budget. Science, 247, 1431-1438.<br />
Tans, P.P., J.A. Berry, <strong>and</strong> R.F. Keeling, 1993: Oceanic 13 C/ 12 C observations<br />
- a new window on ocean CO 2 uptake. Global Biogeochemical<br />
<strong>Cycle</strong>s, 7, 353-368.<br />
Taylor, J. A., 1989. “A stochastic Lagrangian atmospheric transport<br />
model to determine global CO 2 sources <strong>and</strong> sinks: a preliminary<br />
discussion.” Tellus B, 41(3), 272-285.<br />
Taylor, J.A., <strong>and</strong> J. Lloyd, 1992: Sources <strong>and</strong> sinks of atmospheric CO 2.<br />
Australian Journal of Botany, 40, 407-418.<br />
Taylor, J.A., <strong>and</strong> J.C. Orr, 2000: <strong>The</strong> natural latitudinal distribution of<br />
atmospheric CO 2, Global <strong>and</strong> Planetary Change, 26, 375-386.<br />
Tegen, I., <strong>and</strong> I. Fung, 1995: Contribution to the atmospheric mineral<br />
aerosol load from l<strong>and</strong> surface modification. Journal of Geophysical<br />
Research, 100, 18707-18726.<br />
Thompson, M.L., I.G. Enting, G.I. Pearman, <strong>and</strong> P. Hyson, 1986.<br />
Interannual variation of atmospheric CO 2 concentration. Journal of<br />
<strong>Atmospheric</strong> Chemistry, 4, 125-155.<br />
Thompson, M.V., J.T. R<strong>and</strong>erson, C.M. Malmstrom, <strong>and</strong> C.B. Field,<br />
1996: Change in net primary production <strong>and</strong> heterotrophic respiration:<br />
How much is necessary to sustain the terrestrial carbon sink?<br />
Global Biogeochemical <strong>Cycle</strong>s, 10, 711-726.<br />
Tian, H.Q., J.M. Melillo, <strong>and</strong> D.W. Kicklighter, 1998: Effect of interannual<br />
climate variability on carbon storage in Amazonian ecosystems.<br />
Nature, 396, 664-667.<br />
Toggweiler, J.R., 1999: Variation of atmospheric CO 2 by ventilation of the<br />
ocean’s deepest water. Paleoceanography, 14, 571-588.<br />
Trolier, M., J.W.C. White, P.P. Tans, K.A. Masarie, <strong>and</strong> P.A. Gemery,<br />
1996: Monitoring the isotopic composition of atmospheric CO 2 -<br />
measurements from the NOAA Global Air Sampling Network.<br />
Journal of Geophysical Research - Atmosphere, 101, 25897-25916.<br />
Trudinger, C.M., I.G. Enting, R.J. Francey, D.M. Etheridge, <strong>and</strong> P.J.<br />
Rayner, 1999: Long-term variability in the global carbon cycle<br />
inferred from a high-precision CO 2 <strong>and</strong> delta 13 C ice-core record.<br />
Tellus, 51B, 233-248.<br />
Trumbore, S., 2000: Age of soil organic matter <strong>and</strong> soil respiration:<br />
radiocarbon constraints on belowground C dynamics. Ecological<br />
Applications, 10, 399-411.<br />
Tschumi, J., <strong>and</strong> B. Stauffer, 2000. Reconstructing past atmospheric CO 2<br />
concentrations based on ice-core analyses: open questions due to in<br />
situ production of CO 2 in ice. Journal of Glaciology, 46, 45-53.<br />
Tyrell, T., 1999: <strong>The</strong> relative influences of nitrogen <strong>and</strong> phosphorus on<br />
oceanic primary production. Nature, 400, 525-531.<br />
UNFCCC (United Nations Framework Convention on Climate Change),<br />
2000: Methodological Issue. L<strong>and</strong>-use, l<strong>and</strong>-use change <strong>and</strong> forestry.<br />
Synthesis report on national greenhouse gas information reported by<br />
Annex I Parties for the l<strong>and</strong>-use change <strong>and</strong> forestry sector <strong>and</strong><br />
agricultural soils category. Note by the Secretariat. Subsidiary Body<br />
for Scientific <strong>and</strong> Technological Advice. FCCC/SBSTA/2000/3.<br />
Bonn, Germany. 48pp.<br />
United Nations, 2000: <strong>The</strong> United Nations Energy Statistics Database,<br />
United Nations Statistical Division, New York.<br />
UN-ECE/FAO (United Nations Economics Commision for Europe/Food<br />
<strong>and</strong> Agriculture Organization of the United Nations), 2000: Forest<br />
Resources of Europe, CIS, North America, Australia, Japan <strong>and</strong> New<br />
Zeal<strong>and</strong> (industrialized temperate/boreal countries) UN-ECE/FAO<br />
Contribution to the Global Forest Resources Assessment 2000. In:<br />
Geneva Timber <strong>and</strong> Forest Study Papers, No. 17, United Nations,<br />
New York, Geneva, pp. 445.<br />
Valentini, R., G. Matteucci, A.J. Dolman, E.D. Schulze, C. Rebmann, E.J.<br />
Moors, A. Granier, P. Gross, N.O. Jensen, K. Pilegaard, A. Lindroth,<br />
A. Grelle, C. Bernhofer, T. Grunwald, M. Aubinet, R. Ceulemans,<br />
A.S. Kowalski, T. Vesala, U. Rannik, P. Berbigier, D. Loustau, J.<br />
Guomundsson, H. Thorgeirsson, A. Ibrom, K. Morgenstern, R.<br />
Clement, J. Moncrieff, L. Montagnani, S. Minerbi <strong>and</strong> P.G. Jarvis,
<strong>The</strong> <strong>Carbon</strong> <strong>Cycle</strong> <strong>and</strong> <strong>Atmospheric</strong> <strong>Carbon</strong> <strong>Dioxide</strong><br />
2000: Respiration as the main determinant of carbon balance in<br />
European forests. Nature, 404, 861-865.<br />
Van de Water, P.K., S.W. Leavitt <strong>and</strong> J.L. Betancourt, 1994: Trends in<br />
stomatal density <strong>and</strong> 13 C/ 12 C ratios of pinus- flexilis needles during<br />
last glacial-interglacial cycle. Science, 264, 239-243.<br />
Vitousek, P.M. <strong>and</strong> R.W. Howarth, 1991: Nitrogen limitation on l<strong>and</strong> <strong>and</strong><br />
in the sea - how can it occur. Biogeochemistry, 13, 87-115.<br />
Vitousek, P.M. <strong>and</strong> C.B. Field, 1999: Ecosystem constraints to symbiotic<br />
nitrogen fixers: a simple model <strong>and</strong> its implications. Biogeochemistry,<br />
46, 179-202.<br />
Vitousek, P.M., J.D. Aber, R.W. Howarth, G.E. Likens, P.A. Matson,<br />
D.W. Schindler, W.H. Schlesinger, D.G. Tilman, 1997: Human<br />
alteration of the global nitrogen cycle: sources <strong>and</strong> consequesnces.<br />
Ecological Applications, 7, 737-750.<br />
Voss, R., <strong>and</strong> U. Mikolajewicz, 1999: Long-term climate changes due to<br />
increased CO 2 concentration in the coupled atmosphere-ocean<br />
general circulation model ECHAM3/LSG. Technical Report # 298,<br />
Max-Planck-Institut für Meteorologie, Hamburg.<br />
Wagner, F., S.J.P. Bohncke, D.L. Dilcher, W.M. Kurschner, B. van Geel,<br />
<strong>and</strong> H. Visscher, 1999: Century-scale shifts in early Holocene<br />
atmospheric CO 2 concentration. Science, 284, 1971-1973.<br />
Wallace, D.W.R., 1995: Monitoring global ocean carbon inventories.<br />
Ocean observing system development panel background., Texas<br />
A&M University, College Station, TX, 54pp.<br />
W<strong>and</strong>, S.J.E., G.F. Midgley, M.H. Jones, <strong>and</strong> P.S. Curtis, 1999:<br />
Responses of wild C 4 <strong>and</strong> C 3 grass (Poaceae) species to elevated<br />
atmospheric CO 2 concentration: a meta-analytic test of current<br />
theories <strong>and</strong> perceptions. Global Change Biology, 5, 723-741.<br />
Wanninkhof, R., 1992: Relationship between wind-speed <strong>and</strong> gasexchange<br />
over the ocean. Journal of Geophysical Research-Oceans,<br />
97, 7373-7382.<br />
Wanninkhof, R., <strong>and</strong> W.R. McGillis, 1999: A cubic relationship between<br />
air-sea CO 2 exchange <strong>and</strong> wind speed. Geophys. Res. Lett., 26, 1889-<br />
1892.<br />
Waring, R.H., J.J. L<strong>and</strong>sberg, <strong>and</strong> M. Williams, 1998: Net primary<br />
production of forests: a constant fraction of gross primary production?<br />
Tree Physiology, 18, 129-134.<br />
Watson, A.J., <strong>and</strong> P.S. Liss, 1998: Marine biological controls on climate<br />
via the carbon <strong>and</strong> sulphur geochemical cycles. Philosophical<br />
Transactions of the Royal Society of London Series B-Biological<br />
Sciences, 353, 41-51.<br />
Watson, A.J., P.D. Nightingale, <strong>and</strong> D.J. Cooper, 1995: Modeling<br />
atmosphere ocean CO 2 transfer. Philosophical Transactions of the<br />
Royal Society of London Series B-Biological Sciences, 348, 125-132.<br />
WBGU, (Wissenschaftlicher Beirat der Bundesregierung Globale<br />
Umweltveränerungen) 1988. Die Anrechnung biolischer Quellen und<br />
Senken in Kyoto-Protokoll: Fortschritt oder Rückschlang für den<br />
globalen Umweltschutz Sondergutachten 1988. Bremerhaven,<br />
237<br />
Germany, 76pp, (available in English).<br />
Wigley, T.M.L., Richels, R., <strong>and</strong> Edmonds, J.A., 1996: Economic <strong>and</strong><br />
environmental choices in the stabilization of CO 2 concentrations:<br />
choosing the “right” emissions pathway. Nature, 379, 240-243.<br />
Wigley, T.M.L., A. K. Jain, F. Joos, B. S. Nyenzi, <strong>and</strong> P.R. Shukla, 1997:<br />
Implications of Proposed CO 2 Emissions Limitations. IPCC<br />
Technical Paper 4. [Houghton, J.T., L.G. Meira Filho, D.J. Griggs <strong>and</strong><br />
M. Noguer (eds)]. Intergovernmental Panel on Climate Change,<br />
Bracknell, UK, 41 pp.<br />
Williams, S.N., S.J. Schaefer, M.L. Calvache, <strong>and</strong> D. Lopez, 1992:<br />
Global carbon dioxide emission to the atmosphere by volcanoes.<br />
Geochimica et Cosmochimica Acta, 56, 1765-1770.<br />
Winguth, A.M.E., M. Heimann, K.D. Kurz, E. Maier-Reimer, U.<br />
Mikolajewicz, <strong>and</strong> J. Segschneider, 1994: El-Niño-Southern oscillation<br />
related fluctuations of the marine carbon cycle. Global<br />
Biogeochemical <strong>Cycle</strong>s, 8, 39-63.<br />
Winn, C.D., Y.H. Li, F.T. Mackenzie, <strong>and</strong> D.M. Karl, 1998: Rising<br />
surface ocean dissolved inorganic carbon at the Hawaii Ocean Timeseries<br />
site. Marine Chemistry, 60, 33-47.<br />
Wofsy, S.C., Goulden, M.L., Munger, J.W., Fan, S.M., Bakwin, P.S.,<br />
Daube, B.C., Bassow, S.L., Bazzaz, F.A., 1993: Net exchange of CO 2<br />
in a mid-latitude forest. Science, 260, 1314-1317.<br />
Wong, C.S., Y.H. Chan, J.S. Page, G.E. Smith, <strong>and</strong> R.D. Bellegay, 1993:<br />
Changes in equatorial CO 2 flux <strong>and</strong> new production estimated from<br />
CO 2 <strong>and</strong> nutrient levels in Pacific surface waters during the 1986/87<br />
El-Niño. Tellus Series B, 45, 64-79.<br />
Woodward, F.I., 1987: Stomatal Numbers Are Sensitive to Increases in<br />
CO 2 From Preindustrial Levels. Nature, 327, 617-618.<br />
Woodward, F.I., <strong>and</strong> F.A. Bazzaz, 1988: <strong>The</strong> Responses of Stomatal<br />
Density to CO 2 Partial-Pressure. Journal of Experimental Botany, 39,<br />
1771-1781.<br />
Woodward, F.I., M.R. Lomas, <strong>and</strong> R.A. Betts, 1998: Vegetation-climate<br />
feedbacks in a greenhouse world. Philosophical Transactions of the<br />
Royal Society of London B, 353, 29-38.<br />
Wu, J., W. Sunda, E.A. Boyle <strong>and</strong> D.M. Karl, 2000: Phosphate depletion<br />
in the western North Atlantic Ocean. Science, 289, 759-762.<br />
Yang, X. <strong>and</strong> M.X. Wang, 2000: Monsoon ecosystems control on<br />
atmospheric CO 2 interannual variability: inferred from a significant<br />
positive correlation between year-to-year changes in l<strong>and</strong> precipitation<br />
<strong>and</strong> atmospheric CO 2 growth rate. Geophys. Res. Lett., 27, 1671-<br />
1674<br />
Yamanaka, Y., <strong>and</strong> E. Tajika, 1996: <strong>The</strong> role of the vertical fluxes of<br />
particulate organic matter <strong>and</strong> calcite in the oceanic carbon cycle:<br />
Studies using an ocean biogeochemical general circulation model.<br />
Global Biogeochemical <strong>Cycle</strong>s, 10, 361-382<br />
Zeng, X.B., 1999: <strong>The</strong> relationship among precipitation, cloud-top<br />
temperature, <strong>and</strong> precipitable water over the tropics. Journal of<br />
Climate, 12, 2503-2514.